Article

Development and Application of EST-SSR Markers for DNA Fingerprinting and Genetic Diversity Analysis of the Main Cultivars of Black Locust (Robinia pseudoacacia L.) in China

1
Beijing Advanced Innovation Center for Tree Breeding by Molecular Design, National Engineering Laboratory for Tree Breeding, Robinia pseudoacacia Engineering Technology Research Center of National Forestry and Grassland Administration, College of Biological Sciences and Technology, Beijing Forestry University, Beijing 100083, China
2
Shandong Provincial Key Laboratory of Forest Tree Genetic Improvement, Shandong Academy of Forestry, Ji’nan 250014, China
3
He’nan Provincial Key Laboratory of Forest Tree Germplasm Conservation and Breeding, He’nan Academy of Forestry, Zhengzhou 450008, China
4
State-owned Lvcun Forestry Station in Luoning County, Luoyang 471700, China
*
Author to whom correspondence should be addressed.
Forests 2019, 10(8), 644; https://doi.org/10.3390/f10080644
Submission received: 5 July 2019 / Revised: 24 July 2019 / Accepted: 29 July 2019 / Published: 30 July 2019
(This article belongs to the Section Forest Ecophysiology and Biology)

Abstract

:
Black locust (Robinia pseudoacacia L.) is an economically and ecologically important tree species which is used for pillar construction, honey production and soil improvement. More EST-SSR (Expressed sequence tag simple sequence repeat) markers of black locust can be used as a complement and improvement of Genomic-SSR markers for the identification of the function of gene and the construction of genetic map. Additionally, currently there is no simple method for identifying black locust cultivars. In this study, we obtained 2702 unigenes from 3095 expressed sequence tags (ESTs) from the National Center of Biotechnology Information (NCBI) database to identify simple sequence repeats (SSRs) in R. pseudoacacia samples. A total of 170 SSR loci were found to be distributed in 162 non-redundant sequences with a frequency of 6.29%. Dinucleotide repeats were the most predominant types among microsatellites (62.35%), followed by tri-nucleotide repeats (25.88%); the remaining SSRs accounted for less than 12%. The repeat motifs AG/TC (29.25%) and CT/GA (29.25%) were the most abundant among dinucleotides, and AAT/TTA (15.91%) was the most common among tri-nucleotides. A total of 62 primer pairs were designed to screen polymorphic and stable SSR loci. The resulting 25 EST-SSR markers capable of amplifying polymorphic, stable, and repeatable products. Eight newly developed EST-SSR markers and four published SSR markers were selected for DNA fingerprinting and genetic diversity analysis of the 123 main R. pseudoacacia cultivars in China. The 12 SSR loci amplified 102 alleles, with an average number of alleles per locus of 8.5 (range 4–15). The average polymorphism information content at the 12 SSR loci for the 123 cultivars was 0.670 (range 0.427–0.881). The 123 cultivars clustered into six main groups based on similarity coefficients, with most cultivars in one subgroup. Fingerprinting was performed using eight SSR markers; 110 black locust cultivars were distinguished. The results of this study increase the availability of EST-SSR markers in black locust and make it a simple method for checking the collection, the certification, and the correct attribution of clones and cultivars.

1. Introduction

Black locust (Robinia pseudoacacia L.) is an economically and ecologically important tree species which is used for pillar construction, honey production and soil improvement. This species was widely introduced to Europe and other regions worldwide for its various advantageous characteristics such as rapid growth, resilience, and adaptability [1,2]. It was introduced to China in 1877 and has since become an important tree species that has been planted widely in semi-arid and arid regions [3]. In the 1970s, research began on black locust cloning and cultivation. Since then, more than 100 superior clones and cultivars have been developed in China. The selected germplasm is widely used in different Chinese regions where the clones and cultivars are often indicated with local names, different from the official registered ones.
DNA fingerprinting, a technique based on molecular markers, is a powerful tool for the identification of cultivars, strains, and clones, as well as genetic correlations between parents and offspring [4]. Mao et al. (2017) [5] constructed SSR fingerprints for 47 black locust cultivars originated from Shandong Province of China. Simple sequence repeats (SSRs), also known as microsatellites or short tandem repeats, show codominant inheritance with high polymorphism, good stability, abundant quantity, and good coverage of the genome, making them ideal molecular markers for constructing fingerprints [6,7,8]. SSR molecular markers also play a large role in the construction of genetic linkage maps, genetic diversity analyses, gene mapping, marker-assisted selection, and many other related research fields [9,10,11].
SSRs exist in the genomes of all eukaryotes [12]. Early research in this field focused on identifying clones containing the SSR structure within genomic libraries to develop SSR markers. Specific primers were later designed for polymerase chain reaction (PCR) amplification using conservative SSR flanking sequences, and led to the development of genomic SSR markers [13]. With the rapid development of functional genomics, the number of express sequence tag (EST) sequences has increased rapidly for many species. Recent studies have sought to develop EST-SSR markers from EST sequences. Since EST-SSRs come from DNA transcribed region, it is a direct reflection of internal variation, and may be closely linked to functional genes. For example, the number of (CT) n repeats in the 5′ untranslated region of the rice Waxy gene is related to starch content [14]. Now EST-SSRs have been widely used to construct linkage maps associated with specific functions. For black locust, Lian et al. (2002, 2004) [15,16] and Mishima et al. (2009) [17] have developed a total of 21 SSR markers. In addition, Wang et al. (2015) [18] and Guo et al. (2017) [19] have conduct a preliminary research on SSR loci in the EST sequences and a novel set of EST-SSR markers have been developed. However, compared with other species, the relatively limited number of efficient EST-SSR markers for black locust greatly obstructs its application to breeding research. [19] More EST-SSR markers of black locust can be used as a complement and improvement of Genomic-SSR markers for the identification of the function of gene and the construction of genetic map.
In this study, we identified SSR loci from EST sequences obtained from public databases, determined their distribution patterns, and developed 25 polymorphic, repeatable, and stable EST-SSR markers. We then used eight newly developed EST-SSR markers and four published SSR markers for DNA fingerprinting and genetic diversity analyses of 123 black locust cultivars through fluorescence sequencing and SSR detection technology. The obtained data increase the availability of EST-SSR markers in black locust which can be employed to study the genetic variability of the species and for QTL (Quantitative trait locus) mapping analysis. Moreover, SSR fingerprinting will be a simple method for checking the collection, the certification, and the correct attribution of clones and cultivars.

2. Materials and Methods

2.1. Plant Materials and DNA Extraction

We analyzed the 123 main black locust cultivars (Table 1) grown on the Daqingshan Forest Farm, Shandong Province (35°23′22″ N, 118°12′17″ E), the Xinzheng Forest Farm of the Henan Academy of Forestry (34°35′8″ N, 113°49′53″ E), and the Kaifeng Academy of Agricultural and Forestry Sciences of Henan (34°46′8″ N, 114°15′55″ E). All the 123 cultivars are clones from nature. These experimental farms, neither private nor protected, are belonging to Shandong Academy of Forestry and Henan Academy of Forestry and exist for the purpose of the preservation and reproduction of the research materials. Since the authors are members of above Institutions, no specific permissions were required for sample collection. Black locust is not a controlled plant in China; our field studies involved no endangered or protected species. The authors maintain ownership and usufruct of the 123 main cultivars.
Total DNA was extracted from mature black locust leaves using a Plant Extraction DNA Kit (TIANGEN, Beijing, China). The quality and concentration of the extracted DNA were determined using 1% agarose gel electrophoresis.

2.2. SSR Locus Search and Primer Design

We pretreated 3095 EST sequences downloaded from the National Center for Biotechnology Information (NCBI) database (https://www.ncbi.nlm.nih.gov/) with an EST-trimming software (http://pgrc.ipk-gatersleben.de) to remove the vector sequence poly T or poly A and EST sequences <100 bp in length. The CAP3 software [20] was used to cluster and splice the sequences. All EST sequences were searched for SSR loci using the SSRIT software (http://www.gramene.org/db/searches/ssrtool). The search criteria were di-, tri-, tetra-, penta-, and hexa-nucleotide repeats with minimum numbers of repeats of 6, 5, 4, 4, and 4, respectively.
Primer design and evaluation were performed using the Primer 5 (PREMIER Biosoft International, Palo Alto, CA, USA) [21] and Oligo 6.0 (Molecular Biology Insights, Cascade, CO, USA) software, with the following primer design parameter standards: expected PCR amplification product size of 100–500 bp; primer length of 18–25 bp; annealing temperature of 55–63 °C; and GC (guanine-cytosine) content of 40–60%. Following alignment with the genomic database, primers affected by introns were removed. Secondary structure within each primer and primer–dimer formation between the 3’ ends of the two primers were avoided. Three G or C bases were not permitted to be arranged in a string formation at the 3’ end of the primer. The final base of the 3’ end was preferably T, C, or G instead of A. The ΔG value was lower at the 3’ end of the primer sequence, and higher at the 5′ end and in the middle.

2.3. Polymorphism Analysis of EST-SSR Markers

Eight of the 123 black locust cultivars were selected for PCR amplification using an ABI9700 Thermal Cycler (Applied Biosystems, Carlsbad, CA, USA) in a 20-μL reaction mixture containing 30 ng genomic DNA, 2 μL 10 × buffer, 0.5 mmol L−1 Mg2+, 0.15 mmol L−1 dNTPs, 0.5 μmol L−1 of each primer pair, and 1 unit Taq DNA polymerase. The amplification reaction was performed in the following steps (Touchdown PCR [22]): initial denaturation at 94 °C for 5 min, followed by 10 cycles of 94 °C for 30 s, 63–53 °C for 30 s (decreasing by 1 °C per cycle), 72 °C for 90 s, and then 20 cycles at 94 °C for 30 s, 53 °C for 30 s, 72 °C for 90 s, and a final 10-min extension at 72 °C [23]. The PCR products were separated by electrophoresis in 8% non-denaturing polyacrylamide gel. After that, the PCR fragments were detected by silver staining.

2.4. SSR Analysis of the Main Black Locust Cultivars

Eight polymorphic and stable screened EST-SSR markers and four published SSR markers [15,16,17] were used for paternity analysis. The forward primer of each pair was labeled with a fluorescent dye (FAM, HEX, or TAM) (Beijing Rui Biotech Co., Ltd., Beijing, China) during synthesis. The PCR amplification conditions were consistent with those described above. PCR products were separated by capillary electrophoresis using an ABI3100 DNA analyzer (Applied Biosystems, Carlsbad, CA, USA), and amplicon fragments were sized using the GeneMarker 1.8.0 software (SoftGenetics, State College, PA, USA).

2.5. Data Analyses

Levels of genetic diversity were calculated using the GenAlEx version 6 software (http://www.anu.edu.au/BoZo/GenAlEx/) [24], including the observed number of alleles (Na), effective number of alleles (Ne), Shannon’s information index (I), observed heterozygosity (Ho), and expected heterozygosity (He). Polymorphism information content (PIC) was calculated using the PIC_CALC version 0.6 (http://w3.georgikon.hu/pic/english/default.aspx) [25]. An unweighted pair group method with an arithmetic mean (UPGMA) tree was generated using the NTSYS (Numerical taxonomy and multivariate analysis system) pc 2.1 software (Applied Biostatistics Inc., New York, NY, USA) [26], based on pairwise genetic distances among individuals. SM coefficient was used to calculate the genetic similarity.

3. Results

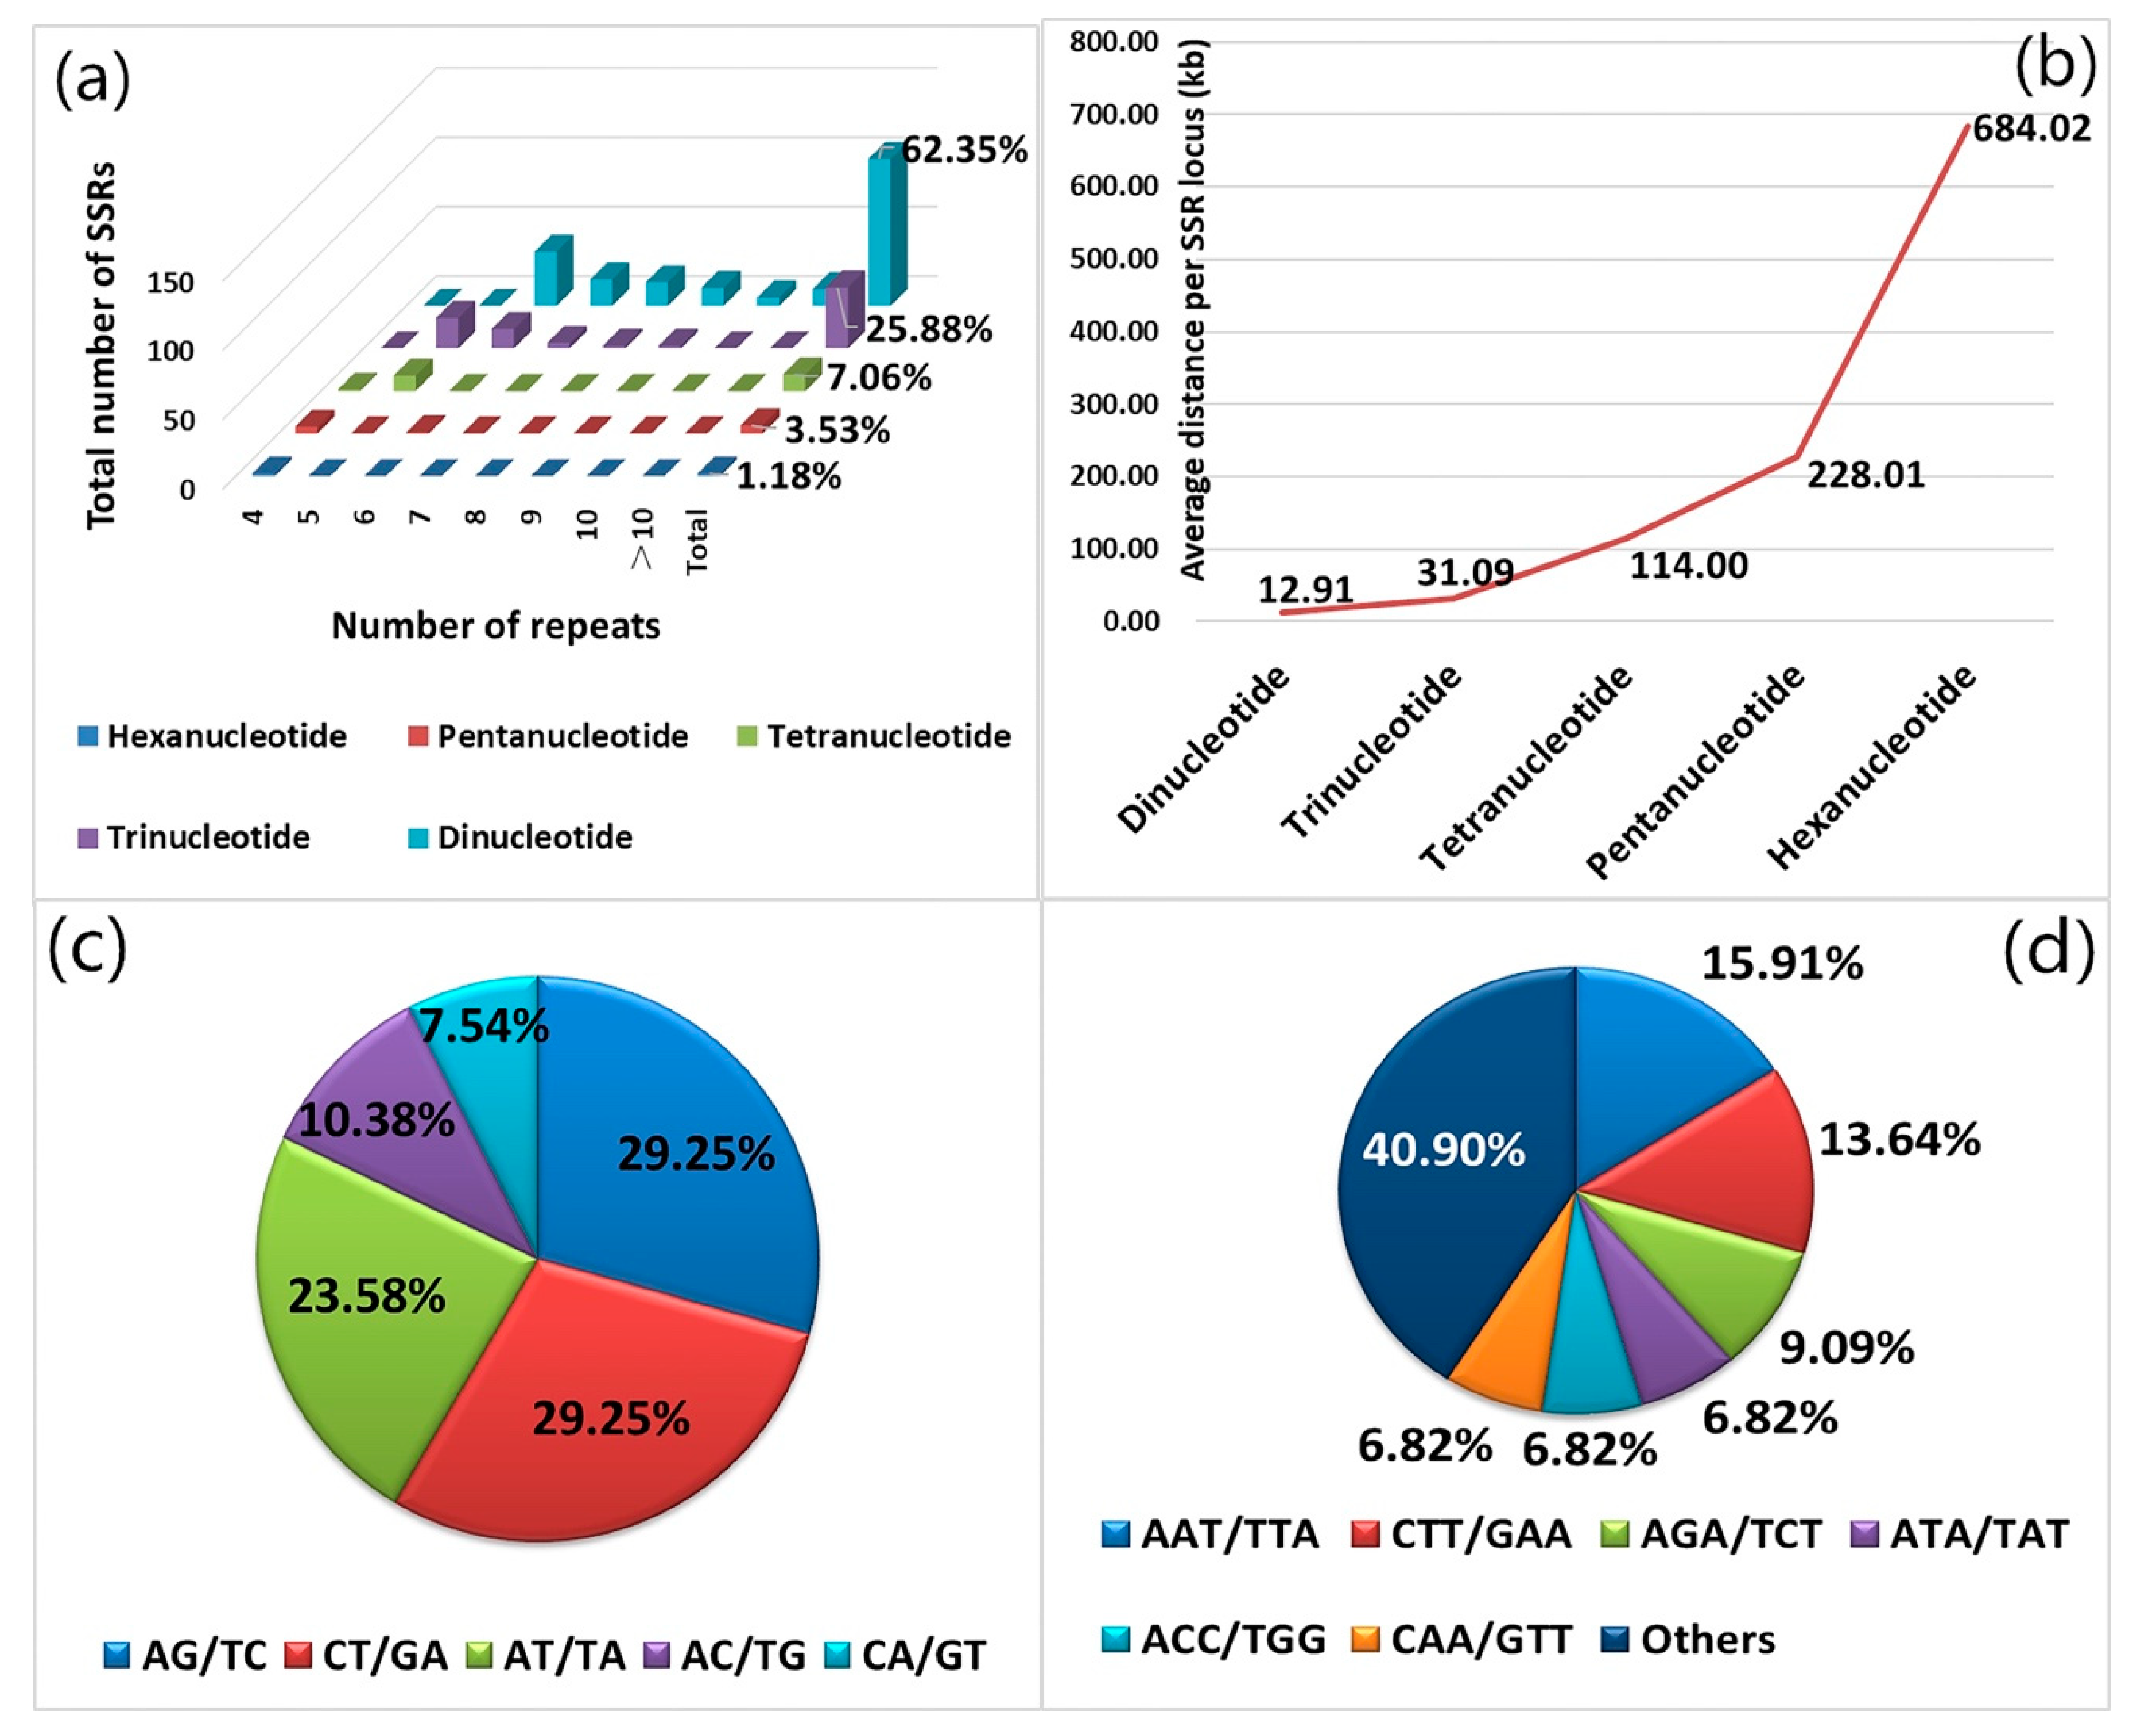
3.1. Distribution Characteristics of SSR Loci in Black Locust EST Sequences

Following the assembly and splicing of 3095 black locust EST sequences downloaded from the NCBI database, a total of 2702 non-redundant unigenes were obtained, of which 180 were contigs and 2522 were singletons. The total length of the EST sequences was 1,368,008 bp, with an average length of 506.31 bp. We used the online SSRIT search engine to identify 2702 non-redundant sequences. A total of 170 SSR loci were found to be distributed within 162 non-redundant sequences, at a frequency of 6.29%. Among these, 154 non-redundant sequences contained only one SSR locus, and eight non-redundant sequences contained two or more SSR loci. The SSR frequency was 6.29%, with an average of one SSR locus found every 8.05 kb. Among the 170 SSR loci found, di-, tri-, tetra-, penta-, and hexa-nucleotide repeat types were all observed. Dinucleotide repeats had the highest frequency among repeat types, which occurred 106 times, accounting for 62.35% of the total number of SSR loci. (Figure 1a) This was followed by tri-nucleotide repeats (44), accounting for 25.88%. (Figure 1a) The numbers of tetra-, penta-, and hexa-nucleotide repeats were relatively low (12, 6, and 2, respectively), accounting for 11.77% of the total number of SSR loci. (Figure 1a) The average distance per SSR locus of di-, tri-, tetra-, penta-, and hexa-nucleotides was 12.91kb, 31.09kb, 114.00kb, 228.01kb and 684.02kb, respectively. (Figure 1b) The frequency of each SSR motif type was also detected. Of the dinucleotide motifs, AG/TC (29.25%) and CT/GA (29.25%) were the most common types, followed by AT/TA (23.58%), AC/TG (10.38%), and CA/GT (7.54%). (Figure 1c) CG/GC was not found. The tri-nucleotide repeat motif consisted of 20 types, of which the uppermost motifs AAT/TTA and CTT/GAA accounted for 15.91 and 13.64%, respectively. (Figure 1d) Among the 170 SSR loci, the number of repeats for each SSR motif ranged from 4 to 18, and 158 of the SSR loci with 4–10 repeats, accounting for 92.9% of the total number of SSR loci. There were 12 SSR loci with 11–18 repeats, accounting for 7.1%, and the maximum numbers of repeats of di-, tri-, tetra-, penta-, and hexa-nucleotides were 18, 9, 5, 6 and 4, respectively.

3.2. Development of EST-SSR Markers

We designed and synthesized 62 pairs of primers based on EST-SSR sequences using Primer 5 and Oligo 6.0, including di-, tri-, tetra-, and penta-nucleotide repeats. Eight black locust cultivars were selected to analyze amplification ability and polymorphism. The results showed that 47 of 62 primer pairs were able to amplify the specific band corresponding to the expected product fragment size, with an amplification efficiency of 75.8%. The amplification fragments of five pairs of primers did not match the expected product fragment size, and the remaining ten primer pairs did not yield amplification products. Amplification results for selected primers of Rply1, Rply2 and Rply21 are shown in Figure 2. Among the 47 pairs of primers capable of amplifying specific bands, the amplification products of 25 pairs were polymorphic, repeatable, and stable, accounting for 40.3% of the total designed primers. No polymorphism was observed among the amplification products of the other 12 primer pairs. Although the amplification products of the remaining 10 primer pairs were also polymorphic, and the expected product fragments of the amplified products were consistent in size, there a greater degree of non-specific amplification with poor repeatability and stability. For the 25 polymorphic, repeatable, and stable EST-SSR loci (Table 2), a total of 85 alleles were detected in eight black locust cultivars, each with three to seven alleles. The highest number of alleles was detected in the locus Rply3. Among most loci, the number of detected alleles was two or three, with an average of 3.4 alleles detected per EST-SSR locus.

3.3. Genetic Diversity Analysis of the 123 Main Black Locust Cultivars in China

Eight newly developed EST-SSR markers (Rply2, Rply3, Rply5, Rply8, Rply15, Rply27, Rply49, and Rply60) and four published SSR markers (Table 3) [16,17] were used for genetic diversity analysis of the 123 main black locust cultivars in China. Among the 12 SSR loci, 102 alleles were detected, with an average of 8.5 (range 4–15) alleles per locus (Figure 3 and Table 4). Rply8 had the most alleles (Na = 15), whereas Rply2, Rply27, and Rply60 had the fewest (Na = 4). The range of Ne was 1.744–8.395, with an average of 4.390. Ho for the total sample was 0.651, which was lower than the mean He (0.712) for all 12 SSR loci. The mean I was 1.589 (range 0.782–2.307). PIC ranged from 0.427 to 0.881, with an average of 0.670. Among the primers, only Rply60 had a PIC < 0.25, indicating low polymorphism. The PIC of the other primers was >0.5, indicating that they were highly polymorphic. Using the parameters calculated by 12 SSR markers, we evaluated the level of genetic diversity of the 123 cultivars. The results indicated that the 123 main cultivars of black locust in China had high genetic diversity and variability.

3.4. Construction of SSR Fingerprints

Using the 12 SSR markers, we examined the 123 main Chinese black locust cultivars and accurately determined the fragment sizes of alleles at different loci. For example, fragments amplified with Rply3 primers were 148/156 bp, 148/164 bp and 142/164 bp for the Chinese black locust ‘Shilin’, ‘Minquan’ and ‘Xiaoye’, respectively. (Figure 4) To simplify this operation, we used four pairs of EST-SSR (Rply3, Rply5, Rply8, and Rply49) and SSR (Rops08, Rp109, Rp200, and Rp206) primers to construct black locust fingerprints. The eight pairs of fluorescent-labeled primers distinguished 110 black locust cultivars. The remaining 13 cultivars formed five groups with identical fingerprints: (1) ‘Lei 03’ and ‘Lei 05’; (2) ‘Yu 8001’ and ‘Yu 8004’; (3) ‘Yu 8032’ and ‘Yu 8038’; (4) ‘Yu 8044,’ ‘Yu 8048,’ and ‘Yu 8402’; (5) ‘No.4,’ ‘K 1,’ ‘K 2,’ and ‘K 3’. In total, 243 genotypes were detected, with an average of 20.25 (range 9–41) genotypes per primer pair. Rp200 had the most genotypes (n = 41) and Rply2 the fewest (n = 9). In addition, nine gene loci and 63 genotypes detected were unique. Multilocus genotype obtained with eight primer pairs differed for each cultivar. Therefore, each black locust cultivar can be identified by its unique multilocus genotype. Additionally, when all the 12 SSR markers were used, the remaining 13 cultivars cannot be distinguished either. Therefore, it is efficient to construct fingerprints with eight SSR markers in our research. Using only the eight primer pairs, we were able to distinguish 110 Chinese black locust cultivars (Supplementary Table S1).

3.5. Similarity Coefficient and Clustering Analysis

An UPGMA tree was constructed based on the calculated similarity coefficient using NTSYS (Numerical taxonomy and multivariate analysis system) pc 2.1 [26] (Supplementary Figure S1). Genetic similarity was computed with SM coefficient. This analysis showed that the 123 main black locust cultivars in China clustered into six main groups when the similarity coefficient was 0.74. The first group was the largest (83.7% of all cultivars) and was divided into two subgroups, the first containing 11 cultivars (‘Lei 1,’ ‘Mei 1,’ ‘Xing 1,’ ‘Xing 20,’ ‘Xing 32,’ ‘Yu 8043,’ ‘V-23,’ ‘10,’ ‘13,’ ‘14,’ and ‘ZYDL’) and the second containing 103 cultivars. The second group contained only three cultivars (‘Yu 8027,’ ‘Yu 8054,’ and ‘80′). The third (‘Lei 02,’ ‘7,’ ‘Xinzheng 3,’ and ‘V-31′), fourth (‘A,’ ‘Beilin,’ ‘YQ 13,’ ‘HY 101′), fifth (‘X 8,’ ‘X Daye,’ ‘Jiangan 1,’ and ‘Danye’), and sixth (‘II-7,’ ‘X 3,’ ‘Changye,’ and ‘Xiongyali’) groups each contained four cultivars.

4. Discussion

4.1. Frequency and Characteristics of SSRs in Black Locust EST Sequences

In this study, 2702 unigenes were obtained after assembling and splicing 3095 EST sequences. A total of 170 SSR loci were found, distributed in 162 unigenes, with a frequency of 6.29%. The frequency was higher than those of Pinus taeda L. (1.2%), Pinus pinaster Ait. (2.1%), and Larix kaempferi (Lamb.) Carr. (3.85%) [27], but lower than the frequency of Cunninghamia lanceolata (Lamb.) Hook. (8.36%), Taiwania cryptomerioides Hayata. (7.03%) [28], and Betula platyphylla Suk. (12.05%) [29]. SSR locus frequency is mainly affected by the following aspects. First, there are differences in SSR locus frequency among species due to species specificity. Second, the number of EST sequences and splicing affect search results; great numbers of spliced EST sequences provide more realistic SSR locus information for a species [30]. If the number of EST sequences is too small, the search results will be biased. The results can be duplicated if splicing is not performed. Different search criteria can also seriously affect the frequency of a SSR locus [31]. These criteria should be set according to species-specific characteristics, although there are some common SSR locus search criteria. For example, Nicot et al. (2004) [31] set a minimum search length of 12 bp for repeat motifs in wheat EST research. Both Kantety et al. (2002) [32] and Bérubé et al. (2007) [33] set the lengths of di- and tri-nucleotide repeat motifs to 18 bp. Zhang et al. (2009) [34] and Wang et al. (2008) [29] set the number of repetitions of nucleotide repeat motifs to five. In our study, we set the minimum number of repetitions of di-, tri-, tetra-, and penta-nucleotide repeat motifs to 6, 5, 4, 4, and 4, respectively; our results indicate that SSR loci of di-, tri-, and penta-nucleotides with a minimum number of repetitions were screened polymorphic primers capable of stable amplification. Therefore, our search criteria were reasonable. A possible reason for the high frequency of SSR loci in black locust EST sequences is that we set the minimum length of repeat motifs to be relatively small.
In our research, dinucleotide repeats were the most abundant repeat motif type in black locust, accounting for 63.53% of the total number of SSR loci. (Figure 1a) The result contrasts with many cereal crops such as Triticum aestivum L. [35] and Oryza sativa L. [36]. The repeat motif types in most species are mainly di- and tri-nucleotides; however, there are some differences between the most abundant types. EST sequences are mostly composed of exon regions, and codons are functional units composed of three nucleotides. Therefore, changes in the number of tri-nucleotides have a relatively small effect on gene expression [37]. Theoretically, tri-nucleotide repeats should be the most abundant repeat motif type in EST sequences. However, studies have shown that dinucleotide repeats are the most predominant repeat motif type in many plants, especially in dicots such as Arabidopsis, peanut, soybean, bean and grape [38]. The result contrasts with both Wang et al. (2015) [18] and Guo et al. (2017) [19]. They identified that tri-nucleotide repeats were the most abundant repeat motif type in black locust. This phenomenon also occurs in Arabidopsis [11,38]. The difference in the number of EST sequences and the mining tools and criteria used may be the cause of different results on the same species. [38] Many studies have shown that AG/TC is the most frequent dinucleotide repeating motif, as observed in Oryza sativa L. [32] and Hordeum vulgare L. [39]. Our results were consistent with these findings, and the repeat motif AG/TC accounted for 19.41% of the total number of SSR loci. (Figure 1c) TC and CTT repeats are commonly found in transcribed regions in plants. Additionally, they occur at high frequencies in 5′ UTRs. TC microsatellites in 5′ UTRs may be involved in antisense transcription and play a role in gene regulation. [40,41] This may be the reason AG/TC is the most frequent dinucleotide repeating motif type in many plants [32]. In addition, the frequency of GC/CG repeat motifs in dinucleotides is relatively low in most plants [32,38,40]. As has been observed for some plant species, we have not observed GC/CG repeat motifs for the black locusts examined in this study.

4.2. Validation of EST-SSR Loci

In this study, Primer 5 and Oligo 6.0 were used to design primers for 170 SSR loci. A total of 62 primer pairs were designed and synthesized, and eight black locust cultivars were selected for polymorphism screening. As a result, 47 pairs of primers amplified specific bands corresponding to the sizes of expected product fragments, with an amplification efficiency of 75.8%. However, the amplified fragments of five pairs of primers did not match the expected product fragment size, and ten pairs of primers yielded no amplification products. Related studies have found amplification efficiencies of 60–90% for the designed primers [42]. Therefore, the results of our study were within the expected range.

4.3. SSR Fingerprints and Cluster Analysis of Black Locust

In China, there is no simple method for identifying black locust cultivars, slowing the process of protecting cultivars, and negatively affecting their development, promotion, and application. Distinctness, uniformity, and stability (DUS) are the necessary characteristics for new plant cultivars. Xun et al. (2013) [43] published DUS testing guidelines for new black locust cultivars based mainly on external morphology and traits. These guidelines were relatively limited, suited only for cultivars with markedly different traits, and limited by the long period required to identify cultivars, high cost, land occupation, and low accuracy. Liu and Huang (2009) [44] analyzed genetic relationships among Robinia species using randomly amplified polymorphic DNA (RAPD) molecular marker technology, and Wang et al. (2012) [45] used amplified fragment length polymorphism (AFLP) technology to analyze the genetic relationships and genetic diversity of 50 black locust clones in Shandong Province, China. However, the reproducibility of RAPD technology is poor and its reliability is low [46], and AFLP technology is highly technical, which limits its application to the construction of fingerprints. Liesebach and Ewald (2012) [47] optimized a multiplex PCR assay of nuclear microsatellite markers for population genetics and clone identification in black locust. In addition, Mao et al. (2017) [5] constructed SSR fingerprints which can be used for distinguishing clones for 47 black locust cultivars. However, all these cultivars originated from Shandong Province. Most of the main cultivars planted in China were not included. In the current study, we used four pairs each of EST-SSR (Rply3, Rply5, Rply8, and Rply49) and SSR (Rops08, Rp109, Rp200, and Rp206) primers to establish black locust fingerprints. As a result, 110 cultivars of Chinese black locust were distinguished (Supplementary Table S1). We conjecture that the remaining 13 cultivars (six groups) that could not be distinguished had a high degree of homology within each group or that the plants were mistakenly divided into different cultivars due to differences in external morphology caused by the environment. We aim to explore these questions in the future.
Most cultivars from the same or similar sources clustered together (Supplementary Figure S1). However, some cultivars from the same source clustered in different groups, indicating that clustering and geographic location were not perfectly correlated among these Chinese black locust cultivars, and that black locust clones did not show obvious geographic variation. Because black locust is an introduced species, its breeding is influenced by humans.
The variation of the cultivars is closely related to their authenticity, but also to the ability to discriminate differences among cultivars. SSR molecular markers can identify cultivars with higher reliability, with greater objectivity and accuracy. The results of this research provide a basis for collecting, identifying, and evaluating the germplasm resources of black locust and may be of great significance to black locust breeding research.

5. Conclusions

The frequency of SSR loci in ESTs of black locust (Robinia pseudoacacia L.) was 6.29% and dinucleotide repeats were the most abundant repeat motif type with a frequency of 63.53%. 25 pairs of polymorphic, repeatable and stable primers which can be used in related research were screened out. The 123 main cultivars of black locust in China had high genetic diversity and variability. Fingerprints of 123 Chinese main cultivars of black locust were constructed with eight pairs of fluorescent-labeled primers and 110 cultivars were distinguished. Clustering and geographic location were not perfectly correlated among the 123 Chinese black locust cultivars, and black locust clones did not show obvious geographic variation.

Supplementary Materials

The following are available online at https://www.mdpi.com/1999-4907/10/8/644/s1, Table S1: DNA fingerprints of the 123 Chinese black locust (R. pseudoacacia) cultivars, Figure S1: UPGMA tree clustering of the 123 Chinese black locust (R. pseudoacacia.) cultivars by 12 simple sequence repeat markers.

Author Contributions

L.D., Y.S. and Y.L. conceived and designed the experiments; L.D., Y.S., K.Z., J.Z., Y.Z. and X.L. performed the experiments and analyzed the data; S.X., J.Z. and S.W. collected plant materials. L.D. wrote the paper. All authors read and approved the final paper.

Funding

This research was funded by the National Natural Science Foundation of China (31570677), National key R & D Project (2017YFD0600503), Major Scientific Research Achievements Cultivation Project of Beijing Forestry University (2017CGP007), The Long-Term Research Program for Young Teachers of Beijing Forestry University (2015ZCQ-SW-03), the Science and Technology Development Center of the National Forestry and Grassland Administration Project (2016007). And the APC was funded by the National Natural Science Foundation of China (31570677).

Conflicts of Interest

The authors declare no conflicts of interest.

References

  1. Barrett, R.P.; Mebrahtu, T.; Hanover, J.W. Black locust: A multi-purpose tree species for temperate climates. In Advances in New Crops; Timber Press: Portland, OR, USA, 1990; pp. 278–283. [Google Scholar]
  2. Bongarten, B.C.; Huber, D.A.; Apsley, D.K. Environmental and genetic influences on short-rotation biomass production of black locust (Robinia pseudoacacia L.) in the Georgia Piedmont. For. Ecol. Manag. 1992, 55, 315–331. [Google Scholar] [CrossRef]
  3. Li, J. The introduction and development of black locust in Shandong. J. Shandong For. Sci. Technol. 1983, 04, 73–75. [Google Scholar]
  4. Kopp, R.; Smart, L.; Maynard, C.; Tuskan, G.; Abrahamson, L. Predicting within-family variability in juvenile height growth of Salix based upon similarity among parental AFLP fingerprints. Theor. Appl. Genet. 2002, 105, 106–112. [Google Scholar] [CrossRef] [PubMed]
  5. Mao, X.; Zheng, Y.; Sun, B.; Zhang, Y.; Han, C.; Xiao, W.; Xun, S. Genetic Diversity and Fingerprints of Robinia pseudoacacia Clones Based on SSR Markers. Sci. Silvae Sin. 2017, 53, 80–89. [Google Scholar]
  6. Xiong, J.S.; Isik, F.; McKeand, S.E.; Whetten, R.W. Genetic variation of stem forking in loblolly pine. For. Sci. 2010, 56, 429–436. [Google Scholar]
  7. Ma, L.Y.; Kong, D.; Liu, H.; Wang, S.-Q.; Li, Y.-Y.; Pang, X.-M. Construction of SSR fingerprint on 36 Chinese jujube cultivars. Acta Hortic. Sin. 2012, 39, 647. [Google Scholar]
  8. Chen, C.; Zhang, X.; Cheng, F.; Zhuang, M.; Liu, Y.; Yang, L.; Zhang, Y.; Fang, Z. Establishment of SSR fingerprinting on autumn cabbage hybrids and their parents. Acta Hortic. Sin. 2011, 38, 159–164. [Google Scholar]
  9. Wang, Z.; Weber, J.L.; Zhong, G.; Tanksley, S.D. Survey of plant short tandem DNA repeats. Theor. Appl. Genet. 1994, 88, 6. [Google Scholar] [CrossRef]
  10. Bell, C.J.; Ecker, J.R. Assignment of 30 microsatellite loci to the linkage map of Arabidopsis. Genomics 1994, 19, 137–144. [Google Scholar] [CrossRef]
  11. Morgante, M.; Olivieri, A.M. PCR-amplified microsatellites as markers in plant genetics. Plant J. 1993, 3, 175–182. [Google Scholar] [CrossRef]
  12. Tautz, D.; Renz, M. Simple sequences are ubiquitous repetitive components of eukaryotic genomes. Nucleic Acids Res. 1984, 12, 4127–4138. [Google Scholar] [CrossRef] [PubMed] [Green Version]
  13. Röder, M.S.; Korzun, V.; Wendehake, K.; Plaschke, J.; Tixier, M.-H.; Leroy, P.; Ganal, M.W. A microsatellite map of wheat. Genetics 1998, 149, 2007–2023. [Google Scholar] [PubMed]
  14. Ayres, N.; McClung, A.; Larkin, P.; Bligh, H.; Jones, C.; Park, W. Microsatellites and a single-nucleotide polymorphism differentiate apparentamylose classes in an extended pedigree of US rice germ plasm. Theor. Appl. Genet. 1997, 94, 773–781. [Google Scholar] [CrossRef]
  15. Lian, C.; Oishi, R.; Miyashita, N.; Hogetsu, T. High somatic instability of a microsatellite locus in a clonal tree, Robinia pseudoacacia. Theor. Appl. Genet. 2004, 108, 836–841. [Google Scholar] [CrossRef] [PubMed]
  16. Lian, C.; Hogetsu, T. Development of microsatellite markers in black locust (Robinia pseudoacacia) using a dual-supression-PCR technique. Mol. Ecol. Notes 2002, 2, 211–213. [Google Scholar]
  17. Mishima, K.; Hirao, T.; Urano, S.; Watanabe, A.; Takata, K. Isolation and characterization of microsatellite markers from Robinia pseudoacacia L. Mol. Ecol. Resour. 2009, 9, 850–852. [Google Scholar] [CrossRef] [PubMed]
  18. Wang, J.; Lu, C.; Yuan, C.; Cui, B.; Qiu, Q.; Sun, P.; Hu, R.; Wu, D.; Sun, Y.; Li, Y. Characterization of ESTs from black locust for gene discovery and marker development. Genet. Mol. Res 2015, 14, 12684–12691. [Google Scholar] [CrossRef]
  19. Guo, Q.; Wang, J.-X.; Su, L.-Z.; Lv, W.; Sun, Y.-H.; Li, Y. Development and evaluation of a novel set of EST-SSR markers based on transcriptome sequences of black locust (Robinia pseudoacacia L.). Genes 2017, 8, 177. [Google Scholar] [CrossRef]
  20. Huang, X.; Madan, A. CAP3: A DNA sequence assembly program. Genome Res. 1999, 9, 868–877. [Google Scholar] [CrossRef]
  21. Lalitha, S. Primer Premier 5. Biotech Softw. Internet Rep. 2000, 1, 270–272. [Google Scholar] [CrossRef]
  22. Don, R.; Cox, P.; Wainwright, B.; Baker, K.; Mattick, J. ‘Touchdown’PCR to circumvent spurious priming during gene amplification. Nucleic Acids Res. 1991, 19, 4008. [Google Scholar] [CrossRef] [PubMed]
  23. Liu, H.Y.; Xiong, F.; Duan, X.B.; Chen, D.Q. Isolation and characterization of polymorphic microsatellite loci from elongate loach (Leptobotia elongate), a threatened fish species endemic to the Yangtze River. Conserv. Genet. Resour. 2012, 4, 129–131. [Google Scholar] [CrossRef]
  24. Peakall, R.; Smouse, P.E. Genalex 6: Genetic analysis in Excel. Population genetic software for teaching and research. Mol. Ecol. Notes 2010, 6, 288–295. [Google Scholar] [CrossRef]
  25. Botstein, D.; White, R.L.; Skolnick, M.; Davis, R.W. Construction of a genetic linkage map in man using restriction fragment length polymorphisms. Am. J. Hum. Genet. 1980, 32, 314. [Google Scholar] [PubMed]
  26. Rohlf, F. NTSYS-pc: Numerical Taxonomy and Multivariate Analysis System, Ver. 2.1; Applied Biostatistics: New York, NY, USA, 2000. [Google Scholar]
  27. Yang, X.; Sun, X.; Zhang, S.; Xie, Y.; Han, H. Development of EST-SSR markers and genetic diversity analysis of second cycle elite population in Larix Kaempferi. Sci. Silvae Sin. 2011, 47, 52–58. [Google Scholar]
  28. Sheng, Z.; Huang, H.; Lin, E.; Tong, Z. Development and Application of EST-SSR Markers for Cunninghamia lanceolata and Taiwania cryptomerioides. Sci. Silvae Sin. 2013, 49, 173–180. [Google Scholar]
  29. Wang, Y. Data Mining for SSRs in ESTs and EST-SSR Marker Development in Betula platyphylla. Sci. Silvae Sin. 2008, 44, 78–84. [Google Scholar]
  30. Varshney, R.K.; Andreas, G.; Sorrells, M.E. Genic microsatellite markers in plants: Features and applications. Trends Biotechnol. 2005, 23, 48–55. [Google Scholar] [CrossRef]
  31. Nicot, N.; Chiquet, V.; Gandon, B.; Amilhat, L.; Legeai, F.; Leroy, P.; Bernard, M.; Sourdille, P. Study of simple sequence repeat (SSR) markers from wheat expressed sequence tags (ESTs). Theor. Appl. Genet. 2004, 109, 800–805. [Google Scholar] [CrossRef]
  32. Kantety, R.V.; Rota, M.L.; Matthews, D.E.; Sorrells, M.E. Data mining for simple sequence repeats in expressed sequence tags from barley, maize, rice, sorghum and wheat. Plant Mol. Biol. 2002, 48, 501–510. [Google Scholar] [CrossRef]
  33. Bérubé, Y.; Zhuang, J.; Rungis, D.; Ralph, S.; Bohlmann, J.; Ritland, K. Characterization of EST-SSRs in loblolly pine and spruce. Tree Genet. Genomes 2007, 3, 251–259. [Google Scholar] [CrossRef]
  34. Zhang, X. Development of EST-SSR in Populus deltoides and P. euramericana. Sci. Silvae Sin. 2009, 45, 53–59. [Google Scholar]
  35. Gupta, P.K.; Rustgi, S.; Sharma, S.; Singh, R.; Kumar, N.; Balyan, H.S. Transferable EST-SSR markers for the study of polymorphism and genetic diversity in bread wheat. Mol. Genet. Genom. 2003, 270, 315–323. [Google Scholar] [CrossRef] [PubMed]
  36. Temnykh, S.; Park, W.D.; Ayres, N.; Cartinhour, S.; Hauck, N.; Lipovich, L.; Cho, Y.G.; Ishii, T.; Mccouch, S.R. Mapping and genome organization of microsatellite sequences in rice (Oryza sativa L.). Theor. Appl. Genet. 2000, 100, 697–712. [Google Scholar] [CrossRef]
  37. Metzgar, D.; Bytof, J.; Wills, C. Selection against frameshift mutations limits microsatellite expansion in coding DNA. Genome Res. 2000, 10, 72–80. [Google Scholar] [PubMed]
  38. Kumpatla, S.P.; Mukhopadhyay, S. Mining and survey of simple sequence repeats in expressed sequence tags of dicotyledonous species. Genome 2005, 48, 985–998. [Google Scholar] [CrossRef] [PubMed]
  39. Thiel, T.; Michalek, W.; Varshney, R.; Graner, A. Exploiting EST databases for the development and characterization of gene-derived SSR-markers in barley (Hordeum vulgare L.). Theor. Appl. Genet. 2003, 106, 411–422. [Google Scholar] [CrossRef] [PubMed]
  40. Wei, W.; Qi, X.; Wang, L.; Zhang, Y.; Hua, W.; Li, D.; Lv, H.; Zhang, X. Characterization of the sesame (Sesamum indicum L.) global transcriptome using Illumina paired-end sequencing and development of EST-SSR markers. BMC Genom. 2011, 12, 451. [Google Scholar] [CrossRef]
  41. Martienssen, R.A.; Colot, V. DNA methylation and epigenetic inheritance in plants and filamentous fungi. Science 2001, 293, 1070–1074. [Google Scholar] [CrossRef]
  42. Saha, M.C.; Mian, M.R.; Eujayl, I.; Zwonitzer, J.C.; Wang, L.; May, G.D. Tall fescue EST-SSR markers with transferability across several grass species. Theor. Appl. Genet. 2004, 109, 783–791. [Google Scholar] [CrossRef]
  43. Xun, S.H.; Zhou, J.R.; Huang, F.J.; Qiao, Y.L.; Zhang, L.J.; Mao, X.H. Guideline for the tests of DUS for new varieties of genus Robinia. J. Beijing For. Univ. 2013. [Google Scholar] [CrossRef]
  44. Liu, C.Y.; Huang, Y. Analysis of Genetic Relationship of Robinia among Species Using RAPD Marker. J. Liaocheng Univ. 2009, 22, 68–70. [Google Scholar]
  45. Wang, D.; Zhou, J.; Xie, H. AFLP Genetic Diversity Analysis of Robinia pseudoacacia Clones. J. Southwest For. Univ. 2012, 32, 25–29. [Google Scholar]
  46. Devos, K.; Gale, M.D. The use of random amplified polymorphic DNA markers in wheat. Theor. Appl. Genet. 1992, 84, 567–572. [Google Scholar] [CrossRef] [PubMed]
  47. Liesebach, H.; Ewald, E. Optimisation of a multiplex PCR assay of nuclear microsatellite markers for population genetics and clone identification in Robinia pseudoacacia L. Silvae Genet. 2012, 61, 142–148. [Google Scholar] [CrossRef]
Figure 1. Total number, frequency, and distinct motif repeat types of simple sequence repeats (SSRs) in black locust expressed sequence tag (EST) sequences. (a) Motif number distributions of dinucleotide to hexa-nucleotide motif types with different numbers of repeats in black locust EST sequences. (b) Average distance per SSR locus among the dinucleotide to hexa-nucleotide motif types. Frequencies of the motifs in (c) dinucleotide and (d) tri-nucleotide repeats.
Forests 10 00644 g001
Figure 2. Amplification results at the single-sequence repeat loci Rply1, Rply2, and Rply21 using eight cultivars of black locust. (PCR products were separated by electrophoresis in 8% non-denaturing polyacrylamide gel and fragments were detected by silver staining.).
Forests 10 00644 g002
Figure 3. Mean values of polymorphism indices across 123 black locust cultivars. (Na: number of alleles; Na Freq. ≥ 5%: number of alleles with a frequency ≥ 5%; Ne: number of effective alleles; I: Shannon’s Information Index; No. Private Alleles: number of alleles unique to a single sub-group.).
Forests 10 00644 g003
Figure 4. Fragments amplified by Rply3 primer pairs for the black locust cultivars ‘Shilin’, ‘Minquan’ and ‘Xiaoye’ (Sized by GeneMarker 1.8.0).
Forests 10 00644 g004
Table 1. The 123 main cultivars of black locust (Robinia pseudoacacia).
CodeCultivarCodeCultivarCodeCultivarCodeCultivar
1(c)Lei 0132(c)Yu 803063(b)4294(b)II-7
2(c)Mei 133(c)Yu 803164(b)6395(b)III-21
3(c)Lei 0234(c)Yu 803265(b)6896(b)3-I
4(c)Lei 0335(c)Yu 803366(b)7897(c)X 2
5(c)Lei 0436(c)Yu 803467(b)8098(c)X 3
6(c)Lei 0537(c)Yu 803568(b)8499(c)X 4
7(c)Lei 0638(c)Yu 803769(b)86100(c)X 5
8(b)Lei 0739(c)Yu 803870(b)87101(c)X 6
9(c)Lei 0840(c)Yu 803971(b)90102(c)X 7
10(c)Lei 0941(c)Yu 804272(b)103103(c)X 8
11(a)Xing142(c)Yu 804373(b)165104(c)X 9
12(c)Xing 243(c)Yu 804474(b)K 1105(c)X Daye
13(a)Xing 0844(c)Yu 804775(b)K 2106(a)Jiangan 1
14(c)Xing 1145(c)Yu 804876(b)K 3107(b)Danye
15(c)Xing 1446(c)Yu 805477(b)K 4108(a)Honghuahuai
16(c)Xing 1647(c)Yu 805778(b)K 5109(c)Chuihuai
17(a)Xing 2048(c)Yu 806279(c)Yuci 83002110(b)Changye
18(c)Xing 2349(a)Lu 03880(c)Yuci 84023111(b)Xiongyali
19(c)Xing 2450(a)Lu 04281(c)Yu 8402112(b)Xiaoye
20(c)Xing 3251(a)Lu 5082(c)Yu 8095113(b)Beilin
21(c)Yu 800152(a)Lu 06883(b)Xinzheng 1114(c)Shilin
22(c)Yu 800453(a)Lu 8684(b)Xinzheng 3115(b)Hebei
23(c)Yu 800554(a)Lu 9085(b)A116(c)Minquan
24(c)Yu 800655(a)Lu 8786(b)B117(c)Henanjiangan
25(c)Yu 800756(b)No.487(b)F118(b)YQ 2
26(c)Yu 800857(b)No.988(b)G119(b)YQ 13
27(c)Yu 800958(c)No.1089(b)H120(b)1 XYL
28(c)Yu 801459(b)790(b)Q121(b)ZYDL
29(c)Yu 802360(b)1091(b)V-23122(b)HY 2-4
30(c)Yu 802561(b)1392(b)V-31123(b)HY 101
31(c)Yu 802762(b)1493(b)VI-37
Note: The letters in bracket indicate the repository where the cultivars are conserved (a: Daqingshan Forest Farm, Shandong Province; b: Xinzheng Forest Farm, Henan Academy of Forestry; c: Kaifeng Academy of Agricultural and Forestry Sciences, Henan Province).
Table 2. Characteristics of 25 polymorphic, repeatable and stable simple sequence repeat (SSR) markers derived from expressed sequence tag (EST) of Robinia pseudoacacia L. (Na: Number of observed alleles).
Accession No.LocusRepeat MotifPrimer Sequence
(5′ to 3′)
Size (bp)Annealing Temperature (℃)Na.
gi|15630411|gb|BI677504.1|BI677504-2Rply1(AAG)6F: AGTTCGCAAAGGAAGGAG247–274543
R: GGTAACAAGCACCAGCAA
gi|15544384|gb|BI642174.1|BI642174-5Rply2(CCA)6F: TGTGAATGGTTGGTGGACAT148–160584
R: CGTTGCTTGGAGGAGAATAA
gi|15544478|gb|BI642268.1|BI642268-5Rply3(GTGGTA)4F: GCCTCATAAATAAAAGGAACG138–1645911
R: CTGCCATTGGTAACTGGTAAA
gi|15544752|gb|BI642542.1|BI642542-4Rply5(ATG)8F: GAGTCATGCCCTTTGTATGTT122–143596
R: TGTCACCTTCAAGTCCCTATT
gi|15545024|gb|BI642814.1|BI642814-1Rply8(CT)14F: TCCCTACATAAAACTCCAAA239–2715515
R: TCATTAAGTCAGCACTCACAG
gi|15544811|gb|BI642601.1|BI642601-1Rply11(AG)10F: ATAGCAGTGGGTGAACAAG106–128533
R: GAAACCGAAGCTCAAGTAG
gi|15630549|gb|BI677642.1|BI677642-3Rply15(CAT)7F: GGCACAAGAACAGAACAAA88–112536
R: GTGGTGGATAAGGATAAGC
gi|15630659|gb|BI677752.1|BI677752-6Rply16(GAA)7F: CGTCGGAGTGCTGTTATG239–245553
R: AGCTTATGGCAAAGAGGG
gi|15630701|gb|BI677794.1|BI677794-2Rply17(GAT)6F: TCTGATCCTGATGGTGCTG252–276562
R: GTCGTCGTGTCCTTCTGTC
gi|15630787|gb|BI677880.1|BI677880-2Rply18(TGCAG)4F: GCTCGTCAATATGGCAAAC181–221583
R: CAACATTATCACCCAACCC
gi|15632039|gb|BI679132.1|BI679132-4Rply21(TGTA)5F: TCAGTTGAACCAGCAGAGT177–185532
R: ATATCGCCATGTAAAGCAG
gi|15630346|gb|BI677439.1|BI677439-6Rply22(ACCTG)4F: ATCACCATCTGTTCCTCCAC115–130584
R: TTCTCCTCAGCCACTTCTTT
gi|15631600|gb|BI678693.1|BI678693-4Rply27(TAT)6F: CATTTAGTTGGAGGCATTG145–154544
R: AAGATGGAAGTGACGAGGA
gi|391233429|gb|JK974151.1|JK974151-1Rply28(TGAGC)4F: TGGAGGGTTAGATTTGGATGT152–172583
R: AGGATGGAGAGTAAAGGGTTG
gi|391233401|gb|JK974123.1|JK974123-4Rply31(TCC)5F: CATTCTTCCCAATCTCCTTT155–158562
R: GTTTCATTTTCGCATTCTGT
gi|15631784|gb|BI678877.1|BI678877-5Rply32(GTT)5F: TGGGATCTTTGGAGGTAAT247–251543
R: TAGAGGCTCAATGGTTTCA
gi|15631654|gb|BI678747.1|BI678747-6Rply33(ACT)7F: GCCCATTCTGTTGGTTCT273–279552
R: GGTTATGTGCCCTCGTGT
gi|15631164|gb|BI678257.1|BI678257-1Rply36(CT)7F: CGTTGAAAGAGGGAAAGCAG268–270622
R: GAAATCGACGCCAATGGTAC
gi|15630348|gb|BI677441.1|BI677441-2Rply43(AT)6F: GTTTACGGCGTTGTTGAGTT144–178574
R: CTAATTGCTTGCATTTCCCT
gi|15631529|gb|BI678622.1|BI678622-3Rply44(CT)7F: AAAGTGAGACATCCAAGTTC167–171532
R: CAACCTTCCATTGTTTACAC
gi|15631101|gb|BI678194.1|BI678194-3Rply45(TA)8F: CAACTCGTTTTCCTTCTTCA173–185554
R: ACCGAATCAGATCACATCAA
gi|15630467|gb|BI677560.1|BI677560-1Rply49(CT)8F: CCCCGTACAGTTCCATCT118–1446013
R: GACCTCGTAAAAGCCACC
gi|15630465|gb|BI677558.1|BI677558-3Rply50(TC)8F: GCGAAAACGACAAGGAGATA292–300584
R: TTTGAGGAGCAACAAAGAGC
gi|15544793|gb|BI642583.1|BI642583-2Rply53(GA)6F: TGTTCTCCTCACCTTCCCTT183–211573
R: GTTCATGGCTCTTGTCTTCC
gi|15544810|gb|BI642600.1|BI642600-2Rply60(TC)6F: ATCTTTGACGCTTCTCGC271–281554
R: CATTTCTTCTTCAGCCTGTG
Table 3. Information on four published SSR markers.
LocusRepeat MotifPrimer Sequences
(5′-3′)
Allele Size (bp)Accession No.Origin
Rops08(CA)8TA(CA)3F: TTCTGAGGAAGGGTTCCGTGG191–205AB075033Lian et al., 2002 [16]
R: GTTAAAGCAACAGGCACATGG
Rp109(AG)17F: GAGGAATCACAAAACCGTTTGG136–160AB353930Mishima et al., 2009 [17]
R: TGGGATTTGAGAGAGTGGTGGTG
Rp200(AG)23F: GGTTTCTTTGTTCACCTGCTCTGG160–198AB353933Mishima et al., 2009 [17]
R: ACCTACGTGTCCACGGCTCT
Rp206(GT)9F: GCCAAATCCCATTAGATCACAGTTGA222–246AB353932Mishima et al., 2009 [17]
R: AGAAGTTAGACTTACGTGCTGC
Table 4. Indices of polymorphism obtained for 123 black locust cultivars with 12 SSR markers.
LocusNaNeIHoHePIC
Rply24 2.6861.1290.6100.6280.573
Rply56 3.1521.3310.7320.6830.648
Rply311 7.8962.2100.8810.8730.805
Rply604 1.7440.7820.1740.4270.402
Rply274 2.6101.1250.5170.6170.564
Rply4913 5.7712.0230.7870.8270.806
Rops088 2.7991.3600.5670.6430.584
Rp1099 4.1061.7100.7370.7560.726
Rp20013 8.3952.3070.9290.8810.857
Rp2069 3.0801.4840.4000.6750.629
Rply815 7.4222.2460.7570.8650.842
Rply156 3.0231.3630.7190.6690.609
Mean8.5 4.3901.5890.6510.7120.670
Na, observed number of alleles; Ne, effective number of alleles; I, Shannon’s information index; Ho, observed heterozygosity; He, expected heterozygosity; PIC, polymorphic information content.

