Abstract
Traditional timber harvests on steep slopes have been conducted through labor-intensive and sometimes environmentally impactful methods, such as manual felling with chainsaws and extraction using bladed skid trails, winching, or cable yarding. Ground-based mechanized harvesting and primary transportation methods such as cut-to-length harvesters and forwarders have emerged in some parts of the world as low-impact, safe, and efficient alternatives to the aforementioned systems. However, when mechanized operations are used on steep terrain, problems such as poor stability, loss of traction, and increased soil disturbance can occur. Tethered or winch-assisted logging practices are being tested and applied in several countries to adapt to challenges associated with operating equipment on steep slopes while minimizing environmental impact. To better understand the feasibility of these systems, we conducted a designed experiment to quantify changes in soil properties and predicted erosion resulting from varying numbers of passes and payload levels by a forwarder operating on slopes ranging from 27 to 38 degrees. The machine was equipped with two different track configurations, tethered by either a machine-mounted or self-contained winch, in eucalyptus plantations in Brazil. On low slopes, bulk density significantly increased, but it did not increase on steeper slopes; this demonstrates traction winches’ effectiveness at reducing concentrated ground pressures. Rut depths were minimal and decreased with increasing slope classes due to reduced track slippage. Predicted erosion rates were high, primarily due to the extremely steep, long slopes and lack of adequate cover in some portions of the trail, illustrating the importance of proper erosion management practices on steep slopes.
1. Introduction
Logging operations on steep slopes often face more difficult challenges than those on gentler terrain. For decades, timber harvesting on steep slopes has been achieved by manual felling with a chainsaw followed by extraction using specialized methods such as bladed skid trails, winching, or cable yarding [1,2]. Chainsaw felling and choker-cable setting tend to be more physically taxing and dangerous for workers [3], while the use of bladed skid trails, winching, and cable yarding can be impactful to the environment and/or have reduced efficiencies when compared with ground-based mechanized operations on less challenging terrain [1,2,4]. However, when mechanized operations are transferred to steep slopes, numerous problems arise, including poor machine stability, reduced traction, and increased soil disturbance [5,6].
Slope limitations for ground-based logging equipment vary depending on several factors. Soil strength can greatly affect grade restrictions: The weaker the soil, the less traction the machine can maintain [7]. Visser and Berkett observed that the terrain roughness and protrusions such as residual stumps can adversely affect machine slope, operability, and resulting stability more than the actual slope of the terrain [8]. Additionally, different equipment types and configurations inherently have different grade capabilities [9]. Wheeled machines can typically traverse up to 24 degree slopes without causing excessive soil erosion, whereas tracked machines can operate on slopes up to approximately 31 degrees [7,10]. Some modern purpose-built steep slope machines are capable of traversing grades up to 35 degrees while maintaining acceptable productivity [11,12]. Nevertheless, even highly specialized steep slope machines lose stability, traction, and productivity on extreme grades, weak soils and under adverse conditions, resulting in a practical slope limit of approximately 27 degrees for most machines [9].
As a result, loggers have explored alternate logging techniques for steep terrain. A common steep slope technique is cable yarding [13]. However, cable yarding tends to be expensive [14] and dangerous for workers [15]. Therefore, cable-assisted or “tethered” machines are being evaluated where conventional ground-based equipment is aided by winches to improve traction and stability. This concept is not new; a feasibility study completed by the U.S. Forest Service in 1978 suggested that equipment could be operated on slopes of 11–37 degrees using a self-contained tether cable system given certain limitations, such as the equipment having a diesel engine and hydrostatic transmission, the soils being inherently stable up to 37 degrees, and the terrain being homogeneous enough to prevent cable hang-ups [16]. Hartsough et al. examined using cable-towed unmanned vehicles as alternatives to cable-yarding operations in 1988, citing lower costs, lower cable tensions which reduce machine power requirements and wear, better versatility, and lower soil impacts [17]. They also suggested several vehicle designs such as a simple cable-towed arch and a cable-towed modified skidder. Bombosch et al. successfully used a PistenBully 300 W Polar winch in combination with a forwarder in Germany in 2003 on slopes up to 40 degrees [11].
Tethering technology has advanced, and interest has expanded all over the world. In central Europe, Canada, and the U.S. Pacific Northwest, cable yarding has been used extensively due to the steep terrain and low environmental impact. However, cable yarding is limited in feasible applications by its excessive set-up time, safety concerns, lack of productivity, relatively high costs, large amount of pre-harvest planning, and level of expertise required. Thus, loggers have explored cable-assisted technology as an alternate steep slope harvesting method [6,18,19]. In New Zealand during the 1980s and 1990s, there was a largescale movement of planting pine plantations on steep pastureland [14]. These plantations are reaching maturity, and loggers are examining cable-assisted machines to offset the high costs and dangerous nature of cable yarding [20]. Similarly, in Brazil, eucalyptus plantations have been established on degraded steep slope pastureland to achieve a higher return from those lands [21,22]. Suzano, a pulp and paper company located in South-Eastern Brazil, has successfully used cable-assisted harvesters and forwarders for their forest operations in eucalyptus plantations on steep slopes for several years [23].
Several benefits of tethered logging have been recognized in studies conducted globally. Holzfeind et al. compared a cable yarding operation with a cable-assisted forwarder and concluded that the cable-assisted forwarder was as productive with lower costs [24]. Evanson and Amishev and Evanson et al. compared manual felling followed by grapple yarding to using a tethered feller-buncher followed by grapple yarding and found increased grapple yarder productivity using the tethered feller-buncher to bunch the stems because the yarder was able to grapple more stems at once [25,26]. The safety benefits gained from tethered logging have not been studied in-depth [9,27,28]. However, tethered logging systems can replace manual tree felling, manual processing and cable yarding, which are the most hazardous occupations in harvesting operations [29]. Therefore, it can be assumed that replacing these manual operations with mechanized ones will significantly increase safety for loggers. This was demonstrated by Axelsson and Bell; when manual operations were replaced with mechanized operations, injury rates were reduced substantially [30,31]. Additionally, since the number of work-related injuries are reduced, mechanized operations can reduce worker’s compensation costs, further increasing financial efficiency [4,31].
Modern cable-assist technologies employ either an integral machine-mounted or separate self-contained winch tethering the machine to the top of the slope, thereby providing enough tractive force for the machine to maintain stability and traction [28]. Machine-mounted winches, such as HAAS traction winches, are the most common and are bolt-on options that can be added to existing machinery with some modification [6,28]. The cable is usually attached to a stump, standing tree, or artificial anchor, and since the winch retracts the cable from the machine, the cable does not constantly get dragged over the ground, which may reduce cable wear [28]. However, these winches add weight to the machine and increase power requirements [9]. Self-contained winches, such as the Ecoforst T-WINCH, are located at the top of the grade and may or may not be tethered to stumps or anchors depending on their weight and stability [6]. These secondary machines remove weight and power requirements from the primary machine and are more versatile than integrated winches because they can be used with multiple machines [9]. However, due to the cable being retracted from the secondary machine, the cable often gets dragged on the ground, which may result in increased cable wear [32]. Additionally, in areas with limited space at the top of the slope, a snatch block may be necessary to change the cable’s direction of pull, enabling the winch to be located out of the path of the primary machine [32].
Though soil disturbances from traditional machines on steep slopes have been well studied [33,34,35,36], there is a lack of literature regarding the soil impacts of tethered logging. Generally, soil erosion increases with slope steepness following disturbances [37,38], and machinery working on the slopes exacerbates the problem because of wheel or track slippage [5,8]. Numerous researchers have hypothesized that using tethered machinery could minimize soil disturbance by reducing slippage [9,16,17]. Bombosch et al. found that a cable-assisted forwarder could traverse slopes of 40 degrees without wheel slippage, implying reduced soil disturbance [11]. Evanson et al., while studying a ClimbMAX harvester, found that while the amount of “deep” soil disturbance was significantly higher for the harvester when compared with manual felling, there was no significant difference in the amount of soil rutting between the two [26].
Another way tethered logging may reduce potential soil disturbance is by reducing the amount of area in bladed mid-slope roads, which are commonly used for skidding and hauling in mountainous terrain. These roads are installed to allow for higher skidding productivity and increased safety on steep slopes [39]. Kochenderfer et al. found that on a normal operation in the Appalachian Mountains, bladed skid trails could commonly occupy up to 11% of the harvest area [40]. Christopher and Visser concluded that haul roads and skid trails were the primary source of sediment from forest harvests even eight years after their post-harvest closure [41]. Worrell et al. calculated average predicted erosion rates of 38.56 Mg/ha/year on bladed skid trails in Virginia with a total of 8.5% of the area covered by bladed skid trails and decks [2]. Wade et al. observed sediment trap yields of up to 137.7 Mg/ha/year in Virginia resulting from bladed skid trails [42]. Megahan and Kidd observed average erosion rates of 65.21 Mg/ha/year resulting from bladed jammer roads in steep terrain in Idaho 4.8 years after the harvest [35]. Since traction winches allow machinery to operate on steep slopes without bladed roads, roads may only be necessary at either the top or bottom of the slope to allow for winch and/or log truck access. Thus, the total area in bladed mid-slope roads is reduced on tethered logging operations, potentially limiting overall soil disturbance. Further, since around 8%–11% of the harvest area is in bladed roads and landings [2,40], this area is taken out of production, which negatively impacts future productivity. Often, forwarder trails straddle a row of stumps instead of designated areas for trails, which keeps the forwarder trails in production. Cut-to-length operations also generally require fewer landings [43].
Several studies have suggested ways to prevent excessive soil disturbance resulting from mechanized harvesting. One common practice is leaving slash mats on skid trails for machinery to travel over, which can decrease erosion [39], reduce compaction and rut depth [44], restrict unauthorized access [45], and provide a slow release of nutrients to the underlying soil [46]. Conversely, the impact of slash and bark on traction and safety in tethered applications is unclear [6]. Tracked vehicles generally have high tractive efficiencies, low ground pressures and good stability [47], which may make them less impactful than wheeled vehicles on steep slopes. Sakai et al. found that the use of bogie tracks on a loaded forwarder was excellent for reducing soil compaction and rutting [48]. In relation to tethered logging, Sessions et al. provided a theoretical model of stability and traction for tethered steep slope machinery which demonstrates how some variables may reduce soil disturbance [6]. For instance, higher cable tensions and taller grouser heights can reduce slippage and improve gradeability. Wider tracks, orienting the boom uphill, traveling uphill, and higher hitch heights also can improve gradeability and reduce slippage while also providing lower and more even ground pressures.
Though these studies have addressed the visual and theoretical soil disturbance resulting from tethered logging, there have been few quantifying it in the field. Furthermore, little research has been conducted quantifying the effects of different tethered logging equipment types, configurations, and practices on soil disturbance. The objectives of this project were to quantify changes in soil properties, such as bulk density and rutting depth, and predicted erosion rates resulting from different configurations of a tethered forwarder operating on slopes from 27 to 38 degrees in a eucalyptus plantation in Brazil. Specifically, the forwarder was tethered with either a HAAS machine-mounted winch or an Ecoforst T-WINCH, which resulted in two different maximum machine weights. The forwarder also used two different track configurations and made varying numbers of passes on the slope.
2. Materials and Methods
Three study sites were selected to represent three gradients of slope steepness (low slope, medium slope, and high slope). Sites were located on the Americana Farm near the city of Guaratingutá, in the state of São Paulo, Brazil (Figure 1). The land is owned by Suzano, a Brazilian pulp and paper company. The low slope site was located at 22°49’15,64” S, 45°8’51,74” W, and it contained average slopes from 27 to 31 degrees. The medium slope site was located at 22°49’21,35” S, 45°9’5,53” W, and it contained average slopes from 31 to 35 degrees. The high slope site was located at 22°49’10,31” S, 45°7’57,69” W, and it contained average slopes from 35 to 38 degrees.
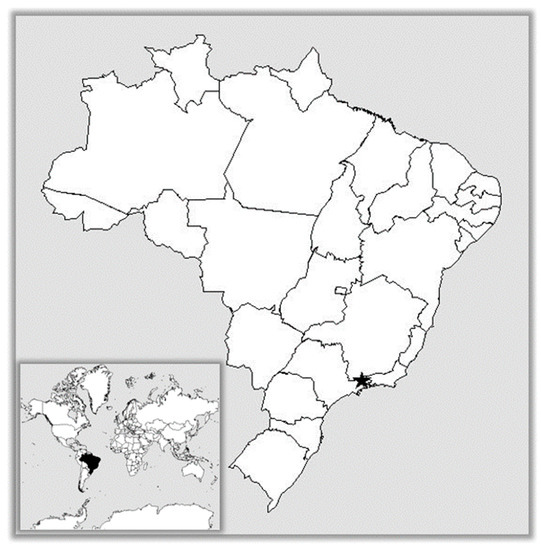
Figure 1.
General location of Suzano’s Americana Farm in Guaratingutá, São Paulo, Brazil [50,51]
The farm was located in the biome Mata Atlântica, with elevations ranging from 500 to 1500 m and a Köppen climate classification of Aw [49]. This area receives an average of 1235 mm of rain per year, with about 79% of the annual rainfall occurring from October to March. The previous land use was pastureland, which was converted into Eucalyptus urograndis plantations in 2006. The eucalyptus is normally grown on 6–7 year rotations, though the area had been harvested once previously in 2011 before being harvested during the study in 2018. The main soil type within the low slope area was a moderately permeable Oxisol with fine granular structure and sandy clay texture. The medium slope area also had a moderately permeable Oxisol with fine granular structure and sandy clay texture in addition to a moderately permeable Inceptisol with a medium granular structure and sandy clay texture. The high slope area had a slow to moderately permeable Inceptisol with a medium granular structure and sandy clay loam texture along with a slowly permeable Ultisol with a blocky structure and a sandy clay loam texture.
Often, the most impactful and limiting piece of equipment in cut-to-length harvesting operations is the forwarder because of its relatively low maneuverability [24], heavy weight [52], wider area trafficked [53], and high number of passes made [54]. Therefore, we chose to study the soil effects resulting from two John Deere 1910E forwarders during stem extraction. Two different traction winch types were used: A 2016 HAAS Model 1910E First Generation traction winch, which was bought as an add-on with the forwarder, and a 2017 Ecoforst TW182 10.1 T-WINCH (Figure 2). The HAAS Winch is a machine-mounted winch attached under the bunk of the forwarder, tethered to a stump or other anchor at the top of the grade, and operated by the forwarder operator from within the cab. The Ecoforst T-WINCH is a self-contained remotely controlled winch that sits at the top of the grade, and the cable is attached to the forwarder frame via a hitch. The T-WINCH is normally tethered in the rear to an anchor, often a stump, ensuring stability of the winch. Due to the added weight of the machine-mounted winch and all necessary accommodations such as hydraulic fluids and pumps, the forwarder with the HAAS winch weighed 47,160 kg fully loaded, which was approximately 4000 kg heavier than the forwarder used in conjunction with the T-WINCH, which weighed 43,170 kg fully loaded. Two different bogie track configurations were also used on the forwarders, hereafter referred to as “mild track” and “aggressive track” (Figure 3). Mild track consisted of Olofsfors ECO-Tracks on both sets of bogie wheels, which are tracks with wide but short grousers that allow for better flotation. The aggressive track consisted of Olofsfors EVO-Soft tracks under the forwarder bunk and Olofsfors EX tracks under the cab, which are a more aggressive pairing with narrower, taller grousers and better steep slope traction.
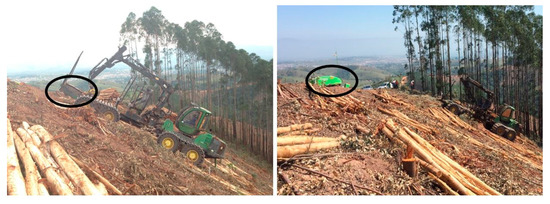
Figure 2.
HAAS machine-mounted traction winch, circled left, and T-WINCH self-contained traction winch, circled right, used in conjunction with a John Deere 1910E forwarder.
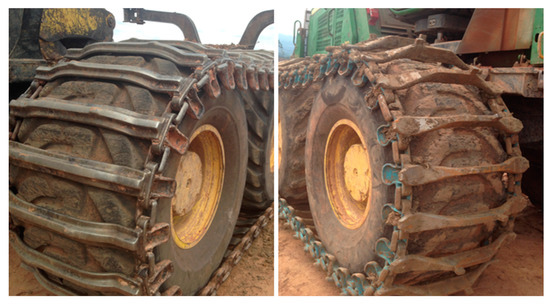
Figure 3.
Olofsfors ECO-Soft bogie track, left, (mild track) and Olofsfors EX bogie track, right (aggressive track).
Our study employed a randomized incomplete block design with three blocks. The “low” slope class (27–31 degrees) constituted block 1, the “medium” slope class (31–35 degrees) constituted block 2, and the “high” slope class (35–38 degrees) constituted block 3. Each block represented a set of treatments, with each set of treatments being replicated 3 times. Blocks 1 and 2 had four treatments each. Treatment 1 (TWMLD) was the forwarder with the mild track tethered with the T-WINCH, Treatment 2 (TWAGG) was the forwarder with the aggressive track tethered with the T-WINCH, Treatment 3 (HSMLD) was the forwarder with the mild track tethered with the HAAS winch, and Treatment 4 (HSAGG) was the forwarder with the aggressive track tethered with the HAAS winch. For block 3, only TWMLD and TWAGG were conducted due to a recommended slope limit of 35 degrees for the HAAS winch. This resulted in 30 total forwarder trails: 12 trails each for blocks 1 and 2 (4 treatments per block replicated 3 times each) and 6 trails for block 3 (2 treatments replicated 3 times each) (Figure 4). Each of the 30 trails was split mid-slope, having 3 data collection points equally spaced on the upper slope and 3 data collection points equally spaced on the lower slope. This represented 2 different traffic levels: The upper slope was traversed more than the lower slope due to multiple loads being hauled from each trail (Figure 5). As a result, there were 60 total experimental units (30 trails × 2 traffic levels), and 180 data collection points (60 experimental units × 3 data collection points per experimental unit).
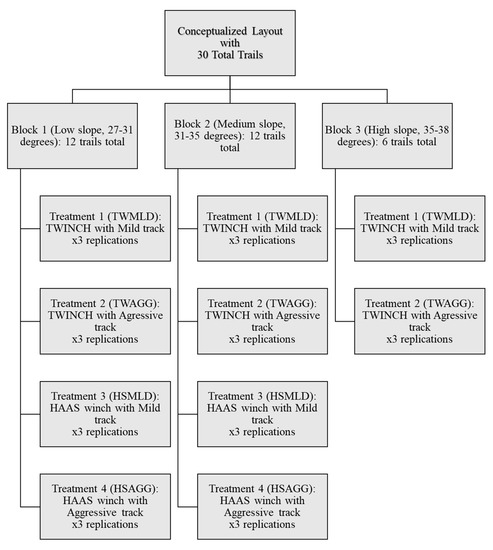
Figure 4.
Conceptualized experimental design layout with 30 total trails.
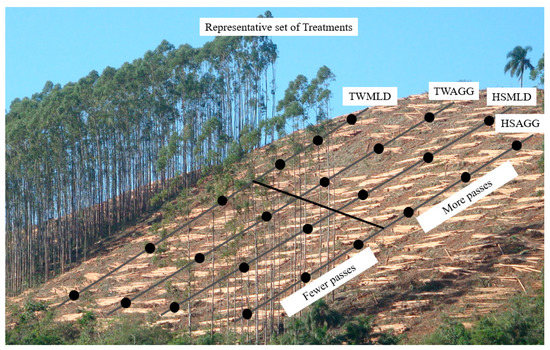
Figure 5.
Representative harvest area with one set of 4 treatments (trails). The split mid-slope depicts the lower section of the trails being traversed less than the upper section. Data collection points were spaced equally along the trails: 3 points on the upper section and 3 points on the lower section. There were 3 such areas each for blocks 1 and 2. Block 3 only had 2 treatments in three harvest areas: Treatment 1—forwarder with the mild track tethered with the T-WINCH (TWMLD) and Treatment 2—the forwarder with the aggressive track tethered with the T-WINCH (TWAGG). This resulted in 30 total forwarder trails (12 for block 1, 12 for block 2, and 6 for block 3), 60 total experimental units (30 trails × 2 traffic levels), and 180 total data collection points (60 experimental units × 3 replications).
Data were collected and compiled into a spreadsheet by Suzano employees from September to November of 2018. Data were collected on days with similar weather, soil conditions, and temperatures to ensure consistency. The number of forwarder passes at each of the data collection points was recorded. Each of the data collection points was also divided by in-track, between-track, and off-track, with the off-track location representing the control or undisturbed area. Bulk density samples were collected at each point in the three locations using a slide-hammer, which resulted in 540 total bulk density samples (180 data collection points × 3 sampling locations per point). The litter layer was removed exposing the mineral soil, and the ring was driven approximately 6.5 cm into the soil. The soil cores were then placed in air-tight bags, labeled, and transferred to the lab where they were oven-dried at 105 ℃ for 72 h. Afterwards, samples were weighed to determine bulk density (g/cm3) [55]. Changes in bulk densities were calculated by subtracting the off-track from in-track density. Gravimetric soil moisture was calculated using the formula (wet soil weight-dry soil weight/dry weight) * 100 [56].
To calculate potential erosion rates, the Universal Soil Loss Equation as modified for forests (USLE-Forest) was used [57]. Parameters for the USLE were collected at each of the three sampling locations for each point. The rainfall erosivity value (R) was determined using the average monthly rainfall and the equation provided for that general location in Brazil by Lombardi and Moldenhauer [58]. The soil erodibility value (K) was determined by a textural analysis technique provided by Dissmeyer and Foster [57]. The slope length (L) was measured using a measuring tape, and the slope steepness (S) was recorded with the slope gauge of the forwarder. The cover and management factor (C) and the support practice factor (P) was also determined using the guide provided by Dissmeyer and Foster [57]. Average trail spacing, track width, and trail width were calculated and used for a weighted average of the erosion rates to allow for an estimate more representative of the entire area (Figure 6). The change in predicted erosion was calculated by subtracting the off-track rate from the in-track rate. Rut depth was measured for the in-track location at each data collection point using a tape measure. Soil type was determined at each point using in-the-field textural analysis [59].
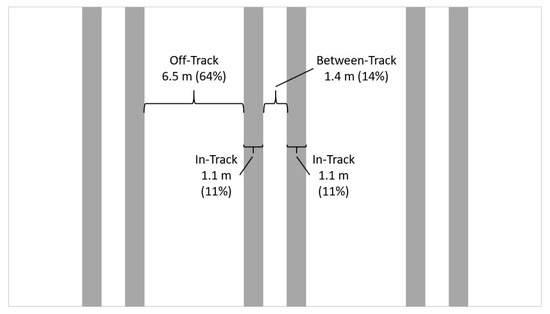
Figure 6.
Average off-track, in-track, and between-track widths and the percentage of the total area each constitutes. These percentages were used to calculate the predicted weighted average erosion rates in order to derive an erosion rate representative of the entire area.
Normal quantile plots and Shapiro–Wilk goodness-of-fit tests [60] were conducted to assess the normality of the data. For normally distributed data, an ANOVA test was conducted along with Tukey–Kramer HSD tests for multiple comparisons. If the data were non-parametric, a one-way ANOVA test using medians (Mood’s median test) was conducted along with the Steel–Dwass method (non-parametric median separation test) for multiple comparisons. For all analyses, a significance level of α = 0.05 was used and performed using JMP Pro 14 statistical software [61].
3. Results
3.1. Bulk Density
Overall, mean bulk densities tended to decrease with slope steepness. Within the low slope class, mean bulk density was significantly higher in-track than off-track for all four treatments (Table 1). Between-track mean bulk density was significantly higher than off-track in low slope TWAGG but not TWMLD, HSMLD, or HSAGG. Bulk density means varied from 1.24 to 1.58 g/cm3. Within the medium slope class, none of the mean bulk densities were significantly different, though the means varied from 1.32 to 1.54 g/cm3. Within the high slope class, in-track mean bulk density was significantly higher than off-track for TWMLD but not for TWAGG. Between-track mean bulk density was not significantly different from off-track mean bulk density. Means ranged from 1.30 to 1.41 g/cm3 (Table 1).

Table 1.
Off-track (O), in-track (I), and between-track (B) means for all slope classes and treatments, and the p-values for each sampling location pairing. P-values in bold are significantly different at α = 0.05.
For the treatments where significant differences were found between off-track and in-track means (all treatments in the low slope block and TWMLD in the high slope block), change in bulk densities were calculated by subtracting the off-track means from the in-track means. Among these, the only significant difference found was between low slope HSAGG and high slope TWMLD (p = 0.040), indicating that no one treatment caused more of a change in bulk density than another, only slope class (Table 2). There was no significant difference found between mild track and aggressive track (p = 0.168). There was also no significant difference found between forwarder weights or winch types (p = 0.305). Finally, though the forwarders made between two and nine passes over the trails, there were no significant differences found between the number of forwarder passes (p = 0.285). Gravimetric soil moisture was calculated to help explain differences in compaction, but no significant relationship between bulk density and soil moisture was observed.
Table 2.
Descriptive statistics for the change in bulk density for treatments with a significantly higher in-track mean bulk density than off-track, calculated by subtracting the off-track mean bulk density from the in-track mean bulk density. The only significant difference at α = 0.05 was between low slope Treatment 4—the forwarder with the aggressive track tethered with the HAAS winch (HSAGG) and high slope TWMLD (p = 0.040).
3.2. Rut Depth
The only significant differences found between treatments for rut depth were between slope classes, indicating that no one treatment had significantly more of an affect than another on rut depth. The distribution of rut depths was non-normal, so non-parametric tests (Mood’s median test and the Steel–Dwass method) were used for analysis. Rut depth for low slope TWMLD was significantly higher than for medium slope TWMLD (p = 0.010), with medians of 5 and 0 cm, respectively. Rut depth for low slope TWMLD was also significantly higher than for high slope TWMLD (p < 0.001), also with medians of 5 and 0 cm, respectively. Rut depth for low slope TWAGG was significantly higher than rut depth for medium slope TWAGG with medians of 4.8 and 0 cm, respectively (p = 0.007) (Table 3). Within HAAS winch treatments, there was no significant difference between low slope and medium slope (p = 0.077). There were also no significant differences between mild track and aggressive track (p = 0.801). Finally, there were no significant differences between the number of forwarder passes (p = 0.753) for any treatment combination. It is worth noting that while there were some significant differences found between slope classes, overall rutting depths were negligible [62] (Figure 7). The maximum rut depth found was 9.5 cm, with 39% of observations measuring 0 cm or no visible ruts. (Table 3).
Table 3.
Descriptive statistics for rut depth for all slope classes and treatments.
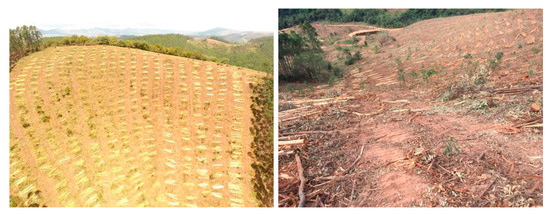
Figure 7.
Photos of a harvest site depicting the low amount of rutting and overall soil disturbance observed as a result of the tethered logging operation.
3.3. Erosion Rates
All disturbance treatments across all slope classes resulted in significantly higher predicted weighted average erosion rates than the off-track predicted erosion rate (p < 0.001). Both the weighted average and the change in erosion rates were analyzed for each treatment, and both provided similar results. Therefore, the weighted average of predicted erosion rates at each data point was used for primary analysis because it gave a more representative rate for the entire trail by taking into account the in-track, between-track and off-track rates, and the representative areas of each. This was calculated by finding the average between-track, off-track and in-track widths, and then dividing each by the total multiplied by 100 to find the percent of the total area each constituted. This percentage was then used to weight the predicted erosion rates at each of the locations to determine a single predicted erosion rate representative of the entire area. The distribution of the weighted average erosion rates was non-normal, so non-parametric tests (Mood’s median test and the Steel–Dwass method) were used for analysis.
Similar to other analyses, slope class was the only variable that yielded significant differences at α = 0.05, indicating that within slope classes, no one treatment had significantly more of an effect on predicted erosion rates than another. The median weighted average erosion rate for medium slope TWMLD was significantly higher than low slope TWMLD at 93.3 versus 24.3 Mg/ha/year. The median weighted average erosion rate for high slope TWMLD was also significantly higher than low slope TWMLD at 152.6 versus 24.3 Mg/ha/year. The median weighted average erosion rate for high slope TWAGG was significantly higher than low slope TWAGG at 129.7 versus 30.0 Mg/ha/year. The median weighted average erosion rate for medium slope HSMLD was significantly higher than low slope HSMLD at 115.1 versus 26.3 Mg/ha/year. The median weighted average erosion rate for medium slope HSAGG was significantly higher than low slope HSAGG at 113.8 versus 38.0 Mg/ha/year (Table 4). The median of all off-track erosion rates was 0.4 Mg/ha/year. While some treatments were not significantly different from each other across slope classes, it is important to note that the standard deviation was much higher for the steeper slope classes than the low slope class, indicating an increased variability with slope. This also helps explain why some of the median weighted average erosion rates between treatments were seemingly much different, such as between high slope TWMLD (152.6 Mg/ha/year) and TWAGG (129.7 Mg/ha/year) (Table 5), but were not found to be significantly different at α = 0.05.
Table 4.
Significant difference (α = 0.05) between slope classes and treatments for the median weighted average erosion rates.
Table 5.
Descriptive statistics for the weighted average erosion rates for each treatment within each slope class.
4. Discussion
4.1. Bulk Density
Most of the changes that occurred in bulk density were in-track, with only one treatment (low slope TWAGG) causing a significant change in bulk density for the between-track location. This is similar to Brais and Camiré’s results, who determined from their study that between-track bulk densities fluctuated randomly and no reliable relationship could be found between the control area and the between-track measurement [63]. There was a significant difference in bulk density as a result of the harvesting operation within the low slope class and for TWMLD within the high slope class, but not within the medium slope class or for high slope TWAGG. Additionally, though no significant difference was found between the change in bulk densities for these treatments, the high slope TWMLD increase in bulk density was about 0.1 g/cm3 less than the other increases. These results suggest that tethered forwarding on steep slopes can result in lower compaction when compared with gentler slopes. Though there are no other quantitative tethered machine studies available to compare these findings with, this contrasts the results from several steep slope ground-based equipment studies. Agherkakli et al. found soil bulk density increases from 0.91 to 1.12 g/cm3 (24.2%) on slopes under 11 degrees and from 0.91 to 1.23 g/cm3 (35.2%) on slopes over 11 degrees after nine passes from a steel tracked skidder, indicating increased changes in bulk density on steeper slopes due to the weight being transferred to a smaller area under the tracks [47]. Likewise, Najafi et al. found significantly lower soil porosity on skid trails over 11 degrees than on gentler slopes resulting from compaction by a wheeled skidder [64]. However, Jamshidi et al. observed that there were no detectible differences in bulk densities on steeper slopes compared to flat ground when operating a wheeled skidder on steep terrain in Iran, although this was attributed to differences in site conditions and the large number of passes (42) overriding the smaller effect slope was expected to have [65].
These discrepancies can be explained in several ways. Visser et al. explained that machinery working on steep slopes will lose traction and start to slide when the downslope force exceeds the traction force that the tracks or wheels of the machine can generate through the soil [1]. This traction depends on the soil’s coefficient of traction and varies with soil and machine type. Traction winches extend the slope range of the machine by providing cable tension, which augments the traction force generated by the tracks, allowing the machine to overcome the downslope force. Sessions et al. described that ground pressures increase as effective track lengths decrease due to the concentration of machine weight on a smaller area [6]. Cable tension from the traction winch equalizes the ground pressure under the tracks of the machine on steep slopes, potentially reducing soil compaction. Additionally, when track widths were widened from 0.61 to 0.91 m, ground pressures reduced proportionally [6]. The forwarders used in this study had track widths of 1.1 m, allowing the weight of the forwarder to be spread out over a large area, which also likely reduced potential compaction.
Another cause for the reduced compaction observed could be the bulk density sampling method chosen. Many studies conducted comparing bulk density before and after ground-based equipment passage have sampled bulk densities from 0–10, 10–20, and 20–30 cm depths (and sometimes deeper), gaining an understanding of bulk density changes below the surface [66,67,68,69,70]. However, other researchers have chosen to focus on surface compaction [33,47,64,71,72] because the severity of compaction diminishes with depth [73]. Depending on numerous factors such as slope steepness, cable tension, track size and type, and hitch height, tethered machinery may be allowed to have a consistent rate of track slippage which can be controlled with the adjustment of the winch [6]. Since bulk density measurements were only taken to the 6.5 cm depth, the slight slippage of the tracks could have tilled the surface enough to negate any bulk density increases on the surface, since tillage is known to reduce bulk density [66], and particularly since the soil was relatively dry (average soil moisture of 18.16%) and had a sandy texture. This is evidenced by the fact that there were negative changes in bulk density at several data collection points on the slopes.
Another potential reason that the medium slope treatments did not cause a significant change in bulk density is the fact that the medium slope area was already more compact than the low slope area initially. Numerous studies have indicated that bulk density generally increases quickly to a certain threshold but does not compact much more with additional passes or operations [54,74,75]. The treatment areas were harvested seven years prior, and the same harvester and forwarder trails were used. Additionally, the prior land use of these harvest areas was pastureland for grazing. Studies have shown that pastureland soil bulk densities can be significantly higher than forestland or other areas due to the trampling effect of animals [76,77]. The average off-track bulk density for the low slope class was 1.28 g/cm3, whereas the average off-track bulk density for the medium slope class was 1.38 g/cm3. Thus, the soil in the medium slope class could have already been compacted enough to make any further compaction insignificant. The high initial bulk density also potentially explains the lack of treatment effect on bulk density (all low slope treatments and high slope TWMLD). There were no significant differences in change in bulk density observed between increasing numbers of passes or heavier weights of the forwarder, both of which normally cause increased effects on bulk density [78,79]. Therefore, the site was likely already compacted enough to negate any significant differences between treatments that may have otherwise appeared.
Though there were significant increases in bulk density for some treatments, the increases were generally not considered detrimental to the soil. The United States Department of Agriculture’s Forest Service often uses a threshold increase in bulk density of greater than 15% as an indicator of detrimental soil compaction [80]. Daddow and Warrington provided a growth-limiting bulk density textural triangle for the determination of the growth limiting bulk density for soils based on their texture [81]. According to this, a bulk density of around 1.6 g/cm3 could limit plant growth for the sandy clay and sandy clay loam soils found in this study. Among treatments which caused a significant increase in bulk density, the increase averaged 13.80%, while the overall average change in bulk density was only 9.44%. Furthermore, the average in-track bulk densities never exceeded 1.6 g/cm3 in any of the treatments, and the overall average in-track bulk density was 1.46 g/cm3. Therefore, these results indicate the soil was not detrimentally compacted by the harvesting operation.
4.2. Rut Depth
Overall rut depths were shallow when compared with other studies on ground-based harvesting operations. Eliasson found final rut depths of 6–9.2 cm resulting from a forwarder operated with varying tire pressures in Sweden on flat terrain [52]. Eliasson and Wästerlund observed final forwarder and harvester rut depths on flat ground of 9.3 cm for trails with no slash mats and from 5.7 to 6.7 cm with 20 and 10 cm slash mats, respectively [44]. Horn et al. observed rut depths of around 7–20 cm following passages by different types of harvesters operated on flat ground [5]. Normally, rut depths are known to increase with slope due to increased slippage of the wheels or tracks. Najafi et al. found rut depths of up to 34.5 cm resulting from a rubber-tired skidder operating on slopes over 11 degrees in Iran and observed that rut depth increased with slope regardless of the number of passes [64]. Agherkakli et al. also found increased rut depths with steeper slopes resulting from a steel-tracked skidder, with an average rut depth of 9 cm on slopes under 11 degrees and 12 cm on slopes over 11 degrees [47].
In contrast, this study showed the opposite trend; rut depths for lower-slope treatments were generally higher than for higher-slope treatments. Additionally, the overall rut depth range of 0–9.5 cm across all slope classes compared favorably with studies of cut-to-length equipment operating on flat ground [52,78,82]. This is primarily due to the traction winch reducing slippage of the bogie tracks on the forwarder. As mentioned previously, traction winches can usually be adjusted by the operator to allow for more or less slip. More cable tension increases the total traction force, which helps overcome the downslope force and reduces slippage, while less cable tension reduces traction force and increases slippage. The machine operator may choose a lower level of assistance to allow for more slip for various reasons, such as reduced strain on the winch or cable. Allowing for a higher level of slip also increases the ability of the machine’s tracks or wheels to generate traction [6]. However, the winches can also be set to not allow any slippage of the wheels or tracks [11]. Therefore, the traction winch can negate the normal effects of slope on slippage, resulting in rut depths comparable to those experienced on flat ground. This could also explain why some treatments did not show a significant difference in rut depth with their counterparts in higher slope classes, and why there were no significant differences between treatments within slope classes. Situational differences such as winch adjustment, soil strength, or forwarder payload could have varied among treatments, resulting in more or less slippage and consequently variations in rut depth.
4.3. Erosion Rates
Slope class was the main variable which caused significant differences in predicted erosion rates between treatments; an analysis of treatments within slope classes yielded no significant differences. Predicted weighted average erosion rates were high across all slope classes when compared with some operations, such as skyline cable logging [2], but they were similar to some bladed skid trail operations with lower slopes and shorter slope lengths [42]. Oliveira et al. evaluated soil, nutrient, and organic carbon losses caused by water erosion at different development stages of Eucalyptus using erosion plots and provided acceptable erosion rates of up to 12.9 Mg/ha/year in eucalyptus plantations in Brazil to maintain tree productivity and economic sustainability [83]. However, high predicted erosion rates were expected in the trails given the extreme slopes in this study.
There are numerous variables which combine to explain these rates. Brazil’s rainfall erosivity (R) value ranges from 1672 to 22,452 MJ mm ha−1 h−1 yr−1 [84]. The rainfall erosivity value determined during this study was 6347.64 MJ mm ha−1 h−1 yr−1, which is below average for Brazil but is still relatively high compared with other non-tropical countries [33,57]. The soil erodibility (K) values also tended to increase with slope class, indicating more erodible soils on the steeper areas. The low slope class had a K value of 0.063 t h MJ−1 mm−1, the medium slope class had K values from 0.091 to 0.146 t h MJ−1 mm−1, and the high Slope class contained K values from 0.157 to 0.237 t h MJ−1 mm−1. The topographic factor (LS) is a function of slope steepness and slope length; thus, the observed LS values were high compared with other studies on more gentle terrain [85]. Our study areas were characterized by steep, long, continuous slopes. Slopes ranged from 27 to 38 degrees, while slope lengths varied from 5 to 90 m without breaks. This resulted in LS values ranging from 5.20 to 42.14. Given that these factors led to high predicted erosion rates, the cover and management factor (CP) was extremely important. The main value that varied between points within the CP factor was soil cover. The median CP value was 0.002, but there was a considerable amount of variability in this factor, with some points having CP values of up to 0.284. This lack of cover in places explains some of the high erosion rates and variability observed.
Another reason predicted erosion rates were high could be the inadequacy of the USLE for estimating erosion on extremely steep slopes. Few studies have used the USLE on such extreme slopes; most only have used it up to 16–27 degrees [33,85,86,87,88]. The USLE was designed for use on relatively gentle terrain, such as agricultural lands [89]. Though USLE-Forest was modified from the USLE for applicability in forest settings, the modifications were mainly focused on the cover (C) factor [57]. Wade et al. compared sediment trap data with predicted erosion rates from commonly used erosion prediction models on bladed skid trails with slopes ranging from 6 to 11 degrees and concluded the USLE-Forest model adequately predicted erosion [90]. Similarly, Sawyers et al. compared sediment trap data to erosion estimates on bladed skid trails with slopes up to about 16 degrees and found that the USLE-Forest model generally followed the actual erosion trends, though WEPP-Roads tended to be more accurate [91]. McCool et al. found that the standard slope steepness relationships used in the USLE under-predicted erosion on slopes under 5 degrees and over-predicted erosion on slopes over 5 degrees [37]. Kitahara et al. verified the equation’s applicability on slopes up to about 17 degrees in Japan but stated that its use above 17 degrees was extrapolation beyond what could be supported by their data [87]. Dumas and Printemps found LS values of up to 104 while estimating erosion using the USLE with GIS data from the South Pacific Islands indicating extremely steep slopes and long slope lengths, but they stated that those values seemed over-weighted and that the extreme slopes found in that area did not correlate well to the USLE model [92]. Hart compared USLE predictions to sediment tank data under simulated rainfall on slopes up to 18 degrees in Idaho and observed that the USLE estimates were consistently several times greater than actual erosion rates due to the high slope value [93]. Thus, it is possible that slopes observed in this study are not within the applicability of the USLE. A comparison of estimated erosion rates with sediment trap data on extremely steep slopes would be useful in validating the use of the USLE on such slopes.
There are few studies to date which quantify erosion rates from tethered logging sites. However, when compared with other steep slope extraction methods such as cable logging, our erosion rates were moderate to high. Megahan and Kidd found an increase in erosion rates from sediment traps of 0.05 Mg/ha/year over the natural state following a skyline cable logging operation and an average erosion rate of 65.21–71.86 Mg/ha/year resulting from the road network required for a jammer in central Idaho on slopes averaging 34 degrees [35]. Thus, the median predicted erosion rate from our study was between the skyline and jammer treatments at 52.9 Mg/ha/year. Worrell et al. found predicted site erosion rates of 3.8 Mg/ha/year overall for skyline cable yarding and 4.26 Mg/ha/year overall for areas using cable skidders with bladed skid trails on a harvest site in Virginia with slopes ranging from 29 to 45 degrees, which are both well under our observed median erosion rate [2]. However, predicted erosion rates were much higher for skid trails with slopes of 6–11 degrees and spur roads at 38.56 and 56.27 Mg/ha/year, respectively. Vinson et al. found a predicted erosion rate of 24.1 Mg/ha/year using USLE-Forest on bladed skid trails with water bars in Virginia on average slopes of 9 degrees, while the actual sediment trap yield was 15.2 Mg/ha/year [94]. Wade et al. found erosion rates of up to 137.7 Mg/ha/year resulting from skid trails in Virginia [42]. These studies portray the extreme variability in predicted erosion rates, actual erosion rates, different site conditions, etc. between previous studies. The studies closest in conditions to ours still generally had gentler average slopes, shorter slope lengths, lower rainfall or rainfall erosivity values, varying levels of best management practices (BMPs) applied, different methods, and other variances.
Though predicted erosion rates were high, considering the variability and questions of applicability, it is not unreasonable to assume that actual erosion rates could be reduced given adequate cover, since this was the main controllable factor that affected erosion rate variability. A sensitivity analysis was conducted replacing the calculated CP values with the overall minimum and median CP values to determine what erosion rates could be reduced to given adequate cover in the forwarder trails. The minimum CP value was 0.00011. This point was characterized by having almost no bare soil with adequate cover such as bark and slash. This single change reduced the overall median erosion rate to 0.3 Mg/ha/year, with a maximum erosion rate of 0.7 Mg/ha/year, which is close to the pre-harvest (off-track) erosion rates of about 0.4 Mg/ha/year. The median CP value was 0.002, which had slightly less cover than the minimum value. This resulted in a median erosion rate of 4.3 Mg/ha/year and maximum of 10.1 Mg/ha/year. These values are much more comparable to the aforementioned tolerances and lower-impact operations such as cable yarding [2,35,83,85]. This illustrates the difference adequate soil cover makes in predicted erosion rates, especially on such extreme slopes. For this study, all bark, slash and debris were left in the field but not necessarily concentrated in the forwarder trail. However, cut-to-length harvesters have the ability to concentrate slash, bark, and other debris in the trail, abilities which have been shown to alleviate other negative soil impacts such as compaction as well [54,78,95]. Furthermore, it is possible for tethered forwarders to operate on steep slopes without wheel slippage [11], and this was evidenced by the minimal amount of rutting found. This ensures that most of the cover stays on the trail after passage. Additionally, the forwarder could redistribute slash and bark to bare areas as it picks up stems on the slope to provide full coverage. Therefore, it is possible that actual erosion rates could be much lower than predicted. Care should be taken to ensure adequate cover is left in the forwarder trails on steep slopes to minimize erosion rates.
5. Conclusions
Soil impacts resulting from the tethered logging operations overall were relatively light when compared with other steep slope ground-based methods requiring large road networks and bladed skid trails. There were no significant differences between treatments in bulk density, rut depth, or predicted erosion rates, suggesting that differences in track type, winch type, forwarder weight and the number of forwarder passes had no effect. The only significant differences found for bulk density, rut depth, and predicted erosion rates were between slope classes. Bulk density and rut depth generally decreased with increasing slope, while predicted erosion rates increased with increasing slope. Predicted erosion rates were high but could be much lower if adequate cover were ensured. Further, harvester and forwarder trails could be planned prior to harvesting to ensure that optimal routes are taken and are feasible for the operation yet reduce the total amount of area in trails. Since there were negligible increases in bulk density resulting from the operation, the forwarder trail system could be concentrated to reduce potential erosion rates further. Due to the amount of area the machine traverses, as with most other ground-based methods, it is possible that tethered logging causes more soil disturbance than cable logging or other operations requiring less machine traffic. However, both bulk density and rut depth levels compared favorably with ground-based operations on gentle terrain, revealing traction winches’ ability to allow machines to work on steep slopes as they would on flat ground. Additionally, since the forwarder operated up and down over the surface of the slopes, no mid-slope bladed roads were necessary. This may reduce overall soil disturbance compared to operations requiring mid-slope roads. Furthermore, tethering machinery reduces wheel slip and soil deformation. Thus, tethered logging may provide a viable low-impact alternative method for ground-based operations operating in steep terrain.
Author Contributions
Conceptualization, A.M.G., M.C.B., W.M.A., A.C.M. and S.M.B.; data curation, A.M.G.; formal analysis, A.M.G.; funding acquisition, M.C.B.; investigation, A.M.G., M.C.B. and A.C.M.; methodology, A.M.G. and M.C.B.; project administration, A.M.G. and M.C.B.; resources, A.M.G., M.C.B. and A.C.M.; supervision, M.C.B., W.M.A. and S.M.B.; validation, M.C.B., W.M.A. and S.M.B.; visualization, A.M.G., M.C.B., W.M.A. and S.M.B.; writing–original draft, A.M.G.; writing–review & editing, A.M.G., M.C.B., W.M.A., A.C.M. and S.M.B.
Funding
This research received funding from John Deere Construction and Forestry, and the Virginia Tech Forest Operations and Business Research Cooperative for completion of the data analysis.
Acknowledgments
All equipment including forwarders, winches, and data collection equipment was furnished by Suzano.
Conflicts of Interest
The data collection was completed by Suzano employees on study sites owned by Suzano near Guaratingutá, São Paulo, Brazil.
References
- Visser, R.; Raymond, K.; Harrill, H. Mechanising steep terrain harvesting operations. N. Z. J. For. 2014, 59, 3–8. [Google Scholar] [CrossRef]
- Worrell, W.C.; Bolding, M.C.; Aust, W.M. Potential Soil Erosion following Skyline Yarding versus Tracked Skidding on Bladed Skid Trails in the Appalachian Region of Virginia. South. J. Appl. For. 2011, 35, 131–135. [Google Scholar]
- Kirk, P.M.; Sullman, M.J.M. Heart rate strain in cable hauler choker setters in New Zealand logging operations. Appl. Ergon. 2001, 32, 389–398. [Google Scholar] [CrossRef]
- Wang, J.; Long, C.; McNeel, J. Production and cost analysis of a feller-buncher and grapple skidder in central Appalachian hardwood forests. For. Prod. J. 2004, 54, 159–167. [Google Scholar]
- Horn, R.; Vossbrink, J.; Peth, S.; Becker, S. Impact of modern forest vehicles on soil physical properties. For. Ecol. Manag. 2007, 248, 56–63. [Google Scholar] [CrossRef]
- Sessions, J.; Leshchinsky, B.; Chung, W.; Boston, K.; Wimer, J. Theoretical stability and traction of steep slope tethered feller-bunchers. For. Sci. 2017, 63, 192–200. [Google Scholar] [CrossRef]
- Heinimann, H.R. Ground-based harvesting technologies for steep slopes. In Proceedings of the International Mountain Logging and 10th Pacific Northwest Skyline Symposium, Corvallis, OR, USA, 28 March–1 April 1999; Dept of Forest Engineering, Oregon State University: Corvallis, OR, USA, 1999; pp. 1–18. [Google Scholar]
- Visser, R.; Berkett, H. Effect of terrain steepness on machine slope when harvesting. Int. J. For. Eng. 2015, 26, 1–9. [Google Scholar] [CrossRef]
- Visser, R.; Stampfer, K. Expanding ground-based harvesting onto steep terrain: A review. Croat. J. For. Eng. 2015, 36, 321–331. [Google Scholar]
- Cavalli, R. Forest operations in steep terrain. In Proceedings of the Conference CROJFE, Zagreb, Croatia, 18–20 March 2015. [Google Scholar]
- Bombosch, F.; Sohns, D.; Nollau, R.; Kanzler, D.I. Are forest operations on steep terrain (average of 70% slope inclination) with wheel mounted forwarders without slippage possible? In Proceedings of the Austro2003-Symposium: High Tech Forest Operations for Mountainous Terrain, Schlägl, Austria, 5–9 October 2003. [Google Scholar]
- Stampfer, K.; Steinmüller, T. A new approach to drive a productivity model for the harvester Valmet 911 Snake. In Proceedings of the International Mountain Logging and 11th Pacific Northwest Skyline Symposium–A Forest Engineering Odyssey, Seattle, WA, USA, 10–12 December 2001; pp. 254–262. [Google Scholar]
- Heinimann, H.R.; Stampfer, K.; Loschek, J.; Caminada, L. Perspectives on Central European Cable Yarding Systems. In Proceedings of the International Mountain Logging and 11th Northwest Pacific Skyline Symposium, Seattle, WA, USA, 10–12 October 2001; pp. 268–279. [Google Scholar]
- Raymond, K. Innovation to increase profitability of steep terrain harvesting in New Zealand. N. Z. J. For. 2012, 57, 19–23. [Google Scholar]
- Slappendel, C.; Laird, I.; Kawachi, I.; Marshall, S.; Cryer, C. Factors affecting work-related injury among forestry workers: A review. J. Saf. Res. 1993, 24, 19–32. [Google Scholar] [CrossRef]
- McKenzie, D.W.; Richardson, B.Y. Feasibility study of self-contained tether cable system for operating equipment on slopes of 20 to 75%. J. Terramech. 1978, 15, 116–127. [Google Scholar] [CrossRef]
- Hartsough, B.R.; Miles, J.A.; Gaio, C.; Frank, A.A. Cable-towed vehicles for harvesting on mountainous terrain. In Proceedings of the International Mountain Logging and Pacific Northwest Skyline Symposium, Portland, OR, USA, 1988; pp. 12–16. [Google Scholar]
- Amishev, D.; Hunt, J. Steep-slope timber-harvesting research in Western Canada. In Forest Engineering: Making a Positive Contribution. Abstracts and Proceedings of the 48th Symposium on Forest Mechanization, Linz, Austria, 4–8 October 2015; FPInnovations: Vancouver, BC, Canada, October 2015; pp. 343–351. [Google Scholar]
- Mologni, O.; Grigolato, S.; Cavalli, R. Harvesting systems for steep terrain in the Italian Alps: State of the art and future prospects. Contemp. Eng. Sci. 2016, 9, 1229–1242. [Google Scholar] [CrossRef]
- Visser, R.; Raymond, K.; Harrill, H. Developing Fully Mechanised Steep Terrain Harvesting Operations. In Proceedings of the 47th International Symposium on Forestry Mechanisation: Forest Engineering: Propelling the Forest Value Chain, Gerardmer, France, 23–26 September 2014. [Google Scholar]
- Kröger, M.; Nylund, J.-E. The conflict over Veracel pulpwood plantations in Brazil—Application of Ethical Analysis. For. Policy Econ. 2012, 14, 74–82. [Google Scholar] [CrossRef]
- Silva, R.F.; Batistella, M.; Moran, E.F. Drivers of land change: Human-environment interactions and the Atlantic forest transition in the Paraíba Valley, Brazil. Land Use Policy 2016, 58, 133–144. [Google Scholar] [CrossRef]
- Moura, A. Suzano, Guaratingutá; Personal Communication: São Paulo, Brazil, 2018. [Google Scholar]
- Holzfeind, T.; Stampfer, K.; Holzleitner, F. Productivity, setup time and costs of a winch-assisted forwarder. J. For. Res. 2018, 23, 196–203. [Google Scholar] [CrossRef]
- Evanson, T.; Amishev, D. A Steep Slope Excavator Feller Buncher. In FFR Harvesting Technical Note; Future Forests Research Ltd.: Rotorua, New Zealand, 2010; Volume 3, pp. 1–8. [Google Scholar]
- Evanson, T.; Amishev, D.; Parker, R.; Harrill, H. An Evaluation of a ClimbMAX Steep Slope Harvester in Maungataniwha Forest, Hawkes Bay; Future Forests Research Ltd.: Rotorua, New Zealand, 2013. [Google Scholar]
- Holzleitner, F.; Kastner, M.; Stampfer, K.; Höller, N.; Kanzian, C. Monitoring cable tensile forces of winch-assisted harvester and forwarder operations in steep terrain. Forests 2018, 9, 53. [Google Scholar] [CrossRef]
- Visser, R. Tension Monitoring of a Cable Assisted Machine; Harvesting Technical Note HTN05-11; Future Forests Research Ltd.: Rotorua, New Zealand, 2013. [Google Scholar]
- Tsioras, P.A.; Rottensteiner, C.; Stampfer, K. Wood harvesting accidents in the Austrian State Forest Enterprise 2000–2009. Saf. Sci. 2013, 62, 400–408. [Google Scholar] [CrossRef]
- Axelsson, S.-Ă. The mechanization of logging operations in Sweden and its effect on occupational safety and health. J. For. Eng. 1998, 9, 25–31. [Google Scholar] [CrossRef]
- Bell, J.L. Changes in logging injury rates associated with use of feller-bunchers in West Virginia. J. Saf. Res. 2002, 33, 463–471. [Google Scholar] [CrossRef]
- Amishev, D.; Hunt, J. Winch-Assist Harvester: Best Practice Manual; Special Publication SP-533; FPInnovations: Vancouver, BC, Canada, 2018. [Google Scholar]
- Edeso, J.M.; Merino, A.; Gonzalez, M.J.; Marauri, P. Soil erosion under different harvesting managements in steep forestlands from northern Spain. Land Degrad. Dev. 1999, 10, 79–88. [Google Scholar] [CrossRef]
- Laffan, M.; Jordan, G.; Duhig, N. Impacts on soils from cable-logging steep slopes in northeastern Tasmania, Australia. For. Ecol. Manag. 2001, 144, 91–99. [Google Scholar] [CrossRef]
- Megahan, W.F.; Kidd, W.J. Effects of logging and logging roads on erosion and sediment deposition from steep terrain. J. For. 1972, 70, 136–141. [Google Scholar] [CrossRef]
- Sidle, R.C.; Ziegler, A.D.; Negishi, J.N.; Nik, A.R.; Siew, R.; Turkelboom, F. Erosion processes in steep terrain—Truths, myths, and uncertainties related to forest management in Southeast Asia. For. Ecol. Manag. 2006, 224, 199–225. [Google Scholar] [CrossRef]
- McCool, D.K.; Brown, L.C.; Foster, G.R.; Mutchler, C.K.; Meyer, L.D. Revised slope steepness factor for the universal soil loss equation. Trans. ASAE 1987, 30, 1387–1396. [Google Scholar] [CrossRef]
- Visser, R.; Adams, J. Risk Management of Steep Terrain Harvesting. In Council on Forest Engineering-A Global Perspective; Council on Forest Engineering: Auburn, AL, USA, 2002. [Google Scholar]
- Vinson, J.A.; Barrett, S.M.; Aust, W.M.; Bolding, M.C. Evaluation of bladed skid trail closure methods in the ridge and valley region. For. Sci. 2017, 63, 432–440. [Google Scholar] [CrossRef]
- Kochenderfer, J. Area in skidroads, truck roads, and landings in the central Appalachians. J. For. 1977, 75, 507–508. [Google Scholar]
- Christopher, E.A.; Visser, R. Methodology for evaluating post harvest erosion risk for the protection of water quality. N. Z. J. For. 2007, 52, 20–25. [Google Scholar]
- Wade, C.R.; Bolding, M.C.; Aust, W.M.; Lakel, W.A., III. Comparison of five erosion control techniques for bladed skid trails in Virginia. South. J. Appl. For. 2012, 36, 191–197. [Google Scholar] [CrossRef]
- Bettinger, P.; Kellogg, L.D. Residual stand damage from cut-to-length thinning of second-growth timber in the Cascade Range of western Oregon. For. Prod. J. 1993, 43, 59–64. [Google Scholar]
- Eliasson, L.; Wästerlund, I. Effects of slash reinforcement of strip roads on rutting and soil compaction on a moist fine-grained soil. For. Ecol. Manag. 2007, 252, 118–123. [Google Scholar] [CrossRef]
- Parkhurst, B.M.; Aust, W.M.; Bolding, M.C.; Barrett, S.M.; Carter, E.A. Soil response to skidder trafficking and slash application. Int. J. For. Eng. 2018, 29, 31–40. [Google Scholar] [CrossRef]
- Eisenbies, M.H.; Burger, J.A.; Aust, W.M.; Patterson, S.C. Soil physical disturbance and logging residue effects on changes in soil productivity in five-year-old pine plantations. Soil Sci. Soc. Am. J. 2005, 69, 1833–1843. [Google Scholar] [CrossRef]
- Agherkakli, B.; Najafi, A.; Sadeghi, S.H. Ground based operation effects on soil disturbance by steel tracked skidder in a steep slope of forest. J. For. Sci. 2010, 56, 278–284. [Google Scholar] [CrossRef]
- Sakai, H.; Nordfjell, T.; Suadicani, K.; Talbot, B.; Bøllehuus, E. Soil compaction on forest soils from different kinds of tires and tracks and possibility of accurate estimate. Croat. J. For. Eng. 2008, 29, 15–27. [Google Scholar]
- Peel, M.C.; Finlayson, B.L.; McMahon, T.A. Updated world map of the Köppen-Geiger climate classification. Hydrol. Earth Syst. Sci. 2007, 11, 1633–1644. [Google Scholar] [CrossRef]
- ArcGis. Brazilian States; Esri: Relands, CA, USA, 2015. [Google Scholar]
- Esri. World Countries (Generalized); Esri: Redlands, CA, USA, 2017. [Google Scholar]
- Eliasson, L. Effects of forwarder tyre pressure on rut formation and soil compaction. Silva Fenn. 2005, 39, 549–557. [Google Scholar] [CrossRef]
- Taartila, S. Taking the environment into account when designing forest machinery. In Soil, Tree, Machine Interactions Seminar; Soil, Tree, Machine Interactions Seminar: Feldafing, Germany, 1994; pp. 1–5. [Google Scholar]
- Han, H.-S.; Page-Dumroese, D.; Han, S.K.; Tirocke, J. Effects of slash, machine passes, and soil moisture on penetration resistance in a cut-to-length harvesting. Int. J. For. Eng. 2006, 17, 11–24. [Google Scholar] [CrossRef]
- ISO, HRN. Soil Quality—Determination of Dry Bulk Density; Croatian Standards Institute: Zagreb, Croatia, 2017. [Google Scholar]
- Reynolds, S.G. The gravimetric method of soil moisture determination Part 1A: Study of equipment, and methodological problems. J. Hydrol. 1970, 11, 258–273. [Google Scholar] [CrossRef]
- Dissmeyer, G.; Foster, G. A Guide for Predicting Sheet and Rill Erosion on Forest Land; USDA Forest Service: Atlanta, GA, USA, 1980. [Google Scholar]
- Lombardi Neto, F.; Moldenhauer, W.C. Rainfall erosivity: Its distribution and relationship with soil loss at Campinas, state of São Paulo, Brazil. Bragantia 1992, 51, 189–196. [Google Scholar] [CrossRef]
- Thien, S.J. A flow diagram for teaching texture-by-feel analysis. J. Agron. Educ. 1979, 8, 54–55. [Google Scholar]
- Shapiro, S.S.; Wilk, M.B. An analysis of variance test for normality (complete samples). Biometrika 1965, 52, 591–611. [Google Scholar] [CrossRef]
- SAS Inc. JMP Pro 14; SAS Institute Inc.: Cary, NC, USA, 1989–2019; 2018. [Google Scholar]
- Owende, P.M.O.; Lyons, J.; Haarlaa, R.; Peltola, A.; Spinelli, R.; Molano, J.; Ward, S.M. Operations Protocol for Eco-Efficient Wood Harvesting on Sensitive Sites; Ecowood Partnership, 2002; pp. 1–74. [Google Scholar]
- Brais, S.; Camiré, C. Soil compaction induced by careful logging in the claybelt region of northwestern Quebec (Canada). Can. J. Soil Sci. 1998, 78, 197–206. [Google Scholar] [CrossRef]
- Najafi, A.; Solgi, A.; Sadeghi, S.H. Soil disturbance following four wheel rubber skidder logging on the steep trail in the north mountainous forest of Iran. Soil Tillage Res. 2009, 103, 165–169. [Google Scholar] [CrossRef]
- Jamshidi, R.; Jaeger, D.; Raafatnia, N.; Tabari, M. Influence of two ground-based skidding systems on soil compaction under different slope and gradient conditions. Int. J. For. Eng. 2008, 19, 9–16. [Google Scholar] [CrossRef]
- Ares, A.; Terry, T.A.; Miller, R.E.; Anderson, H.W.; Flaming, B.L. Ground-based forest harvesting fffects on soil physical properties and Douglas-fir growth. Soil Sci. Soc. Am. J. 2005, 69, 1822–1832. [Google Scholar] [CrossRef]
- Froese, K. Buk Density, Soil Strength, and Soil Disturbance Impacts from a Cut-to-Length Harvest Operation in North Central Idaho. Ph.D. Thesis, University of Idaho, Moscow, Idaho, 2004. [Google Scholar]
- Gomez, A.; Powers, R.F.; Singer, M.J.; Horwath, W.R. Soil compaction effects on growth of young ponderosa pine following litter removal in California’s Sierra Nevada. Soil Sci. Soc. Am. J. 2002, 66, 1334–1343. [Google Scholar] [CrossRef]
- Powers, R.F.; Scott, D.A.; Sanchez, F.G.; Voldseth, R.A.; Page-Dumroese, D.; Elioff, J.D.; Stone, D.M. The North American long-term soil productivity experiment: Findings from the first decade of research. For. Ecol. Manag. 2005, 220, 31–50. [Google Scholar] [CrossRef]
- Solgi, A.; Najafi, A. The impacts of ground-based logging equipment on forest soil. J. For. Sci. 2014, 60, 28–34. [Google Scholar] [CrossRef]
- Carter, E.; Rummer, R.B.; Stokes, B. Site disturbances associated with alternative prescriptions in an upland hardwood forest of northern Alabama. In Proceedings of the 1997 ASAE [American Society of Agricultural Engineers] Annual International Meeting, Minneapolis, MN, USA, 10–14 August 1997. [Google Scholar]
- Landsberg, J.; Miller, R.; Anderson, H.; Tepp, J. Bulk Density and Soil Resistance to Penetration as Affected by Commercial Thinning in Northeastern Washington; Res. Pap. PNW-RP-551; US Department of Agriculture, Forest Service, Pacific Northwest Research Station: Portland, OR, USA, 2003; p. 551. [Google Scholar]
- McNabb, D.H.; Startsev, A.D.; Nguyen, H. Soil wetness and traffic level effects on bulk density and air-filled porosity of compacted boreal forest soils. Soil Sci. Soc. Am. J. 2001, 65, 1238–1247. [Google Scholar] [CrossRef]
- Wallbrink, P.J.; Roddy, B.P.; Olley, J.M. A tracer budget quantifying soil redistribution on hillslopes after forest harvesting. Catena 2002, 47, 179–201. [Google Scholar] [CrossRef]
- Wang, L. Assessment of animal skidding and ground machine skidding under mountain conditions. J. For. Eng. 1997, 8, 57–64. [Google Scholar] [CrossRef]
- Bezkorowajnyj, P.G.; Gordon, A.M.; McBride, R.A. The effect of cattle foot traffic on soil compaction in a silvo-pastoral system. Agrofor. Syst. 1993, 21, 1–10. [Google Scholar] [CrossRef]
- Martínez, L.J.; Zinck, J.A. Temporal variation of soil compaction and deterioration of soil quality in pasture areas of Colombian Amazonia. Soil Tillage Res. 2004, 75, 3–18. [Google Scholar] [CrossRef]
- McDonald, T.P.; Seixas, F. Effect of Slash on Forwarder Soil Compaction. J. For. Eng. 1997, 8, 15–26. [Google Scholar]
- Picchio, R.; Neri, F.; Petrini, E.; Verani, S.; Marchi, E.; Certini, G. Machinery-induced soil compaction in thinning two pine stands in central Italy. For. Ecol. Manag. 2012, 285, 38–43. [Google Scholar] [CrossRef]
- Powers, R.F.; Tiarks, A.E.; Boyle, J.R. Assessing soil quality: Practicable standards for sustainable forest productivity in the United States. In Criteria and Indicators of Soil Quality for Sustainable Forest Productivity. Special Publication 53 of the Soil Science Society of America; Davidson, E.A., Ed.; Soil Science Society of America: Madison, WA, USA, 1998. [Google Scholar]
- Daddow, R.; Warrington, G. Growth-Limiting Soil Bulk Densities as Influenced by Soil Texture; USDA Forest Service: Fort Collins, CO, USA, 1983. [Google Scholar]
- Seixas, F.; McDonald, T. Soil compaction effects of forwarding and its relationship with 6- and 8-wheel machines. For. Prod. J. 1997, 47, 46–52. [Google Scholar]
- Oliveira, A.; Silva, M.; Curi, N.; Avanzi, J.C.; Neto, G.K.; Araújo, E.F. Water erosion in soils under eucalyptus forest as affected by development stages and management systems. Ciência e Agrotecnologia 2013, 37, 159–169. [Google Scholar] [CrossRef]
- Oliveira, P.T.S.; Wendland, E.; Nearing, M.A. Rainfall erosivity in Brazil: A review. Catena 2013, 100, 139–147. [Google Scholar] [CrossRef]
- Silva, M.A.; Silva, M.L.N.; Curi, N.; Oliveira, A.H.; Avanzi, J.C.; Norton, L.D. Water Erosion Risk Prediction in Eucalyptus Plantations. Ciência e Agrotecnologia 2014, 38, 160–172. [Google Scholar] [CrossRef]
- Ali, S.A.; Hagos, H. Estimation of soil erosion using USLE and GIS in Awassa Catchment, Rift valley, Central Ethiopia. Geoderma Regional 2016, 7, 159–166. [Google Scholar] [CrossRef]
- Kitahara, H.; Okura, Y.; Sammori, T.; Kawanami, A. Application of universal soil Loss equation (USLE) to mountainous forests in Japan. J. For. Res. 2000, 5, 231–236. [Google Scholar] [CrossRef]
- Myronidis, D.I.; Emmanouloudis, D.A.; Mitsopoulos, I.A.; Riggos, E.E. Soil erosion potential after fire and rehabilitation treatments in Greece. Environ. Model. Assess. 2009, 15, 239–250. [Google Scholar] [CrossRef]
- Wischmeier, W.H.; Smith, D.D. A Universal Equation for Predicting Rainfall-Erosion Losses-An Aid to Conservation Farming in Humid Regions; Agr. Res. Serv. ARS Special Report; U.S. Agricultural Research Service, US Department of Agriculture: Washington, DC, USA, 1961; pp. 22–66. [Google Scholar]
- Wade, C.R.; Bolding, M.C.; Aust, W.M.; Lakel, W.A., III; Schilling, E.B. Comparing sediment trap data with the USLE-Forest, RUSLE2, and WEPP-Road erosion models for evaluation of bladed skid trail BMPs. Am. Soc. Agric. Biol. Eng. 2012, 55, 403–414. [Google Scholar]
- Sawyers, B.C.; Bolding, M.C.; Aust, W.M.; Lakel, W.A. Effectiveness and implementation costs of overland skid trail closure techniques in the Virginia Piedmont. J. Soil Water Conserv. 2012, 67, 300–310. [Google Scholar] [CrossRef]
- Dumas, P.; Printemps, J. Assessment of soil erosion using USLE model and GIS for integrated watershed and coastal zone management in the South Pacific Islands. In Proceedings of the Interpraevent, International Symposium in Pacific Rim, Taipei, Taiwan, 26–30 April 2010; pp. 856–866. [Google Scholar]
- Hart, G.E. Erosion from simulated rainfall on mountain rangeland in Utah. J. Soil Water Conserv. 1984, 39, 330–334. [Google Scholar]
- Vinson, J.A.; Barrett, S.M.; Aust, W.M.; Bolding, M.C. Suitability of soil erosion models for the evaluation of bladed skid trail BMPs in the Southern appalachians. Forests 2017, 8, 482. [Google Scholar] [CrossRef]
- Labelle, E.R.; Jaeger, D. Quantifying the use of brush mats in reducing forwarder peak loads and surface contact pressures. Croat. J. For. Eng. 2012, 33, 249–274. [Google Scholar]


© 2019 by the authors. Licensee MDPI, Basel, Switzerland. This article is an open access article distributed under the terms and conditions of the Creative Commons Attribution (CC BY) license (http://creativecommons.org/licenses/by/4.0/).