Article

Radial Growth Responses to Climate of Pinus yunnanensis at Low Elevations of the Hengduan Mountains, China

1
State Key Laboratory of Water Environment Simulation, School of Environment, Beijing Normal University, Beijing 100875, China
2
Department of Physical Geography, Stockholm University, 10691 Stockholm, Sweden
3
Institute of Environmental and Ecological Engineering, Guangdong University of Technology, Guangzhou 510006, China
4
School of Geography and Ocean Science, Nanjing University, Nanjing 210023, China
5
Baltic Sea Centre, Stockholm University, 10691 Stockholm, Sweden
*
Author to whom correspondence should be addressed.
Forests 2020, 11(10), 1066; https://doi.org/10.3390/f11101066
Submission received: 28 August 2020 / Revised: 29 September 2020 / Accepted: 30 September 2020 / Published: 1 October 2020
(This article belongs to the Section Forest Ecophysiology and Biology)

Abstract

:
The relationship between climate and forest is critical to understanding the influence of future climate change on terrestrial ecosystems. Research on trees at high elevations has uncovered the relationship in the Hengduan Mountains region, a critical biodiversity hotspot area in southwestern China. The relationship for the area at low elevations below 2800 m a.s.l. in the region remains unclear. In this study, we developed tree ring width chronologies of Pinus yunnanensis Franch. at five sites with elevations of 1170–1725 m in this area. Monthly precipitation, relative humidity, maximum/mean/minimum air temperature and the standardized precipitation evapotranspiration index (SPEI), a drought indicator with a multi-timescale, were used to investigate the radial growth-climate relationship. Results show that the growth of P. yunnanensis at different sites has a similar response pattern to climate variation. Relative humidity, precipitation, and air temperature in the dry season, especially in its last month (May), are critical to the radial growth of trees. Supplemental precipitation amounts and reduced mean or maximum air temperature can promote tree growth. The high correlations between chronologies and SPEI indicate that the radial growth of trees at the low elevations of the region is significantly limited by the moisture availability. Precipitation in the last month of the previous wet season determines the drought regime in the following dry seasons. In spite of some differences in the magnitudes of correlations in the low-elevation area of the Hengduan Mountains region, chronologies generally matched well with each other at different elevations, and the differences are not evident with the change in elevation.

1. Introduction

Future climate change is likely to influence the productivity of the world’s vegetation. In the context of global warming [1], vegetation in different latitudes and categories of assimilation varies in the magnitude and direction of their responses to climate variation [2,3]. Understanding the complex relationship between climate variation and vegetation dynamics is important to anticipating the potential influence of future climate change on terrestrial ecosystems [4], especially for biologically rich regions on Earth.
The Hengduan Mountains region is one of the world’s critical biodiversity hotspots [5,6] and one of the major carbon sinks of forest vegetation in China [7]. Due to the huge difference of elevations and complex climatic environment, the region possesses comprehensive vegetation types from evergreen broad-leaf forest in dry valleys to alpine scree vegetation close to snowlines, distributed in certain elevations ranging from less than 1000 to more than 4500 m a.s.l. [8,9]. Therefore, the region is an ideal place for researchers to study the responses of vegetation to the climate change. Generally, the mean net primary productivity of the region has increased in the last two decades, and climate change accounts for 8–18% of the total variation of productivity [10,11]. Considering the heterogeneous landscape of the region, the change of productivity is spatially unbalanced within the Hengduan Mountains region [12]. This response of vegetation dynamics to future climate change might be more complex [13], as the possible leading climatic factors vary in different parts of the region [14]. Therefore, it is essential to further explore the relationship between climate variation and vegetation dynamics in this region.
Tree ring is an important tool to assess climate variations and the dynamics of a forest ecosystem [15,16]. The radial growth of trees in high and low elevations is generally more sensitive to air temperature and moisture availability, respectively, by tree ring-based research [17], which is more evident in the Hengduan Mountains [18,19,20,21]. The trees in alpine and subalpine areas above 2800 m a.s.l of the Hengduan Mountains region have attracted much attention for their responses of radial growth to climate variation. Research shows that reduced temperature in previous winters suppressed radial increment in the next growing season and that tree growth was not sensitive to the variation of precipitation [21,22,23,24,25,26,27,28]. Increased temperature during the current wet or growth season is another beneficial factor for tree radial growth in the high-elevation areas of this region [23,29,30,31,32]. The response pattern of temperature and precipitation is relevant to the humid habitat with low temperature in high-elevation areas. Other studies compared responses at different elevations above 2800 and found that the tree growth at the lower sites was mainly affected by moisture availability in spring [33,34,35].
However, the response of tree growth to climate in the vast area below 2800 m remains unclear. The area occupies 22% of the entire Hengduan Mountains region and its characteristics of climate condition differ from those in alpine and subalpine areas. Unlike that at the high-elevation areas, vegetation in the low-elevation area grows in a warm environment and more easily suffers climatic drought. Dry valleys are commonly spread in the low-elevation areas of the Hengduan Mountains region, especially in deep valleys. The dry valleys are dominated by drought-resistant savanna and succulent thorn shrub vegetation [36]. Therefore, the climate and vegetation in the low-elevation area are significantly different from that of its adjoining alpine and subalpine areas. Considering this difference, the response of tree growth to climate change might be different in the low-elevation areas. Nonetheless, the tree growth response to climate at low elevations has not been paid much attention. References [21,30,33] analyzed responses at elevations higher than 2800 m and based on their findings related to elevations, they inferred that tree radial increments in low elevation areas of the Hengduan Mountains region should be limited by water availability. However, the inference has not been verified in the field.
We aimed to study the response of tree radial growth to climate variation in the low-elevation area of the Hengduan Mountains region and try to determine whether the responses were elevation dependent. We sampled Pinus yunnanensis Franch., a conifer commonly spread in southwestern China, at five sites in the valleys. Climatic signals of the tree rings were extracted to establish five tree ring-width chronologies. The growth-climate relationship was studied by the correlation analysis and verified by multi-source meteorological data. We finally discussed the potential mechanism forcing the response.

2. Materials and Methods

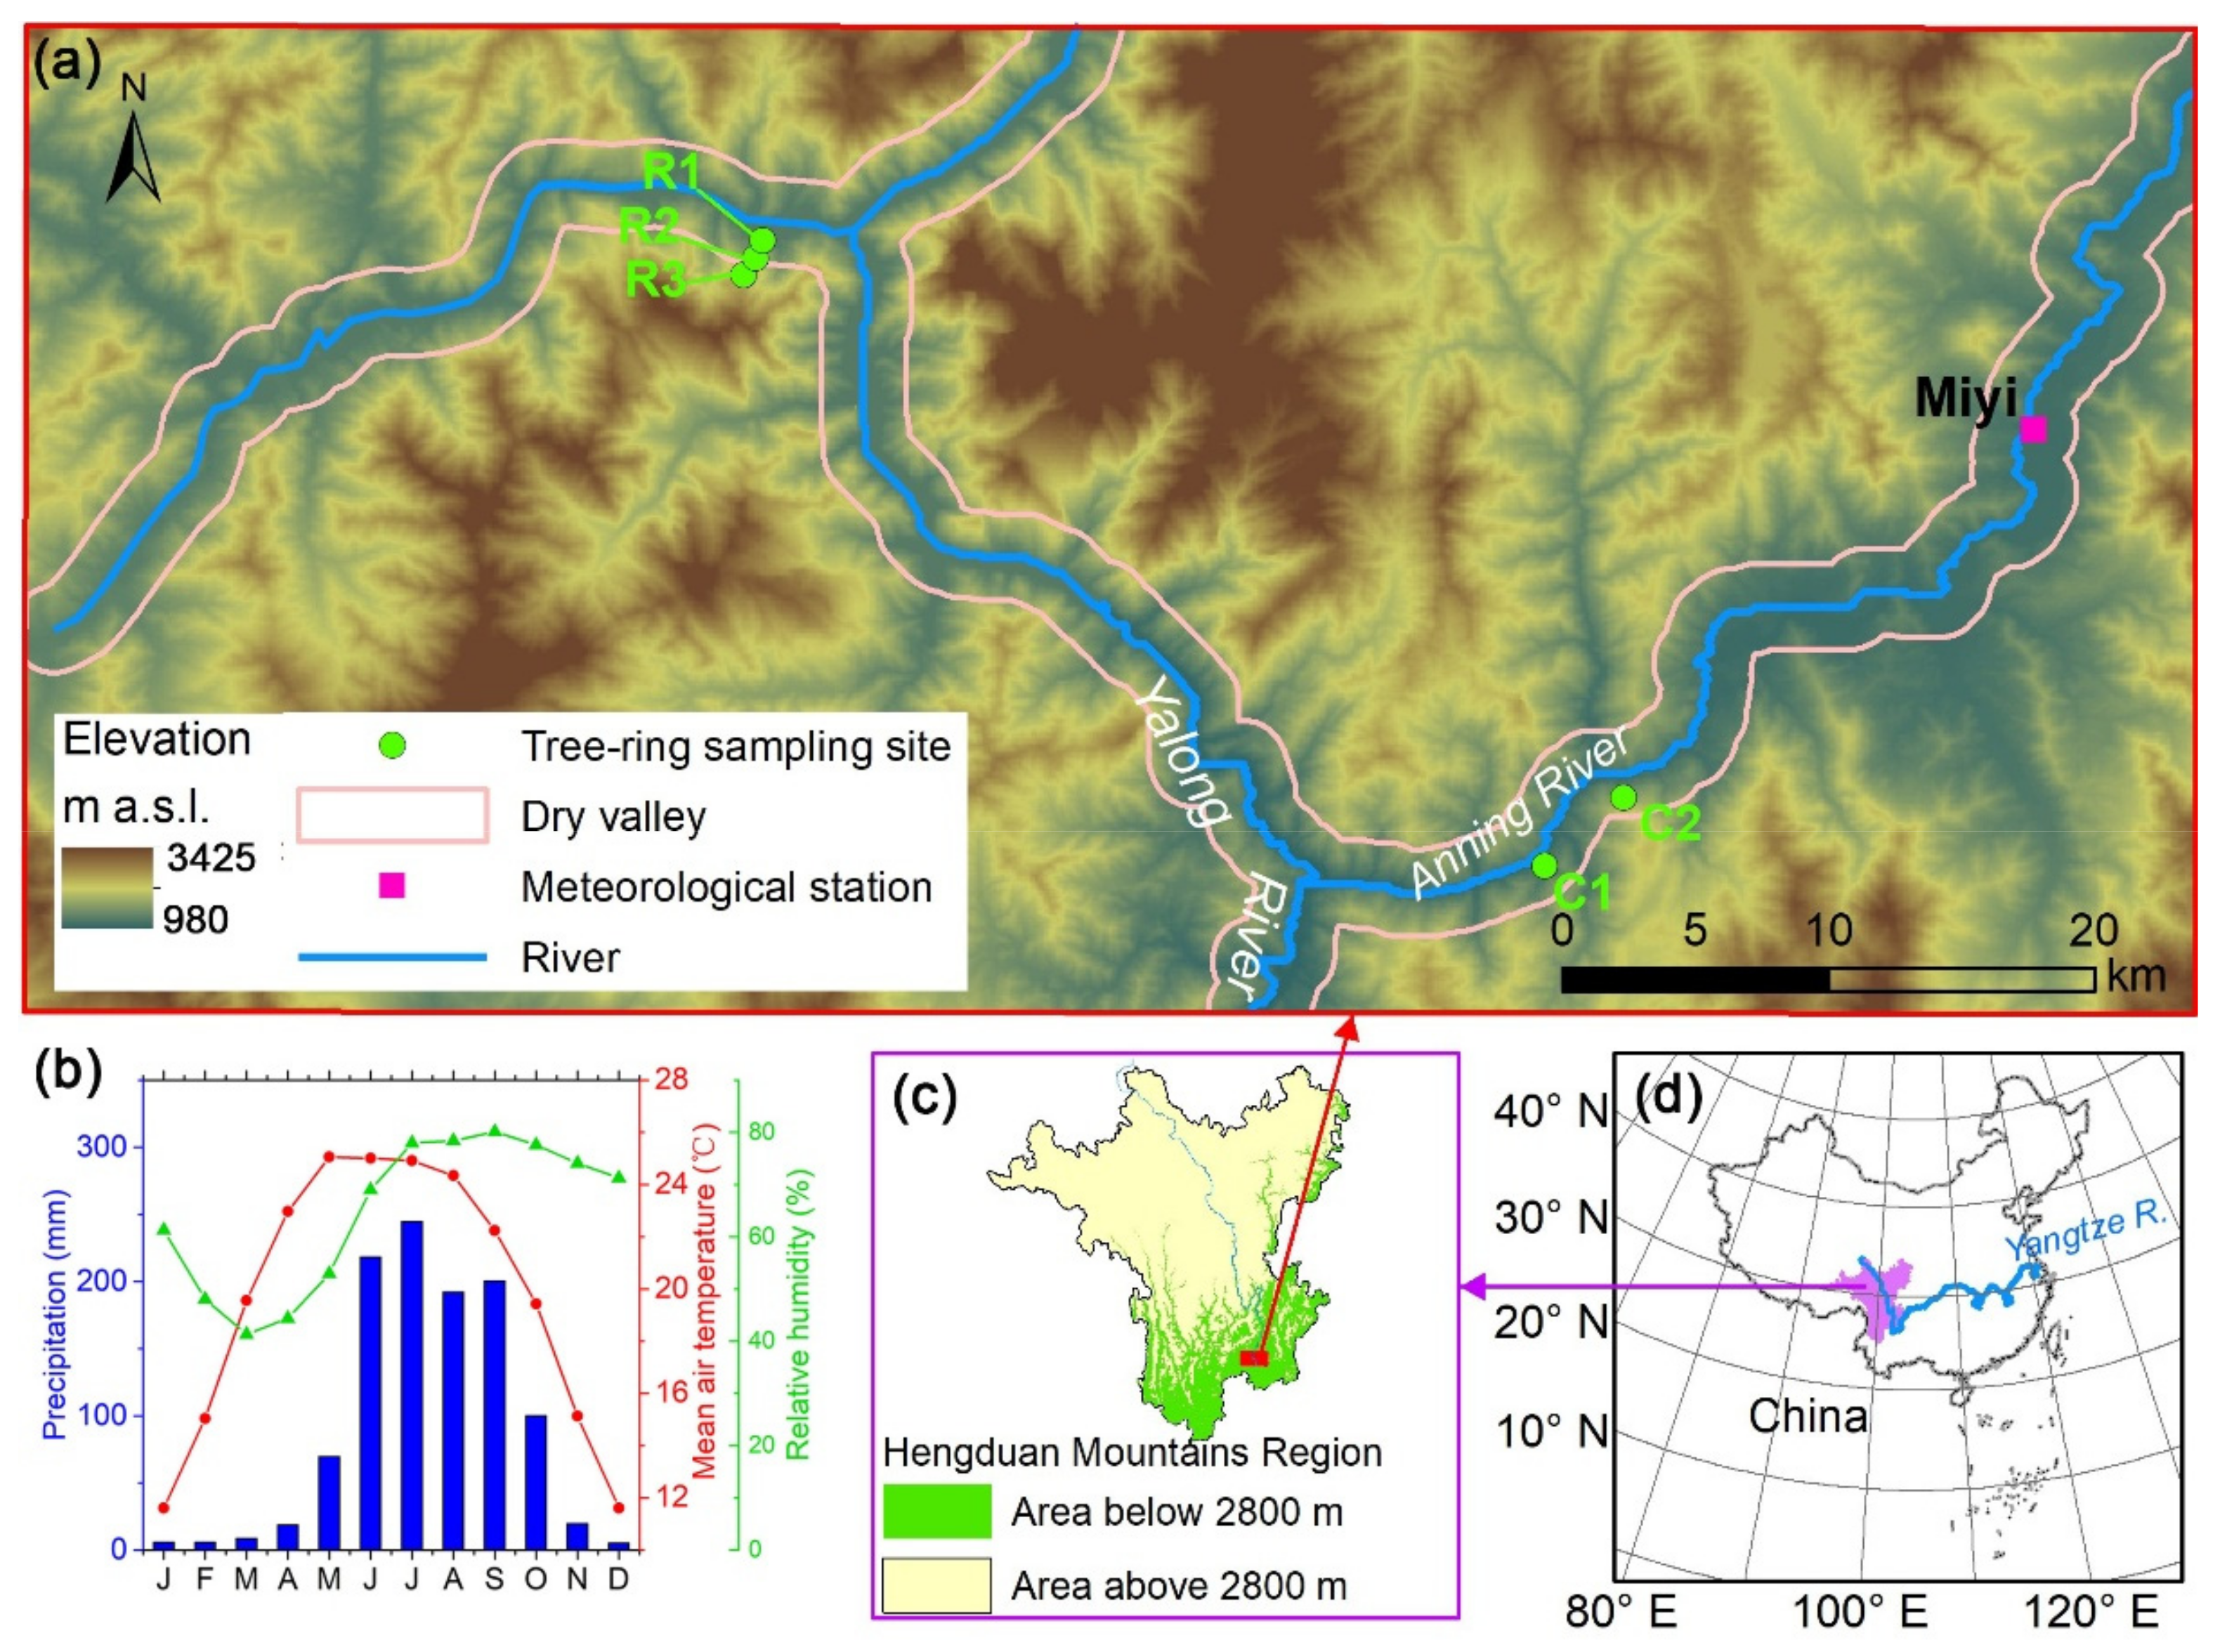
2.1. Overview of the Study Area

The sampling sites are located in valleys of the southern Hengduan Mountains region (Figure 1). The “dry valleys” are the bottom part of the valleys, the upper boundaries of which are between 200 and 300 m above the water surface of the river in our study area [37]. Although southwestern China is humid overall, the dry valleys are semiarid. Precipitation amounts in the bottoms of the valleys are much less than those on the tops of the valleys [38]. The low parts of valleys are dry and warm during the dry season (from November to May) and wet and hot during the wet season (from June to October) [39]. According to the 0.5° × 0.5° grid dataset of the Climatic Research Unit (CRU) TS v. 4.02, from 1965 to 2017 [40], the annual mean temperature and amount of precipitation in the area of Figure 1a were 19.9 °C and 1086 mm, respectively.

2.2. Sampling Sites, Tree Rings, and Meteorological Data

The target tree, Pinus yunnanensis Franch., is commonly found between 600 and 2100 m a.s.l. in Yunnan and western Sichuan Province, China [41]. Since non-climatic factors can affect tree radial growth [15], we chose communities of P. yunnanensis growing in similar natural conditions far away from human disturbances and unaffected by pests and wildfires. We selected five tree ring sampling sites at different locations (Figure 1a). Three sites (R1–R3) with an elevation gradient of 200–300 m are located in the same slope near the Ertan reservoir, which has been impounded since 1998. Two sites (C1 and C2) with different elevations are located far away from the reservoir in the dry valley of Anning River, a tributary of the Yalong River. The slope aspects for these five sites are north facing (i.e., north or northeast, Table 1). Our previous study indicated that, with the exception of a pulse effect at site R1–R3 during the period from 2000 to 2002, tree growth at the study sites has not been influenced by the reservoir impoundment [42,43]. Therefore, any climatic influence from the reservoir on tree radial growth can be considered negligible.
Field and laboratory work was conducted according to standard dendrochronology procedures [44]. At each site, 15 to 24 trees were sampled. Two cores of each tree were extracted by increment borer at 1.3 m above ground [45]. The cores were mounted, dried and sanded in the laboratory [46]. The width of each tree ring was measured under a microscope with the LINTAB system. Cross-dating was performed by comparing all the tree ring width variation patterns from a single site. The program COFECHA was used to check and verify the dating results [47,48]. Raw width series were generated for each tree by averaging the widths from the two cores of each tree.
Tree radial growth can be influenced by many factors, including age-related growth trend, climate-related signals, endogenous and exogenous disturbances, and largely unexplained interannual variability [15]. The age-related growth trend can be estimated using a detrending function. After a comprehensive comparison of commonly used functions such as age-dependent spline and Hugershoff, we decided to use a negative exponential/linear function. This residual method was used in conjunction with initial power transformation to avoid ratio bias problems [49]. The non-climatic signals can be removed to a large degree by averaging all individual residual tree ring width series. The resulting index series were merged to develop a bi-weight robust mean tree ring width chronology, and the Rbar weighted method was applied to stabilize the variance of chronology [50]. Finally, we selected the time span for each chronology with a threshold value of express population signals (EPS) of 0.85. Here, we define the resulting index series as “raw series” and its new series calculated by the first difference as the “first difference series”.
The closest meteorological station, Miyi, was used for the analysis of the relationship between the tree growth and climate. Miyi is a ground station and is located in the bottom of a dry valley (1137 m). The instrumental period from January 1979 to December 2016 was selected for analysis. Monthly data including the amount of precipitation (P), the mean/maximum/minimum air temperature (Ta/Tmax/Tmin) and the mean relative humidity (RH) were obtained from the station. To validate the reliability of the data in station Miyi, we also extracted the CRU grid data during the same period, including the three variables of air temperature and the variable of the precipitation amount. The CRU grid covering the tree ring sampling site was labeled as Grid1. Two more ground stations, Huaping (1231 m) and Huili (1787 m), were also used to verify the reliability. Both stations are located at the bottom of valleys and their elevations are close to the elevation ranges of tree ring sites. The locations of the grid and ground stations can be seen in the Supplementary Materials (Figure S2). Only the time, including months and seasons, when the growth-climate relationship was found to be significant at station Miyi, will be selected for validation. Our tree ring width data before detrending were uploaded to the NOAA National Centers for Environmental Information—Paleoclimatology Data website with site codes CHIN076-CHIN080 (https://www.ncdc.noaa.gov/data-access/paleoclimatology-data).

2.3. Methods of Growth—Climate Relationship Analysis

The growth-climate relationship was studied by Pearson’s correlation analysis between tree ring width chronologies and meteorological data. A correlation analysis was conducted using meteorological variables (i.e., P, Ta, Tmax, Tmin and RH) from previous May to current October, labeled as p5…c10, as well as during the dry and wet seasons. To remove the pseudo correlation caused by the trend of the previous year, the first difference of chronologies and first difference of meteorological data were also correlated. We used the standardized precipitation evapotranspiration index (SPEI) with timescales of 1, 3 and 6 months to identify the impacts of climatic drought [51] on tree growth and to investigate the comprehensive influence of temperature, precipitation and humidity. SPEI is a commonly used indicator for measuring climatic drought by multi-timescale which is important because drought in a month is the cumulative result of soil water deficit in previous months [51]. The potential evapotranspiration in SPEI was calculated by the Penman—Monteith equation [52] in R program using the meteorological data from station Miyi. To remove the disturbance of sample sizes, all the calculations in this study were focused on a common period i.e., 1979–2016.

3. Results and Discussion

3.1. Characteristics of Tree Ring Chronologies

Five detrended chronologies of tree ring width were developed (Figure 2). The reliable time (EPS > 0.85) spans from 1972 to 2017. During their common period, 1979–2016, the correlations between the chronologies of sites R3 and C1 almost reached a significant level (r = 0.30, p = 0.06 for the raw series; r = 0.31, p = 0.06 for the first difference series; Table 2), which was attributable to the two sites having the furthest vertical distance. Except for the combination of R3 and C1, the correlations among the tree ring width chronologies of different sites shared a high degree of coherence in their raw and first difference series (r ≥ 0.41, p < 0.01, Table 2). The sensitivity ranges from 0.288 to 0.411 (Table 1), indicating that the tree growth was sensitive to the climate variation. The inter-correlations of raw series are between 0.48 and 0.73, implying strong common signals in the samples.

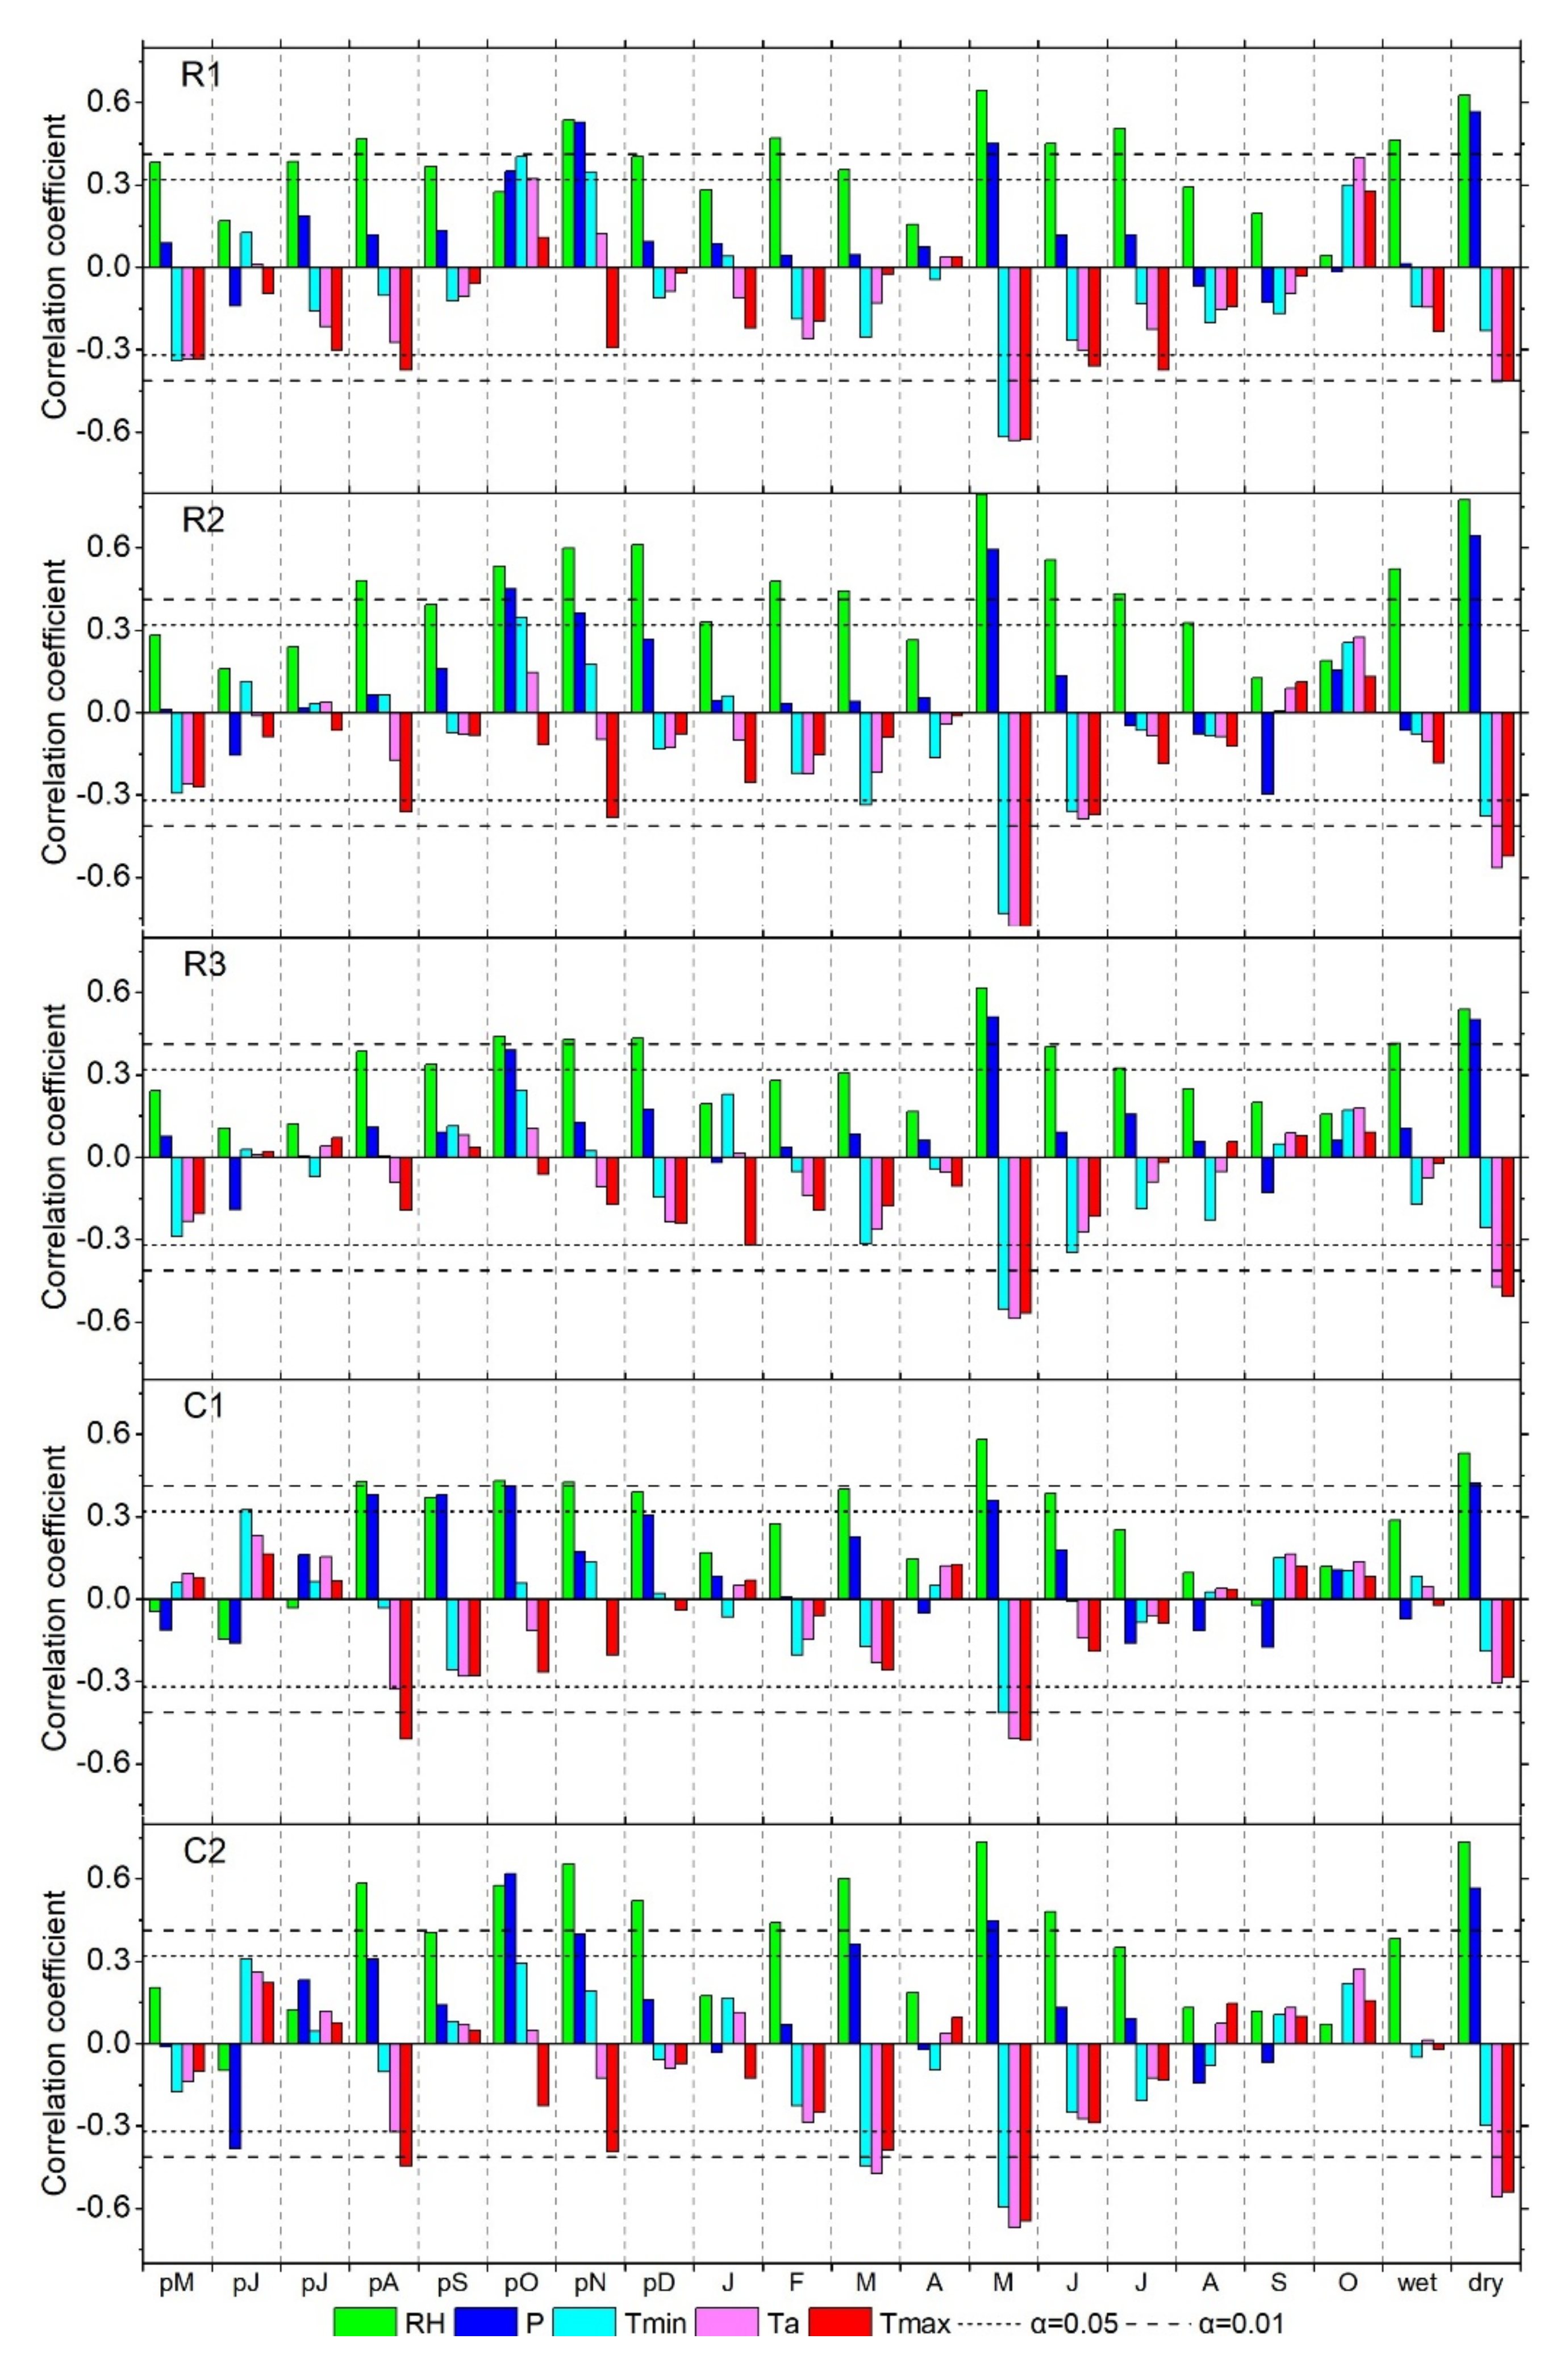
3.2. Tree Growth—Climate Relationship

Tree growth and climatic factors can be reflected by the analysis of correlation between the tree ring width chronology and the climatic factor. The correlation coefficients of the raw series (Figure 3) with climatic factors are larger than that of the first difference series (Figure S1). Generally, both correlation coefficients are very similar in terms of relative magnitudes among months and seasons for each site. For relative humidity, the correlations are significantly positive in May, the dry season and the previous autumn (from the previous September to November; r > 0.41, p < 0.01). The tree growth was positively and significantly correlated to precipitation in the previous October, current May and the dry season (r > 0.32, p < 0.05). Tree growth shows negative and significant correlation with the three temperature variables in May (r > 0.32, p < 0.05). For air temperature in the dry season, raw series perform higher correlations than their first difference series. Among the three temperature factors, mean air temperature has the highest correlation with chronology, followed by the maximum and minimum air temperature, respectively. These responses indicate that the radial increments of P. yunnanensis at all sites are evidently limited by moisture availability [33].
SPEI with the timescale of 6 months shows the strongest relationship with tree radial growth (Figure 4), which is in concert with the time spans of dry and wet seasons and the same as in our previous finding that SPEI with a timescale of 6 months is optimal to measure the drought regime in dry valleys [42]. Regardless of the SPEI timescale used, the number reaching significant correlations (p < 0.05) between the five tree ring chronologies and each SPEI during the period p10–12 is much more than that of the correlations with precipitation and air temperature. In addition, the correlation coefficients of the chronologies with SPEI are evidently higher than those of the single variable of precipitation and temperature. SPEI is an integrated indicator influenced by both precipitation and temperature [51]. These results provide further evidence that the radial growth of P. yunnanensis is severely affected by moisture availability, especially in May and the dry season.
Moisture availability is the main factor limiting tree growth in the low-elevation area of the Hengduan Mountains region, which is in agreement with previous work at high-altitude sites above 2800 m. Studies at elevations between 2800 and 3700 m in the Hengduan Mountains region reported that tree growth was limited by moisture availability during spring or dry seasons [18,19,20,33,34,35,53]. Our results are also in agreement with a study on the growth-climate relationships of conifers in the dry valleys of the Alps [54]. This implies that although low-elevation areas have a unique climate, trees in the Hengduan Mountains have growth responses similar to the trees in the high-elevation areas. Nevertheless, this conclusion is not applicable for elevations higher than 3700 m to timberlines (~4500 m) where no similar response can be found and most of the tree growth will benefit from warming in winter or the dry season [21,22,24].
We validated the response of tree growth to climate using other series from ground meteorological stations, Huili and Huaping, and the grid dataset CRU. For validation, we selected the variables that correlated well with the tree ring chronologies at station Miyi, i.e., the precipitation amount in the previous October, current May and dry season, and mean air temperature in May. The data from Huili, Huaping and CRU grid are highly in coherence with that from station Miyi (r > 0.76, p < 0.001; Table S1). In terms of the growth-climate relationship, the correlation coefficients from these sources correspond quite well with those from station Miyi (150/160 reach p < 0.05; Table S2). These findings indicate that the data from station Miyi are reliable and provide further support for the stable relationship between tree growth and climate.
Tree growth shows the highest correlations with all meteorological variables of May (p < 0.01, Figure 3). In the month of May, temperature is the highest and the precipitation amount is still low within a year in the dry valleys (Figure 1b). The following month is the beginning of the wet season, thereby the climate condition of May will affect the soil moisture condition and the consequent vegetation growth. The last month of the previous wet season (previous October) also plays an important role in the time-lagged effect [33]. Since drought happens due to the accumulation of soil water deficit [51], we focus on the six month period after previous October (i.e., from previous October to current March, p10–c3; the light yellow area in Figure 4) corresponding to the longest timescale of SPEI in this article. For SPEI with timescales of 1, 3 and 6 months, most correlations (11/15) during the period p10–c3 reached significant levels in previous October, previous December and current March, respectively (r > 0.41, p < 0.01, Figure 4). The beginning months of these three timescales all point to the month of the previous October, or the last month of the previous wet season when precipitation was significantly and positively correlated with tree radial growth. Therefore, the amount of precipitation in the last months of the previous wet season is critical to influencing drought regime in the following dry seasons.
Current physiological findings can explain the response patterns in the low elevation area of the Hengduan Mountains region. Tree growth in the Hengduan Mountains region suffers drought stress during the dry season before the onset of rain brought by monsoons [18]. A dry season with more moisture availability can increase soil moisture and alleviate drought stress, ultimately increasing radial growth. Increased temperature during the dry season will enhance plant respiration and reduce carbohydrate reserves [26]. This time-lagged effect has been observed in tree ring studies of the Hengduan Mountains region [29,33]. Reduced precipitation amount and increased temperature in May significantly suppress the tree radial growth. May is the last month of the dry season, and after May the rainy season is synchronous with the bud and leaf expansion [26]. Increased water availability will substantially favor the radial growth of trees. Precipitation in the last month of the wet season is another critical factor limiting radial growth. One possible explanation is that dry conditions can reduce the accumulation of carbohydrate reserves by limiting photosynthesis [33] and can reduce soil water content by increasing the drought regime in later dry season. P. yunnanensis is a light-loving species [41], but we found that most communities in the valleys are located in north-facing slopes with less light. This phenomenon is likely to be related to the climatic forcing from the drier and warmer environment of the valleys which drives P. yunnanensis to select habitats that can reduce the drought stress and accumulate more carbohydrates especially in the dry seasons.

3.3. Tree Growth—Elevation Relationship

Considering correlations in all months, sites R2 and C2 located around 1300–1500 m show the largest correlations. The highest site R3 (1725 m) ranks the smallest correlations with meteorological variables. When we focused on the months that significantly limit tree growth (i.e., previous September for precipitation and May for all the variables), correlation in R3 is still the lowest compared to other sites. This can be attributable to the spatial size of the dry valley. The vertical extent of the dry valley is 200–300 m above the bottom in this study area [37]. Comparatively, the vertical distance of site R3 to the bottom is more than 500 m, which is beyond the extent of the dry valley. This finding needs to be further verified when there are climatic data with higher spatial resolution that can detect the difference of microclimate conditions between sites.
However, in general, P. yunnanensis at all sites are strongly affected by climatic variation in specific months or seasons, and the radial growth of trees in the low-elevation area does not show an evident elevation-dependent response to climate. The “dry” areas are the bottom parts of the valleys and span 200–300 m above the water level of rivers. The valleys above the dry parts are latitudinal climatic zones with less drought landscape. In the latitudinal climatic zones, many studies designed tree ring sites with elevational gradients (e.g., references [33,35,55,56]) and found that the radial growth-climate responses are elevation-dependent. Exceptions include the studies of references [34] and [57] both sampling in the Yulong Snow Mountain. Reference [57] sampled P. yunnanensis at two sites (3225 and 3445 m) and found the same response patterns as ours but they thought that the response of trees at the lower site was more significant. Reference [34] focused on Abies georgei and reported that the responses of radial growth to climate are consistent at three elevations. These A. georgei grow at high elevations (3326–4014 m) and their radial growths are limited by increasing cold and excessive precipitation, which was explained as the results of the high-elevation distribution and shallow root characteristics of A. georgei. However, P. yunnanensis is a deep-root species, and growing at low elevations makes it suffer more drought stress than P. yunnanensis at high elevations or A. georgei. Growing in the dry-warm valleys, the deep roots uptake more soil water in the dry season than shallow roots do [58], which might contribute to the lower sensitivity to the difference of precipitation at different elevations.

4. Conclusions

Five tree ring width chronologies at the low elevations of the Hengduan Mountains region were used to analyze the response of the radial growth of Pinus yunnanensis to climate during their common period 1979–2016. Tree growth at different sites has a similar response pattern to climatic variation in relative humidity, precipitation, and air temperature in the dry season, especially in the last month (May), significantly affecting the radial increment. Increased precipitation amount and reduced mean or maximum air temperature will enhance tree growth. Drought indicator SPEI has the highest correlation between tree growth and climate variation, indicating that tree growth at the low-elevations area of the region is significantly limited by moisture availability. Precipitation in the last month of the previous wet season is critical for the drought regime in the following seasons. The radial growth of trees around 1300–1500 m responds to the climate more significantly, whereas trees at the highest site close to the upper boundary of the dry valleys show the least response among the five sites. In general, chronologies at different sites match well with each other and the difference in response due to elevations is not evident.

Supplementary Materials

The following are available online at https://www.mdpi.com/1999-4907/11/10/1066/s1, Figure S1: Correlation coefficients between the first difference chronology and first difference meteorological data, Figure S2: Locations of the Climatic Research Unit (CRU) grid and ground meteorological stations, Table S1: Statistical information of meteorological data and their correlations with that of station Miyi, Table S2: Correlations between chronologies and meteorological data.

Author Contributions

Conceptualization, L.S., S.S. and F.J.; methodology, S.S., Y.Z. (Yang Zhou) and B.E.G.; investigation, L.S. and Y.Z. (Yang Zhou); writing—original draft preparation, L.S.; writing—review and editing, Y.Z. (Yesi Zhao); supervision, Y.C. All authors have read and agreed to the published version of the manuscript.

Funding

This research was funded by the National Key Research Program of China (No. 2016YFC0502209), the National Natural Science Foundation of China (No. 51879007), the Beijing Natural Science Foundation (No. JQ18028) and China Scholarship Council (No. 201806040090).

Acknowledgments

The authors acknowledge support from the Tree Ring and Paleoenvironment Research Lab, Key Laboratory of Land Surface Pattern and Simulation, Institute of Geographic Sciences and Natural Resources Research, Chinese Academy of Science, and School of Natural Resources, Faculty of Geographical Science, Beijing Normal University.

Conflicts of Interest

The authors declare no conflict of interest.

References

  1. IPCC. The IPCC and the Sixth Assessment Cycle; Cambridge University Press: Cambridge, UK, 2017. [Google Scholar]
  2. Madani, N.; Kimball, J.S.; Ballantyne, A.P.; Affleck, D.L.R.; van Bodegom, P.M.; Reich, P.B.; Kattge, J.; Sala, A.; Nazeri, M.; Jones, M.O.; et al. Future global productivity will be affected by plant trait response to climate. Sci. Rep. 2018, 8, 2870. [Google Scholar] [CrossRef] [PubMed] [Green Version]
  3. Kirschbaum, M.U.F. Direct and indirect climate change effects on photosynthesis and transpiration. Plant Biol. 2004, 6, 242–253. [Google Scholar] [CrossRef] [PubMed] [Green Version]
  4. Shestakova, T.A.; Gutierrez, E.; Kirdyanov, A.V.; Camarero, J.J.; Genova, M.; Knorre, A.A.; Linares, J.C.; Resco de Dios, V.; Sanchez-Salguero, R.; Voltas, J. Forests synchronize their growth in contrasting Eurasian regions in response to climate warming. Proc. Natl. Acad. Sci. USA 2016, 113, 662–667. [Google Scholar] [CrossRef] [PubMed] [Green Version]
  5. Xing, Y.W.; Ree, R.H. Uplift-driven diversification in the Hengduan Mountains, a temperate biodiversity hotspot. Proc. Natl. Acad. Sci. USA 2017, 114, E3444–E3451. [Google Scholar] [CrossRef] [Green Version]
  6. Xu, G.; Liu, X.; Zhang, Q.; Trouet, V. Century-scale temperature variability and onset of industrial-era warming in the Eastern Tibetan Plateau. Clim. Dyn. 2019, 1–22. [Google Scholar] [CrossRef]
  7. Liu, S.N.; Zhou, T.; Wei, L.Y.; Shu, Y. The spatial distribution of forest carbon sinks and sources in China. Chin. Sci. Bull. 2012, 57, 1699–1707. [Google Scholar] [CrossRef] [Green Version]
  8. Wu, P.; Liu, X.; Liu, S.; Wang, J.; Wang, Y. Composition and spatio-temporal variation of soil microarthropods in the biodiversity hotspot of northern Hengduan Mountains, China. Eur. J. Soil Biol. 2014, 62, 30–38. [Google Scholar] [CrossRef]
  9. Sherman, R.; Mullen, R.; Haomin, L.; Zhengong, F.; Yi, W. Spatial patterns of plant diversity and communities in Alpine ecosystems of the Hengduan Mountains, Northwest Yunnan, China. J. Plant Ecol. 2008, 1, 117–136. [Google Scholar] [CrossRef]
  10. Wang, Q.; Zhang, T.; Yi, G.; Chen, T.; Bie, X.; He, Y. Tempo-spatial variations and driving factors analysis of net primary productivity in the Hengduan mountain area from 2004 to 2014. Acta Ecol. Sin. 2017, 37, 3084–3095. [Google Scholar]
  11. Chen, T.; Peng, L.; Liu, S.; Wang, Q. Spatio-temporal pattern of net primary productivity in Hengduan Mountains area, China: Impacts of climate change and human activities. Chin. Geogr. Sci. 2017, 27, 948–962. [Google Scholar] [CrossRef] [Green Version]
  12. Guo, B.; Zang, W.; Yang, F.; Han, B.; Chen, S.; Liu, Y.; Yang, X.; He, T.; Chen, X.; Liu, C.; et al. Spatial and temporal change patterns of net primary productivity and its response to climate change in the Qinghai-Tibet Plateau of China from 2000 to 2015. J. Arid. Land 2019, 12, 1–17. [Google Scholar] [CrossRef] [Green Version]
  13. Wu, X.; Lin, X.; Zhang, Y.; Gao, J.; Guo, L.; Li, J. Impacts of climate change on ecosystem in priority areas of biodiversity conservation in China. Chin. Sci. Bull. 2014, 59, 4668–4680. [Google Scholar] [CrossRef]
  14. Yuan, Q.; Wu, S.; Dai, E.; Zhao, N.; Ren, P.; Zhang, X. NPP vulnerability of the potential vegetation of China to climate change in the past and future. J. Geogr. Sci. 2017, 27, 131–142. [Google Scholar] [CrossRef]
  15. Cook, E.R. The decomposition of tree-ring series for environmental studies. Tree Ring Bull. 1987, 47, 37–59. [Google Scholar]
  16. Duan, J.; Esper, J.; Büntgen, U.; Li, L.; Xoplaki, E.; Zhang, H.; Wang, L.; Fang, Y.; Luterbacher, J. Weakening of annual temperature cycle over the Tibetan Plateau since the 1870s. Nat. Commun. 2017, 8, 14008. [Google Scholar] [CrossRef] [Green Version]
  17. Babst, F.; Poulter, B.; Trouet, V.; Tan, K.; Neuwirth, B.; Wilson, R.; Carrer, M.; Grabner, M.; Tegel, W.; Levanič, T.; et al. Site- and species-specific responses of forest growth to climate across the European continent. Glob. Ecol. Biogeogr. 2013, 22, 706–717. [Google Scholar] [CrossRef]
  18. Fan, Z.-X.; Bräuning, A.; Cao, K.-F. Tree-ring based drought reconstruction in the central Hengduan Mountains region (China) since A.D. 1655. Int. J. Clim. 2008, 28, 1879–1887. [Google Scholar] [CrossRef]
  19. Guo, G.; Li, Z.-S.; Zhang, Q.B.; Ma, K.-P.; Mu, C. Dendroclimatological studies of Picea likiangensis and Tsuga dumosa in Lijiang, china. IAWA J. 2009, 30, 435–441. [Google Scholar] [CrossRef] [Green Version]
  20. Fang, K.; Gou, X.; Chen, F.; Li, J.; D’Arrigo, R.; Cook, E.; Yang, T.; Davi, N. Reconstructed droughts for the southeastern Tibetan Plateau over the past 568 years and its linkages to the Pacific and Atlantic Ocean climate variability. Clim. Dyn. 2009, 35, 577–585. [Google Scholar] [CrossRef]
  21. Shi, S.; Li, J.; Shi, J.; Zhao, Y.; Huang, G. Three centuries of winter temperature change on the southeastern Tibetan Plateau and its relationship with the Atlantic Multidecadal Oscillation. Clim. Dyn. 2017, 49, 1305–1319. [Google Scholar] [CrossRef] [Green Version]
  22. Fan, Z.-X.; Bräuning, A.; Cao, K.-F. Annual temperature reconstruction in the central Hengduan Mountains, China, as deduced from tree rings. Dendrochronologia 2008, 26, 97–107. [Google Scholar] [CrossRef]
  23. Fan, Z.-X.; Bräuning, A.; Tian, Q.-H.; Yang, B.; Cao, K.-F. Tree ring recorded May–August temperature variations since A.D. 1585 in the Gaoligong Mountains, southeastern Tibetan Plateau. Palaeogeogr. Palaeoclim. Palaeoecol. 2010, 296, 94–102. [Google Scholar] [CrossRef]
  24. Li, T.; Li, J. A 564-year annual minimum temperature reconstruction for the east central Tibetan Plateau from tree rings. Glob. Planet. Chang. 2017, 157, 165–173. [Google Scholar] [CrossRef]
  25. Fan, Z.-X.; Bräuning, A.; Yang, B.; Cao, K.-F. Tree ring density-based summer temperature reconstruction for the central Hengduan Mountains in southern China. Glob. Planet. Chang. 2009, 65, 1–11. [Google Scholar] [CrossRef]
  26. Jiang, Y.-M.; Li, Z.-S.; Fan, Z.-X. Tree-ring based February–April relative humidity reconstruction since A.D. 1695 in the Gaoligong Mountains, southeastern Tibetan Plateau. Asian Geogr. 2017, 34, 59–70. [Google Scholar] [CrossRef]
  27. Yin, D.; Xu, D.; Tian, K.; Xiao, D.; Zhang, W.; Sun, D.; Sun, H.; Zhang, Y. Radial Growth Response of Abies georgei to Climate at the Upper Timberlines in Central Hengduan Mountains, Southwestern China. Forests 2018, 9, 606. [Google Scholar] [CrossRef] [Green Version]
  28. Li, J.; Li, J.; Li, T.; Au, T.F. Tree growth divergence from winter temperature in the Gongga Mountains, southeastern Tibetan Plateau. Asian Geogr. 2019, 37, 15. [Google Scholar] [CrossRef]
  29. Bräuning, A. Summer temperature and summer monsoon history on the Tibetan plateau during the last 400 years recorded by tree rings. Geophys. Res. Lett. 2004, 31. [Google Scholar] [CrossRef]
  30. Duan, J.; Zhang, Q.B. A 449 year warm season temperature reconstruction in the southeastern Tibetan Plateau and its relation to solar activity. J. Geophys. Res. Atmos. 2014, 119, 578–592. [Google Scholar] [CrossRef]
  31. Li, Z.S.; Liu, G.H.; Gong, L.; Wang, M.; Wang, X.C. Tree ring-based temperature reconstruction over the past 186 years for the Miyaluo Natural Reserve, western Sichuan Province of China. Theor. Appl. Climatol. 2015, 120, 495–506. [Google Scholar] [CrossRef]
  32. Li, Z.; Liu, G.; Wu, X.; Wang, X. Tree-ring-based temperature reconstruction for the Wolong Natural Reserve, western Sichuan Plateau of China. Int. J. Climatol. 2015, 35, 3296–3307. [Google Scholar] [CrossRef]
  33. Fan, Z.-X.; Bräuning, A.; Cao, K.-F.; Zhu, S.-D. Growth—Climate responses of high-elevation conifers in the central Hengduan Mountains, southwestern China. For. Ecol. Manag. 2009, 258, 306–313. [Google Scholar] [CrossRef]
  34. Zhang, Y.; Yin, D.; Tian, K.; Zhang, W.; He, R.; He, W.; Sun, J.; Liu, Z. Radial growth responses of Picea likiangensis to climate variabilities at different altitudes in Yulong Snow Mountain, southwest China. Chin. J. Plant Ecol. 2018, 42, 629–639. [Google Scholar]
  35. Guo, M.-M.; Zhang, Y.-D.; Wang, X.-C.; Liu, S.-R. Difference in responses of major tree species growth to climate in the Miyaluo Mountains, western Sichuan, China. Chin. J. Appl. Ecol. 2015, 26, 2237–2243. [Google Scholar]
  36. Huan-Cheng, M.; McConchie, J.A. The dry-hot valleys and forestation in southwest China. J. For. Res. 2001, 12, 35–39. [Google Scholar] [CrossRef]
  37. Integrated Scientific Expeditional Team to Qinghai-Tibet Plateau; Chinese Academy of Sciences. The Dry Valleys of the Hengduan Mountains Region; Science Press: Beijing, China, 1992. [Google Scholar]
  38. Ming, Q.; Shi, Z. New discussion on dry valley formation in the Three Parallel Rivers Region. J. Desert Res. 2007, 27, 99–104. [Google Scholar]
  39. Zheng, H.; Zhao, X.; Zhao, T.; Chen, F.; Xu, W.; Duan, X.; Wang, X.; Ouyang, Z. Spatial-temporal variations of methane emissions from the Ertan hydroelectric reservoir in southwest China. Hydrol. Process. 2011, 25, 1391–1396. [Google Scholar] [CrossRef]
  40. Harris, I.; Jones, P.D.; Osborn, T.J.; Lister, D.H. Updated high-resolution grids of monthly climatic observations—The CRU TS3.10 Dataset. Int. J. Climatol. 2014, 34, 623–642. [Google Scholar] [CrossRef] [Green Version]
  41. Tang, G.; Qi, C. Dedrochronology (South China Version), 3rd ed.; China Forestry Publishing House: Beijing, China, 2015. [Google Scholar]
  42. Sun, L.; Cai, Y.; Yang, W.; Yi, Y.; Yang, Z. Climatic variations within the dry valleys in southwestern China and the influences of artificial reservoirs. Clim. Chang. 2019, 155, 111–125. [Google Scholar] [CrossRef]
  43. Sun, L.; Cai, Y.; Jaramillo, F.; Zhou, Y.; Shi, S.; Zhao, Y.; Wang, W.; Yang, W.; Yi, Y.; Yang, Z.; et al. Exploring the influence of reservoir impoundment on growth of surrounding vegetation. Adv. Water Res. 2020. under review. [Google Scholar]
  44. Cook, E.R.; Kairiukstis, L.A. Methods of Dendrochronology: Applications in the Environmental Sciences; Springer Science & Business Media: New York, NY, USA, 1990. [Google Scholar]
  45. Liang, E.; Wang, Y.; Piao, S.; Lu, X.; Camarero, J.J.; Zhu, H.; Zhu, L.; Ellison, A.M.; Ciais, P.; Peñuelas, J. Species interactions slow warming-induced upward shifts of treelines on the Tibetan Plateau. Proc. Natl. Acad. Sci. USA 2015, 113, 4380–4385. [Google Scholar] [CrossRef] [PubMed] [Green Version]
  46. Stroke, M.A.; Smiley, T.L. Introduction to Tree-Ring Dating; University of Chicago Press: Chicago, IL, USA, 1968. [Google Scholar]
  47. Holmes, R.L. Computer-assisted quality control in tree-ring dating and measurement. Tree Ring Bull. 1983, 43, 51–67. [Google Scholar]
  48. Grissino-Mayer, H.D. Evaluating crossdating accuracy: A manual and tutorial for the computer program COFECHA. Tree Ring Res. 2001, 57, 31621719. [Google Scholar]
  49. Cook, E.R.; Peters, K. Calculating unbiased tree-ring indices for the study of climatic and environmental change. Holocene 1997, 7, 361–370. [Google Scholar] [CrossRef]
  50. Osborn, T.J.; Biffa, K.; Jones, P. Adjusting variance for sample-size in tree-ring chronologies and other regional-mean timeseries. Dendrochronologia 1997, 15, 89–99. [Google Scholar]
  51. Vicente-Serrano, S.M.; Beguería, S.; López-Moreno, J.I. A multiscalar drought index sensitive to global warming: The standardized precipitation evapotranspiration index. J. Clim. 2010, 23, 1696–1718. [Google Scholar] [CrossRef] [Green Version]
  52. Allan, R.G.; Pereira, L.S.; Raes, D.; Smith, M. Crop Evapotranspiration: Guidelines for Computing Crop Water Requirements; FAO irrigation and drainage paper No. 56; FAO: Quebec, BC, Canada, 1998. [Google Scholar]
  53. Bi, Y.; Xu, J.; Gebrekirstos, A.; Guo, L.; Zhao, M.; Liang, E.; Yang, X. Assessing drought variability since 1650 AD from tree-rings on the Jade Dragon Snow Mountain, southwest China. Int. J. Climatol. 2015, 35, 4057–4065. [Google Scholar] [CrossRef]
  54. Weber, P.; Bugmann, H.; Rigling, A. Radial growth responses to drought of Pinus sylvestris and Quercus pubescens in an inner-Alpine dry valley. J. Veg. Sci. 2007, 18, 777–792. [Google Scholar] [CrossRef]
  55. Zhang, Y.; Yin, D.; Tian, K.; He, R.; He, M.; Li, Y.; Sun, D.; Zhang, W. Relationship between radial growth of Abies georgei and climate factors at different altitudes on the eastern slope of Yulong Snow Mountain, China. J. Appl. Ecol. 2018, 29, 2355–2361. [Google Scholar]
  56. Zhang, Z.; Kang, D.; Guo, W.; Zhao, L.; Cui, L.; Li, J. Climate sensitivity of purple cone spruce (Picea purpurea) across an altitudinal gradient on the eastern Tibetan Plateau. Dendrochronologia 2019, 56, 7. [Google Scholar]
  57. Yang, R.; Fan, Z.; Li, Z.; Wen, Q. Radial growth of Pinus yunnanensis at different elevations and their responses to climatic factors in the Yulong Snow Mountain, Northwest Yunnan. Acta Ecol. Sin. 2018, 38, 8983–8991. [Google Scholar]
  58. Yang, B.; Wen, X.; Sun, X. Seasonal variations in depth of water uptake for a subtropical coniferous plantation subjected to drought in an East Asian monsoon region. Agric. For. Meteorol. 2015, 201, 218–228. [Google Scholar] [CrossRef]
Figure 1. Location of the tree ring sampling sites and meteorological station Miyi. The pink lines in (a) are the borders of the dry valleys according to the definition of reference [37]; (b) shows the monthly climatic characteristics at station Miyi; and (c,d) indicate the locations of (a) in the Hengduan Mountains region and China, respectively.
Forests 11 01066 g001
Figure 2. Chronologies of tree ring widths for five sample sites. The curves and grey areas correspond to the tree ring width index and the sample depth, respectively. EPS is express population signal.
Forests 11 01066 g002
Figure 3. Correlation coefficients between chronologies and meteorological data. α is the threshold of the significance level. Here are shown the results of the raw series and the first difference series can be referred to Figure S1.
Forests 11 01066 g003
Figure 4. Correlation coefficients between the standardized precipitation evapotranspiration index (SPEI) and tree ring width chronologies. The number in the brackets represents the timescale of the month of SPEI. The light-yellow area covers the six month period after the previous October. The star marks the largest value corresponding to its columns with the same color inside the light-yellow area.
Forests 11 01066 g004
Table 1. Description of the sampling sites and tree ring width chronologies.
R1R2R3C1C2
Elevation (m a.s.l.)12561502172511701359
Slope34%42%46%45%38%
AspectNNNENEN
Numbers (tree/core)14/2315/2712/2119/3916/37
Time span1956–20161976–20161942–20171974–20171967–2017
Time span of EPS > 0.851972–20161976–20161968–20171977–20171979–2017
Average autocorrelation0.6780.5800.6990.6990.517
Average sensitivity0.2880.3240.2580.4110.365
Master correlation0.4810.6590.6300.7390.738
Table 2. Correlation coefficients among chronologies. Correlations were performed during their common period 1979–2016. * indicates that significance level of p < 0.01 is reached.
R2R3C1C2
ChronologyR10.80 *0.51 *0.41 *0.63 *
R2 0.66 *0.61 *0.69 *
R3 0.300.60 *
C1 0.69 *
First difference chronologyR10.78 *0.71 *0.41 *0.62 *
R2 0.66 *0.62 *0.62 *
R3 0.310.54 *
C1 0.77*

