Article

Comparison of Two Sampling Methods to Estimate the Abundance of Lucanus cervus with Application of n-Mixture Models

1
Departement of Earth and Environmetal Sciences, University of Pavia, Via Ferrata 9, 27100 Pavia, Italy
2
Swiss Ornithological Institute, Seerose 1, 6204 Sempach, Switzerland
3
Via Madonna del Boschetto, 16, 25030 Castel Mella, Italy
4
Via San Rocco 3, 24060 Predore, Italy
5
Botanical Garden, University of Pavia, Via S. Epifanio 14, 27100 Pavia, Italy
*
Author to whom correspondence should be addressed.
Forests 2020, 11(10), 1085; https://doi.org/10.3390/f11101085
Submission received: 28 August 2020 / Revised: 5 October 2020 / Accepted: 6 October 2020 / Published: 12 October 2020
(This article belongs to the Special Issue Conservation and Dynamics of Forest Biodiversity)

Abstract

:
Monitoring programs should be based on the measurement of two main pillars for evaluating the conservation status of a species: population size and geographical distribution. To date, the only way reported in the literature to obtain detailed information on L. cervus population size is to use the capture-mark-recapture method. This is an expensive and time-consuming technique that implies physical capture and handling of individuals, which could affect their survival. Therefore, in this study we tested and compared two non-invasive sampling approaches, namely evening walk transects and diurnal tree trunk surveys, to derive accurate abundance estimates by means of N-mixture models in a Bayesian framework. In our study, both methods showed relatively high detection probability (≥56%). However, tree surveys performed better than walk transects (≈80%), especially with the progression of the sampling season. Tree surveys proved to be more effective than walk transects in providing data for an accurate population density estimate (much smaller 95% Bayesian Confidence Intervals). In light of a cost and benefit assessment, the tree survey is undoubtedly more convenient, as well as more effective, as it is more time consuming but less expensive than a walk transect (one operator for 2–3 h vs. two operators for 30 min each). Moreover, it needs fewer expert operators because of the greater proximity to the species, increasing the probability of correctly identifying it, i.e., reducing type I error (false positive or overestimation of counts). For the first time, we applied N-mixture models for estimating population abundance of L. cervus. Overcoming all the limits imposed by the use of the capture-mark-recapture method, in this study we performed a further step forward in the planning of monitoring aimed at the conservation of L. cervus and the evaluation of its demographic trend.

1. Introduction

Insects represent the major components of biodiversity in any terrestrial ecosystem, filling many ecological niches and providing important ecological services, including pollination, herbivory and detrivory, nutrient cycling and providing a food source for birds, mammals and amphibians [1,2,3].
Based on recent biodiversity surveys and entomological studies, scientists agree on an overall pattern of decline in insect diversity and abundance [4]. Among forest insects, one group that is strongly threatened is that of Saproxylic beetles. This functional group depends on decaying wood during at least some phases of their lifecycle [5,6]. Because of its important role in the decomposition process of dead wood and in the recycling of nutrients, it represents an accurate indicator of the state of health of the forest ecosystem [7,8]. However, according to the European Red List of Saproxylic Beetles, a proportion of species between 13.5% and 37.9% is considered to be threatened in Europe, mainly because of logging, wood harvesting and agricultural expansion, which have caused loss, fragmentation and/or structural simplification of old native forests [9,10].
Among the most threatened saproxylic species there are large ones, defined as Large Saproxylic Beetles, LSB, belonging to the family Lucanidae (Lucanus), Scarabeidae (Osmoderma, Protaetia, etc.) and Cerambicidae (Rosalia, Cerambyx, Morimus, etc.). Because of their large body size, these species need a greater volume of dead wood in aggregated form (i.e., in the same tree) to successfully complete larval development and thus are more susceptible than other species to local variations in the distribution and availability of dead wood [11,12].
Luckily, these species are protected by the European Habitat Directive, which ensures the conservation of a wide range of rare, threatened or endemic animal and plant species (as listed in Annex II, IV and V), as well as 200 rare and characteristic habitats (as listed in Annex I). An obligation arising from Article 11 and Article 17 of the Habitats Directive is the monitoring of conservation status for all habitats and species of community interest and the submission of reports containing the main results of this monitoring to the Commission every six years. Many European countries undertake monitoring programs aimed at evaluating population trends for most of the insect species listed in the Annexes [12]. For saproxylic species, very accurate and standardized monitoring plans have recently been developed [13,14,15,16].
However, the choice of the best sampling techniques proposed in these monitoring programs has essentially been based on species occupancy (probability of occurrence), and there is a lack of indications as to what the most effective non-invasive sampling methods are for estimating populations size. In the specific case of the Stag Beetles Lucanus cervus, a LSB listed in Annex II of the Habitat Directive, researchers have reported several non-invasive monitoring methods, such as trapping of adults (with or without lures), counting living adults during transect walks (flying or on the ground), surveys of tree trunks, mapping adults by citizens, counting road kill individuals and predation remains, etc. [13]. All these methods are suitable for non-experts, and are relatively inexpensive and non-invasive, but they mostly make it possible to obtain presence/absence data or raw estimates of relative population densities [17].
Because the decline of populations is manifested through a reduction in density followed by a more restricted geographical distribution of species [4], most of the current monitoring programs should be based on measurement of these two main pillars for evaluating the conservation status of a species [18]. However, the only way provided by the guidelines, and generally reported in the literature, for obtaining detailed information on L. cervus population size is to use the capture-mark-recapture method [13,19]. Other quantitative methods for estimating population size, such as the use of distance sampling, could in some cases be too inaccurate, or not realistic for flying insects [17]. On the other hand, estimating population size of endangered species by the capture-mark-recapture method is not recommendable because it not only requires expensive and time-consuming field work, but necessarily implies physical capture and handling of individuals, which could affect their survival [20].
Recently, new methods have been proposed to estimate population size which consist of recording the presence–absence data over multiple surveys for each sampling method considered (Royle–Nichols Abundance Induced Heterogeneity model—RNAIH) [21] or the abundance of the species over multiple surveys, without marking individuals (Royle Repeated Count model—RRC) [22]. These approaches include the use of dedicated statistical software or R packages (e.g., ‘UNMARKED”; [23]) based on complex mathematical modelling (i.e., Bayesian framework) to account for detection probabilities and thus derive occupancy/abundances. Actually, when modelling species abundance, detection probability is often neglected, leading to potential type II errors (false negatives or underestimation of counts) [24]. This is because detection probability is often imperfect, meaning that during a given survey, a given species can erroneously be considered absent from a site when it is actually present but the observer was unable to detect it. This is the case for many species, for which multiple surveys (i.e., repeated visits) are necessary to assess their presence or absence, and accounting for detection probability improves model performance, providing robust estimates of species abundance [21,22,23,24,25].
Thus, in this study we aimed to (i) test and (ii) compare two different non-invasive sampling approaches to derive accurate abundance estimates while accounting for imperfect detection (from multiple surveys at the same sites), namely transect and tree sampling. We develop N-mixture models [22] in a Bayesian framework, which have already successfully applied on several taxa (e.g., birds; [25]) on unmarked individuals (i.e., avoiding animal manipulations). Thus, we compared the above-mentioned approaches considering the resulting average abundance estimates, but also their relative 95% Bayesian confidence intervals, BCI. We assumed that despite the mean value, the approach that performs the best would have smaller 95% BCI than the other. We further discussed cost and benefit in term of time/effort and economic cost of each sampling method.

2. Materials and Methods
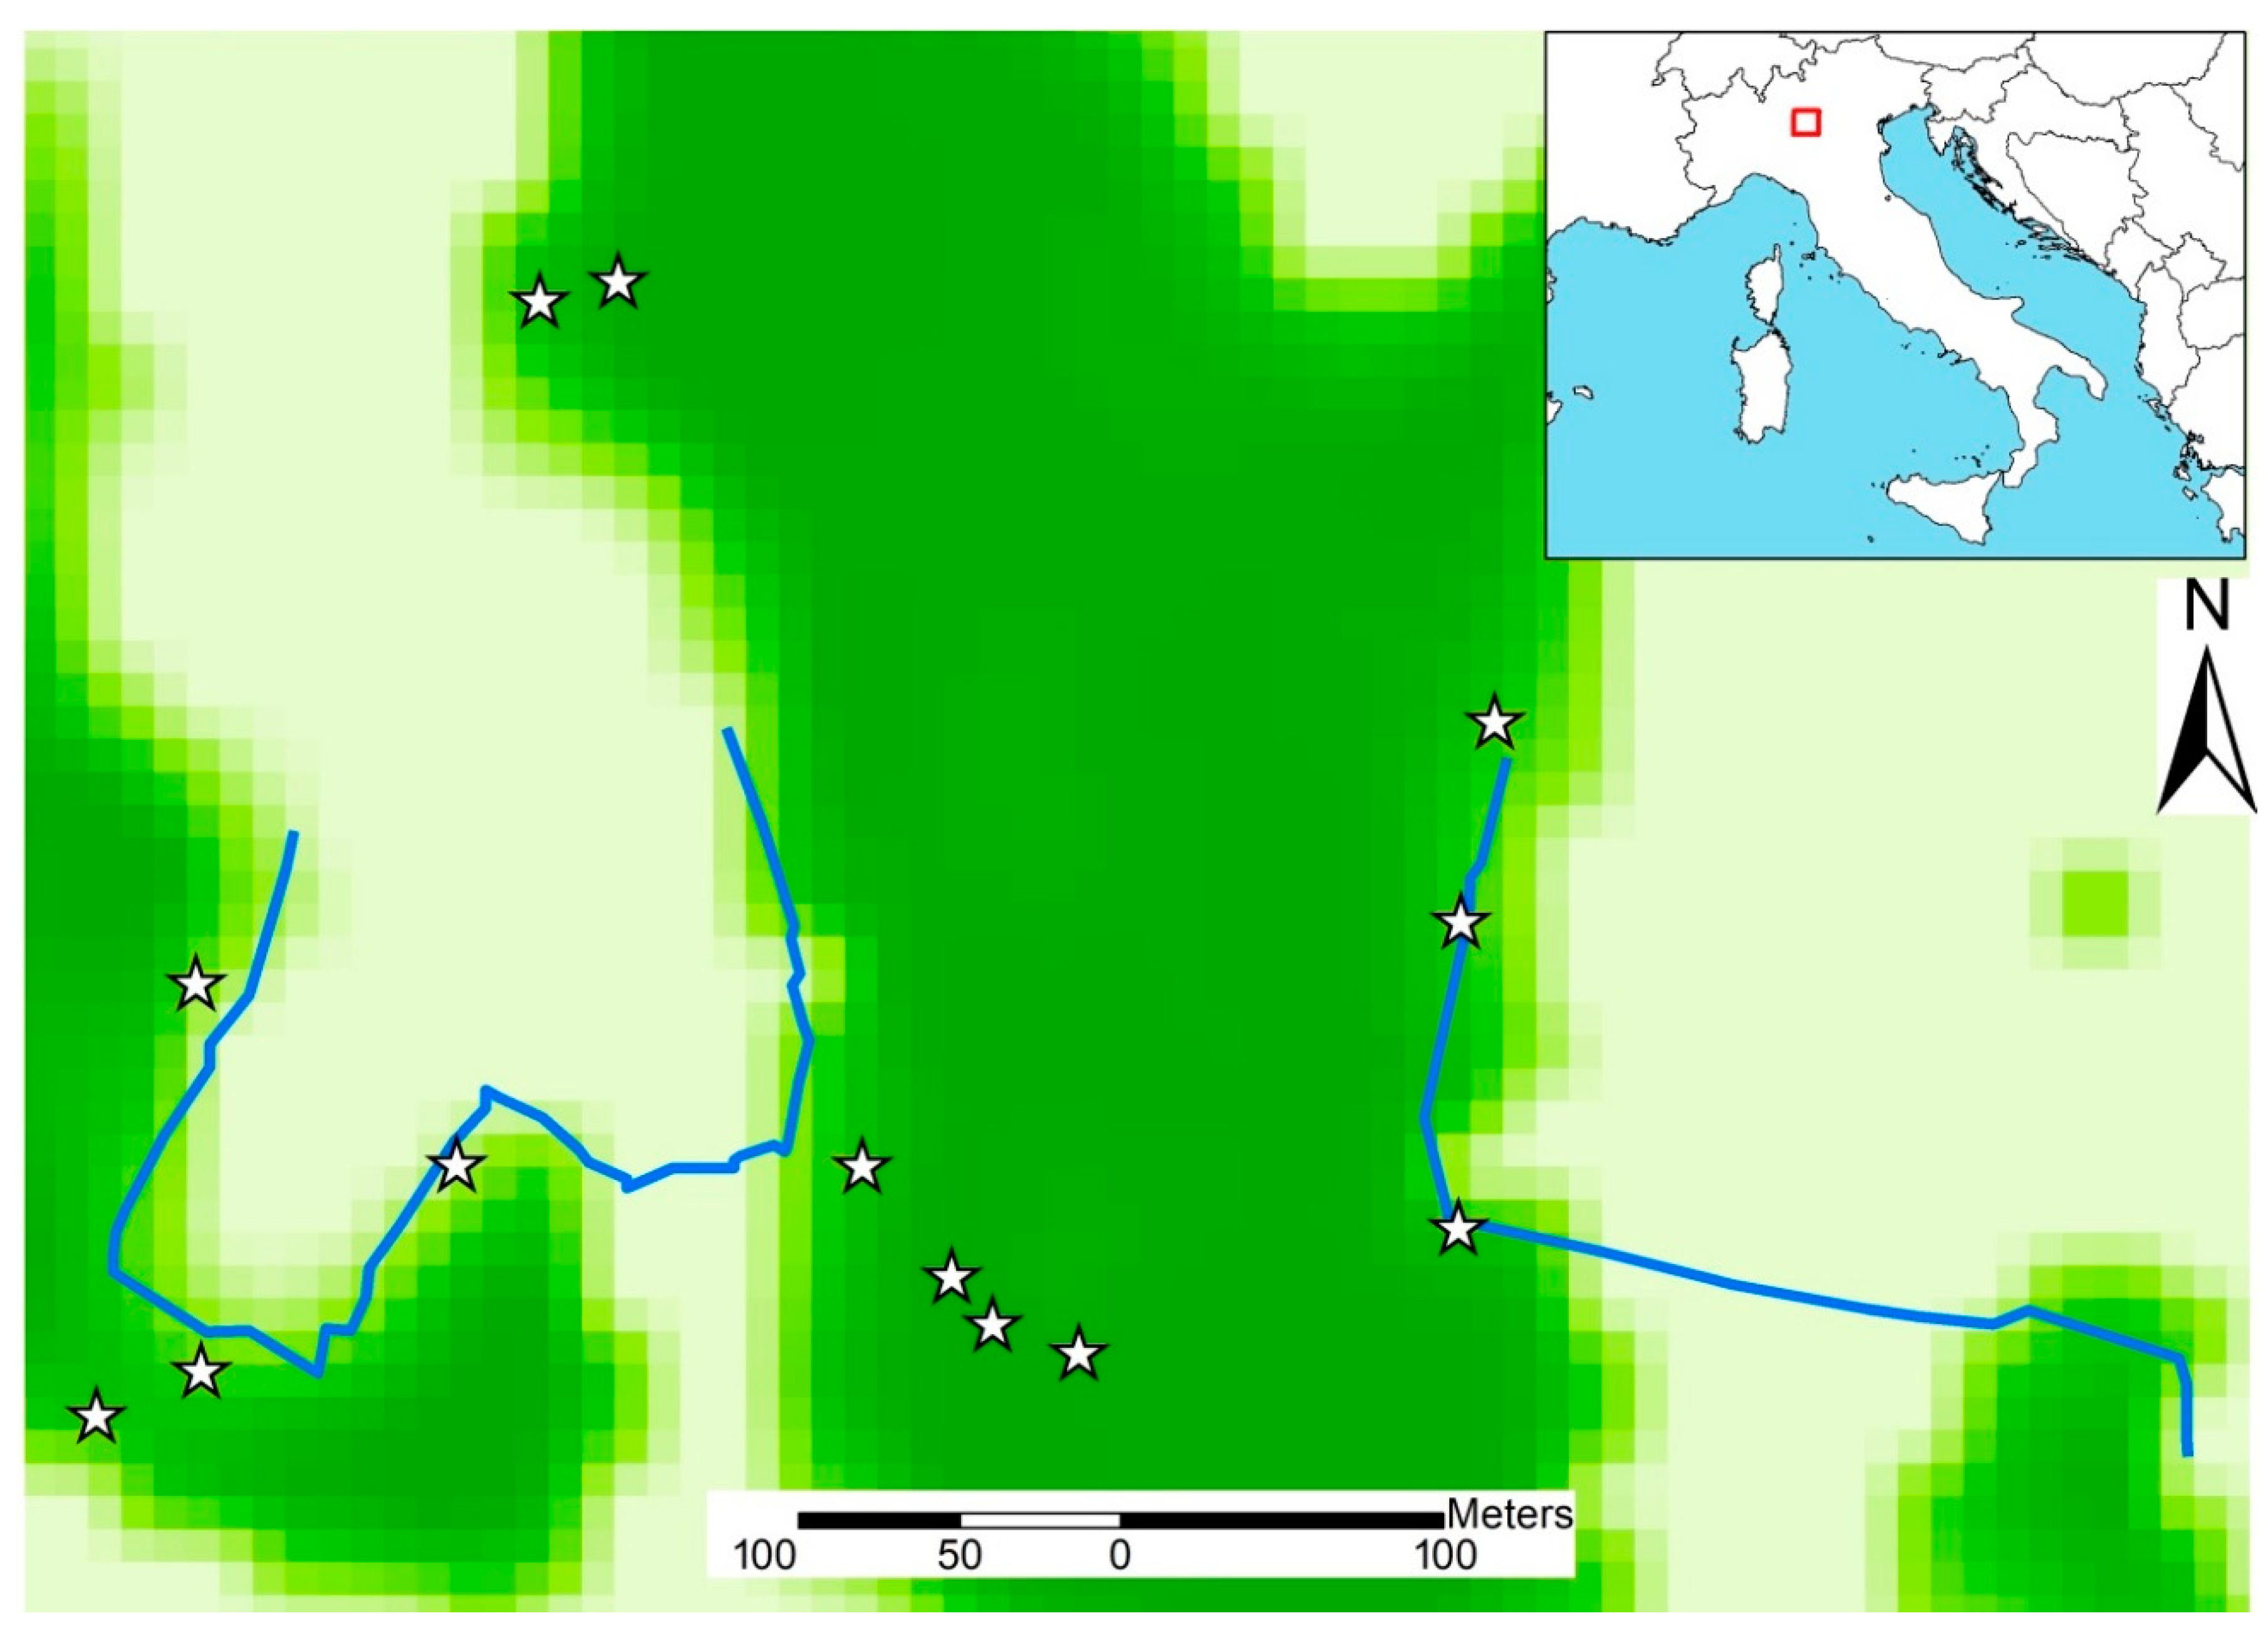
2.1. Study Area

The present study was conducted in the “Bosco delle Colombere” (Colombere wood) natural reserve, a small private forested area of approximately 20 ha located inside the Monte Netto Regional Park (coordinates: 45°26′54.95″ N, 10°8′56.84″ E; Figure 1).
The vineyards and cultivated fields surrounding “Bosco delle Colombere” divide our study area into three different parts, North–South oriented: one central part of about 17 ha and two smaller parts on each side. The study area is a small relict forest completely surrounded by the Po plain human-dominated landscape and represents a rare example of a well-preserved lowland oak-hornbeam forest, mainly composed of Quercus robur and Carpinus betulus as dominant trees and Corylus avellana, Edera helix and Rubus fruticosus as undergrowth [26].
The natural ecology of the forest and the conservation efforts of the owners have favored the accumulation of large quantities of deadwood and consequently a rich development of saproxylic diversity, including some species listed in the Habitats Directive, such as Lucanus cervus, Osmoderma eremita, Cerambyx cerdo and other species with high conservation value listed in the Red List of Italian saproxyl beetles ([27], including Elater ferrugineus (Linnaeus, 1758), Morimus asper (Sulzer, 1776), Plagionotus detritus (Linnaeus, 1758), Lichenophanes varius (Illiger, 1801), Euplectus frater (Besuchet, 1964), Pentaphyllus testaceus (Hellwig, 1792), Xylopertha retusa (Olivier, 1790), Neatus picipes (Herbst, 1797), Calambus bipustulatus (Linnaeus, 1767), Protaetia fieberi (Kraatz, 1880) (Livio Mola pers. comm.). Bosco delle Colombere, thanks to careful management that does not involve cutting the living component or removing dead wood, is characterized by trees of different ages and sizes and a high quantity of dead wood in all its decay classes and categories: from stumps to snags, from dead standing trees to those lying on the ground.

2.2. Study Species and Data Collection

The target species, L. cervus, is widely spread across Europe and is associated with mature deciduous forests, but may also be common in urban habitats (e.g., city parks, private gardens; [28,29]). It can be found especially in lowland and medium-altitude oak woodlands, where the saproxylic larvae feed on rotten deadwood at ground level [30]. L. cervus is listed in the IUCN Red List of Threatened Species as “near threatened” and in the EU Habitats Directive as a priority species of community interest [31]. It is considered a focal species for the conservation of suitable habitats for saproxylic beetles [32] and as an umbrella species, as it represents a diverse and highly vulnerable fauna associated with a wide range of broad-leaved trees [33] and coarse woody material [34,35]. Therefore, by directing management efforts toward the requirements of this species, the requirements of many cohabitant species that use the same habitat are addressed [36].
Within the study area, L. cervus abundance was investigated using two sampling techniques already reported in literature as effective and non-invasive sampling methods [13]: diurnal tree trunk surveys (hereinafter defined as tree surveys) and sighting individuals along transects at dusk (hereinafter defined as transect walks). Tree surveys consisted of 13 Quercus robur selected as potential trees for the species based on two characteristics: diameter (DBH) greater than 50 cm as already reported in a recent study aimed at the monitoring of Lucanus cervus [37] and the presence of gushing sap on which the species feeds [38,39]. Trees had diameters ranging between 51 and 101 cm, heights between 15 and 30 m, and were located at distances greater than 50 m from each other (Figure 1). Trees were weekly checked for L. cervus abundance, by one operator, from the 26 June to the 23 July 2019. Two walk transects, named ‘T1’ and ‘T2’, were located in two different parts of the forest (Figure 1). Each transect was 500 m in length and 10 m in width along the forest ecotone and was conducted by one operator once a week, on the same days tree surveys were carried out. Following the indication already reported in literature [13,40], the walk started 15 min before sunset and ended 15 min after sunset at a constant speed of 17 m/min. For the purpose of this work and to make robust the comparison between methods, we stress that we analyzed only adult male L. cervus occurrences collected from transect walks and tree surveys carried out during the same days for a total of six sampling sessions (as recommended by the standard protocol for the monitoring of L. cervus [13]).

2.3. Covariates of Detection and Abundance

To estimate L. cervus detection probability in both transect walks and tree surveys, we recorded three time survey covariates and five microclimatic and weather covariates acquired from the weather station of the farm “Le Gatte” located inside the Park. Among these eight predictors, we checked for multicollinearity through variance inflation factor (VIF) and thus we retained seven covariates with VIF < 3 (Table 1; [41]).
To estimate L. cervus abundance, we initially considered a set of 11 covariates ecologically relevant to the species [13,32,42]. Specifically, we considered tree cover density (Status map 2015; from https://land.copernicus.eu/pan-european/high-resolution-layers/forests/tree-cover-density/status-maps/2015) available at 20 m resolution, as well as distance to waters, dense and sparse human settlements, roads, broadleaf forests, riparian formations, shrublands, grasslands, urban green parks and croplands derived by (Uso e copertura del suolo 2018—DUSAF 6.0; from http://www.geoportale.regione.lombardia.it/download-ricerca) available as vector data. All these predictors were resampled at a resolution of 10 m and then we checked for multicollinearity among predictors through variance inflation factor (VIF) to finally retain 10 covariates with VIF < 3 (Table 1).

2.4. Modelling Procedures

We assumed 13 as the minimum number of trunks to be surveyed for obtaining a representative sample of the population because they are homogeneously distributed and cover the main part of the forest. Moreover, due to the small size of the forest, we assumed 1 to be the minimum number of transect to be undertaken for obtaining a representative sample of the population. According to the standard protocol for the monitoring of L. cervus [13] the number of transects per area can vary from 1 to 4 depending on the size of the area to be investigated. Therefore, we analyzed the two transect separately in order to evaluate the improving of the sampling and the estimate accuracy from one to two transects.
To provide robust comparison of population estimates, we considered the total number of 10 × 10 m cells (i.e., pixels) in which tree trunks (n = 13, i.e., one tree per pixel) and transects (n = 121, i.e., pixels in which a transect partially matched) occurred.
Thus, considering pixels as sampling units, we carried out N-mixture models to estimate abundance of L. cervus. Specifically, for each sampling method considered we derived detection history of our target species (detection: 1, non-detection: 0) and used the relative counts of individuals of L. cervus as response variable in N-mixture models (Royle Repeated Count model—RRC [22]) with Poisson error distribution (function ‘pcount’ in the R package ‘UNMARKED’). We used the same covariates of detection probability and to estimate species abundance for both walk transect and tree surveys. Moreover, for each sampling method, we estimated posterior distributions of the latent abundance using empirical Bayes methods (function ‘ranef’ in the R package ‘UNMARKED’) to derive a robust estimate of L. cervus abundance. These analyses not only provided average abundance estimates, but also their relative 95% Bayesian confidence intervals, BCI. Thus, we compared the resulting estimates of species abundance (mean and 95% BCI) derived by the two sampling approaches.

3. Results

During six repeated sampling sessions, we obtained a total of 96 L. cervus detections: 55 individuals on trees, during the tree surveys, and 41 individuals on flight, during the walk along transects. During the tree surveys, we found several individuals per pixel ranging between 0 and 17 (Mean: 0.705, SD: 2.523), while during walks along transects, we found several individuals per pixel ranging between 0 and 4 (Mean: 0.111, SD: 0.413).

3.1. Covariates Effects on Detection and Abundance

The detection probability of L. cervus increased as the sampling season progressed, with the highest number of observations at the end of July in both transect walks and tree surveys. The only other variable among those considered which is significantly and positively correlated with the detection probability of the species is the duration of the sampling sessions during the tree surveys (Table 2). This variable is constant for transect walks.
Predicted estimates of L. cervus abundance decrease with distance to forests, both broadleaved and riparian, and increases rapidly as the tree cover density increases. With respect to proximity to villages, predictions of beetle abundance increase as the distance to dense human settlements increases, while it does not show significant variation with the increasing of sparse human settlements. Finally, with respect to proximity to open habitats, predicted estimates of species abundance significantly increase with increasing of distances to croplands and to grasslands (Table 2).

3.2. Estimates of Detection and Abundance

Considering tree surveys, N-mixture models estimated an average detection probability of 0.674 (95% B.C.I. 0.245–0.771) and several individuals per pixel between 0.0 and 103.26 (Mean: 12.11, SD: 28.33) when considering transect walks, N-mixture models estimated an average detection probability of 0.562 (95% B.C.I. 0.299–0.615) and several individuals per pixel between 0.71 and 4.71 (Mean: 1.319, SD: 0.857).
When deriving the total population size for both the methods we found relatively similar results, i.e., 157.21 (95% B.C.I. 120–199) for tree surveys and 159.71 (95% B.C.I. 71–434) for transect walks. However, when we included in the models only one transect at a time, the total population size estimated for single transect dramatically decreased compared to that estimated for tree surveys, i.e., 88.66 (95% B.C.I. 37–257) for T1 and 71.5 (95% B.C.I. 34–177) for T2.

4. Discussion

4.1. Effectiveness of Transect Walks and Tree Surveys for Estimating L. cervus Abundance

In this study, we compared two sampling methods for estimating the abundance of L. cervus in a relict forest in a human-dominated landscape. By means of N-mixture models, which take into account the detection probability of the species, we were able to demonstrate the efficiency of both tree surveys and walk transect for the monitoring of L. cervus population and for the estimation of population size.
In our study, both methods showed relatively high detection probability (≥55%). This is comparable to those already reported for other L. cervus populations [40] and higher than those reported for other elusive beetles such as the cobblestone tiger beetle, Cicindela marginipennis and the longhorn beetle Morimus asper [43,44]. Although walk transect is currently recognized to be the most efficient and successful method for monitoring population of L. cervus [19,40], in our study, tree surveys performed slightly better than transect walks in detecting the species, especially with the progression of the season. Indeed, at the end of July, the probability to detect L. cervus in the tree surveys reached values close to 80% of what has been reported for evening walk transect only so far [40]. Although many monitoring techniques have already been proposed by researchers as alternatives to walk transect [13,45], the effectiveness of diurnal tree trunk surveys in detecting L. cervus has never been tested.
A similar technique, consisting of nocturnal tree trunk surveys, has recently been described [45] and, similar to diurnal tree trunk surveys, it relays on the principle that L. cervus aggregate on live standing tree trunks for feeding, but, unlike the method proposed in this study, the search for specimens takes place at night. This is probably the reason the detection efficiency of nocturnal tree trunks survey is reported to be much lower than that of evening transect walks [44]. Indeed, this method was originally proposed for survey of Cerambyx cerdo adults, which are nocturnal beetles [46], while L. cervus is clearly visible on trees in the daylight hours and flying during the sunset time slot from 8 pm to 12 pm [47].
While population estimates of abundance obtained by both tree surveys and transect walks methods were affected by the same set of environmental covariates, ecologically relevant for our target species [13,32,42], tree surveys proved to be more effective than transect walks in providing data for an accurate population density estimate. Indeed, tree surveys showed much smaller 95% credible intervals than those obtained by transect walks, highlighting the higher accuracy and precision of this sampling method.

4.2. Pros and Cons of Implementing Transect Walks and Tree Surveys for L. cervus Abundance

The main difference between the two methods considered in this study is the different sampling effort needed to obtain reliable density estimate. Our results showed that for an accurate estimation of L. cervus population density in a forested area of about 20 ha, tree surveys consisting of 13 trees collect similar abundance and population estimates to two transects of 500 m in length. The standard protocol for the monitoring of L. cervus population recommends one operator for each transect walk, and the implementation of up to four transects for a single site [13]. In our study, when we analyzed only a single transect walk at a time, we obtained a population density estimate that was half of that obtained by tree surveys. Therefore, probably because of the size of the forest, two transect walks, and therefore two operators, are needed, in order to derive a realistic population estimate. However, the time spent for checking L. cervus specimens on trees is greater than that for sighting individuals flying along a walk transect (2–3 h vs. 30 min per transect).
Walk transect is universally considered very cheap in terms of cost [13,19,45], but certainly it needs skilled operators able to recognize the species flying at some distance and without capture [13]. From our point of view, tree survey has a cost more or less comparable to that of the walk transect. Indeed, one operator working for 2–3 h costs as much as two operators working for 30 min. In fact, in the latter case, although the work time is lower, and therefore less expensive, some costs, such as that related to moving, are doubled. Moreover, tree surveys require less expert operators. Indeed, tree survey allows the operator to get very close to L. cervus species, thus increasing the probability of correctly identifying the target species, i.e., reducing type I error (false positive or overestimation of counts).

4.3. N-Mixture Models to Estimate Lucanus cervus Abundance

In this study, we applied a relatively recent method designed for unmarked individuals to estimate species abundance, accounting for correction for imperfect detection, namely binomial N-mixture models [22]. Using only replicated counts and assuming population closure, these models combined a Poisson distribution for spatial variation of latent abundance (N) with a binomial distribution, conditional on N, for the counts [48]. Actually, binomial N-mixture models have proven to be extremely useful in ecology, conservation, monitoring and have greatly increased over the years and many model extensions have been developed [49]. However, one of the most important aspects of N-mixture models is that they deal with imperfect detection. Actually, among several issues debated regarding estimating species abundance is how best to deal with detection probability, the probability of successfully recording a species during a survey at a site where the species truly occurs [50]. As a rule, detectability is hardly ever equal to 1, meaning that field data can contain an unknown proportion of “false zeroes”, i.e., recorded absences of a species, which in reality means that the species was present but missed during a survey [51]. Specifically, several factors can affect detection probability, such as conspicuousness, behavior, life history and rarity of a species, experience of observers as well as survey-specific factors such as survey methods, length of survey time, time of day or year, etc. [51]. Actually, in this study, we considered key factors related to detection probability such as the day and the time of day in which surveys were carried and for how long, together with microclimatic and weather conditions influencing species daily activities. Thus, in this study we combined the above-mentioned information, which was available for all the repeated surveys carried out for both the approaches adopted (transect walks and tree surveys), and therefore, we could fully correct our analyses for imperfect detection. In this way, we provided robust estimates of detection probability and abundance of L. cervus in our study area. Thus, we stress other researchers in developing a similar framework to estimate abundance corrected for the observation process (detection probability), when additional information is available, typically in the form of repeat surveys over a short time period, using N-mixture models.

5. Conclusions

This study represents a step forward in the planning of monitoring aimed at the conservation of L. cervus and the evaluation of its demographic trend. We validated a new monitoring technique, the diurnal tree trunk surveys, neglected by researchers until now. We demonstrated that, although both the methods investigated are effective, without time restrictions the diurnal tree trunk surveys perform better than transect walks in collecting data for estimating accurate population density. Finally, for the first time, we applied N-mixture models for estimating population abundance of L. cervus, with the huge advantage of producing estimates comparable with those of more traditional approaches (i.e., capture-mark-recapture) but with a smaller sampling effort and no need for manipulating individuals, which in turn reduces the risk of harming animals and spreading diseases. Due to the role of L. cervus as flagship and focal species, an accurate population estimate is the first step within a monitoring program aimed at the conservation of the species and, consequently of all the other saproxylic organisms living in the same habitat.

Author Contributions

Data collection, M.F., M.L., B.T. and D.C.; Funding acquisition, B.F.; Methodology, D.R.F.; Data analysis, M.P. and D.R.F.; Writing original draft, M.P. and D.R.F.; Writing—review & editing, M.P. and D.R.F. All authors have read and agreed to the published version of the manuscript.

Funding

This study was supported by the University of Pavia, with fund from the Italian Ministry for the Environment (Ministero dell’Ambiente e della Tutela del Territorio e del Mare).

Acknowledgments

We would like to thank Adriano Prandelli for having kindly sent us his degree thesis. Many thanks to the owners of the Colombere wood for having allowed access to their respective properties: Lanfranco Cirillo and Marinella Spagnoli, Giorgio Montini, Giulio Montini, Elisabetta Montini Luzzago and Lodovica Temponi Luzzago. Furthermore, thanks to Pierangelo Lanzanova for the complete and generous logistic collaboration during the study and the farm “Le Gatte” for allowing us to access the data of the weather station.

Conflicts of Interest

The authors declare that the research was conducted in the absence of any commercial or financial relationships that could be construed as a potential conflict of interest.

References

  1. Ollerton, J.; Winfree, R.; Tarrant, S. How many flowering plants are pollinated by animals? Oikos 2011, 120, 321–326. [Google Scholar] [CrossRef]
  2. Medeiros, M.J.; Eiben, J.A.; Haines, W.P.; Kaholoaa, R.L.; King, C.B.A.; Krushelnycky, P.D.; Magnacca, K.N.; Rubinoff, D.; Starr, F.; Starr, K. The importance of insect monitoring to conservation actions in Hawaii. Proc. Hawaii Entomol. Soc. 2013, 45, 149–166. [Google Scholar]
  3. Yang, L.H.; Gratton, C. Insects as drivers of ecosystem processes. Curr. Opin. Insect Sci. 2014, 2, 26–32. [Google Scholar] [CrossRef] [PubMed]
  4. Hallmann, C.A.; Sorg, M.; Jongejans, E.; Siepel, H.; Hofland, N.; Schwan, H.; Stenmans, W.; Müller, A.; Sumser, H.; Hörren, T.; et al. More than 75 percent decline over 27 years in total flying insect biomass in protected areas. PLoS ONE 2017, 12, e0185809. [Google Scholar] [CrossRef] [PubMed] [Green Version]
  5. Speight, M.C.D. Saproxylic invertebrates and their conservation. In Nature and Environment Series; Council of Europe: Strasbourg, France, 1989; Volume 42, p. 81. [Google Scholar]
  6. Alexander, K. Tree biology and saproxylic coleoptera: Issues of definitions and conservation language. Rev. Ecol. Terre Vie 2008, 63, 1–7. [Google Scholar]
  7. Cavalli, R.; Mason, F. Techniques for re-establishment of dead wood for saproxylic fauna conservation. In LIFE Nature Project NAT/IT/99/6245 Bosco Della Fontana (Mantova, Italy); Gianluigi Arcari Editore: Mantova, Italy, 2003; Volume 112. [Google Scholar]
  8. Carpaneto, G.M.; Mazziotta, A.; Coletti, G.; Luiselli, L.; Audisio, P. Conflict between insect conservation and public safety: The case study of a saproxylic beetle (Osmoderma eremita) in urban parks. J. Insect Conserv. 2010, 14, 555–565. [Google Scholar] [CrossRef]
  9. Bütler, R.; Lachat, T.; Larrieu, L.; Paillet, Y. Habitat trees: Key elements for forest biodiversity. In Integrative Approaches as an Opportunity for the Conservation of Forest Biodiversity; Kraus, D., Krumm, F., Eds.; European Forest Institute: Joensuu, Finland, 2013; pp. 84–91. [Google Scholar]
  10. Cálix, M.; Alexander, K.N.A.; Nieto, A.; Dodelin, B.; Soldati, F.; Telnov, D.; Vazquez-Albalate, X.; Aleksandrowicz, O.; Audisio, P.; Istrate, P.; et al. European Red List of Saproxylic Beetles; IUCN: Brussels, Belgium, 2018; p. 13. [Google Scholar]
  11. Seibold, S.; Brandl, R.; Buse, J.; Hothorn, T.; Schmidl, J.; Thorn, S.; Müller, J. Association of extinction risk of saproxylic beetles with ecological degradation of forests in Europe. Conser. Biol. 2015, 29, 382–390. [Google Scholar] [CrossRef] [PubMed]
  12. Carpaneto, G.M.; Campanaro, A.; Hardersen, S.; Audisio, P.; Bologna, M.A.; Roversi, P.F.; Sabbatini Peverieri, G.; Mason, F. The LIFE Project “Monitoring of insects with public participation” (MIPP): Aims, methods and conclusions. Nat. Conserv. 2017, 20, 1–35. [Google Scholar] [CrossRef]
  13. Bardiani, M.; Chiari, S.; Maurizi, E.; Tini, M.; Toni, I.; Zauli, A.; Campanaro, A.; Carpaneto, G.M.; Audisio, P. Guidelines for the monitoring of Lucanus cervus. Nat. Conserv. 2017, 20, 37–78. [Google Scholar] [CrossRef]
  14. Campanaro, A.; Hardersen, S.; Redolfi De Zan, L.; Antonini, G.; Bardiani, M.; Maura, M.; Maurizi, E.; Mosconi, F.; Zauli, A.; Bologna, M.A.; et al. Analyses of occurrence data of protected insect species collected by citizens in Italy. Nat. Conserv. 2017, 20, 265–297. [Google Scholar] [CrossRef] [Green Version]
  15. Maurizi, E.; Campanaro, A.; Chiari, S.; Maura, M.; Mosconi, F.; Sabatelli, S.; Zauli, A.; Audisio, P.; Carpaneto, G.M. Guidelines for the monitoring of Osmoderma eremita and closely related species. Nat. Conserv. 2017, 20, 79–128. [Google Scholar] [CrossRef] [Green Version]
  16. Redolfi De Zan, L.; Bardiani, M.; Antonini, G.; Campanaro, A.; Chiari, S.; Mancini, E.; Maura, M.; Sabatelli, S.; Solano, E.; Zauli, A.; et al. Guidelines for the monitoring of Cerambyx cerdo. Nat. Conserv. 2017, 20, 129–164. [Google Scholar] [CrossRef] [Green Version]
  17. Thomaes, A.; Verschelde1, P.; Mader, D.; Sprecher-Uebersax, E.; Fremlin, M.; Onkelinx, T.; Méndez, M. Can we successfully monitor a population density decline of elusive invertebrates? A statistical power analysis on Lucanus cervus. Nat. Conserv. 2017, 19, 118. [Google Scholar] [CrossRef]
  18. Kull, T.; Sammul, M.; Kull, K.; Lanno, K.; Tali, K.; Gruber, B.; Schmeller, D.; Henle, K. Necessity and reality of monitoring threatened European vascular plants. Biodivers. Conserv. 2008, 17, 3383–3402. [Google Scholar] [CrossRef]
  19. Chiari, S.; Zauli, A.; Audisio, P.; Campanaro, A.; Donzelli, P.F.; Romiti, F.; Svensson, G.P.; Tini, M.; Carpaneto, G.M. Monitoring presence abundance and survival probability of the stag beetle Lucanus cervus using visual and odour-based capture methods: Implications for conservation. J. Insect Conserv. 2014, 1, 99–109. [Google Scholar] [CrossRef]
  20. Nachman, G.; Skovgård, H. A simulation study of how simple mark-recapture methods can be combined with destructive subsampling to facilitate surveys of flying insects. Environ. Entomol. 2012, 41, 141–151. [Google Scholar] [CrossRef]
  21. Royle, J.A.; Nichols, J.D. Estimating abundance from repeated presence-absence data or point counts. Ecology 2003, 84, 777–790. [Google Scholar] [CrossRef]
  22. Royle, J.A. N-mixture models for estimating population size from spatially replicated counts. Biometrics 2004, 60, 108–115. [Google Scholar] [CrossRef]
  23. Fiske, I.; Chandler, R. UNMARKED: An R package for fitting hierarchical models of wildlife occurrence and abundance. J. Stat. Softw. 2011, 43, 1–23. [Google Scholar] [CrossRef] [Green Version]
  24. MacKenzie, D.I.; Nichols, J.D.; Royle, J.A.; Pollock, K.H.; Bailey, L.; Hines, J. Occupancy Estimation and Modeling: Inferring Patterns and Dynamics of Species Occurrence; Elsevier: San Diego, CA, USA, 2006; p. 324. [Google Scholar]
  25. Knaus, P.; Antoniazza, S.; Wechsler, S.; Guélat, J.; Kéry, M.; Strebel, N.; Sattler, T. Distribution and population trends of birds in Switzerland and Liechtenstein. In Swiss Breeding Bird Atlas 2013–2016; Swiss Ornithological Institute: Sempach, Switzerland, 2018. [Google Scholar]
  26. Prandelli, A. Inquadramento Dendrometrico-Strutturale di un Bosco Planiziale in Località Capriano del Colle (BS). Master’s Thesis, University of Padua, Padua, Italy, 2005; p. 97. [Google Scholar]
  27. Audisio, P.; Baviera, C.; Carpaneto, G.M.; Biscaccianti, A.B.; Battistoni, A.; Teofili, C.; Rondinini, C. Lista Rossa IUCN dei Coleotteri Saproxilici Italiani; Comitato Italiano IUCN e Ministero Dell’ambiente e Della Tutela del Territorio e del Mare: Roma, Italy, 2014. [Google Scholar]
  28. Hawes, C.J. The Stag Beetle Lucanus cervus (L.) (Coleoptera: Lucanidae) in the County of Suffolk (England): Distribution and monitoring. In Proceedings of the 3rd Symposium and Workshop on the Conservation of Saproxylic Beetles, Riga, Latvia, 7–11 July 2004; pp. 51–67. [Google Scholar]
  29. Harvey, D.J.; Gange, A.C.; Hawes, C.J.; Rink, M.; Abdehalden, M.; Al-Fulaij, N.; Asp, T.; Ballerio, A.; Bartolozzi, L.; Brustel, H.; et al. Bionomics and distribution of the stag beetle Lucanus cervus across Europe. Insect Conserv. Diver. 2011, 4, 23–38. [Google Scholar] [CrossRef]
  30. Campanaro, A.; Bardiani, M.; Spada, L.; Carnevali, L.; Montalto, F.; Antonini, G.; Mason, F.; Audisio, P. Linee guida per il monitoraggio e la conservazione dell’entomofauna saproxilica. In Quaderni Conservazione Habitat 6; Cierre Grafica: Verona, Italy, 2011; pp. 1–8. [Google Scholar]
  31. Nieto, A.; Alexander, K.N.A. European Red List of Saproxylic Beetles; Publications Office of the European Union: Luxemburg, 2010; pp. 1–56. [Google Scholar]
  32. Thomaes, A.; Kervyn, T.; Maes, D. Applying species distribution modelling for the conservation of the threatened saproxylic Stag Beetle (Lucanus cervus). Biol. Conserv. 2008, 141, 1400–1410. [Google Scholar] [CrossRef]
  33. Percy, C.; Bassford, G.; Keeble, V. Findings of the 1998 National Stag Beetle Survey; People’s Trust for Endangered Species: London, UK, 2000; pp. 1–46. [Google Scholar]
  34. Buse, J.; Ranius, T.; Assmann, T. An endangered longhorn beetle associated with old oaks and its possible role as an ecosystem engineer. Conserv. Biol. 2008, 22, 329–337. [Google Scholar] [CrossRef] [PubMed]
  35. Ducasse, J.J.; Brustel, H. Saproxylic beetles in the Grésigne forest management. Rev. Ecol. Terre Vie 2008, 10, 75–80. [Google Scholar]
  36. Roberge, J.M.; Angelstam, P. Usefulness of the umbrella species concept as a conservation tool. Conserv. Biol. 2004, 18, 76–85. [Google Scholar] [CrossRef]
  37. Bardiani, M.; Tini, M.; Carpaneto, G.M.; Audisio, P.; Bussola, E.; Campanaro, A.; Cini, A.; Maurizi, E.; Mason, F.; Sabbatini Peverieri, G.; et al. Effects of trap baits and height on stag beetle and flower chafer monitoring: Ecological and conservation implications. J. Insect Conserv. 2017, 21, 157–168. [Google Scholar] [CrossRef]
  38. Fremlin, M.; Hendriks, P. Sugaring for stag beetles—Different feeding strategies of Lucanus cervus and Dorcus parallelipipedus. Bull. Amat. Entomol. Soc. 2011, 70, 57–67. [Google Scholar]
  39. Jansson, N. Attraction of stag beetles with artificial sap in Sweden. Bull. Amat. Entomol. Soc. 2011, 70, 51–56. [Google Scholar]
  40. Campanaro, A.; Zapponi, L.; Hardersen, S.; Méndez, M.; Al Fulaij, N.; Audisio, P.; Bardiani, M.; Carpaneto, G.M.; Corezzola, S.; Della Rocca, F.; et al. A European monitoring protocol for the stag beetle; a saproxylic flagship species. Insect Conserv. Diver. 2016, 9, 574–584. [Google Scholar] [CrossRef]
  41. Zuur, A.F.; Ieno, E.N.; Elphick, C.S. A protocol for data exploration to avoid common statistical problems. Methods Ecol. Evol. 2010, 1, 3–14. [Google Scholar] [CrossRef]
  42. Della Rocca, F.; Bogliani, G.; Milanesi, P. Patterns of distribution and landscape connectivity of the stag beetle in a human-dominated landscape. Nat. Conserv. 2017, 19, 19–37. [Google Scholar] [CrossRef]
  43. Hudgins, R.M.; Norment, C.; Schlesinger, M.D. Assessing detectability for monitoring of rare species: A case study of the cobblestone tiger beetle (Cicindela marginipennis Dejean). J. Insect Conserv. 2012, 16, 447–455. [Google Scholar] [CrossRef]
  44. Chiari, S.; Bardiani, M.; Zauli, A.; Hardersen, S.; Mason, F.; Spada, L.; Campanaro, A. Monitoring of the saproxylic beetle Morimus asper (Sulzer, 1776) (Coleoptera: Cerambycidae) with freshly cut log piles. J. Insect Conserv. 2013, 17, 1255–1265. [Google Scholar] [CrossRef]
  45. Vrezec, A.; Ambrožič, Š.; Kapla, A. An overview of sampling methods tests for monitoring schemes of saproxylic beetles in the scope of Natura 2000 in Slovenia. In Saproxylic beetles in Europe: Monitoring Biology and Conservation, Ljubljana (Slovenia), June 2010; Jurc, M., Ed.; Slovenian Forestry Institute Sliva Slovenica: Ljubljana, Slovenia, 2012; pp. 73–90. [Google Scholar]
  46. Neumann, V.; Schmidt, V. New ecological-faunistic aspects of Cerambyx cerdo. (Col.: Cerambycidae). Hercynia NF 2001, 34, 286–288. [Google Scholar]
  47. Tini, M.; Bardiani, M.; Campanaro, A.; Chiari, S.; Mason, F.; Maurizi, E.; Toni, I.; Audisio, P.; Carpaneto, G.M. A stag beetle’s life: Sex-related differences in daily activity and behaviour of Lucanus cervus (Coleoptera: Lucanidae). J. Insect Conserv. 2017, 21, 897–906. [Google Scholar] [CrossRef]
  48. Kéry, M. Identifiability in N-mixture models: A large-scale screening test with bird data. Ecology 2018, 99, 281–288. [Google Scholar] [CrossRef] [PubMed]
  49. Kéry, M.; Royle, J.A. Applied hierarchical modelling in ecology—Modeling distribution, abundance and species richness using R and BUGS. In Volume 1: Prelude and Static Models; Elsevier: Amsterdam, The Netherlands; Academic Press: Cambridge, MA, USA, 2016. [Google Scholar]
  50. Kéry, M. Towards the modelling of true species distribution. J. Biogeogr. 2011, 38, 617–618. [Google Scholar] [CrossRef]
  51. Keller, V.; Herrando, S.; Voříšek, P.; Franch, M.; Kipson, M.; Milanesi, P.; Martí, D.; Anton, M.; Klvaňová, A.; Kalyakin, M.V.; et al. European bird census. In European Breeding Bird Atlas 2: Distribution, Abundance and Change; Council & Lynx Edicions: Barcelona, Spain, 2020. [Google Scholar]
Figure 1. Study area. Yellow–green scale indicates low–high tree cover density, white stars indicate tree surveyed while blue lines walked transects.
Forests 11 01085 g001
Table 1. Predictor variables considered and their relative VIF (Variance Inflation Factor). Predictors with VIF > 3 were not considered in developing N-mixture models.
CovariatesUnitMeanRangeVIF
Detection probabilityDate of observationDategiulian day191.77177–2041.951
Time of observationTime_meanmin13:4908:30–21:351.375
Time spent during the sessionTime_spentmin103.4130–2402.392
Mean temperatureTemp_mean°C27.3623.02–27.362.981
Mean relative humidityUR_Mean%68.9658.31–75.911.299
Duration of Leaf wetnessBF_MeanTimemin6.253.75–8.961.618
Daily PrecipitationsPrecipitationsmm00–0>3
Mean Daily insolationIns_MeanmV4883.794733.01–5000.251.711
AbundanceDistance to waterDist_waterm1667.611382.43–1838.41>3
Distance to dense human settlementsDist_hum_settm623.16452.55–832.552.139
Distance to roadsDist_roadsm2909.422738.77–3089.732.022
Distance to broadleaf forestsDist_bl_forestsm71.800–218.281.924
Distance to riparian formationsDist_rip_forestsm138.270–3701.882
Distance to shrublandsDist_shrubsm380.41227.99–571.421.868
Distance to grasslandsDist_grassm601.99296.27–772.251.826
Distance to urban green parksDist_ug_parksm1331.901080–17301.736
Distance to croplandsDist_cropsm6.350–901.201
Distance to sparse human settlementsDist_shum_settm179.5284.85–366.981.124
Tree cover densityTCDn/m236.470–85
Table 2. Resulting β-coefficients and relative standard deviation (s.d.) of the predictor variables considered in N-mixture models.
Covariatesβ ± s.d.
Transect WalksTree Surveys
Detection probabilityIntercept *−11.3 ± 0.51−3.71 ± 0.45
Date *1.05 ± 0.591.41 ± 0.18
Time_mean0.98 ± 0.050.92 ± 0.04
Time_spent **NA2.77 ± 0.14
Temp_mean0.29 ± 0.130.16 ± 0.07
UR_Mean−0.73 ± 0.02−0.03 ± 0.04
BF_MeanTime−0.41 ± 0.17−0.04 ± 0.07
Ins_Mean0.57 ± 0.040.08 ± 0.01
AbundanceIntercept *−3.93 ± 0.52−1.38 ± 0.83
Dist_bl_forests *−5.83 ± 0.17−3.03 ± 0.47
Dist_crops *1.32 ± 0.032.56 ± 0.74
Dist_grass *0.02 ± 0.090.48 ± 0.22
Dist_roads0.48 ± 0.431.75 ± 0.94
Dist_hum_sett *1.41 ± 0.121.19 ± 0.93
Dist_shum_sett−0.85 ± 0.030.96 ± 0.15
Dist_shrubs−1.38 ± 0.06−0.72 ± 0.31
Dist_rip_forests *−2.49 ± 0.05−3.26 ± 1.01
Dist_ug_parks−0.74 ± 0.130.76 ± 0.99
TCD *1.01 ± 0.112.51 ± 0.06
* p < 0.001 for both transect and trees. ** p < 0.001 only for trees surveys.

