Article

Perceived Loudness Sensitivity Influenced by Brightness in Urban Forests: A Comparison When Eyes Were Opened and Closed

1
School of Architecture and Urban-Rural Planning, Fuzhou University, Fuzhou 350108, China
2
Faculty of Forestry, University of British Columbia, Vancouver, BC V6T 0B2, Canada
3
Faculty of Engineering, Fuzhou University, Fuzhou 350108, China
*
Author to whom correspondence should be addressed.
Forests 2020, 11(12), 1242; https://doi.org/10.3390/f11121242
Submission received: 14 October 2020 / Revised: 12 November 2020 / Accepted: 21 November 2020 / Published: 24 November 2020

Abstract

:
Soundscape plays a positive, health-related role in urban forests, and there is a competitive allocation of cognitive resources between soundscapes and lightscapes. This study aimed to explore the relationship between perceived loudness sensitivity and brightness in urban forests through eye opening and closure. Questionnaires and measuring equipment were used to gather soundscape and lightscape information at 44 observation sites in urban forested areas. Diurnal variations, Pearson’s correlations, and formula derivations were then used to analyze the relationship between perception sensitivity and how perceived loudness sensitivity was influenced by lightscape. Our results suggested that soundscape variation plays a role in audio–visual perception in urban forests. Our findings also showed a gap in perception sensitivity between loudness and brightness, which conducted two opposite conditions bounded by 1.24 dBA. Furthermore, we found that the effect of brightness on perceived loudness sensitivity was limited if variations of brightness were sequential and weak. This can facilitate the understanding of individual perception to soundscape and lightscape in urban forests when proposing suitable design plans.

1. Introduction

Urban forests contribute to healthy environments for the public in high-density cities [1,2]. Forested areas provide health benefits to individuals through the stimulation of sensorium, such as smell, vision, and hearing [3,4]. Health benefits of urban forests include improved cardiopulmonary function, reduced mortality in stroke patients, reduced obesity rates, and so on [5,6,7]. The studies of quieter and more positive environments have shown they prevent negative health effects related to noise, such as sleep disorders with awakenings [8], learning impairment [9,10], hypertension ischemic heart disease [11], and annoyance [12]. Also, soundscapes play a positive health-related role in urban areas, especially natural soundscapes in urban forests, which could increase health levels of individuals [13,14,15]. Perceived soundscape occurrences contribute to enhanced connections between soundscape and other perceptions in urban areas [16,17]. These factors demonstrate that soundscapes are not only the result of energy, but also the activators of health in urban forests. Due to the presence of various plants growing in the vertical axis, which conduct various light and shadow conditions, lightscape is a potential driver that affects soundscape in urban forests [18,19].
There are an increasing number of studies concerning audiovisual perception in urban areas, such as audiovisual interactions between soundscape and landscape perception [17,20,21,22], soundscape assessment [23], and improving the quality of life in a place [24]. Perceiving various soundscape benefits pleasantness during limited tour time, suggesting that individuals may allocate more sensory attention to hearing [16,25,26]. The allocation of cognitive resources depends on enduring disposition and momentary intentions in cognitive allocation policy [27,28]. Visual and auditory senses occupy the primary cognition in urban environments, suggesting that soundscape and lightscape may conduct competitive allocation of cognitive resources [29,30,31,32]. For the allocation of cognitive resources, sensory sensitivity is a potential driver to explore, as it may contribute to understanding perceptive patterns of individuals in urban forests [33,34,35]. Individuals are sensitive to the environment, which modulates their behavioral visual sensitivity and neural responses with visual stimuli of different intensity [36,37]. Also, sensory cells response to sound vibration, contributing to auditory sensation and the sensitivity of sensory fibers [38,39].
Several studies have contributed to the research on perceived soundscapes in urban forests, such as the differences between coniferous and broad-leaved forests, as well as the uncertainty of perceived occurrences, cognitive persistence, and space visualization [15,16,29,40,41]. Unfortunately, there is a research gap concerning perceived soundscape sensitivity, representing the variation intensity of a perceived soundscape, in urban forests. Auditory attention fluctuates when eyes are opened and closed, especially during a state of relaxation [42]. Eye closure reduces memory attenuation caused by auditory distraction, contributing to enhancement of the auditory attention [43]. Therefore, a majority of visual attention drops and only a small amount of static visual attention remains when eyes are closed [44]. To control the effects of visual attention on hearing, eye opening and closure contributes to perceived loudness and brightness in urban forests. Thus, this study aims to (1) observe the diurnal variation of the soundscape and lightscape in urban forests when eyes are opened and closed, respectively, and (2) explore the relationship between perceived loudness sensitivity and brightness in urban forests when eyes are opened and closed.

2. Methodology

2.1. Study Area

Our study was conducted in Vancouver, British Columbia, Canada, in three urban forested areas: Pacific Spirit Park (8,740,000 m2), Stanley Park (4,049,000 m2), and Queen Elizabeth Park (528,000 m2). Pacific Spirit Park (PP) is located on the University of British Columbia’s Endowment Lands, and there are many winding paths and gentle rolling hills containing woody debris. Stanley Park (SP) is a world-renowned urban forested area located on a peninsula at the northwestern side of downtown Vancouver, with well-maintained paved and dirt paths. Queen Elizabeth Park (QP) is located in the geographic center of Vancouver, and contains gorgeously landscaped quarry gardens, an arboretum with a collection of exotic and native trees, renowned sculptures scattered throughout the park, and several recreational sites (e.g., tennis, lawn bowling, and pitch and putt). The values of the forest coverage in PP, SP, and QP are 85.81%, 65.43%, and 51.33%, respectively, representing common urban forested areas. Overall, the urban forested areas have a high level of forest cover, potential sources of natural sounds, and obvious conditions for light and shadow, which is suitable for soundscape and lightscape research.
Forty-four sites were selected in PP, SP, and QP. Based on the different sizes of the urban forest areas, 18 sample sites were chosen in PP, 15 in SP, and 11 in QP (See Figure 1). We selected observation sites with various landscape areas (e.g., visitor paths, junctions, lakeside, etc.), so participants could be exposed to a variety of soundscapes and lightscapes. The forested spaces of observation sites included open, semi-open, and closed spaces, so that the variation range of crown density was 11.5% to 93.2% in these observation sites. To remove the obvious perceived soundscape sensitivity in urban forests when eyes were opened and closed, the presence of plants in the vertical spaces was made a requirement at each site.
The acoustic environmental conditions at each site were measured for 5 min in PP, SP and QP, including LAeq, LAmin, LAmax, L10, L90, and LCeqLAeq. The LAeq is the A-weighted equivalent, continuous sound level, measured in decibels. LAmin and LAmax represent minimum and maximum instantaneous sound pressure levels, respectively. L10 and L90, which are statistical levels, represent the sound level exceeded for 10% and 90% of the time, respectively. LCeqLAeq, which is low-frequency content, represents the difference between LCeq and LAeq. The measured LAeq values ranged from 47.2 dBA to 58.0 dBA. Measured LAmin and LAmax ranged from 31.9 dBA to 51.5 dBA, and 57.0 dBA to 76.5 dBA, respectively. The measured L10 and L90 ranged from 40.2 dB to 68.2 dB, and 34.6 dB to 62.3 dB, respectively. Thus, we found that the LAeq interval partially coincided with other indexes, which suggested a potential index for our study. In additional, measured LCeqLAeq ranged from 6.2 dB to 14.4 dB.

2.2. Soundscape and Lightscape Information
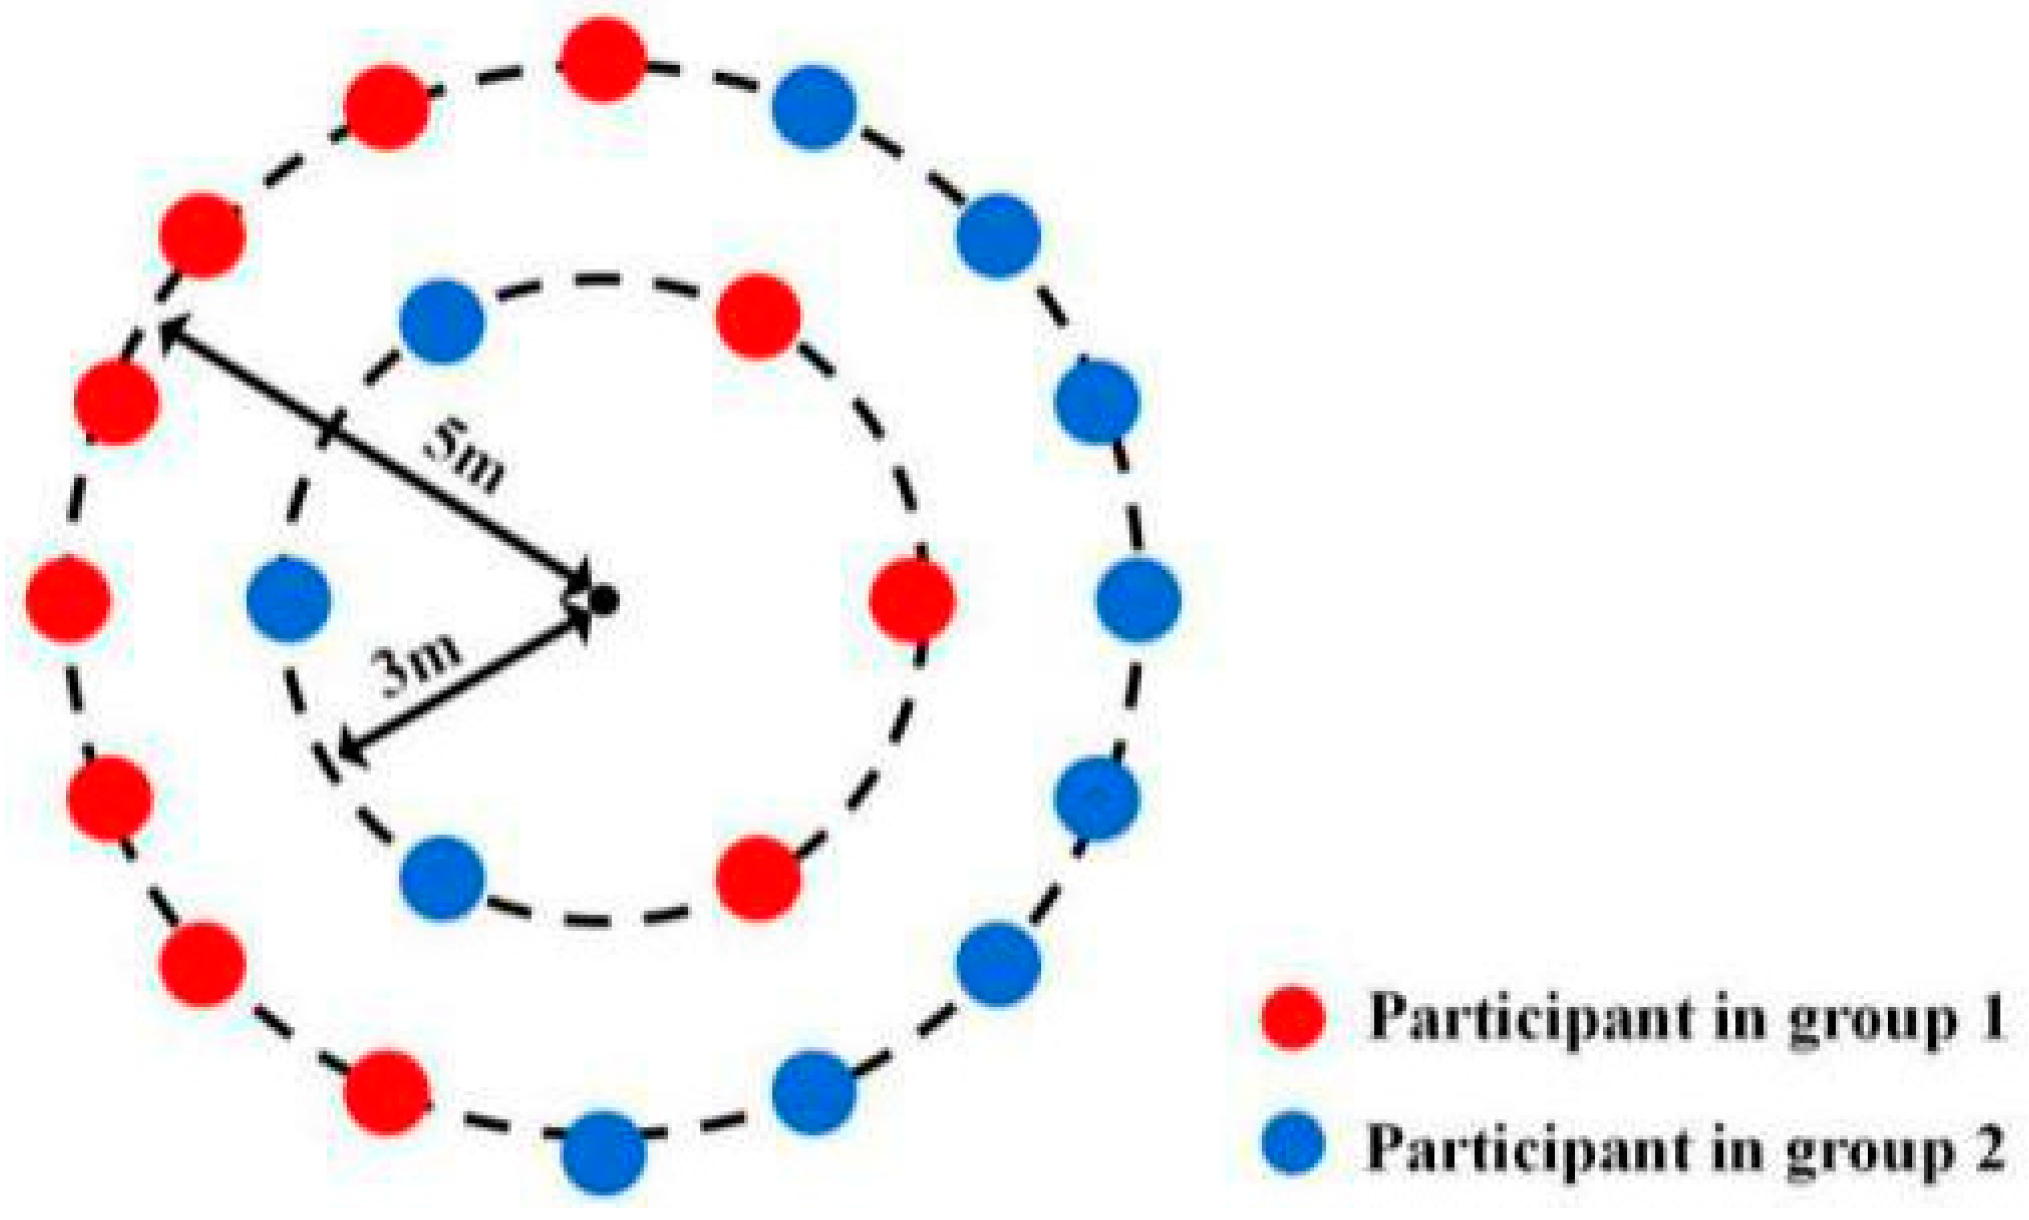
Questionnaires and measuring equipment were used to gather soundscape and lightscape information in urban forested areas. These are effective methods supported by technical standards and previous studies [17,29,45,46,47,48,49].
For the questionnaire methodology, data was collected through a two-part questionnaire conducted with participants when their eyes were opened and closed in different tests. Previous studies have shown that perceived loudness and brightness can directly reflect how individuals feel about acoustical and visual environments, and the subjective errors of these indicators are stable and acceptable in psychological cognition [29,50,51]. Thus, these indicators were adopted to measure the perception of soundscape and lightscape in our two-part questionnaire (See Figure S1).
The first part of the questionnaire, tested when eyes were opened, included the perceived loudness of soundscape and perceived brightness of lightscape, represented respectively by ss,o and sl. The second part, tested during eye closure, only included the perceived loudness of soundscape, represented by ss,c. Furthermore, a five-point ordinal scale was adopted [37,45] for the soundscape and lightscape information. The scale of perceived loudness included strongly loud (+5), slightly loud (+4), neither loud nor quiet (+3), slightly quiet (+2), and strongly quiet (+1). The scale of perceived brightness included strongly bright (+5), slightly bright (+4), neither bright nor dark (+3), slightly dark (+2), and strongly dark (+1).
Measuring equipment was used to collect the objective information data of soundscape and lightscape. Previous studies have suggested that the A-weighted sound pressure level (LAeq) is the most widely spread index to measure the noise levels in an urban environment [52,53]. Uniformity of illuminance (UI), which denotes the ratio of minimum illumination to mean illumination, is an appropriate physical index to relate to lightscape, which contributes to the comparison of light and shadow in the urban forests [29,50]. Thus, these indicators were adopted to express representative physical quantities of soundscape and lightscape in urban forests.
Furthermore, to explore the sensitivity of perceived soundscape influenced by lightscape, variations of soundscape and lightscape were necessary in the study. Thus, we introduced five parameters of variation, which included 5-min, A-weighted, equivalent sound pressure level (LAeq,5min); ΔUI; Δss,o; Δsl; and Δss,c. ΔLAeq,5min and ΔUI denoted the difference of LAeq,5min and UI between repetitions in given time periods at the same sites, respectively, while Δss,o and Δsl denote the difference of ss,o and sl between repetitions in given time periods at the same observation sites when eye were opened, respectively. Similarly, Δss,c denotes the difference of ss,c between repetitions in given time periods at the same observation sites when eyes were closed.

2.3. Procedure

Young adults make up majority of visitors in urban forests [16,54]. Twenty-two healthy participants (10 females and 12 males, average age = 27.5 ± 5.5 years) with normal hearing were selected to fill out our questionnaire [16,17,55]. All participants were required to sign a consensus outlining the procedures and details of the survey. They could quit the experiment at any point if they felt uncomfortable during the investigative period, which was a feature approved by the Ethics Committee. Participants then underwent a training process, which included being familiarized with the content of the questionnaire, and performed pilot studies to practice the recording process and experience spatial conditions in the forested areas. The training process was to minimize the impact of subjective factors, such as cultural background of participants, which could lead to fluctuating and shaky results [16,56].
The trained participants were divided into two groups, each with eleven participants. These groups were exposed to the soundscape and lightscape at the observation sites for five minutes, then they filled out questionnaires and repeated above process at each site. During the odd number of repetitions, the first group opened their eyes and the second group closed their eyes; subsequently, the even number of repetitions had the first group close their eyes and the second group open their eyes. Each group repeated the process three times at each site and given time period, six times in total. Figure 2 presents the average size of the group and the overall setting.
Sunny days during the period of May 2019 to July 2019, not including holidays, were selected for the investigative conditions. The survey included six time periods: 8:00 to 10:00, 10:00 to 12:00, 12:00 to 14:00, 14:00 to 16:00, 16:00 to 18:00, and 18:00 to 20:00. In total, the survey spanned 41 days.
LAeq,5min, UI, and sound recording (binaural, 96 kHz sampling rate and 24-bit resolution) were measured using Type 1 sound level meters (AWA6228+), digital audiotape recorders (Sony PCM-D100, Minato, Tokyo, Japan), and lux meters (PM6612, Shenzhen, China), respectively, during the survey. Then we calculated the mean value of ss,o, sl, Δss,c, LAeq,5min, and UI, as well as the loudness of psychoacoustics (LO), based on International Organization for Standardization (ISO) 532B (DIN45631). Furthermore, repeated tests were required to be independent and discontinuous at each site and time period, suggesting that each repeated test was conducted on a different day, which helped avoid a disturbance of cognitive soundscape and lightscape at the same site and time period. For statistical analysis, data fitting, data visualization, and Pearson’s correlation coefficients were carried out in SPSS 21.0, OriginPro 2017, and MATLAB R2018a.

3. Results

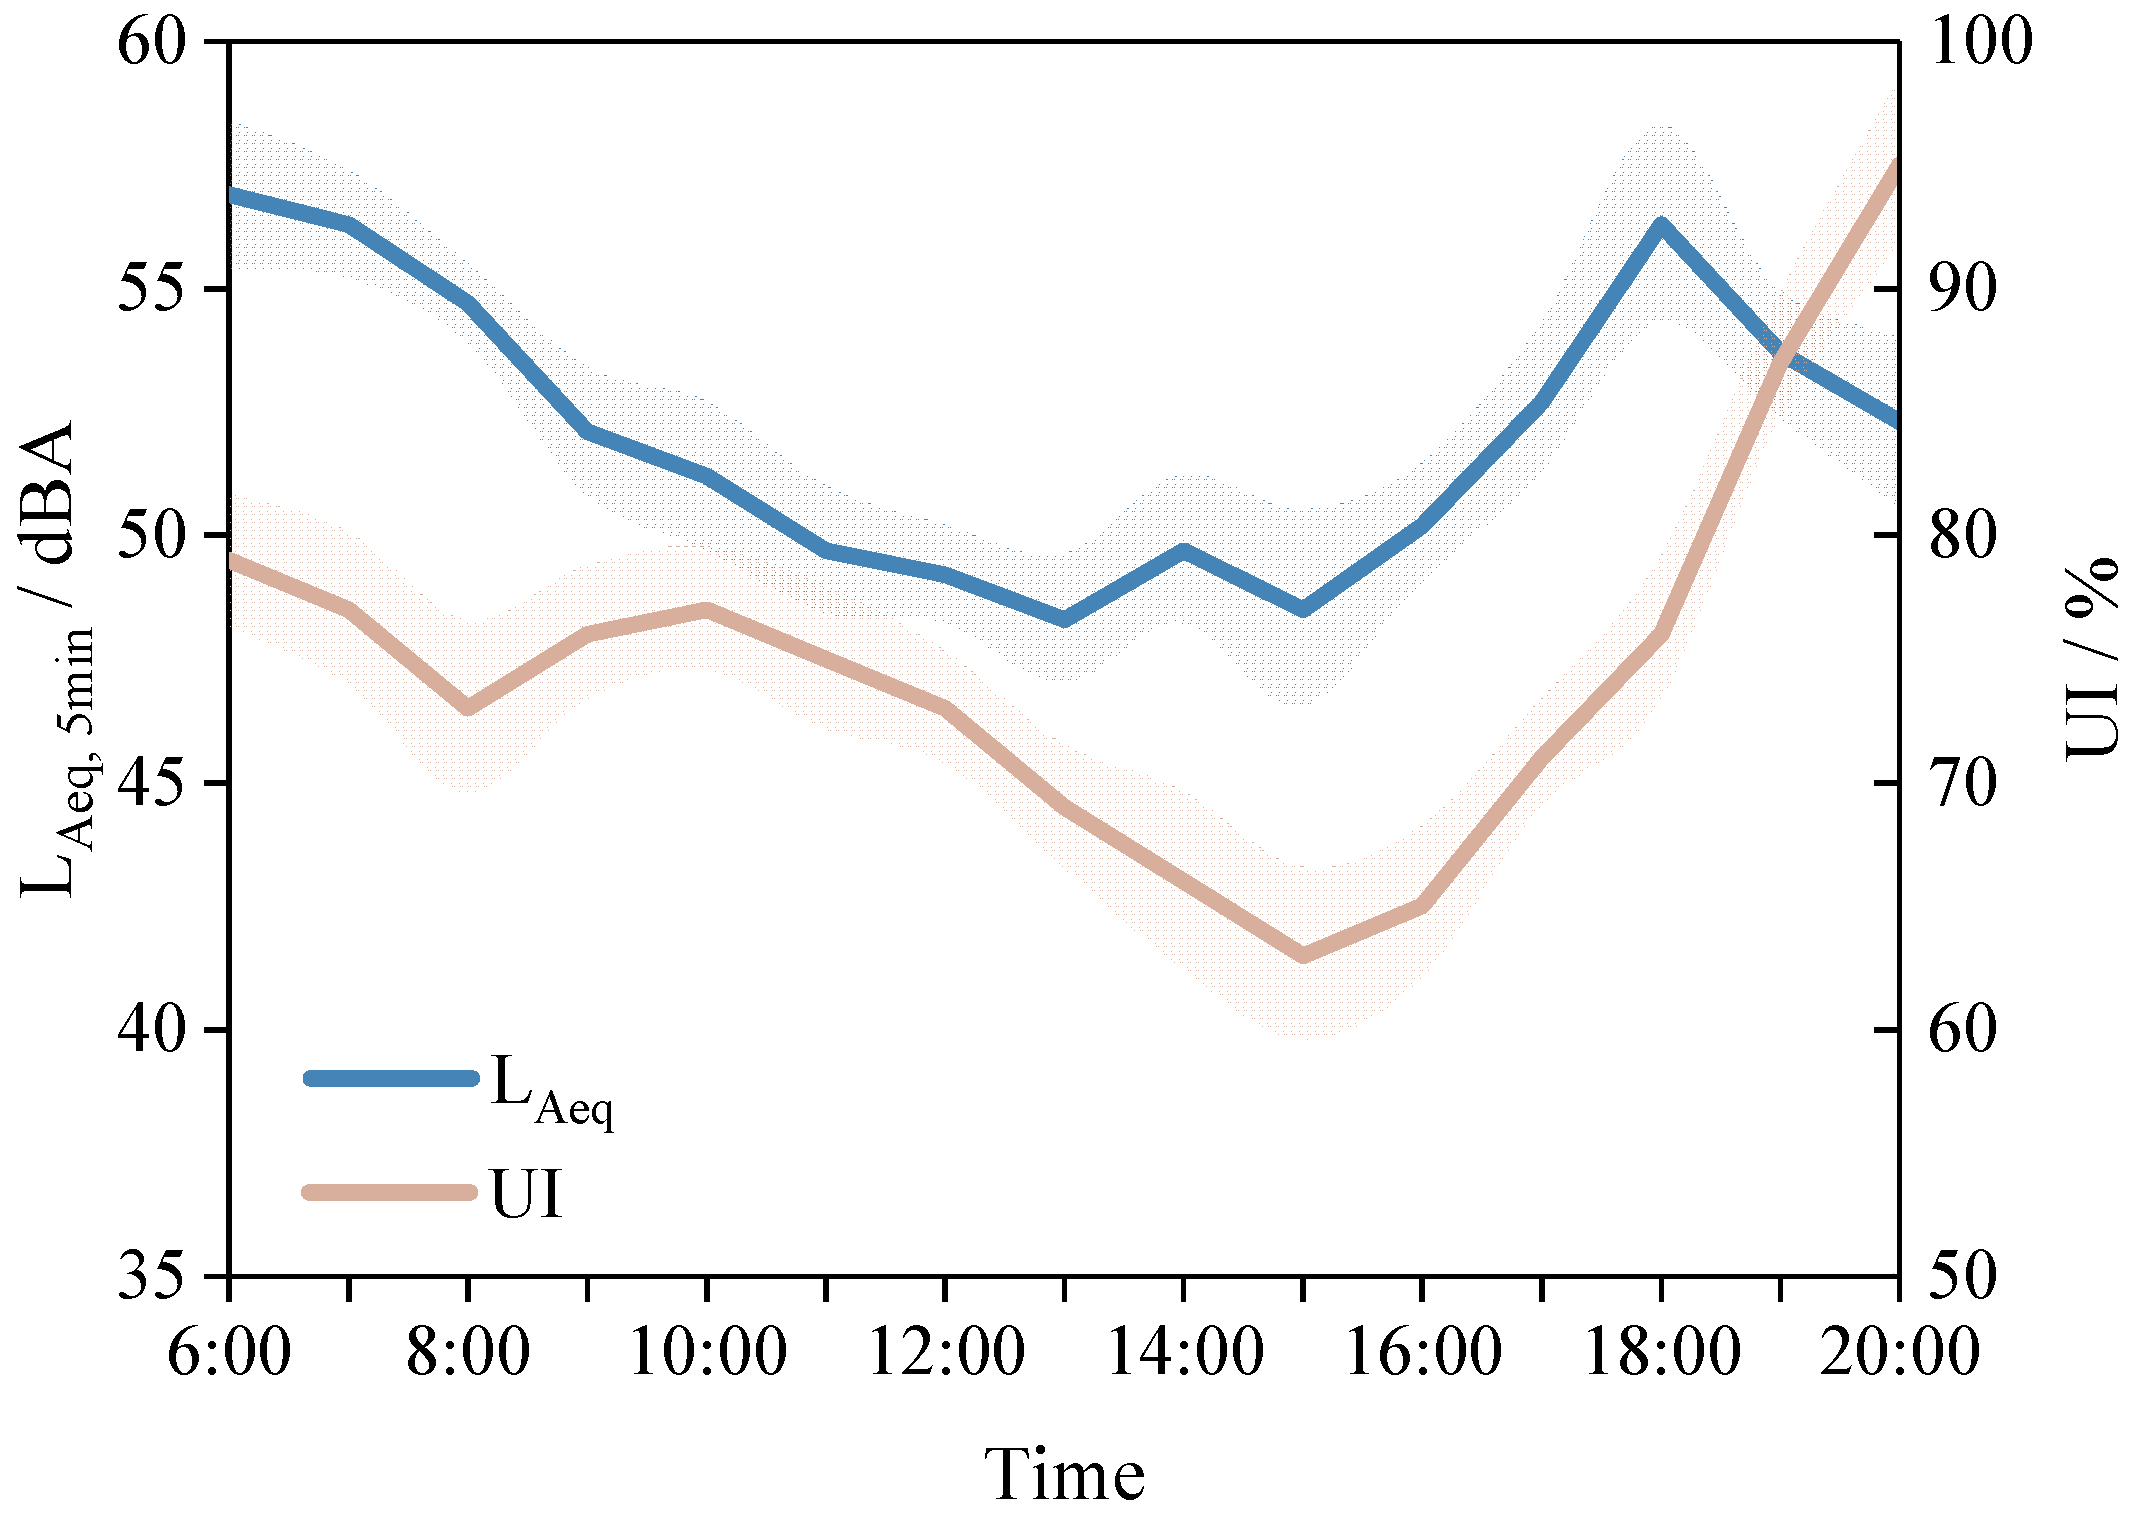
3.1. Diurnal Variation of Soundscape and Lightscape

The diurnal variation of LAeq,5min and uniformity of illuminance (UI) are shown in Figure 3, including the maximum, minimum, and mean values. We found that during morning (6:00 to 8:00) and dusk (18:00 to 20:00) intervals, LAeq,5min and UI conducted higher value interval sets, at 54.7–56.9 dBA and 73.0–95.0%, respectively. Figure 4 shows the distribution of perceived loudness and brightness with eyes opened and closed. In this figure, the left axis represented the scale of perception from +5 to +1, corresponding to the diameter axis of the circle in the distribution map. From Figure 4a,b, the perceived loudness of the soundscape shows relatively high values in the morning and dusk, which was similar to the result of LAeq,5min. As shown in Figure 4c, the perceived brightness of a lightscape occupied high values from 9:00 to 14:00, which was the opposite of the result of UI. In addition, comparing eye openings and closures, we found a decrease in perceived loudness when eyes were opened. Therefore, we suggest lightscape potentially affected perceived soundscape sensitivity in the urban forests.

3.2. Relationship between the Variations of Soundscape and Lightscape

To find the internal relationship between subjective and objective variations of soundscape and lightscape, Pearson correlation coefficients were conducted. As shown in Table 1, there were notable correlations between all parameters. The ΔLAeq,5min and ΔLO was strongly correlated with all perceived parameters (Δss,c, Δss,o, Δsl), and these perceived parameters were related to one another. In addition, ΔUI was strongly correlated with Δsl. These results suggested there are potential positive tendencies among the parameters of soundscape and lightscape.
Hierarchical cluster analysis (HCA) was used to analyze the relationship between variations of soundscape and lightscape (See Figure 5). Three clusters were classified by HCA, including clusters A, B, and C. Further, the subjective and objective variations of soundscape and lightscape were respectively fitted, and the results of HCA are combined in Figure 6a,b. From Figure 6a, Δss,c maintained a higher value than Δss,o when the sound pressure difference was from 0.5 to 3.5 dBA. When ΔLAeq,5min was 1.24 dBA, there was a maximum gap between Δss,c and Δss,o near the boundary of cluster B and C. From Figure 6b, there was a positive correlation with the decline in growth between ΔUI and Δsl. Based on our hypothesis, these findings suggested that the gap between Δss,c and Δss,oss,c − Δss,o) may be related to the value of Δsl.
When ΔLAeq,5min was 1.24 dBA, opposite trends of Δss,c − Δss,o were determined; therefore, when ΔLAeq,5min exceeded or was below 1.24 dBA, there were different trends of Δsl. Figure 7 shows the relationship between Δss,c − Δss,o and Δsl, including their confidence intervals (blue and pink areas). There was a positive trend when ΔLAeq,5min was more than 1.24 dBA, and a negative trend when ΔLAeq,5min was less than 1.24 dBA. After data fitting and transformation, the equations that show the relationship between Δss,c, Δss,o, and Δsl were obtained as follows:
(1) When ΔLAeq,5min < 1.24 dBA,
Δ s l = 0.967 ( Δ s s , c Δ s s , o ) + 0.453
Δ s s , o = Δ s s , c + 1.034 Δ s l 0.468
(2) When ΔLAeq,5min ≥ 1.24 dBA
Δ s l = 1.691 ( Δ s s , c Δ s s , o ) + 0.030
Δ s s , o = Δ s s , c 0.591 Δ s l + 0.018
where Δss,o and Δsl denote the difference of ss,o and sl between sequential time periods at the same observation sites when eyes were opened, respectively. Similarly, Δss,c denotes the difference of ss,c between sequential time periods at same observation sites when eyes were closed.

4. Discussion

4.1. Diurnal Variation Influencing the Perceived Soundscape and Lightscape

LAeq,5min and UI values reflected the condition of sound and light environment in urban forests (see Figure 3). This showed two different tendencies between LAeq,5min and UI, including a similar trend and an opposite trend before and after 18:00, respectively. There was reduction in biological activities, but rise in UI after 18:00, because of decreased illuminance leading to the continuous decrease of illumination variation. Birdsong and the sounds of human activity, especially traffic noise, formed the peak of LAeq,5min in the morning and at dusk, which suggests that daily biological activities are significant drivers for soundscapes in urban forests [15,57]. Variations of illumination impacted the comparison of light and shadow, which when relates to the UI, which reached a maximum in the afternoon and a minimum in the morning and dusk [58]. Thus, UI reached extreme values at these periods. Vegetarian and plant structures are potential drivers that may affect lightscape in urban forests, contributing to shadows checkering with sunlight and shade throughout the day [59,60].
In terms of perceived soundscape and lightscape in urban forests (see Figure 4), there was contraction and complementation between the distributions of perception with eyes opened and closed. Figure 4a shows two distribution trends that individuals experienced of the perceived loudness of a soundscape with eyes closed: one was clustered from slightly loud (+4) to strongly loud (+5) between 6:00 to 8:00 and 18:00 to 20:00, and the other was clustered in neither loud nor quiet (+3) from 9:00 to 17:00. As shown in Figure 4b, there was a similar distribution trend that clustered in slightly loud (+4) between 18:00 to 20:00, when individuals experienced the perceived loudness of the soundscape with eyes opened. The distributions of perception between 6:00 to 8:00 and 9:00 to 17:00 were clustered by neither loud nor quiet (+3) to slightly loud (+4), and slightly quiet (+2) to neither loud nor quiet (+3), respectively. These distributions were all around one point lower than the previous values with eye closed, which suggests a decrease in perceived soundscape sensitivity when individuals open their eyes. This was due to the allocation of cognitive resources to visual and auditory senses, which depended on endured disposition and momentary intentions in cognitive allocation policy [27,28]. From the perceived brightness of the lightscape with eyes opened in Figure 4c, there were three trends: clustered in strongly bright (+5) from 9:00 to 15:00; clustered from neither bright nor dark (+3) to slightly bright (+4) between 6:00 to 8:00 and 16:00 to 17:00; and clustered from slightly dark (+2) to neither bright nor dark (+3) from 18:00 to 20:00. When Figure 3 and Figure 4 are combined, the findings suggest that perceived lightscape and the gap between the perceived soundscape when eyes were opened and closed conducted similar performances at similar periods, which may be related to the variations of LAeq,5min and UI. Perceived soundscape and lightscape may tend to be an endured disposition in the cognition of a common landscape in urban forests [29,30]. However, diurnal variation trends of soundscape and lightscape may not accurately reflect how perceived soundscape sensitivity was impacted by perceived lightscape.

4.2. Relationship between the Sensitivity of Perceived Soundscape and Lightscape

Subjective and objective variations could indicate the cognitive sensitivity of vision and hearing [61,62]. In both Table 1 and Figure 6, all psychological variations were significantly correlated with all physical variations in soundscape and lightscape, respectively. In particular, ΔLAeq,5min, ΔLO, and Δsl all showed an ascendant performance when related to other parameters, which suggests that soundscape variation played a role in audio–visual perception, and that the perceived lightscape may be impacted by both soundscape and lightscape [29,63]. Figure 6a shows that there were two different positive trends of perceived soundscape variations when eyes were opened and closed. There was a gap between these variations when eyes were opened and closed, which supports our results that diurnal variation trends were influenced by the allocation of cognitive resources. However, this gap demonstrates two opposite tendencies, bounded by 1.24 dBA, which suggests that there were two different competitive conditions for cognitive resources. The first competitive condition was when ΔLAeq,5min was less than 1.24 dBA; participants contributed little response to the soundscape when eyes were opened. At this point, soundscape may only be an enhancer for visual perception, which has the optimal position in the allocation of cognitive resources [64,65]. The second competitive condition was when ΔLAeq,5min was more than 1.24 dBA; participants experienced an increased response to the soundscape when eyes were opened. In this circumstance, the perceived soundscape when eyes were opened may have contributed towards a balance with perceived lightscape in the allocation of cognitive resources [66,67]. Additionally, Figure 6b showed that the variations of perceived lightscape was limited under the influence of UI variations. There was a phenomenon where the perceived lightscape variations tended to maintain at 1.0 when UI variations were more than 10%, which suggests that a sequential and weak variation of lightscape only motivated the limited allocation of cognitive resources. Thus, perceived soundscape sensitivity may be impacted by the allocation of cognitive resources of lightscape and soundscape.
From the results of HCA in Figure 5 and Figure 6, the observation sites of cluster C were mainly distributed in dense forests, contributing a low ΔLAeq,5min, Δss,c, and Δss,o, due to the quietness of these environments. The observation sites of cluster B were mainly distributed near traffic roads, contributing a high ΔLAeq,5min, Δss,c, and Δss,o due to the noise of these environments. Also, there was a stable positive relationship between ΔUI and Δsl, and a 1.24 dBA threshold of Δss,c − Δss,o near the boundary between cluster A and C, which suggests that visual sensitivity influenced auditory sensitivity differently during sound level increases in urban forests. Additionally, the leaves of trees, which absorb noise, contributed a lower LAeq,5min and ΔLAeq,5min in urban forests [16].
Based on the above results, we suggest that the cognitive resources of perceived lightscape are mutative from the gap variation between perceived soundscape sensitivity when the eyes are open and closed. When Figure 6 (left) and (right) were combined, the findings indicated that the LAeq,5min variations may contribute to two different relationships between Δss,c − Δss,o and Δsl, when bounded by 1.24 dBA (see Figure 7). The first condition, where LAeq,5min variations were less than 1.24 dBA, was mostly in the afternoon, with the sustained lightscape being heightened during this period [68]. As supported by Equation (1), participants that experienced the lightscape in this condition showed weak sensitivity to soundscape perception. Equation (2) suggests that a perceived lightscape may enhance the perceived soundscape when eyes are open in the first condition, because perceived lightscape sensitivity may occupy the main cognitive resources, while the perceived soundscape may be a subsidiary cognition for the perceived lightscape, like a sense of background sound for visual perception [69]. The second condition, where LAeq,5min variations were more than 1.24 dBA, was mostly in the morning and dusk, with active biophonies (e.g., birdsongs) present [16,70]. As supported by Equation (3), participants that experienced the soundscape in this condition produced a strong sensitivity of soundscape perception. Equation (4) indicated that a perceived lightscape may weaken a perceived soundscape when eyes are open in the second condition, because there is a competition between the sensitivity to soundscapes and lightscapes in the allocation of limited cognitive resources, which may be influenced by a cognitive allocation policy in the outside environment [30,32].
In general, perceived soundscapes and lightscapes may be contributed by endured disposition in cognition, in order to distract from focused sensory attention, which then contributes to different perceived soundscape and lightscape sensitivity in urban forests. Furthermore, through the comparison of when eyes were open or closed, the equation results suggested that different LAeq,5min conditions produce two relationships between perceived soundscape and lightscape sensitivity in urban forests. These facilitate the understanding of human perception to soundscape and lightscape for landscape architects and urban forests when proposing suitable design plans. For instance, we may appropriately increase plant density and shade area of trees near a path where the perceived soundscape, like a natural soundscape, is comfortable or pleasant, in order to decrease the visual competitiveness of cognitive resources in urban forests. Again, we may also befittingly decrease the shade near a path if the space is relatively tranquil or noisy, in order to promote increased visual competitiveness of cognitive resources in urban forests.
Some limitations may be present in this research. Although we tried to eliminate visual stimuli by closing the eyes, different levels of brightness can still be slightly perceived with eyes closed. Also, we instructed participants to close their eyes for 20s to avoid the visual impact of short-term memory before the test began, but the visual stimuli could still interfere with their judgment when participants filled out their questionnaires. Further, the differences of temperature, humidity, and participants’ orientation may affect somatesthesia in different observation sites.

5. Conclusions

Soundscape and lightscape jointly function towards individuals’ perception in urban forests. This study reveals that perceived soundscape sensitivity is influenced by that of lightscape in urban forests. In terms of soundscape and lightscape drivers, our findings show that (1) the perceived soundscape and lightscape tend to be endured dispositions in the cognition of the common landscape in urban forests; (2) there is a gap in sensitivity between soundscape and lightscape, which conducts two opposite competitive conditions of cognitive resources, bounded by 1.24 dBA; (3) sequential and weak variations of lightscape only motivate the limited allocation of cognitive resources. For instance, we can adjust the plant allocation in urban forests to change the vertical structure of vegetation and openness, contributing to an optimal sensory environment. Furthermore, other potential drivers like somatesthesia may be considered in future studies, in order to further explore soundscape patterns in the competition for cognitive resources.

Supplementary Materials

The following are available online at https://www.mdpi.com/1999-4907/11/12/1242/s1, Figure S1: Soundscape and Lightscape Questionnaire.

Author Contributions

Conceptualization, X.-C.H.; methodology, X.-C.H.; software, E.D.; formal analysis, X.-C.H.; investigation, X.-C.H. and G.-Y.W.; data curation, X.-C.H.; writing—original draft preparation, X.-C.H. and J.L.; writing—review and editing, E.D.; supervision, G.-Y.W. All authors have read and agreed to the published version of the manuscript.

Funding

This project was supported by the National Key Research and Development Program of China (2018YFC0704703 and 2018YFC0704705); the Social Science Foundation of Fujian, China (grant number FJ2018B087); and the Start-Up Foundation of Fuzhou University (T20053).

Acknowledgments

The authors appreciate the valuable comments of editors and anonymous reviewers.

Conflicts of Interest

The authors declare no conflict of interest.

References

  1. Mcpherson, E.G.; Xiao, Q.; Aguaron, E. A new approach to quantify and map carbon stored, sequestered and emissions avoided by urban forests. Landsc. Urban Plan. 2013, 120, 70–84. [Google Scholar] [CrossRef] [Green Version]
  2. Nowak, D.J.; Hirabayashi, S.; Doyle, M. Air pollution removal by urban forests in Canada and its effect on air quality and human health. Urban For. Urban Green. 2018, 29, 40–48. [Google Scholar] [CrossRef]
  3. Roovers, P.; Hermy, M.; Gulinck, H. Vistor profile, perception and expectation in forests from a gradient of increasing urbanisation. Curr. Opin. Struct. Biol. 2002, 18, 682–689. [Google Scholar]
  4. Bell, S. Landscape pattern, perception and visualisation in the visual management of forests. Landsc. Urban Plan. 2001, 54, 201–211. [Google Scholar] [CrossRef]
  5. Lee, J.Y.; Lee, D.C. Cardiac and pulmonary benefits of forest walking versus city walking in elderly women: A randomised, controlled, open-label trial. Eur. J. Integr. Med. 2014, 6, 5–11. [Google Scholar] [CrossRef]
  6. Morita, E.; Fukuda, S.; Nagano, J. Psychological effects of forest environments on healthy adults: Shinrin-yoku (forest-air bathing, walking) as a possible method of stress reduction. Public Health 2007, 121, 54. [Google Scholar] [CrossRef] [PubMed] [Green Version]
  7. Sung, J.; Woo, J.M.; Kim, W. The Effect of Cognitive Behavior Therapy-Based “Forest Therapy” Program on Blood Pressure, Salivary Cortisol Level, and Quality of Life in Elderly Hypertensive Patients. Clin. Exp. Hypertens. 2012, 34, 1. [Google Scholar] [CrossRef]
  8. Muzet, A. Environmental noise, sleep and health. Sleep Med. Rev. 2007, 11, 135–142. [Google Scholar] [CrossRef]
  9. Zacarías, F.F.; Molina, R.H.; Ancela, J.L.C.; López, S.L.; Ojembarrena, A.A. Noise exposure in preterm infants treated with respiratory support using neonatal helmets. Acta Acust. United Acust. 2013, 99, 590–597. [Google Scholar] [CrossRef]
  10. Minichilli, F.; Gorini, A.E.; Bianchi, F.; Coi, A.; Fredianelli, A.; Licitra, G.; Manzoli1, F.; Mezzasalma, L.; Cori, L. Annoyance judgment and measurements of environmental noise: A focus on Italian secondary schools. Int. J. Environ. Res. Public Health 2018, 15, 208. [Google Scholar] [CrossRef] [Green Version]
  11. Dratva, J.; Phuleria, H.C.; Foraster, M.; Gaspoz, J.M.; Keidel, D.; Kunzli, N. Transportation noise and blood pressure in a population—Based sample of adults. Environ. Health Perspect. 2012, 120, 50–55. [Google Scholar] [CrossRef]
  12. Licitra, G.; Fredianelli, L.; Petri, D.; Vigotti, M.A. Annoyance evaluation due to overall railway noise and vibration in Pisa urban areas. Sci. Total Environ. 2016, 568, 1315–1325. [Google Scholar] [CrossRef] [PubMed]
  13. Aletta, F.; Oberman, T.; Kang, J. Positive health-related effects of perceiving urban soundscapes: A systematic review. Lancet 2018, 392, 32044. [Google Scholar] [CrossRef]
  14. Coensel, B.D.; Boes, M.; Oldoni, D. Characterizing the soundscape of tranquil urban spaces. J. Acoust. Soc. Am. 2013, 133, 3371. [Google Scholar] [CrossRef]
  15. Hong, X.C.; Liu, J.; Wang, G.Y. Factors influencing the harmonious degree of soundscapes in urban forests: A comparison of broad-leaved and coniferous forests. Urban For. Urban Green. 2019, 39, 18–25. [Google Scholar] [CrossRef]
  16. Hong, X.C.; Zhu, Z.P.; Liu, J. Perceived occurrences of soundscape influencing pleasantness in urban forests: A comparison of broad-leaved and coniferous forests. Sustainability 2019, 11, 4789. [Google Scholar] [CrossRef] [Green Version]
  17. Liu, J.; Kang, J.; Behm, H.; Luo, T. Effects of landscape on soundscape perception: Soundwalks in city parks. Landsc. Urban Plan. 2014, 123, 30–40. [Google Scholar] [CrossRef] [Green Version]
  18. Tomita, Y. Urban lightscape: The role of light in urban environment. Spec. Issue Jpn. Soc. Sci. Des. 2000, 8, 58–61. [Google Scholar]
  19. Wong, T.S. The horizontal-vertical illusion in haptic and visual space. J. Exp. Psychol. 1977, 81, 376–380. [Google Scholar]
  20. Jeon, J.Y.; Jo, H.I. Effects of audio-visual interactions on soundscape and landscape perception and their influence on satisfaction with the urban environment. Build. Environ. 2020, 169, 106544. [Google Scholar] [CrossRef]
  21. Hong, J.Y.; Jeon, J.Y. Designing sound and visual components for enhancement of urban soundscapes. J. Acoust. Soc. Am. 2013, 134, 2026. [Google Scholar] [CrossRef] [PubMed]
  22. Kang, S.; Echevarria, S.G.M.; Bert, D.C. Personal audiovisual aptitude influences the interaction between landscape and soundscape appraisal. Front. Psychol. 2018, 9, 780. [Google Scholar]
  23. Li, H.; Lau, S.K. A review of audio-visual interaction on soundscape assessment in urban built environments. Appl. Acoust. 2020, 166, 107372. [Google Scholar] [CrossRef]
  24. Cassina, L.; Fredianelli, L.; Menichini, I.; Chiari, C.; Licitra, G. Audio-visual preferences and tranquillity ratings in urban areas. Environments 2018, 5, 1. [Google Scholar] [CrossRef] [Green Version]
  25. Filipan, K.; De Coensel, B.; Aurnond, P. Auditory sensory saliency as a better predictor of change than sound amplitude in pleasantness assessment of reproduced urban soundscapes. Build. Environ. 2019, 148, 730–741. [Google Scholar] [CrossRef] [Green Version]
  26. Steffens, J.; Steele, D.; Guastavino, C. Situational and person-related factors influencing momentary and retrospective soundscape evaluations in day-to-day life. J. Acoust. Soc. Am. 2017, 141, 1414–1425. [Google Scholar] [CrossRef]
  27. Treisman, A. Monitoring and storage of irrelevant messages in selective attention. J. Verbal Learn. Verbal Behav. 1964, 3, 449–459. [Google Scholar] [CrossRef]
  28. Johnston, W.A.; Heinz, S.P. Flexibility and capacity demands of attention. J. Exp. Psychol. Gen. 1978, 107, 420–435. [Google Scholar] [CrossRef]
  29. Hong, X.C.; Wang, G.Y.; Liu, J.; Lan, S.R. Cognitive persistence of soundscape in urban parks. Sustain. Cities Soc. 2019, 51, 17–26. [Google Scholar] [CrossRef]
  30. Labruna, L.; Miguel, F.; Landau, A. Modulation of the motor system during visual and auditory language processing. Exp. Brain Res. 2011, 211, 243–250. [Google Scholar] [CrossRef]
  31. Tomasi, D.; Caparelli, E.C.; Chang, L. Fmri-acoustic noise alters brain activation during working memory tasks. Neuroimage 2005, 27, 377–386. [Google Scholar] [CrossRef] [PubMed] [Green Version]
  32. Watanabe, S.; Masuda, S. Integration of auditory and visual information in human face discrimination in pigeons. behavioral and anatomical study. Behav. Brain Res. 2010, 207, 61–69. [Google Scholar] [CrossRef]
  33. Aron, E.N.; Aron, A. Sensory-processing sensitivity and its relation to introversion and emotionality. J. Person. Soc. Psychol. 1997, 73, 345–368. [Google Scholar] [CrossRef]
  34. Stigsdotter, U.K.; Corazon, S.S.; Sidenius, U. Forest design for mental health promotion—using perceived sensory dimensions to elicit restorative responses. Landsc. Urban Plan. 2017, 160, 1–15. [Google Scholar] [CrossRef]
  35. Talcott, J.B.; Witton, C.; Mclean, M.F. Dynamic sensory sensitivity and children’s word decoding skills. Proc. Natl. Acad. Sci. USA 2000, 97, 2952–2957. [Google Scholar] [CrossRef] [PubMed] [Green Version]
  36. Aron, E.N.; Aron, A.; Jagiellowicz, J. Sensory Processing Sensitivity: A Review in the Light of the Evolution of Biological Responsivity. Person. Soc. Psychol. Rev. 2012, 16, 262–282. [Google Scholar] [CrossRef] [PubMed] [Green Version]
  37. Noesselt, T.; Tyll, S.; Boehler, C.N.; Budinger, E.; Heinze, H.J.; Driver, J. Sound-induced enhancement of low-intensity vision: Multisensory influences on human sensory-specific cortices and thalamic bodies relate to perceptual enhancement of visual detection sensitivity. J. Neurosci. 2010, 30, 13609–13623. [Google Scholar] [CrossRef]
  38. Shim, K. The auditory sensory epithelium: The instrument of sound perception. Int. J. Biochem. Cell Biol. 2006, 38, 1827–1833. [Google Scholar] [CrossRef]
  39. Veale, J.L.; Mark, R.F.; Rees, S. Differential sensitivity of motor and sensory fibres in human ulnar nerve. J. Neurol. 1973, 36, 75–86. [Google Scholar] [CrossRef] [Green Version]
  40. Calleja, A.; Díaz-Balteiro, L.; Iglesias-Merchan, C. Acoustic and economic valuation of soundscape: An application to the ‘retiro’ urban forest park. Urban For. Urban Green. 2017, 27, 272–278. [Google Scholar] [CrossRef]
  41. Yamada, Y.; Nilsson, K. Soundscape-based Forest Planning for Recreational and Therapeutic Activities. Urban For. Urban Green. 2006, 5, 131–139. [Google Scholar] [CrossRef]
  42. Hussain, L.; Aziz, W.; Alowibdi, J.S. Symbolic time series analysis of electroencephalographic (eeg) epileptic seizure and brain dynamics with eye-open and eye-closed subjects during resting states. J. Physiol. Anthropol. 2017, 36, 21. [Google Scholar] [CrossRef] [PubMed] [Green Version]
  43. Perfect, T.J.; Andrade, J.; Eagan, I. Eye closure reduces the cross-modal memory impairment caused by auditory distraction. J. Exp. Psychol. Learn. Mem. Cognit. 2011, 37, 1008–1013. [Google Scholar] [CrossRef]
  44. Robert, J.; Hall, R.A.; Monty, W. The effect of moving and static trans-scleral illumination of visual afterimages. Atten. Percept. Psychophys. 1970, 7, 367–368. [Google Scholar]
  45. Bennie, J.; Davies, T.W.; Inger, R.; Gaston, K.J. Mapping artificial lightscapes for ecological studies. Methods Ecol. Evolut. 2014, 5, 534–540. [Google Scholar] [CrossRef]
  46. Dekay, M. Daylighting and urban form: An urban fabric of light. J. Archit. Plan. Res. 2010, 27, 35–56. [Google Scholar]
  47. Hong, J.Y.; Lam, B.; Ong, Z.-T. Quality assessment of acoustic environment reproduction methods for cinematic virtual reality in soundscape applications. Build. Environ. 2019, 149, 1–14. [Google Scholar] [CrossRef]
  48. International Organization for Standardization. ISO 12913-1:2014 Acoustics—Soundscape Part 1: Definition and Conceptual Framework; Standard ISO 12913-1:2014; International Organization for Standardization: Geneva, Switzerland, 2014. [Google Scholar]
  49. International Organization for Standardization. ISO/TS 12913-2:2018 Acoustics—Soundscape Part 2: Data Collection and Reporting Requirements; Standard ISO/TS 12913-2:2018; International Organization for Standardization: Geneva, Switzerland, 2018. [Google Scholar]
  50. Kim, I.T.; Jang, I.H.; Choi, A.S. Brightness perception of white led lights with different correlated colour temperatures. Indoor Built Environ. 2014, 24, 500–513. [Google Scholar] [CrossRef]
  51. Yager, D.; Taylor, E. Experimental measures and theoretical account of hue scaling as a function of luminance. Percept. Psychophys. 1970, 7, 360–364. [Google Scholar] [CrossRef]
  52. Kang, J. From dBA to soundscape indices: Managing our sound environment. Front. Eng. Manag. 2017, 4, 184–192. [Google Scholar] [CrossRef] [Green Version]
  53. Wang, D.; Ying, L.; Wang, W.; Pei, C.; Wang, J. Indoor substation low-noise design and sound absorbing structure improvement considering power transformer acoustic radiation characteristics. Build. Environ. 2018, 149, 390–403. [Google Scholar] [CrossRef]
  54. Yang, J.; Yu, Y.; You, L. Segmentation by Visitor Motivation in Fuzhou National Forest Park: A Factor-Cluster Approach. Sci. Silvae Sin. 2015, 51, 106–116. [Google Scholar]
  55. Liu, J.; Kang, J. Soundscape design in city parks: Exploring the relationships between soundscape composition parameters and physical and psychoacoustic parameters. J. Environ. Eng. Landsc. Manag. 2015, 23, 102–112. [Google Scholar] [CrossRef] [Green Version]
  56. Gygi, B.; Kidd, G.R.; Watson, C.S. Similarity and categorization of environmental sounds. Percept. Psychophys. 2018, 69, 839–855. [Google Scholar] [CrossRef] [PubMed] [Green Version]
  57. Wu, B.M.; Chan, F.H.Y.; Lam, F.K. A novel system for simultaneous monitoring of locomotor and sound activities in animals. J. Neurosci. Methods 2000, 101, 69–73. [Google Scholar] [CrossRef]
  58. Cattell, C.; Dombeck, J.; Carlson, C. Fast observations of the solar illumination dependence of downgoing auroral electron beams: Relationship to electron energy flux. J. Geophys. Res. Space Phys. 2006, 111, A02201. [Google Scholar] [CrossRef] [Green Version]
  59. Friml, J.; Sauer, M. In their neighbour’s shadow. Nature 2008, 453, 298–299. [Google Scholar] [CrossRef]
  60. Hong, M.S.; Simpson, B.; Baranoski, G.V.G. Interactive venation-based leaf shape modeling: Natural phenomena and special effects. Comput. Anim. Virtual World 2010, 16, 415–427. [Google Scholar] [CrossRef] [Green Version]
  61. Benedek, G.; Benedek, K.; Kéri, S. Human scotopic spatiotemporal sensitivity: A comparison of psychophysical and electrophysiological data. Doc. Ophthalmol. 2003, 106, 201–207. [Google Scholar] [CrossRef]
  62. Uka, T.; Deangelis, G.C. Contribution of middle temporal area to coarse depth discrimination: Comparison of neuronal and psychophysical sensitivity. J. Neurosci. 2003, 23, 3515–3530. [Google Scholar] [CrossRef] [Green Version]
  63. Hong, J.Y.; Jeon, J.Y. The effects of audio–visual factors on perceptions of environmental noise barrier performance. Landsc. Urban Plan. 2014, 125, 28–37. [Google Scholar] [CrossRef]
  64. Kranczioch, C.; Thorne, J.D. Simultaneous and preceding sounds enhance rapid visual targets: Evidence from the attentional blink. Advances Cognit. Psychol. 2013, 9, 130–142. [Google Scholar] [CrossRef]
  65. Tivadar, R.I.; Chrysa, R.; Nora, T. Sounds enhance visual completion processes. NeuroImage 2018, 179, 480–488. [Google Scholar] [CrossRef] [PubMed]
  66. Akita, T. Effects on consistency of sound and visual signal on easiness of directional cognition. In Proceedings of the Inter-Noise & Noise Congress & Conference, Dearborn, MI, USA, 19–21 August 2002; pp. 1291–1925. [Google Scholar]
  67. Jones, D.M.; Macken, W.J.; Murray, A.C. Disruption of visual short-term memory by changing-state auditory stimuli: The role of segmentation. Mem. Cognit. 1993, 21, 318–328. [Google Scholar] [CrossRef] [Green Version]
  68. Smolders, K.C.H.J.; Kort, Y.A.W.D.; Cluitmans, P.J.M. A higher illuminance induces alertness even during office hours: Findings on subjective measures, task performance and heart rate measures. Physiol. Behav. 2012, 107, 7–16. [Google Scholar] [CrossRef]
  69. Jordan, T.R.; Abedipour, L. The importance of laughing in your face influences of visual laughter on auditory laughter perception. Perception 2010, 39, 1283–1285. [Google Scholar] [CrossRef]
  70. Potamitis, I.; Ntalampiras, S.; Jahn, O. Automatic bird sound detection in long real-field recordings: Applications and tools. Appl. Acoust. 2014, 80, 1–9. [Google Scholar] [CrossRef]
Figure 1. Aerial photo of Pacific Spirit Park (PP), Stanley Park (SP), and Queen Elizabeth Park (QP).
Forests 11 01242 g001
Figure 2. The setting of measuring equipment and participants in each site.
Forests 11 01242 g002
Figure 3. Diurnal variation of 5-min, A-weighted, equivalent sound pressure level (LAeq,5min) and uniformity of illuminance (UI) in urban forests.
Forests 11 01242 g003
Figure 4. Distribution of the perceived loudness with eye (a) closure and (b) opening, and (c) the distribution of perceived brightness with eyes open from 6:00 to 20:00.
Forests 11 01242 g004
Figure 5. Hierarchical cluster analysis (HCA) of subjective and objective variations of soundscape and lightscape.
Forests 11 01242 g005
Figure 6. Fitting analysis of the subjective and objective variations of (a) soundscape and (b) lightscape.
Forests 11 01242 g006
Figure 7. The relationship between Δsl and the gap between Δss,c and Δss,o.
Forests 11 01242 g007
Table 1. Relationship between subjective and objective variations, where Pearson correlation coefficients are shown in each cell.
ΔLAeq,5minΔLOΔss,cΔss,oΔUIΔsl
ΔLAeq,5min1.0000.824 **0.870 **0.819 **0.502 *0.625 **
ΔLO0.824 **1.0000.756 **0.713 **0.365 *0.552 **
Δss,c0.870 **0.756 **1.0000.840 **0.2880.599 *
Δss,o0.819 **0.713 **0.840 **1.0000.2530.469 *
ΔUI0.502 *0.365 *0.2880.2531.0000.858 **
Δsl0.625 **0.552 **0.599 *0.469 *0.858 **1.000
* p < 0.05, ** p < 0.01.
Publisher’s Note: MDPI stays neutral with regard to jurisdictional claims in published maps and institutional affiliations.

