Tree-Ring Width and Carbon Isotope Chronologies Track Temperature, Humidity, and Baseflow in the Tianshan Mountains, Central Asia


Abstract
:1. Introduction
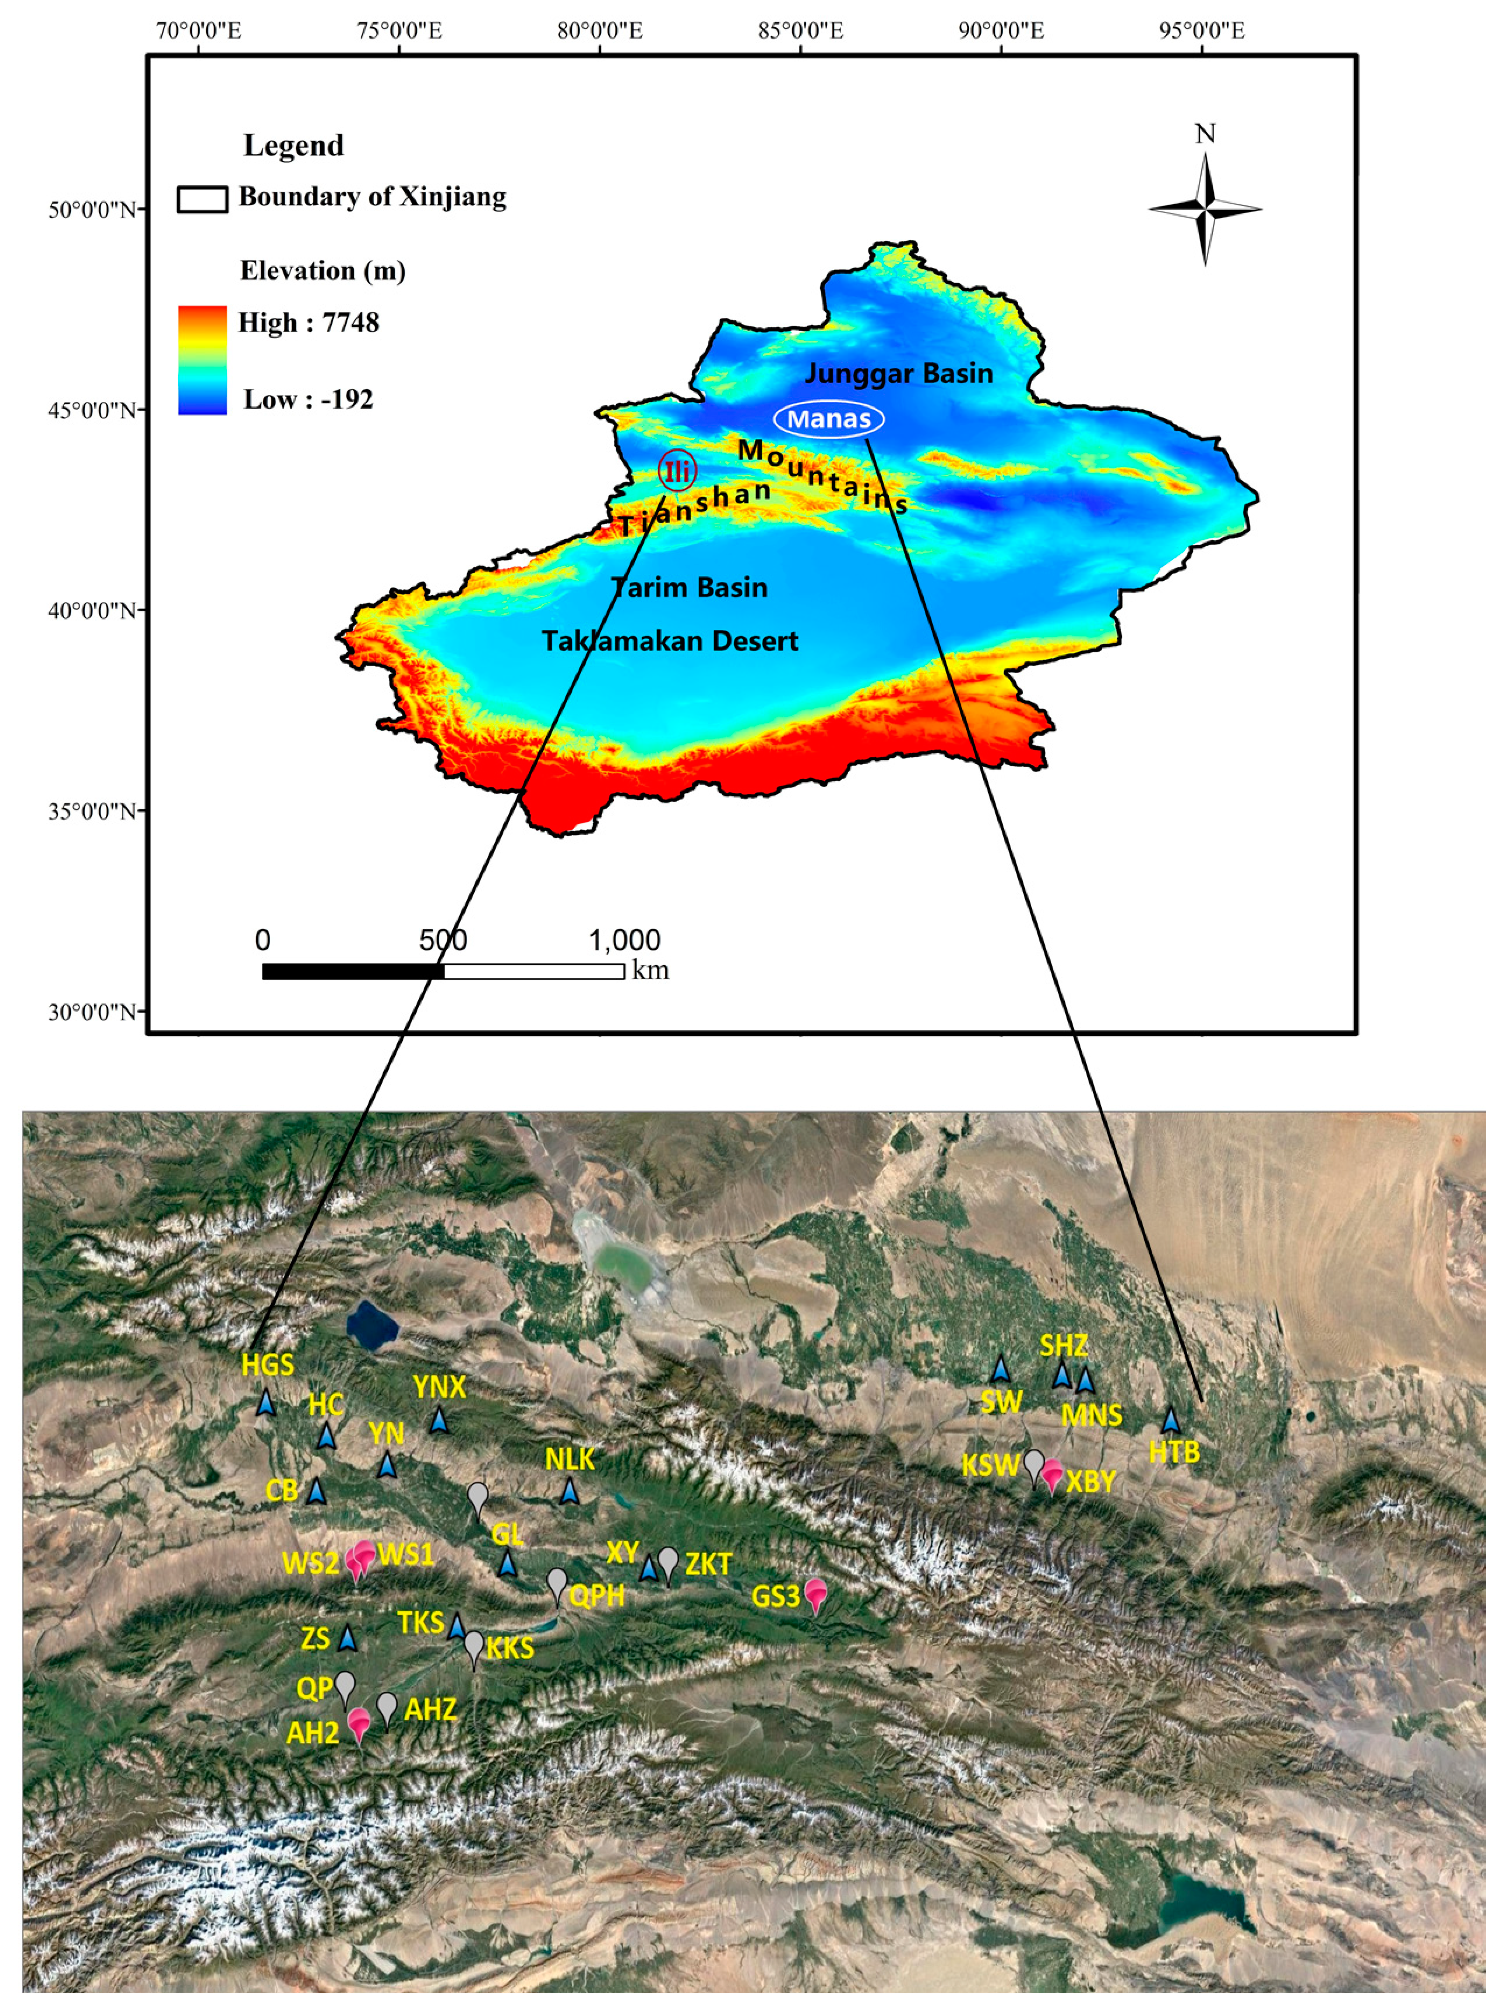
2. Study Area
3. Materials and Methods
3.1. Field Sampling
3.2. Dendrochronological Dataset and Chronology Building
3.3. Stable Carbon Isotope Analysis
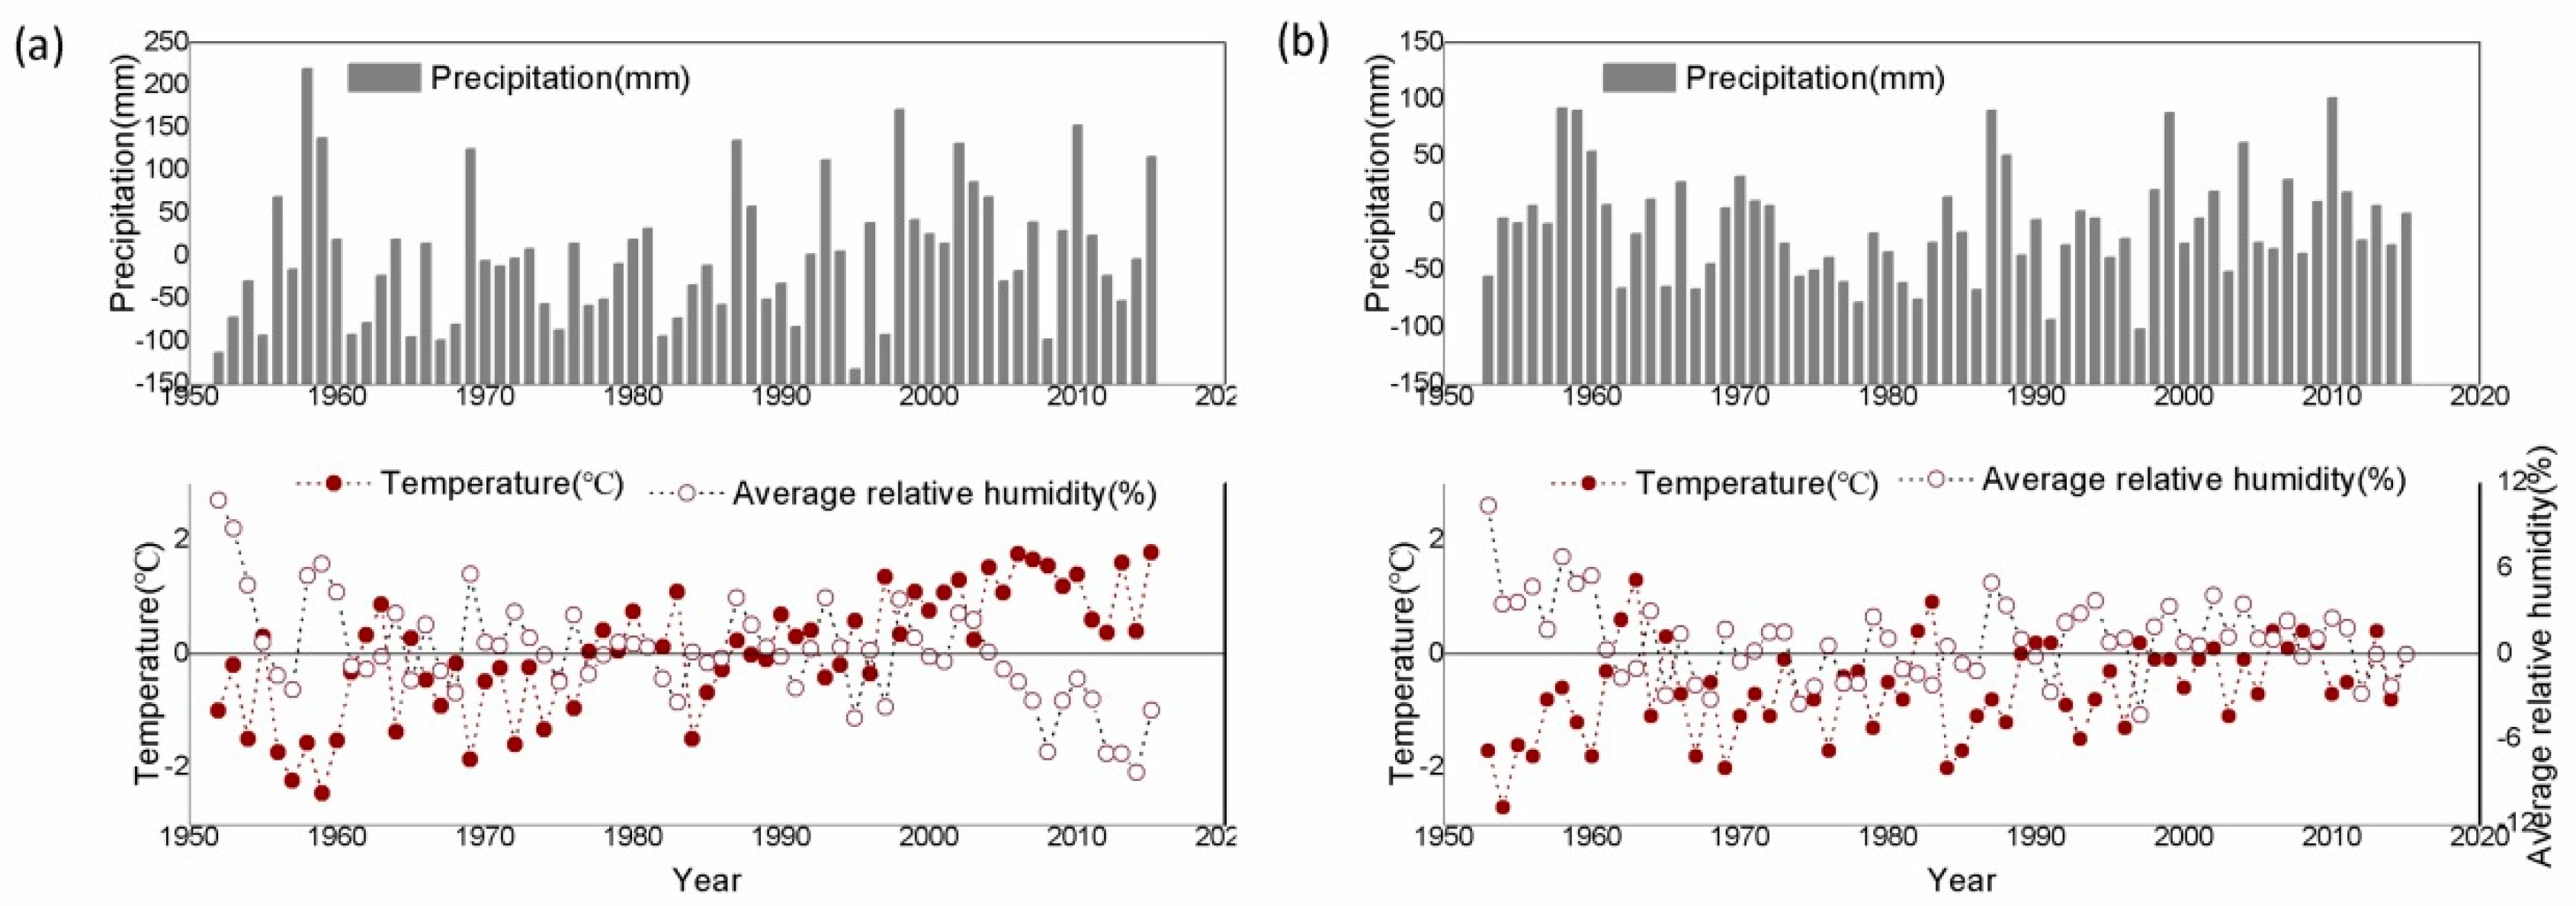
3.4. Meteorological and Hydrological Data
3.5. Statistic Analysis
4. Results
4.1. Tree Growth
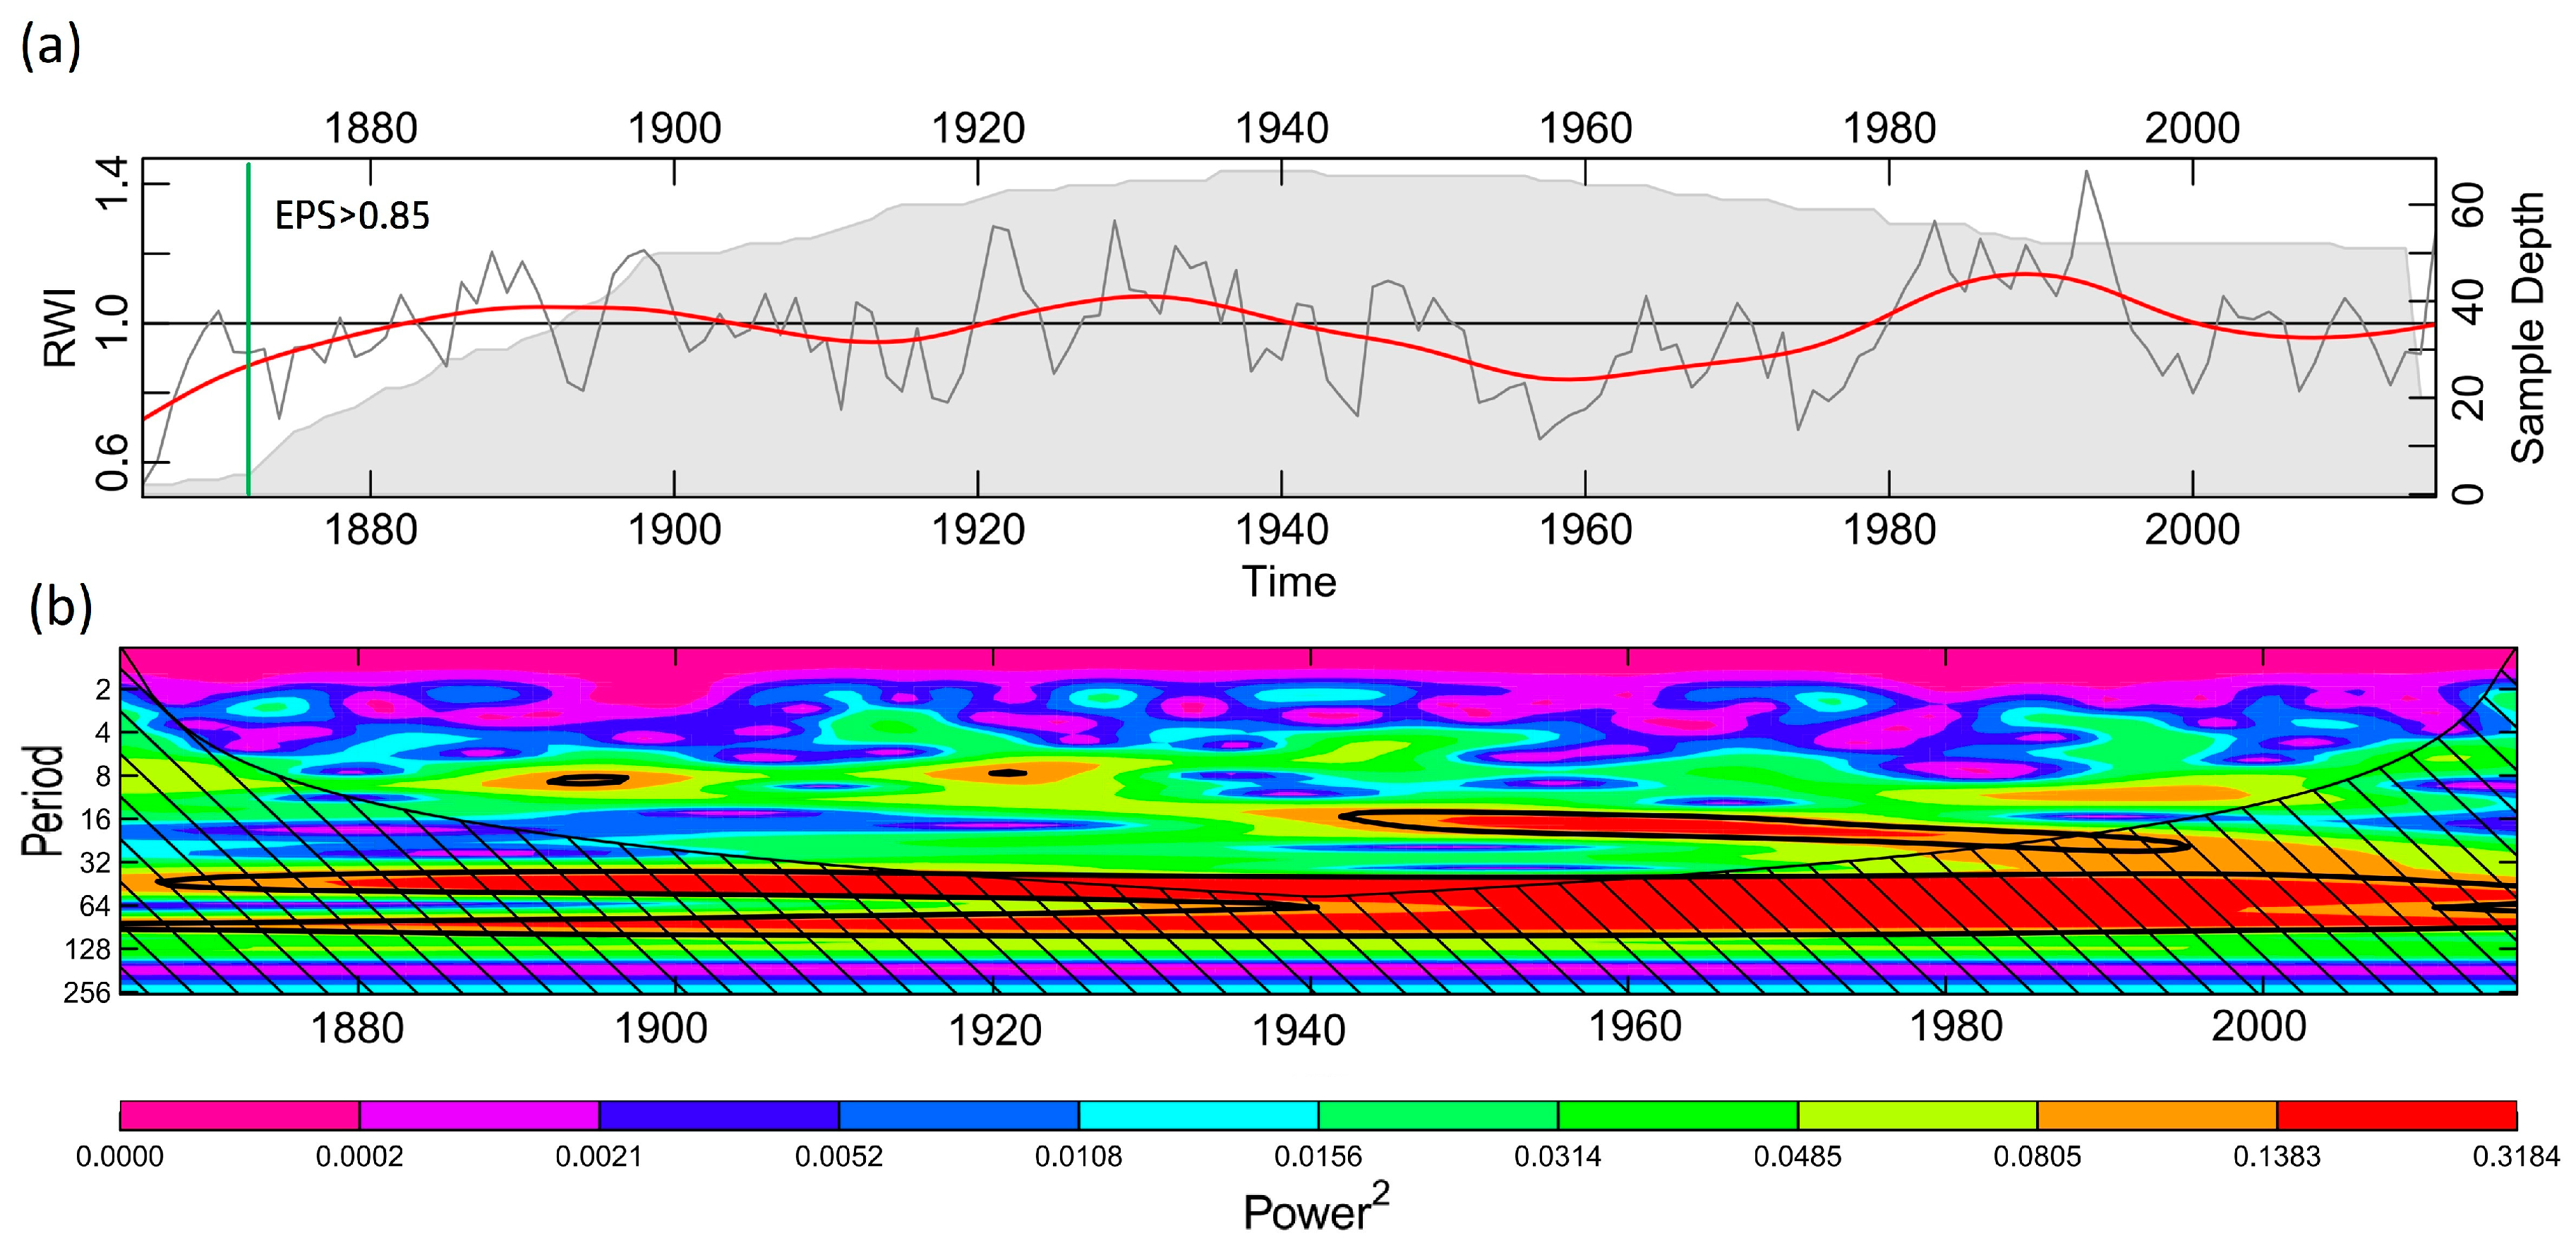
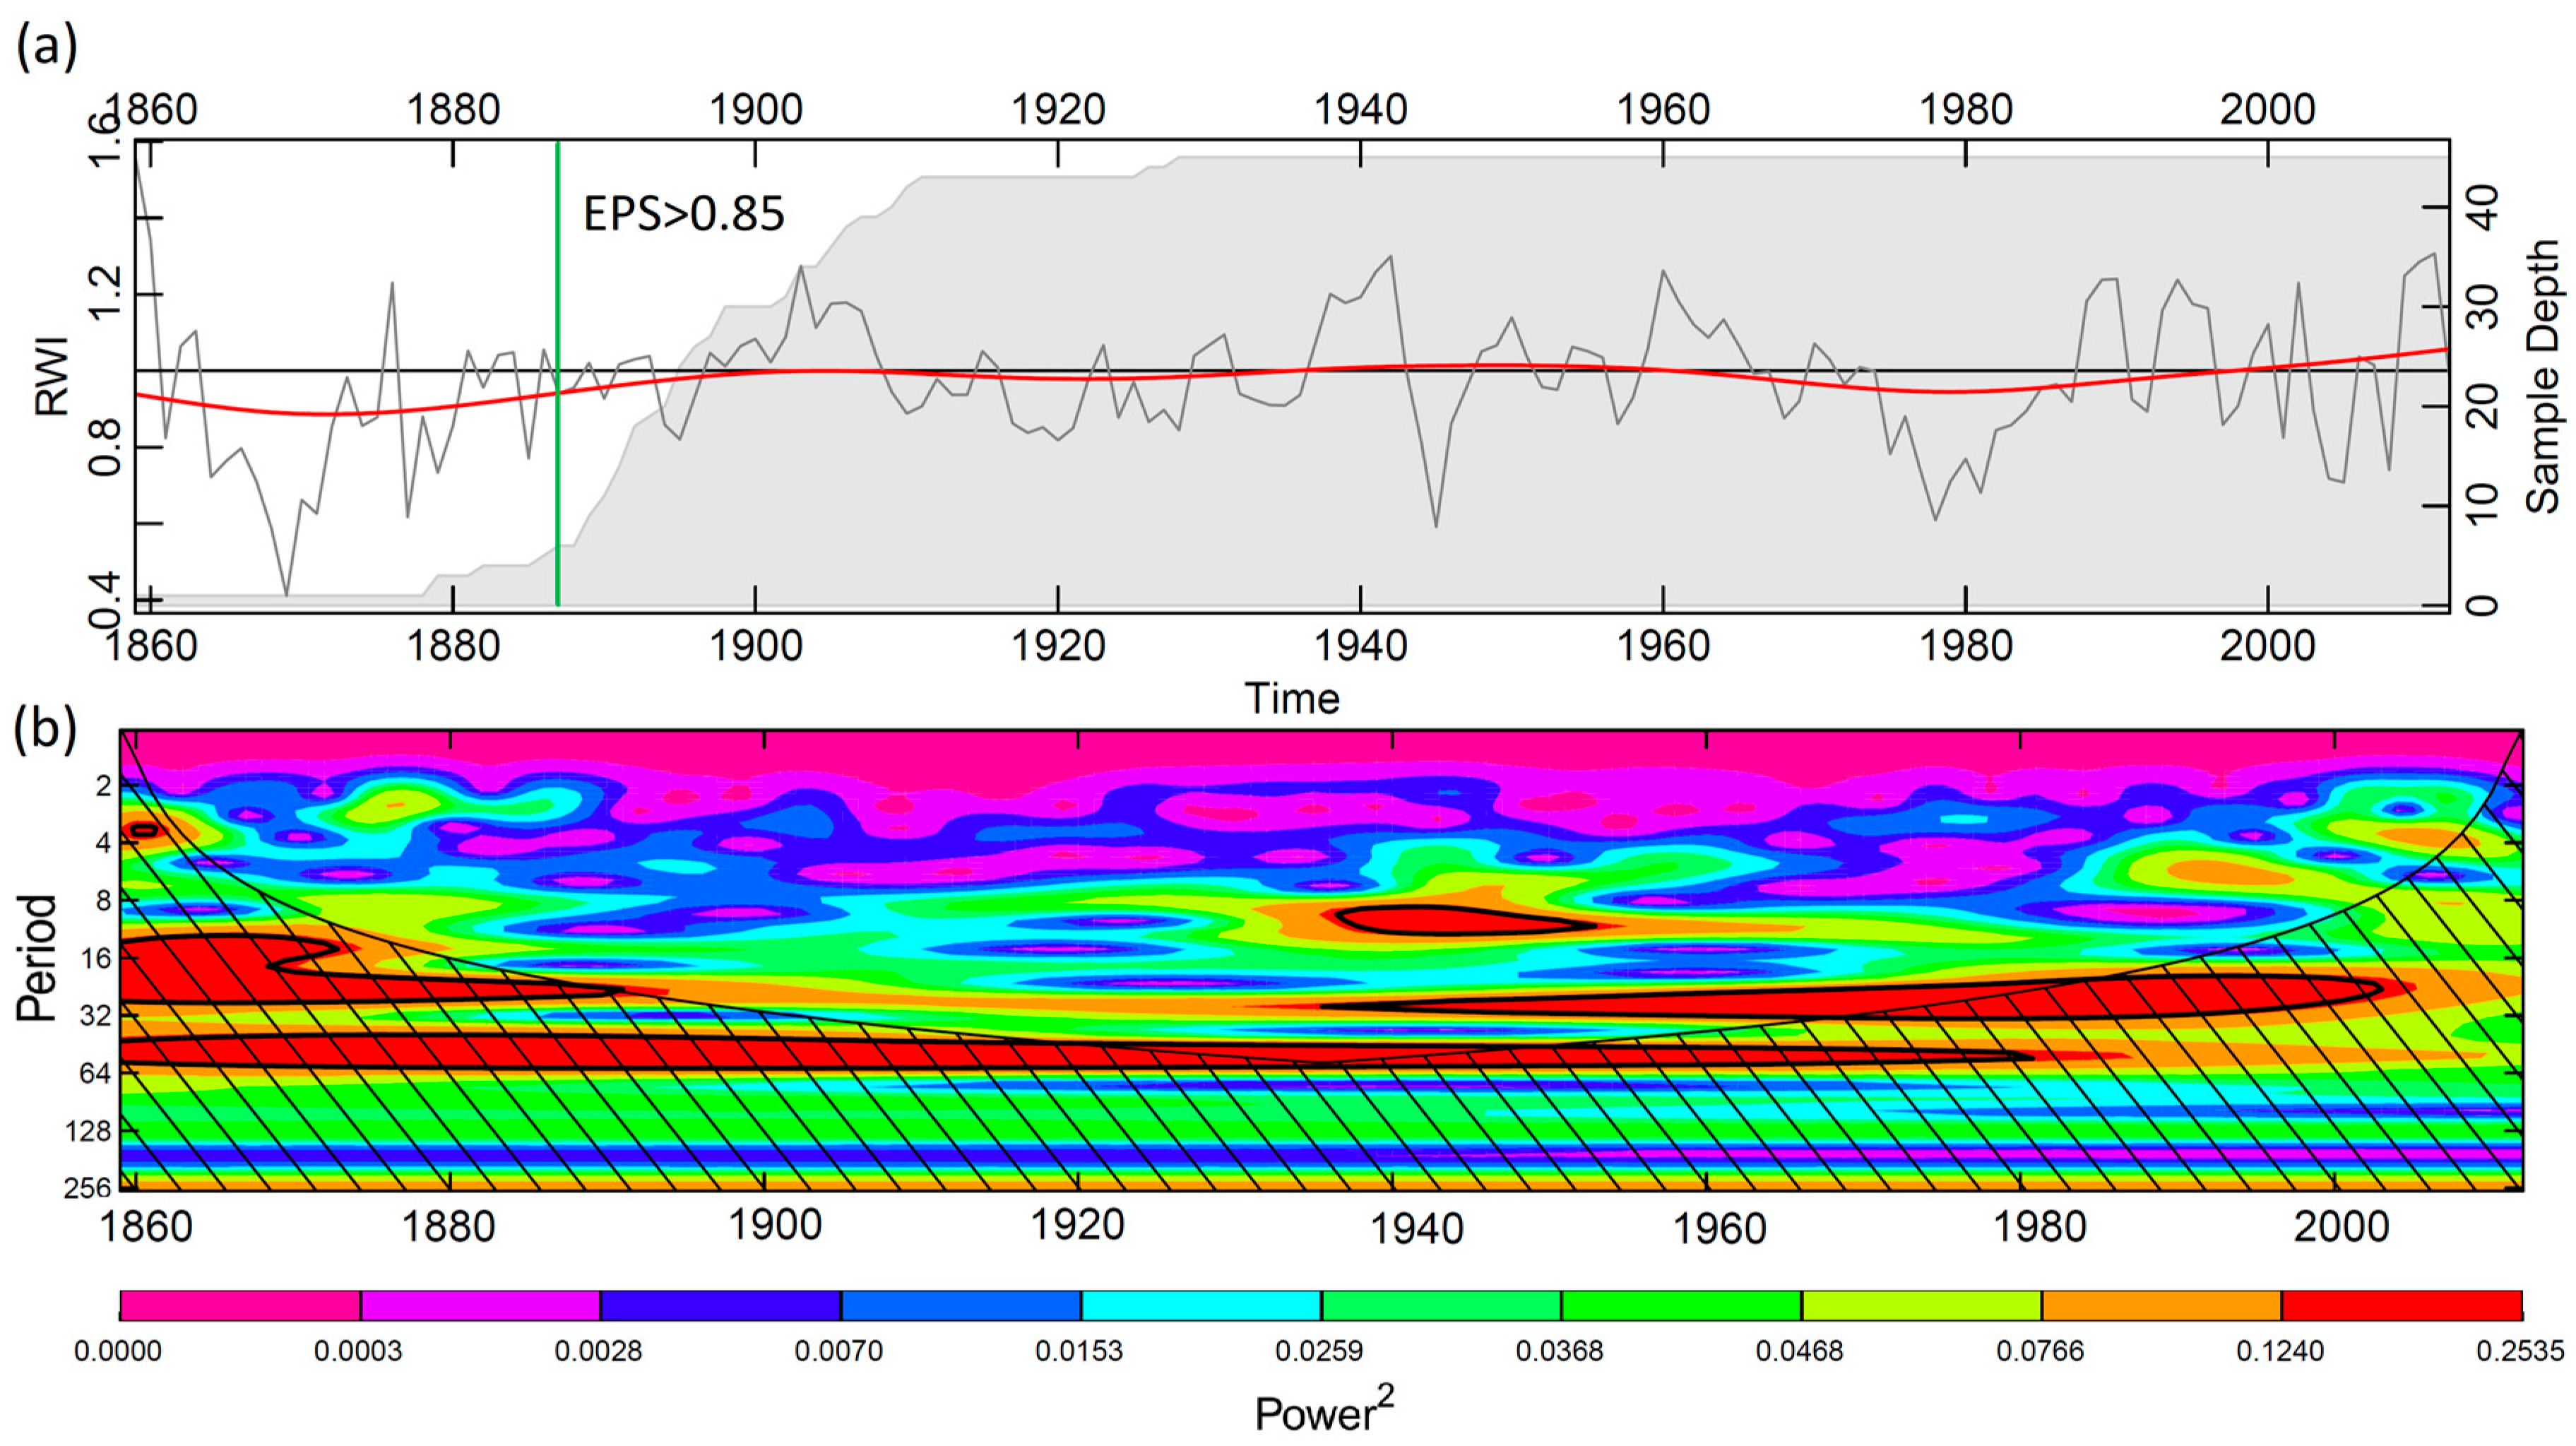
4.1.1. Statistical Characteristics of the TRW Chronologies
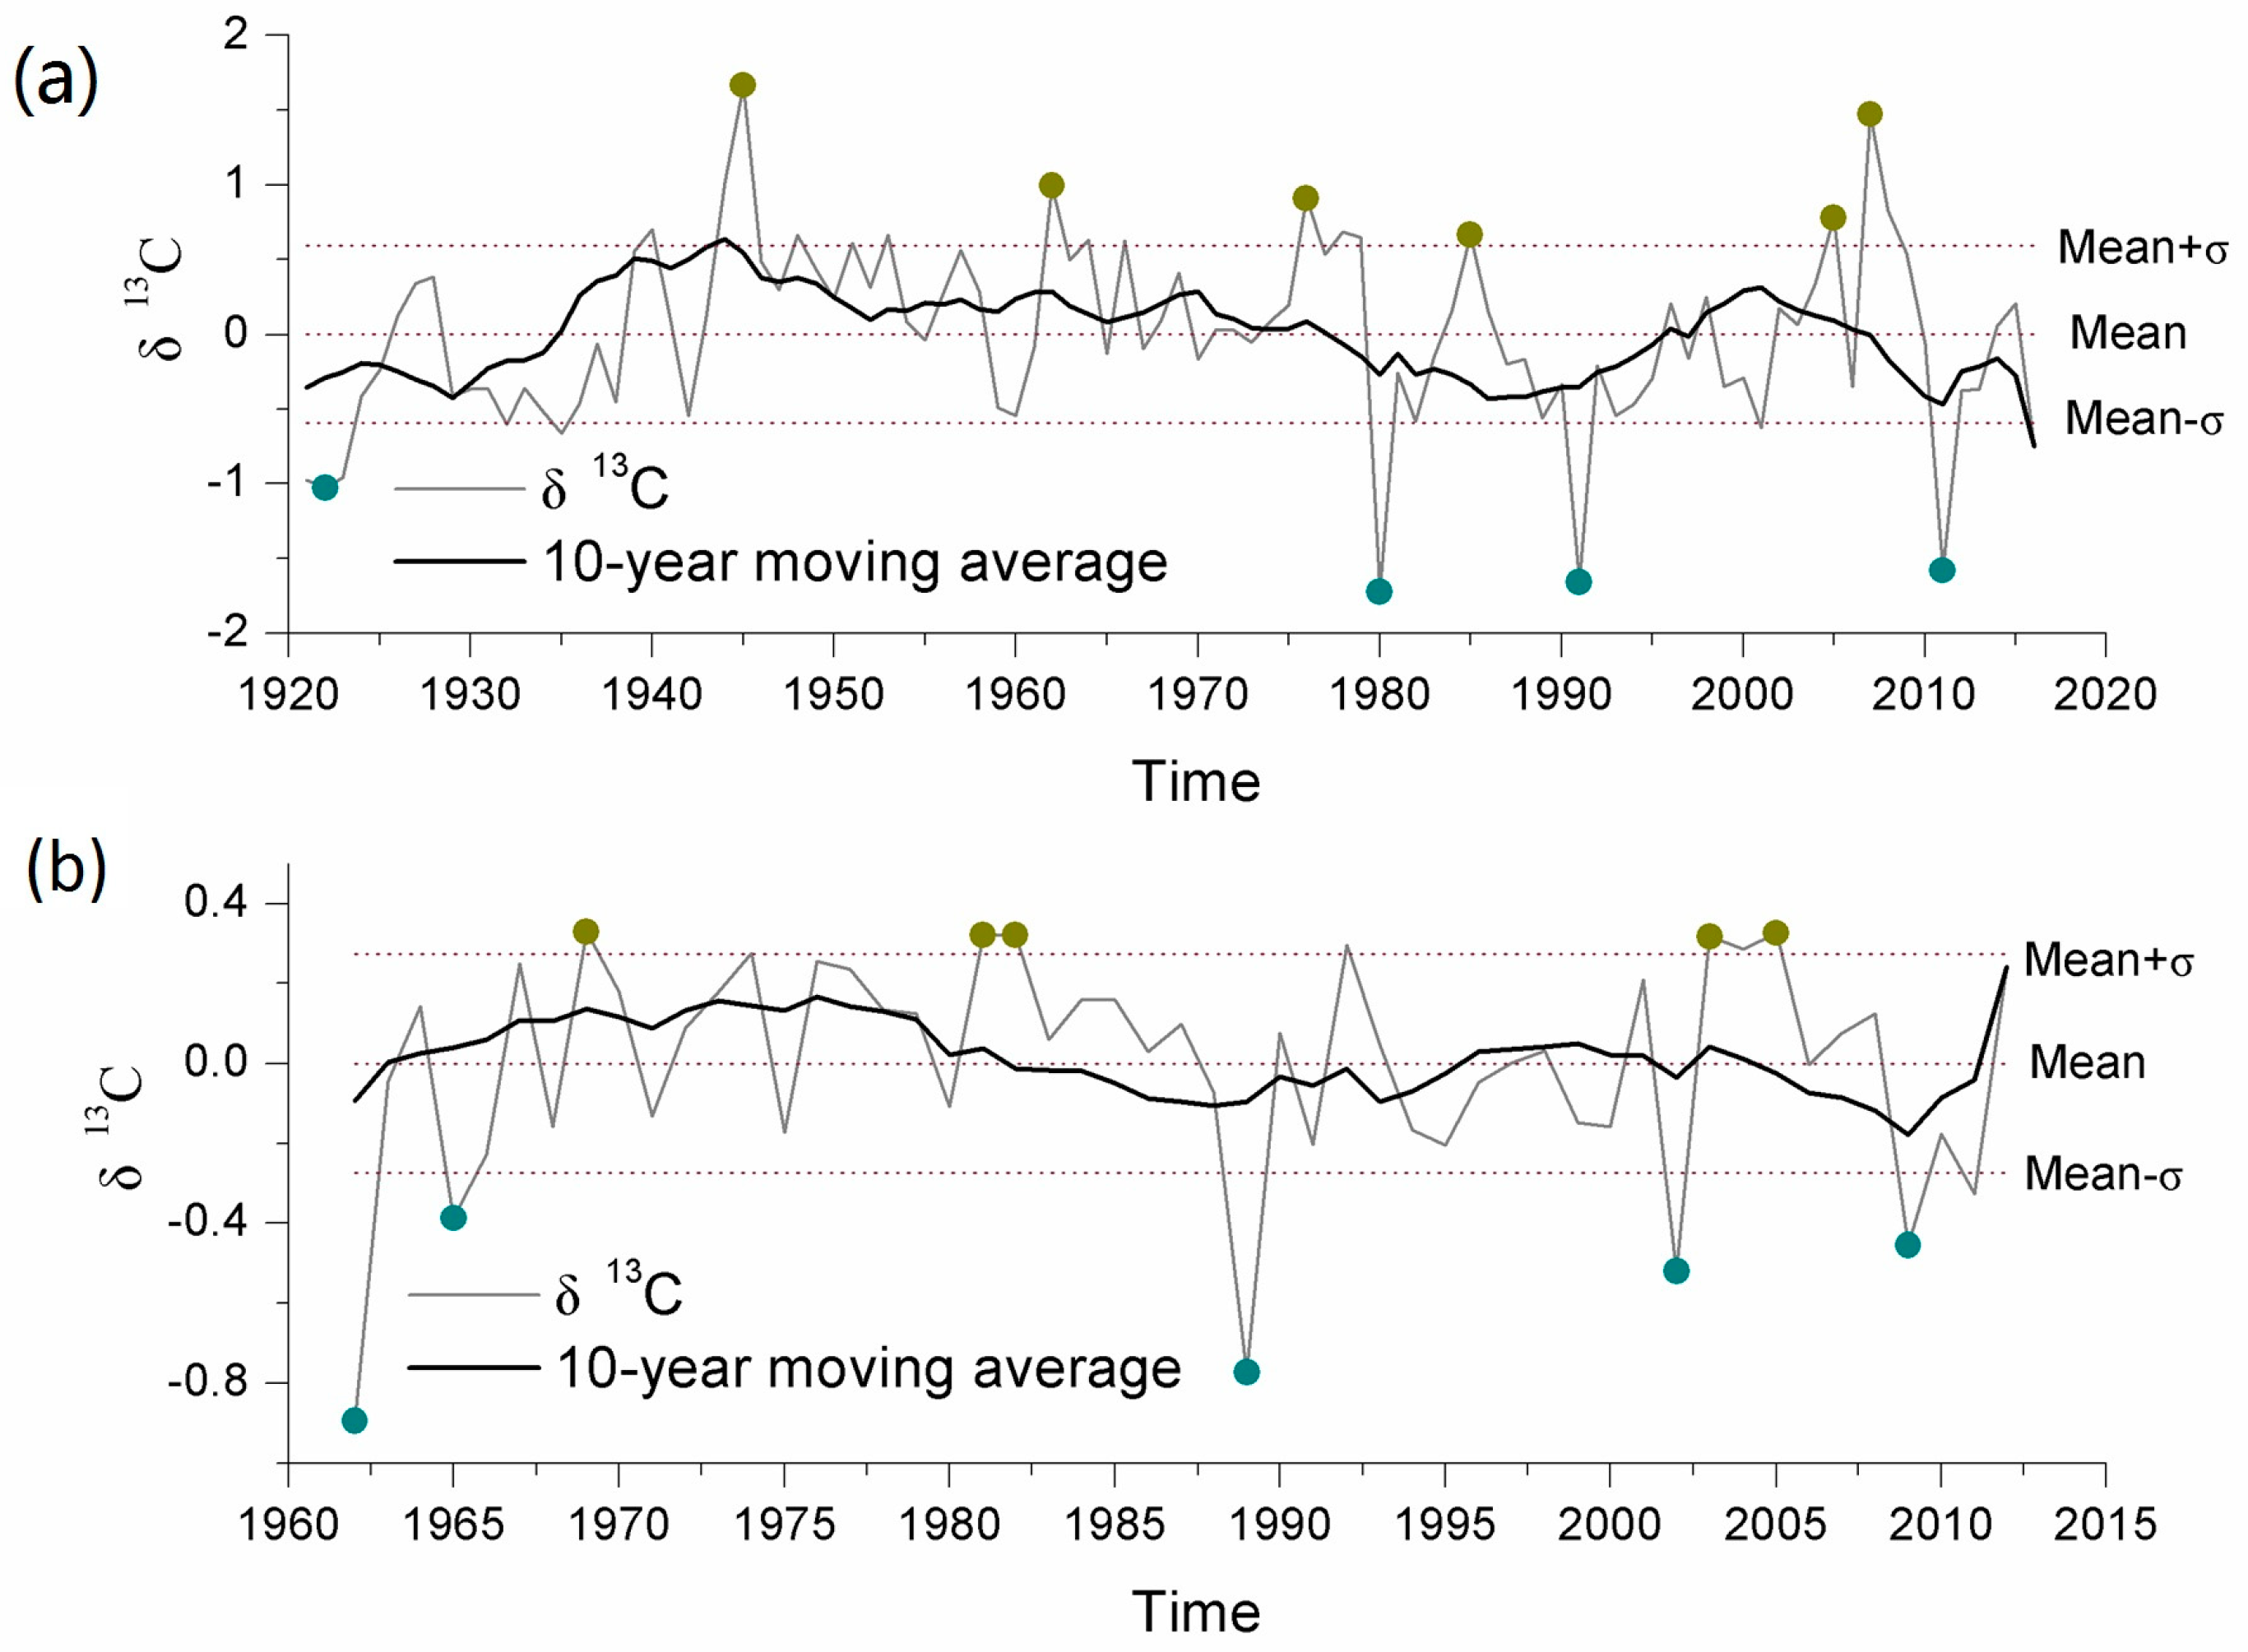
4.1.2. Statistical Characteristics of the Stable Carbon Isotope Series
4.2. Tree-Growth Response to Meteorological Parameters and Baseflow
4.2.1. Climatic Signal in Tree Rings
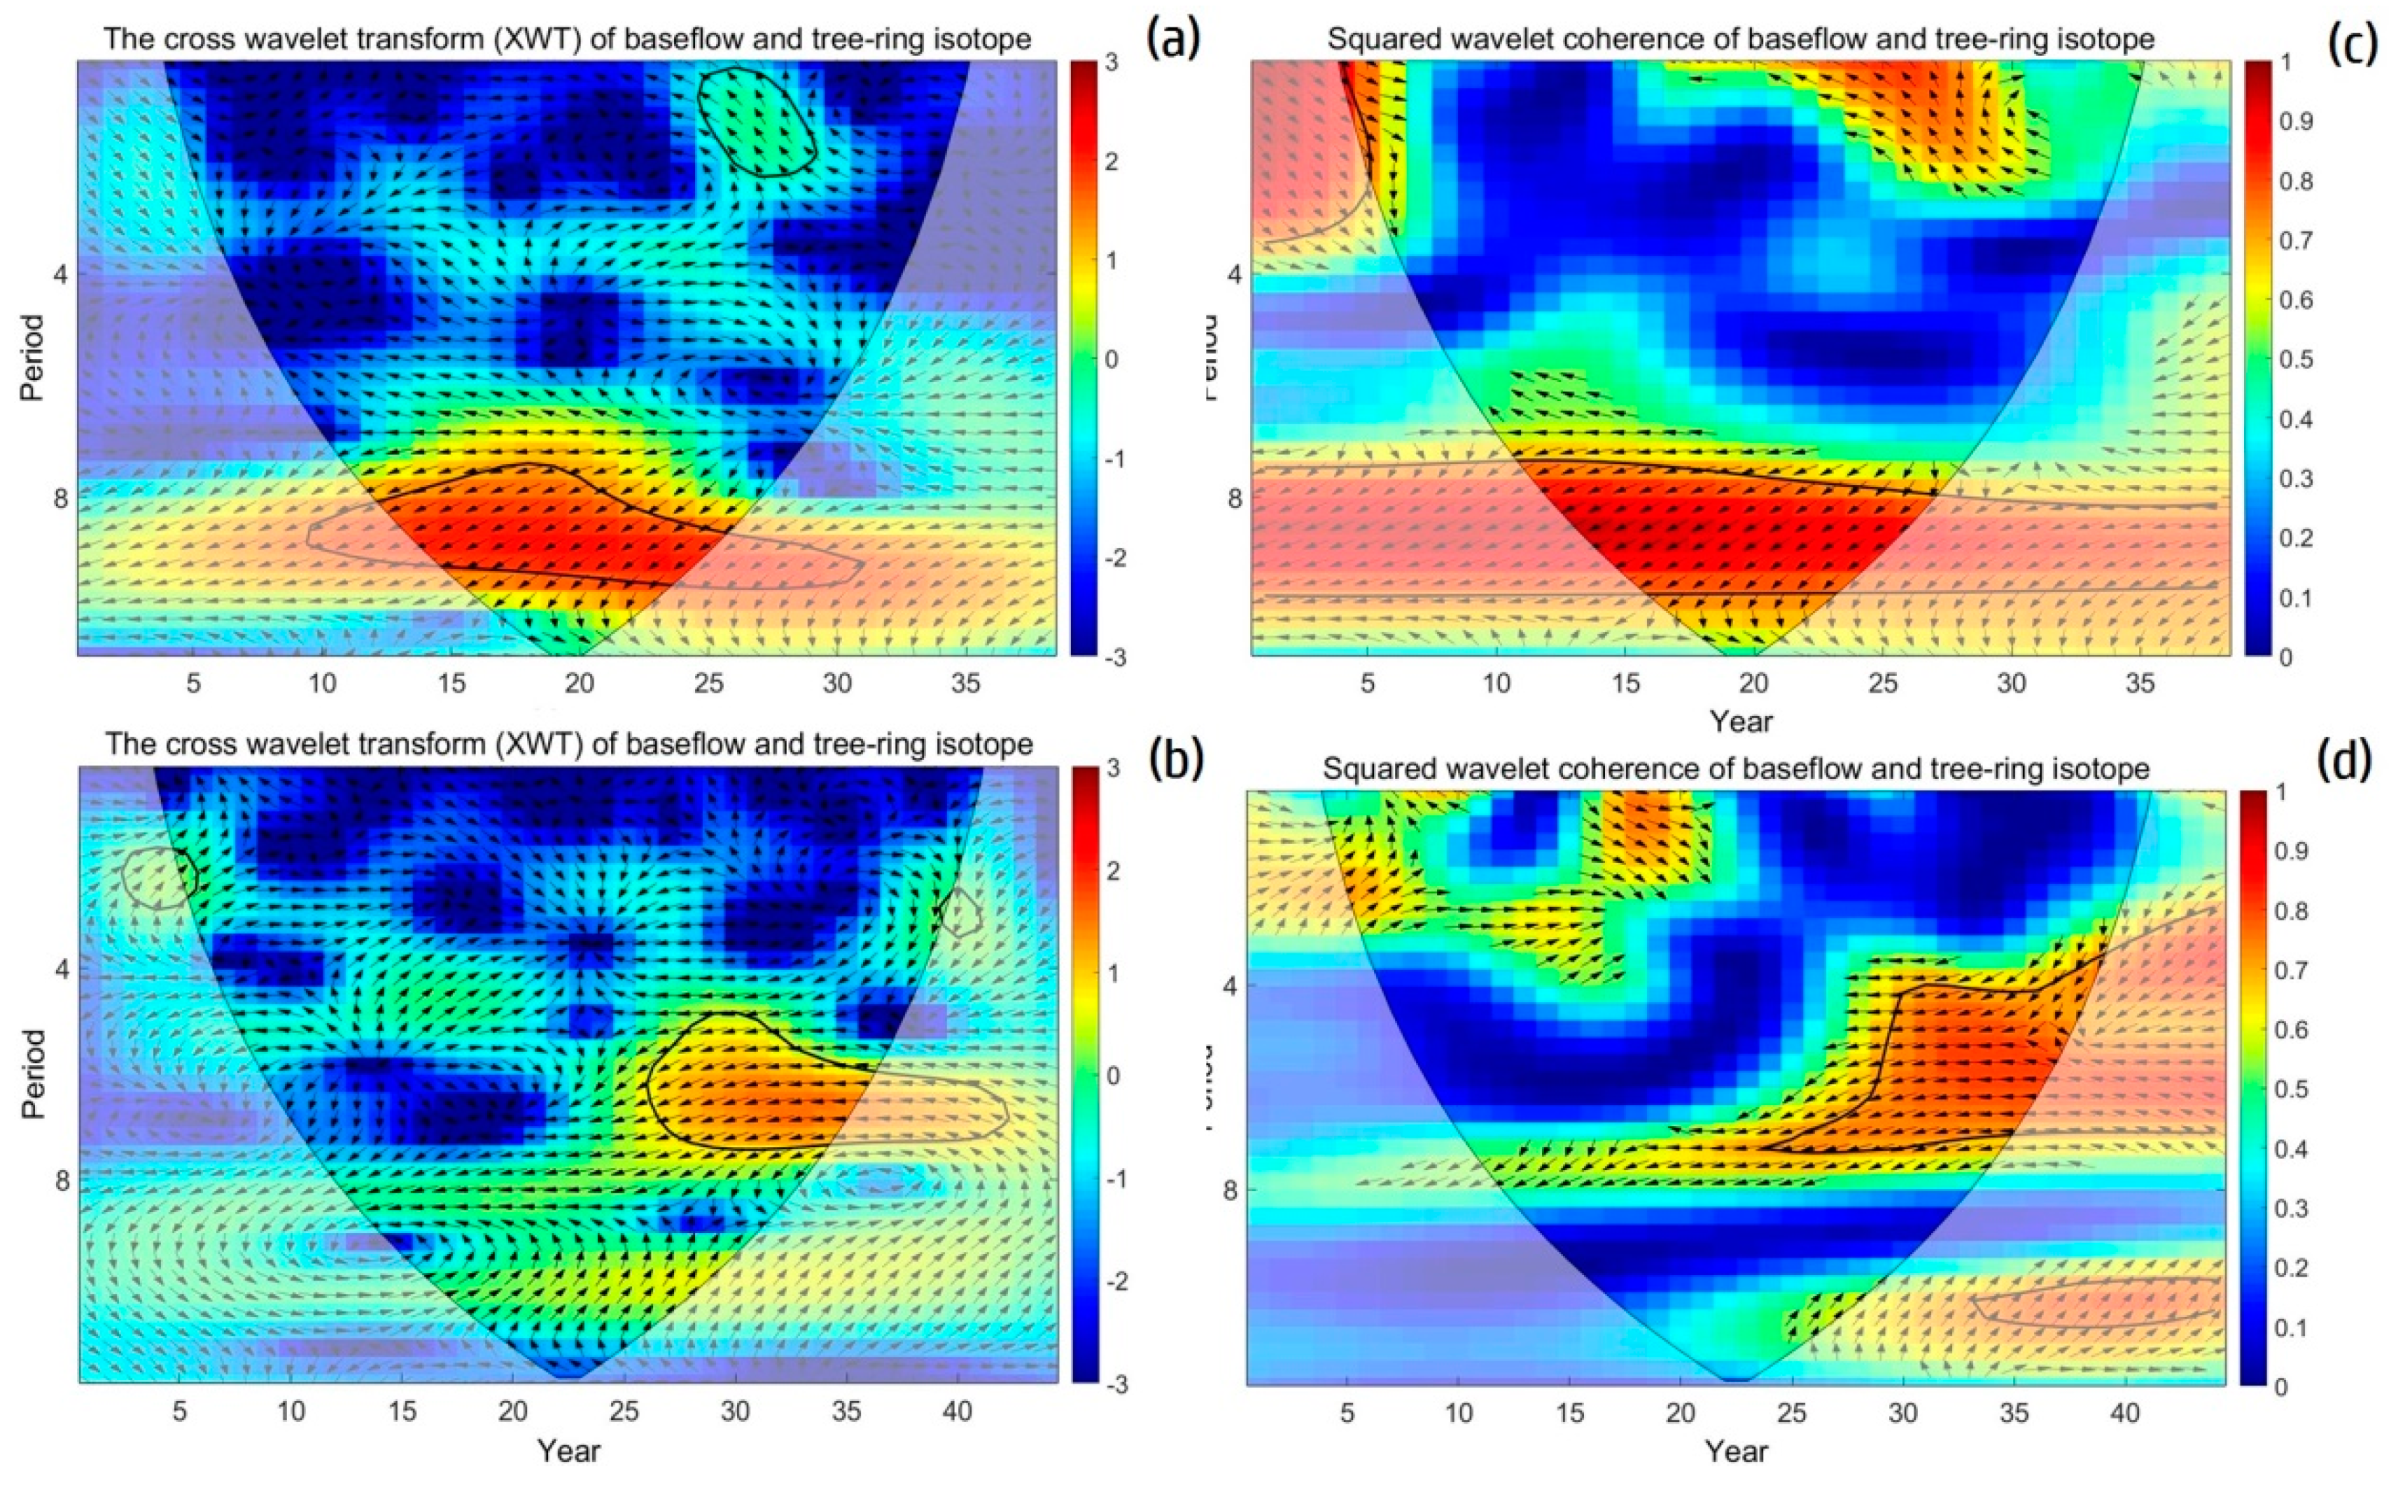
4.2.2. Baseflow Analysis
5. Discussions
5.1. Inconsistent Response of Tree-Ring Parameters of Two Study Region
5.2. Different Potential of TRW and Isotope in Characterization
5.3. Linkages between the Tree-Ring Parameters and Baseflow under Climate Change
6. Conclusions
Author Contributions
Funding
Acknowledgments
Conflicts of Interest
References
- Ljungqvist, F.C.; Krusic, P.J.; Sundqvist, H.S.; Zorita, E.; Brattström, G.; Frank, D. Northern Hemisphere hydroclimate variability over the past twelve centuries. Nature 2016, 532, 94–98. [Google Scholar] [CrossRef]
- Chase, T.N.; Pielke, R.A.; Knaff, J.A.; Kittel, T.G.f.; Eastman, J.L. A comparison of regional trends in 1979–1997 depth–averaged tropospheric temperatures. Int. J. Clim. 2000, 20, 503–518. [Google Scholar] [CrossRef]
- Cook, B.I.; Smerdon, J.E.; Seager, R.; Coats, S. Global warming and 21st century drying. Clim. Dyn. 2014, 43, 2607. [Google Scholar] [CrossRef] [Green Version]
- Sorg, A.; Mosello, B.; Shalpykova, G.; Allan, A.; Clarvis, M.H.; Stoffel, M. Coping with changing water resources: The case of the Syr Darya river basin in Central Asia. Environ. Sci. Policy 2014, 43, 68–77. [Google Scholar] [CrossRef]
- Kezer, K.; Matsuyama, H. Decrease of river runoff in the Lake Balkhash basin in Central Asia. Hydrol. Process. 2006, 20, 1407–1423. [Google Scholar] [CrossRef]
- Vogel, R.M.; Kroll, C.N. Regional geohydrologic–geomorphic relationships for the estimation of low–flow statistics. Water Resour. Res. 1992, 28, 2451–2458. [Google Scholar] [CrossRef]
- Nathan, R.J.; Austin, K.; Crawford, D.; Jayasuriya, N. The estimation of monthly yield in ungauged catchments using a lumped conceptual model. Aust. J. Water Resour. 1996, 1, 65–75. [Google Scholar]
- Lacey, C.G.; Grayson, R.B. Relating baseflow to catchment properties in south–eastern Australia. J. Hydrol. 1998, 204, 231–250. [Google Scholar] [CrossRef]
- Haberlandt, U.; Klocking, B.; Krysanova, V. Regionalisation of the base flow index from dynamically simulated flow components—A case study in the Elbe River Basin. J. Hydrol. 2001, 248, 35–53. [Google Scholar] [CrossRef]
- Mwakalila, S.; Feyen, J.; Wyseure, G. The influence of physical catchment properties on baseflow in semi–arid environments. J. Arid Environ. 2002, 52, 245–258. [Google Scholar] [CrossRef]
- Longobardi, A.; Villani, P. Baseflow index regionalization analysis in a Mediterranean area and data scarcity context: Role of the catchment permeability index. J. Hydrol. 2008, 355, 63–75. [Google Scholar] [CrossRef]
- Gan, R.; Luo, Y.; Zuo, Q.; Sun, L. Effects of projected climate change on the glacier and runoff generation in the Naryn River Basin, Central Asia. J. Hydrol. 2015, 523, 240–251. [Google Scholar] [CrossRef]
- Niederer, P.; Bilenko, V.; Ershova, N.; Hurni, H.; Yerokhin, S.; Maselli, D. Tracing glacier wastage in the Northern Tien Shan (Kyrgyzstan/Central Asia) over the last 40 years. Clim. Chang. 2008, 86, 227–234. [Google Scholar] [CrossRef] [Green Version]
- Bai, J.; Chen, X.; Li, J.; Yang, L.; Fang, H. Changes in the area of inland lakes in arid regions of central Asia during the past 30 years. Environ. Monit. Assess. 2011, 178, 247–256. [Google Scholar] [CrossRef]
- Duethmann, D.; Bolch, T.; Farinotti, D.; Kriegel, D.; Vorogushyn, S.; Merz, B.; Pieczonka, T.; Jiang, T.; Su, B.D.; Güntner, A. Attribution of streamflow trends in snow and glacier melt–dominated catchments of the Tarim River, Central Asia. Water Resour. Res. 2015, 51, 4727–4750. [Google Scholar] [CrossRef] [Green Version]
- Liu, J.B.; Chen, S.Q.; Chen, J.H.; Zhang, Z.P.; Chen, F.H. Chinese cave δ18O records do not represent northern East Asian summer monsoon rainfall. Proc. Natl. Acad. Sci. USA 2017, 114, E2987–E2988. [Google Scholar] [CrossRef] [Green Version]
- Chen, Y.N.; Li, Z.; Fang, G.H.; Deng, H.J. Impact of climate change on water resources in the Tianshan Mountians, Central Asia. Acta Geogr. Sin. 2017, 72, 18–26. [Google Scholar]
- Chen, F.; Zhang, T.; Seim, A.; Yu, S.; Kodirov, A. Juniper tree–ring data from the kuramin range (northern tajikistan) reveals changing summer drought signals in western central asia. Forests 2019, 10, 505. [Google Scholar] [CrossRef] [Green Version]
- Esper, J.; Treydte, K.; Gärtner, H.; Neuwirth, B. A tree ring reconstruction of climatic extreme years since 1427 AD for Western Central Asia. Palaeobotanist 2001, 50, 141–152. [Google Scholar]
- Davi, N.; Jacoby, G.; Curtis, A.; Baatarbileg, N. Extension of drought records for Central Asia using tree rings: West–Central Mongolia. J. Clim. 2006, 19, 288–299. [Google Scholar] [CrossRef]
- Yuan, Y.J.; Shao, X.M.; Wei, W.S.; Yu, S.L.; Gong, Y.; Trouet, V. The potential to reconstruct Manas River streamflow in the northern Tien Shan Mountains (NW China). Tree–Ring Res. 2007, 63, 81–93. [Google Scholar] [CrossRef] [Green Version]
- Fang, K.; Davi, N.; Gou, X.; Chen, F.; Cook, E.; Li, J.; D’Arrigo, R. Spatial drought reconstructions for central High Asia based on tree rings. Clim. Dyn. 2010, 35, 941–951. [Google Scholar] [CrossRef]
- Zhang, T.W.; Yuan, Y.J.; Liu, Y.; Wei, W.S.; Yu, S.L.; Chen, F.; Fan, Z.A.; Shang, H.M.; Zhang, R.B.; Qin, L. A tree–ring based precipitation reconstruction for the Baluntai region on the southern slope of the central Tien Shan Mountains, China, since AD 1464. Quat. Int. 2013, 283, 55–62. [Google Scholar] [CrossRef]
- Chen, F.; Yuan, Y.J.; Wei, W.S.; Yu, S.L.; Zhang, T.W.; Shang, H.M.; Zhang, R.B.; Qin, L.; Fan, Z.A. Tree–ring recorded hydroclimatic change in Tienshan mountains during the past 500 years. Quat. Int. 2015, 358, 35–41. [Google Scholar] [CrossRef]
- Chen, F.; Yuan, Y.; Davi, N.; Zhang, T. Upper Irtysh River flow since AD 1500 as reconstructed by tree rings, reveals the hydroclimatic signal of inner Asia. Clim. Chang. 2016, 139, 651–665. [Google Scholar] [CrossRef]
- Zhang, R.; Yuan, Y.; Gou, X.; Yang, Q.; Wei, W.; Yu, S.; Zhang, T.W.; Shang, H.M.; Chen, F.; Fan, Z.A.; et al. Streamflow variability for the Aksu River on the southern slopes of the Tien Shan inferred from tree ring records. Quat. Res. 2016, 85, 371–379. [Google Scholar] [CrossRef]
- Opała, M.; Niedźwiedź, T.; Rahmonov, O.; Owczarek, P.; Małarzewski, Ł. Towards improving the Central Asian dendrochronological network—New data from Tajikistan, Pamir–Alay. Dendrochronologia 2017, 41, 10–23. [Google Scholar] [CrossRef]
- Zhang, R.B.; Ermenbaev, B.; Zhang, T.W.; Ali, M. Records the Hydroclimatic Changes in the Chu River Basin over the Past 175 Years. Forests 2019, 10, 223. [Google Scholar] [CrossRef] [Green Version]
- Yuan, Y.J.; Ye, W.; Dong, G.R. Reconstruction and Discussion of 314 a Precipitation in Yili Prefecture, Western Tianshan Mountains. J. Glaciol. Geocryol. 2000, 2, 121–127. [Google Scholar]
- Yuan, Y.J.; Li, J.F. The Relationships between Tree–Ring Climate Growth of Spruce Forest and Climate in the West Part of Tianshan Mountain. J. Xinjiang Univ. 1994, 4, 94–98. [Google Scholar]
- Wang, C.Y.; Hu, Y.B. Analysis on the Characteristics of Cold–Warm Climatic Variations Since Recent 250 Year in Yili Region, Xinjiang, China. Geogr. Arid Area. 1996, 3, 37–44. [Google Scholar]
- Zhang, F.H. The Succession and the Sustainable Development of Oases Ago–Ecosystem in the Valley of Manas River. Ph.D. Thesis, China Agriculture University, Beijing, China, 2004. [Google Scholar]
- McCarroll, D.; Loader, N.J. Stable isotopes in tree rings. Quat. Sci. Rev. 2004, 23, 771–801. [Google Scholar] [CrossRef]
- Boakye, E.; Gebrekirstos, A.; Hyppolite, D.; Barnes, V.; Porembski, S.; Bräuning, A. Carbon isotopes of riparian forests trees in the savannas of the volta sub–basin of ghana reveal contrasting responses to climatic and environmental variations. Forests 2019, 10, 251. [Google Scholar] [CrossRef] [Green Version]
- Marini, F.; Battipaglia, G.; Manetti, M.C.; Corona, P.; Romagnoli, M. Impact of climate, stand growth parameters, and management on isotopic composition of tree rings in chestnut coppices. Forests 2019, 10, 1148. [Google Scholar] [CrossRef] [Green Version]
- Lipp, J.; Trimborn, P.; Fritz, P. Stable isotopes in tree ring cellulose and climatic change. Tellus B 1991, 43, 322–330. [Google Scholar] [CrossRef] [Green Version]
- Schleser, G.H.; Helle, G.; Lücke, A.; Vos, H. Isotope signals as climate proxies: The role of transfer functions in the study of terrestrial archives. Quat. Sci. Rev. 1999, 18, 927–943. [Google Scholar] [CrossRef]
- Waterhouse, J.S.; Switsur, V.R.; Barker, A.C.; Carter, A.H.C.; Robertson, I. Oxygen and hydrogen isotope ratios in tree rings: How well do models predict observed values. Earth Planet. Sci. Lett. 2002, 201, 421–430. [Google Scholar] [CrossRef]
- Loader, N.J.; Santillo, P.M.; Woodman-Ralph, J.P.; Rolfe, J.E.; Hall, M.A.; Gagen, M.; Robertson, I.; Wilson, R.; Froyd, C.A.; McCarroll, D. Multiple stable isotopes from oak trees in southwestern Scotland and the potential for stable isotope dendroclimatology in maritime climatic regions. Chem. Geol. 2008, 252, 62–71. [Google Scholar] [CrossRef]
- Loader, N.J.; McCarroll, D.; Gagen, M.; Robertson, I.; Jalkanen, R. Extracting climatic in formation from stable isotopes in tree rings. Terr. Ecol. 2007, 25, 27–48. [Google Scholar]
- Liu, Y.; Cai, Q.; Liu, W.; Yang, Y.; Sun, J.; Song, H.; Li, X. Monsoon precipitation variation recorded by tree–ring 18 O in arid Northwest China since AD 1878. Chem. Geol. 2008, 252, 56–61. [Google Scholar] [CrossRef]
- Liu, X.; Shao, X.; Liang, E.; Chen, T.; Qin, D.; An, W.; Xu, G.; Sun, W.; Wang, Y. Climatic significance of tree–ring D18 O in the Qilian Mountains, northwestern China and its relationship to atmospheric circulation patterns. Chem. Geol. 2009, 268, 147–154. [Google Scholar] [CrossRef]
- Farquhar, G.D.; Ehleringer, J.R.; Hubick, K.T. Carbon isotope discrimination and photosynthesis. Annu. Rev. Plant Biol. 1989, 40, 503–537. [Google Scholar] [CrossRef]
- O’Leary, M.H. Carbon isotopes in photo synthesis. BioScience 1988, 38, 328–336. [Google Scholar] [CrossRef]
- Bert, D.; Leavitt, S.W.; Dupouey, J.L. Variations of wood 13C an d water efficiency of Abies alba during the last century. Ecology 1997, 78, 1588–1596. [Google Scholar]
- Han, X.G.; Yan, C.R.; Chen, L.Z.; Mei, X.R. Stable carbon isotope characteristics of some woody plants in warm temperate zone. Chin. J. App. Ecol. 2000, 4, 497–500. [Google Scholar]
- Liu, Y.; Ma, L.M.; Cai, Q.F.; An, Z.S.; Gao, L.Y. Reconstruction of summer temperature (June—August) at Mt. Helan, China, from tree–ring stable carbon isotope values since AD 1890. Sci. China. Ser. D Earth Sci. 2002, 45, 1127–1136. [Google Scholar] [CrossRef]
- Liu, X.H.; Qin, D.H.; Shao, X.M.; Ren, J.W.; Wang, Y. Stable Carbon Isotope of Abies spectabibis from Nyingchi County of Tibet Autonomous Region and Its Response to Climate Change. J. Glaciol. Geocryol. 2002, 5, 574–578. [Google Scholar]
- Dupouey, J.L.; Leavitt, S.; Choisnel, E.; Jourdain, S. Modelling carbon isotope fractionation in tree rings based on effective evapotranspiration and soil water status. Plant Cell Environ. 1993, 16, 939–947. [Google Scholar] [CrossRef]
- Leavitt, S.W.; Long, A. Stable Carbon Isotope Chronologies from Trees in the Southwestern United States. Water Resour. Bull. 1989, 25, 341–347. [Google Scholar] [CrossRef]
- Francey, R.J.; Farquhar, G.D. An explanation of 13C/12C variations in tree rings. Nature 1982, 297, 28–31. [Google Scholar] [CrossRef]
- Yuan, Y.J.; Li, J.F.; Zhang, J.B. 348–year precipitation reconstruction from tree–rings for the north slope of the middle Tianshan Mountains. Acta Meteorol. Sin. 2001, 15, 95–104. [Google Scholar]
- Chen, F.; Yuan, Y.J.; Chen, F.H.; Wei, W.S.; Yu, S.L.; Chen, X.J.; Fan, Z.A.; Zhang, R.B.; Zhang, T.W.; Shang, H.M.; et al. A 426–year drought history for Western Tian Shan, Central Asia inferred from tree–rings and its linkages to the North Atlantic and Indo–West Pacific Oceans. Holocene 2013, 23, 1095–1104. [Google Scholar] [CrossRef]
- Fritts, H.C. Tree Ring and Climate; Academic Press: London, UK, 1976. [Google Scholar]
- Holmes, R.L. Computer–assisted quality control in tree–ring dating and measurement. Tree Ring Bull. 1983, 43, 69–78. [Google Scholar]
- Cook, E.; Kairiukstis, L. Methods of Dendrochronology: Applications in the Environmental Sciences; Springer: Dordrecht, The Netherlands, 1990. [Google Scholar]
- R Core Team. R: A Language and Environment for Statistical Computing; R Foundation for Statistical Computing: Vienna, Austria, 2016; Available online: https://www.R–project.org/ (accessed on 1 October 2018).
- Jolliffe, I.T. Principal Component Analysis. Springer Series in Statistics, 2nd ed.; Springer: New York, NY, USA, 2002. [Google Scholar]
- Leavitt, S.W.; Long, A. Sampling strategy for the stable carbon isotope analysis of tree rings in pine. Nature 1984, 311, 45–147. [Google Scholar] [CrossRef]
- Liu, X.; Shao, X.; Wang, L.; Liang, E.; Qin, D.; Ren, J. Response and dendroclimatic implications of 13 C in tree rings to increasing drought on the northeastern Tibetan Plateau. J. Geophys. Res. 2008, 113, G03015. [Google Scholar] [CrossRef] [Green Version]
- Leavit, S.W. Tree–ring isotopic pooling without regard to mass: No difference from averaging values of each tree. Chem. Geol. 2008, 252, 52–55. [Google Scholar] [CrossRef]
- Treydte, K.; Schleser, G.H.; Schweingruber, F.H. The climatic significance of 13C in subalpine spruces (L. otschental, Swiss Alps). Tellus 2001, 53B, 593–611. [Google Scholar] [CrossRef]
- Barbour, M.M.; Andrews, T.J.; Farquhar, G.D. Correlations between oxygen isotope ratios of wood constituents of Quercus and Pinus samples from around the world. Aust. J. Plant Physiol. 2001, 28, 335–348. [Google Scholar] [CrossRef]
- Liu, Y.; Ma, L.M.; Leavitt, S.W. A preliminary seasonal precipitation recon struction from tree–ring stable carbon isotopes at Mt. Helan, China, since AD 1804. Glob. Planet. Chang. 2004, 41, 229–239. [Google Scholar] [CrossRef]
- Tao, F.X.; Liu, Y.; An, N. On the necessity of organic solvent extraction for carbon isotopic analysis of A–cellulose: Implications for environmental reconstructions. Int. J. Environ. Anal. Chem. 2010, 90, 605–619. [Google Scholar] [CrossRef]
- Fan, Y.T.; Chen, Y.N.; Liu, Y.B.; Li, W.H. Variation of Baseflows in the Headstreams of the Tarim River Basin during 1960–2007. J. Hydrol. 2013, 487, 98–108. [Google Scholar] [CrossRef]
- Gan, R. Baseflow Characterisics and Impact of Climate Change on River Basins in arid Northwest China and Tian Shan, Central Asia; Institute of Geographic Sciences and Natural Resources Research, Chinese Academy of Sciences: Beijing, China, 2014. [Google Scholar]
- Yu, J.; Zhou, G.; Liu, Q. Tree–ring based summer temperature regime reconstruction in XiaoXing Anling Mountains, northeastern China since 1772 CE. Palaeogeogr. Palaeoclim. Palaeoecol. 2018, 495, 13–23. [Google Scholar] [CrossRef]
- Xu, Z.X.; Takeuchi, K.; Ishidaira, H. Monotonic trend and step changes in Japanese precipitation. J. Hydrol. 2003, 279, 144–150. [Google Scholar] [CrossRef]
- Zang, C.; Biondi, F. treeclim: An R package for the numerical calibration of proxy–climate relationships. Ecography 2015, 38, 1–6. [Google Scholar] [CrossRef]
- Box, G.E.; Jenkins, G.M. Time series analysis: Forecasting and control. In Holden-Day Series in Time Series Analysis; Holden-Day: San Francisco, CA, USA, 1976. [Google Scholar]
- Torrence, C.; Compo, G.P. A Practical Guide to Wavelet Analysis. Bull. Am. Meteorol. Soc. 1998, 79, 61–78. [Google Scholar] [CrossRef] [Green Version]
- Chen, F.; Yuan, Y.J.; Yu, S.L. Tree–ring indicators of rainfall and streamflow for the Ili–Balkhash Basin, Central Asia since CE 1560. Palaeogeography 2017, 482, 48–56. [Google Scholar] [CrossRef]
- Panyushkina, I.P.; Meko, D.M.; Macklin, M.G.; Toonen, W.H.J.; Mukhamedeiv, M.M.; Konovalov, V.G.; Ashikbaev, N.Z.; Sagitov, A.O. Runoff variations in Lake Balkhash Basin, Central Asia, 1779 to 2015, inferred from tree rings. Clim. Dyn. 2018, 51, 3161–3177. [Google Scholar] [CrossRef]
- Chen, F.; Shang, H.M.; Yuan, Y.J. Dry/wet variations in the eastern Tien Shan (China) since AD 1725 based on Schrenk spruce (Picea schrenkiana Fisch. et Mey) tree rings. Dendrochronologia 2016, 40, 266–272. [Google Scholar] [CrossRef]
- Shang, H.M.; Yin, Z.F.; Chen, Z.J.; Wei, W.S.; Yuan, Y.J.; Chen, R.Y. Annual streamflow of Jinghe River basin in northern slope of Tianshan Mountains recorded by tree–ring during 1615–2007. Adv. Water Sci. 2014, 25, 779–788. (In Chinese) [Google Scholar]
- Li, J.B.; Gou, X.H.; Cook, E.R.; Chen, F.H. Tree–ring based drought reconstruction for the central Tien Shan area in northwest China. Geophys. Res. Lett. 2006, 33, L07715. [Google Scholar] [CrossRef] [Green Version]
- Jiao, L.; Jiang, Y.; Wang, M.; Zhang, W.; Zhang, Y. Age–effect radial growth responses of Picea schrenkiana to climate change in the eastern Tianshan Mountains, Northwest China. Forests 2017, 8, 294. [Google Scholar] [CrossRef] [Green Version]
- Xu, G.B.; Liu, X.H.; Trouet, V.; Trouet, V.; Treydte, K.; Wu, G.J.; Chen, T.; Sun, W.Z.; An, W.L.; Wang, W.Z.; et al. Regional drought shifts (1710–2010) in east Central Asia and linkages with atmospheric circulation recorded in tree–ring δ18O. Clim. Dyn. 2018, 52, 1–15. [Google Scholar] [CrossRef] [Green Version]
- Zhang, R.B.; Yuan, Y.J.; Gou, X.H. Intra–annual radial growth of Schrenk spruce (Picea schrenkiana Fisch. et Mey) and its response to climate on the northern slopes of the Tianshan Mountains. Dendrochronologia 2016, 40, 36–42. [Google Scholar] [CrossRef]
- Huang, W.; Chen, J.H.; Zhang, X.J.; Feng, S.; Chen, F.H. Definition of the core zone of the westerlies–dominated climatic regime, and its controlling factors during the instrumental period. Sci. China Earth Sci. 2015, 58, 676–684. [Google Scholar] [CrossRef]
- Chen, F.; Yuan, Y.J.; Wei, W.S.; Yu, S.L.; Fan, Z.A.; Zhang, R.B.; Zhang, T.W.; Shang, H.M. Tree–ring–based reconstruction of precipitation for the Changling Mountains, China, since A.D.1691. Int. J. Biometeorol. 2012, 56, 765–774. [Google Scholar] [CrossRef]
- Chen, F.; Yuan, Y.J.; Yu, S.L.; Zhang, W.T.; Shang, H.M.; Zhang, R.B.; Qin, L.; Fan, Z.A. A 225–year long drought reconstruction for east Xinjiang based on Siberia larch (Larix sibirica) tree–ring widths: Reveals the recent dry trend of the eastern end of Tien Shan. Quat. Int. 2014, 358, 42–47. [Google Scholar] [CrossRef]
- Cook, E.R.; Anchukaitis, K.J.; Buckley, B.M.; D’Arrigo, R.D.; Jacoby, G.C.; Wright, W.E. Asian monsoon failure and megadrought during the last millennium. Science 2010, 328, 486–489. [Google Scholar] [CrossRef] [Green Version]
- Davi, N.K.; Pederson, N.; Leland, C.; Nachin, B.; Suran, B.; Jacoby, G.C. Is eastern Mongolia drying? A long–term perspective of a multidecadal trend. Water Resour. Res. 2013, 49, 151–158. [Google Scholar] [CrossRef] [Green Version]
- Liang, E.; Shao, X.; Kong, Z.; Lin, J. The extreme drought in the 1920s and its effect on tree growth deduced from tree ring analysis: A case study in North China. Ann. For. Sci. 2003, 60, 145–152. [Google Scholar] [CrossRef] [Green Version]
- Fan, Y.T.; Chen, Y.N.; He, Q.; Li, W.H.; Wang, Y. Isotopic Characterization of River Waters and Water Source Identification in an Inland River, Central Asia. Water 2016, 8, 286. [Google Scholar] [CrossRef] [Green Version]
- Zhang, R.B.; Yuan, Y.J.; Gou, X.H.; He, Q.; Shang, H.M.; Zhang, T.W.; Chen, F.; Ermenbaev, B.; Yu, S.L.; Qin, L.; et al. Tree–ring–based moisture variability in western Tianshan Mountains since A.D. 1882 and its possible driving mechanism. Agric. For. Meteorol. 2016, 218, 267–276. [Google Scholar] [CrossRef]
- Jiang, P.; Liu, H.Y.; Wu, X.C.; Wang, H.Y. Tree–ring–based SPEI reconstruction in central Tianshan Mountains of China since A.D. 1820 and links to westerly circulation. Int. J. Climatol. 2017, 37, 2863–2872. [Google Scholar] [CrossRef]
- Zhang, R.B.; Yuan, Y.J.; Wei, W.S. Dendroclimatic reconstruction of autumn–winter mean minimum temperature in the eastern Tibetan Plateau since 1600 AD. Dendrochronologia 2015, 33, 1–7. [Google Scholar] [CrossRef]
- Dai, X.G.; Wang, P.; Zhang, K.J. A study on precipitation trend and fluctuation mechanism in northwestern China over the past 60 years. Acta Phys. Sin. 2013, 62, 129–201. [Google Scholar]
- Yuan, Y.; Li, J. The response functions of tree ring chronologies in western Tianshan Mountain. J. Glaciol. Geocryol. 1995, 17, 171–177, (In Chinese with English abstract). [Google Scholar]
- Farquhar, G.D.; O’Leary, M.H.; Berry, J.A. On the relationship between carbon isotope discrimination and the intercellular carbon dioxide concentration in leaves. Aust. J. Plant Physiol. 1982, 9, 121–137. [Google Scholar] [CrossRef]
- Singer, M.B.; Stella, J.C.; Dufour, S.; Piégay, H.; Wilson, R.J.; Johnstone, L. Contrasting water–uptake and growth responses to drought in co–occurring riparian tree species. Ecohydrology 2013, 6, 402–412. [Google Scholar] [CrossRef]
- Stahl, K.; Hisdal, H.; Hannaford, J.; Tallaksen, L.; Van Lanen, H.; Sauquet, E.; Demuth, S.; Fendekova, M.; Jordar, J. Streamflow trends in Europe: Evidence from a dataset of near–natural catchments. Hydrol. Earth Syst. Sci. Discuss. 2010, 7, 5769–5804. [Google Scholar] [CrossRef] [Green Version]


| Location | Site ID | Longitude | Latitude | Elevation | Aspect | Slope |
|---|---|---|---|---|---|---|
| Ili | GS3 | 43°17′13.72″ | 84°18′47.16″ | 1698–1770 m | NW | 40 |
| WS1 | 43°27′43.38″ | 81°7′16.84″ | 2150–2580 m | NE | 30 | |
| WS2 | 43°25′40.17″ | 81°3′25.47″ | 2552–2739 m | NW | 10 | |
| AH2 | 42°41′26.65″ | 81°4′54.47″ | 1950–2685 m | NE | 35 | |
| Manas | XBY | 85°59′ | 43°50′ | 1745–1803 m | NW | 55.6 |
| Location | Site ID | Longitude/N | Latitude/E | Elevation/m | Mean a Temperature/°C | Mean b Air Humidity/% | Mean cPrecipitation/mm | Mean dSnow/mm |
|---|---|---|---|---|---|---|---|---|
| Ili | CB | 43.80 | 80.78 | 600 | 8.8 | 68.6 | 226.1 | 27.5 |
| YN | 43.92 | 81.28 | 670 | 9.0 | 64.8 | 279.2 | 33.8 | |
| NLK | 43.80 | 82.57 | 1200 | 6.5 | 68.1 | 382.6 | 35.3 | |
| YNX | 44.12 | 81.65 | 800 | 9.7 | 61.0 | 354.7 | 40.4 | |
| GL | 43.47 | 82.13 | 800 | 8.1 | 70.0 | 279.0 | 24.8 | |
| XY | 43.45 | 83.13 | 900 | 9.0 | 62.5 | 508.0 | 34.5 | |
| ZS | 43.13 | 81.00 | 1837 | 3.4 | 67.4 | 507.1 | 26.9 | |
| TKS | 43.18 | 81.77 | 1210.4 | 6.1 | 66.7 | 396.1 | 18.4 | |
| HGS | 44.20 | 80.42 | 770.9 | 9.9 | 58.3 | 248.3 | 26.2 | |
| HC | 44.05 | 80.85 | 640 | 9.7 | 63.3 | 244.0 | 28.1 | |
| Manas | SHZ | 44.32 | 86.05 | 442.9 | 7.4 | 64.1 | 214.5 | 24.4 |
| SW | 44.35 | 85.62 | 533 | 7.8 | 59.3 | 198.5 | 25.7 | |
| MNS | 44.30 | 86.22 | 471.4 | 7.1 | 63.9 | 200.4 | 25.8 | |
| HTB | 44.12 | 86.82 | 522.1 | 7.1 | 61.0 | 184.4 | 23.5 |
| Location | Site | Core/Tree Number | Length of TRW Chronology | MS | AC1 | SNR | VFE | EPS | Std.Dev | MCS |
|---|---|---|---|---|---|---|---|---|---|---|
| Ili | GS3 | 24/12 | 1860–2016 | 0.11 | 0.47 | 14.6 | 35.8% | 0.95 | 0.18 | 0.68 |
| WS1 | 32/16 | 1641–2016 | 0.12 | 0.45 | 22.6 | 42.6% | 0.96 | .015 | 0.72 | |
| WS2 | 30/15 | 1624–2016 | 0.12 | 0.45 | 16.7 | 36.4% | 0.96 | 0.13 | 0.66 | |
| AH2 | 16/8 | 1784–2016 | 0.15 | 0.50 | 16.5 | 36.2% | 0.96 | 0.17 | 0.65 | |
| Manas | XBY | 46/24 | 1859–2012 | 0.21 | 0.45 | 22.4 | 65.5% | 0.93 | 0.25 | 0.69 |
| Chronology | Total | % of Variance | Cumulative % | Factor 1 | Factor 2 |
|---|---|---|---|---|---|
| GS3 | 2.263 | 56.586 | 56.586 | 0.769 | −0.365 |
| WS1 | 1.024 | 25.602 | 82.187 | 0.405 | 0.891 |
| WS2 | 0.468 | 11.702 | 93.889 | 0.907 | 0.156 |
| AH2 | 0.244 | 6.111 | 100.000 | 0.828 | −0.268 |
| No. | Site | Time Span | Correlation Coefficients | ||
|---|---|---|---|---|---|
| 2 | 3 | 4 | |||
| 1 | GS3 | 1940–2016 | 0.470 ** | 0.466 ** | 0.546 ** |
| 2 | WS1 | 1921–2010 | / | 0.228 ** | 0.680 ** |
| 3 | WS2 | 1921–2016 | / | / | 0.744 ** |
| 4 | AH2 | 1939–2016 | / | / | / |
| Location | Length of Iso–Series | Mean(‰) | Min(‰) | Max(‰) | Range(‰) | Std.Dev | Variance | AC1 |
|---|---|---|---|---|---|---|---|---|
| Manas | 1962–2012 | −25.54 | −26.45 | −25.20 | 1.25 | 0.27 | 0.07 | 0.56 |
| Ili | 1921–2016 | −23.78 | −26.37 | −21.56 | −4.81 | 0.78 | 0.72 | 0.62 |
| –GS3 | 1921–2016 | −23.91 | −26.52 | −21.59 | 4.93 | 0.78 | 0.82 | 0.65 |
| –WS1 | 1925–2016 | −23.71 | −26.26 | −21.53 | 4.73 | 0.66 | 0.74 | 0.52 |
| –WS2 | 1932–2016 | −23.70 | −26.28 | −21.46 | 4.82 | 0.69 | 0.78 | 0.54 |
| –AH2 | 1928–2016 | −23.82 | −26.42 | −21.66 | 4.76 | 0.69 | 0.80 | 0.52 |
| Tree-Ring Parameters | Climatic Parameters | Correlation Coefficients | |
|---|---|---|---|
| Cor/Partial–cor | Manas | Ili | |
| TRW chron | Cor Temp | −0.546 * | −0.485 ** |
| Cor max Temp | −0.624 ** | −0.545 ** | |
| Cor min Temp | −0.555 * | −0.462 ** | |
| Cor Prec | −0.085 | 0.341 ** | |
| Cor RH | 0.472 ** | 0.341 * | |
| Cor VP | 0.02 | −0.028 | |
| partial–cor Temp | −0.547 | −0.024 | |
| partial–cor Prec | 0.091 | 0.128 | |
| δ13C series | Cor Temp | −0.319 * | −0.466 *** |
| Cor max Temp | −0.632 ** | −0.518 ** | |
| Cor min Temp | −0.346 * | −0.478 * | |
| Cor Prec | −0.020 | −0.109 | |
| Cor RH | −0.016 | 0.373 ** | |
| Cor VP | −0.426 ** | −0.463 ** | |
| partial–cor Temp | −0.318 | −0.478 | |
| partial–cor Prec | −0.004 | −0.163 | |
| Watershed | TRW Chronologies | δ13C Series | Snowmelt Season Temp | Winter Prec | ||||
|---|---|---|---|---|---|---|---|---|
| C–C Coef | Lag/Years | C–C Coef | Lag/Years | C–C Coef | Lag/Years | C–C Coef | Lag/Years | |
| Ili BF | −0.340 | −2 | −0.336 * | −4 | 0.650 ** | 2 | 0.145 * | 2 |
| Manas BF | −0.262 | −2 | −0.468 ** | −4 | 0.572 ** | 2 | 0.369 ** | 2 |
Publisher’s Note: MDPI stays neutral with regard to jurisdictional claims in published maps and institutional affiliations. |
© 2020 by the authors. Licensee MDPI, Basel, Switzerland. This article is an open access article distributed under the terms and conditions of the Creative Commons Attribution (CC BY) license (http://creativecommons.org/licenses/by/4.0/).
Share and Cite
Fan, Y.; Shang, H.; Wu, Y.; Li, Q. Tree-Ring Width and Carbon Isotope Chronologies Track Temperature, Humidity, and Baseflow in the Tianshan Mountains, Central Asia. Forests 2020, 11, 1308. https://doi.org/10.3390/f11121308
Fan Y, Shang H, Wu Y, Li Q. Tree-Ring Width and Carbon Isotope Chronologies Track Temperature, Humidity, and Baseflow in the Tianshan Mountains, Central Asia. Forests. 2020; 11(12):1308. https://doi.org/10.3390/f11121308
Chicago/Turabian StyleFan, Yuting, Huaming Shang, Ye Wu, and Qian Li. 2020. "Tree-Ring Width and Carbon Isotope Chronologies Track Temperature, Humidity, and Baseflow in the Tianshan Mountains, Central Asia" Forests 11, no. 12: 1308. https://doi.org/10.3390/f11121308
APA StyleFan, Y., Shang, H., Wu, Y., & Li, Q. (2020). Tree-Ring Width and Carbon Isotope Chronologies Track Temperature, Humidity, and Baseflow in the Tianshan Mountains, Central Asia. Forests, 11(12), 1308. https://doi.org/10.3390/f11121308