Article

The Prediction of Stiffness Reduction Non-Linear Phase in Bamboo Reinforced Concrete Beam Using the Finite Element Method (FEM) and Artificial Neural Networks (ANNs)

Faculty of Engineering, University of Muhammadiyah Jember, Jember 68121, Indonesia
Forests 2020, 11(12), 1313; https://doi.org/10.3390/f11121313
Submission received: 25 October 2020 / Revised: 25 November 2020 / Accepted: 25 November 2020 / Published: 10 December 2020
(This article belongs to the Special Issue Timber and Construction Structure)

Abstract

:
This paper discusses the reduction of the stiffness of bamboo reinforced concrete (BRC) beams to support the use of bamboo as an environmentally friendly building material. Calculation of cross-section stiffness in numerical analysis is very important, especially in the non-linear phase. After the initial crack occurs, the stiffness of the cross-section will decrease with increasing load and crack propagation. The calculation of the stiffness in the cross-section of the concrete beam in the non-linear phase is usually approximated by giving a reduction in stiffness. ACI 318-14 provides an alternative, reducing the stiffness of the plastic post-linear beam section through the moment of inertia (I) of the beam section for elastic analysis between 0.50Ig–0.25Ig. This study aims to predict the value of the reduction in the stiffness of the BRC beam section in the non-linear phase through the load-displacement relationship of experimental results validated by the Finite Element Method (FEM) and the Artificial Neural Networks (ANN) method. The experiment used 8 BRC beams and one steel-reinforced concrete (SRC) beam of singly reinforced with a size of 75 mm × 150 mm × 1100 mm. The beams were tested using a four-point loading method. The analysis results showed that the value of the stiffness reduction in the beam cross-sectional in the non-linear phase ranged from 0.5Ig–0.05Ig for BRC beams, and 0.75Ig–0.40Ig for SRC beams.

1. Introduction

The impact of increasing industrial development is that it can cause pollution of air, water, soil, and noise. The use of industrial building materials such as ceramics, steel, concrete, and other materials has led to an increase in environmental pollution. The procurement of wood forests or bamboo forests must be done as a counterweight to environmental pollution. Pandey et al. (2017) [1] and Mostafa et al. (2020) [2] revealed that an average tree absorbs one ton of CO2 and produces 0.7 tons of O2 for every cubic meter of growth. The use of environmentally friendly building materials such as wood and bamboo must be done. Bamboo is a forest product that provides high economic and ecological value to the community. Bamboo also has enormous potential with promising prospects [3]. Bamboo is one of the commodities produced by Community Forests. However, research on the behavior of bamboo as a building material is mandatory, such as research on the stiffness of bamboo reinforced concrete (BRC) beams.
The stiffness reduction factor is a multiplier to reduce the moment of inertia in gross cross-sectional, and the gross cross-sectional area remains constant. These factors are conservatively enforced by various concrete standards to account for the loss of stiffness in the concrete cross-section due to the cracking of the concrete. The stiffness of the beam cross-section in the elastic phase or linear phase indicates the full section flexural stiffness, EcIg, whereas in the non-linear phase or after the initial crack, the gross cross-section bending stiffness is reduced to the effective flexural stiffness, EcIeff. The stiffness reduction factor is significantly influenced by the amount of moment or the applied load, while the stiffness reduction factor does not differ from the amount of reinforcement [4]. ACI 318M-14 [5] shows that the gross section flexural stiffness, EcIg, is reduced to obtain the effective flexural stiffness, EcIe, which causes cracking and other softening effects. As the moment in the concrete section increases, the flexural stiffness will be reduced due to the cracks that continue to propagate and spread. ACI 318M-14 [5] provides stiffness reduction limits for elastic analysis with a moment of inertia limits between 0.25Ig–0.5Ig for concrete beams. The equation for the moment of inertia effective (Ie) is determined in ACI 318-05 [5] Section 9.5.2.3, as shown in Equation (1).
I e = ( M c r M a ) 3 I g + [ 1 ( M c r M a ) 3 ] I c r
where Ig = moment of inertia of the gross concrete section and Icr = moment of inertia of the crack section including the reinforcement. The moment of inertial effective (Ie) as shown in Equation (1) will decrease as the moment that occurs, Ma. Calculation of the moment of inertia of the crack cross-section, Icr at Equation (1) must pay attention to the number of reinforcement installed. However, the amount of reinforcement is not determined at the initial design stage.
The process of stiffness reduction in the beam section starts from the “no crack” and “cracked” conditions in the section. In the service load condition or the elastic condition, the stiffness of the beam section is in full condition, even though the moment due to the load continues to increase. In the elastic condition, the moment that occurs (Ma) is still below the moment of cracking (Mcr), or the tensile stress of the concrete is still below the modulus of rupture of the concrete beam cross-section, fr. In the elastic conditions, the difference in stiffness between two different types of beams usually occurs not due to reduced inertia of the cross-section, but due to the properties of the materials used. For example, the stiffness of bamboo reinforced concrete beams is different from the stiffness of steel-reinforced concrete (SRC) beams. In the elastic conditions, the stiffness of BRC beams is lower than the stiffness of SRC beams [6,7,8]. This is because BRC beams use bamboo reinforcing materials which have elastic properties and high resilience properties. BRC beams with bamboo reinforcement will be able to accept high impact loads without causing stress over the elastic limit, even though displacement has occurred. This indicates that the energy absorbed during loading is stored and released if the material is not loaded.
Meanwhile, the SRC beam uses steel material that has high stiffness and toughness, so that the SRC beam in the service load range or elastic condition does not experience displacement or excessive deformation. Beams that use materials with high stiffness and toughness will be able to withstand high impact loads or shock loads. If the SRC beam gets an impact load, then some of the energy is absorbed and some of the energy is transferred.
Research on modeling and stiffness reduction has been carried out by many researchers. Kai Zhang et al. (2020) [9] investigated the effect of electrochemical rehabilitation (ER) techniques on the fatigue stiffness of RC beams. The results of his research indicated that electrochemical rehabilitation (ER) exacerbated bond breakage, thereby reducing the flexural stiffness of RC beams. Salam Al-Sabah et al. [10] discuss the use of negative stiffness in the failure analysis of concrete beams. In his research, Salman Al-Sabah et al. concluded that the effective and simple one-dimensional stress-strain behavior of concrete was used to study concrete blocks with proportional loading, the only source of non-linearity to consider cracks in concrete. Hong-Song Hu et al. (2016) [11] investigated the effectiveness of square Concrete filled steel tubular (CFST) rod stiffness, and the results proposed an equation for the effective stiffness of square CFST rods. Muhtar et al. [7] tested the flexural of BRC beams and SRC beams, the results showed that the stiffness decreased after the initial cracking. The average stiffness of the BRC beam decreased from 26,324.76 MPa before cracking to 6581.20 MPa after collapse [7], while the average value of SRC beam stiffness decreased from 30,334.11 MPa before cracking to 16,873.35 MPa after the collapse.
K.A. Patela et al. (2014) [12], in their paper, provide an explicit expression for the effective moment of inertia by considering cracks for reinforced concrete beams (RC) with uniformly distributed loads. The proposed explicit expressions can be used to predict short-run displacement in-service load. The sensitivity analysis shows a substantial dependence of the effective moment of inertia on the selected input parameter. Displacement is an important parameter for examining the serviceability criteria of structures. The short-term displacement is generally calculated using the effective moment of inertia across the span at the service load [12]. Chunyu Fu (2018) [13] presents a method of estimating the stiffness of cracked beams based on the stress distribution. In his conclusion, he said that the presence of cracks causes a nonlinear stress distribution along the beam section, which changes the neutral axis of the cross-section and further affects the stiffness of the beam. J.R. Pique (2008) [14] concluded that when the design is controlled by the minimum reinforcement, especially in the beam, special attention should be paid to the calculation of the real period and maximum distortion. The effective stiffness of the beam with the minimum steel ratio is much lower than that obtained by the proposed reduction factor. As a result, the actual period and actual maximum distortion can be greater. Akmaluddin et al. (2012) [15] concluded that the moment of crack and the value of the moment of inertia of the crack was significantly affected by the presence of bamboo reinforcement in the beam. The experimental results show that the crack moment varies from 0.3 to 0.7 from the ultimate moment. The experimental and theoretical crack moment ratio varies from 0.90 to 1.42. İlker Kalkan (2013) and [16] concluded that the effective moment of inertia and load-displacement curve analysis is highly dependent on the crack moment used in the expression analysis of the effective moment of inertia. Therefore, the experimental cracking moment of the beam should be used in the calculation of the effective moment of inertia for a more accurate comparison of the different analytical methods. Chunyu Fu et al. (2020) [17] concluded that cracking of concrete causes a gradual change in the distribution of strain along with the cross-sectional height of reinforced concrete beams, which in turn affects the instantaneous stiffness. The instantaneous stiffness proved to be highly dependent on the number and depth of cracks. This dependence can be accurately reflected by the method proposed by simulating a gradual change in the concrete strain distribution. Xiuling Feng et al. (2013) [18] examines the reduction factor of flexural stiffness in reinforced concrete columns with an equiaxial cross-section and suggests that the reduction factor is proposed by considering the nonlinear characteristics of the material and its geometric nonlinearity.
The difference in the nonlinear characteristics of the material used in the BRC beam and the SRC beam greatly determines the flexural behavior of the beam. Bamboo reinforced concrete beams have low stiffness and tend to be large displacement. The solution to increasing the stiffness of BRC beams is to use shear reinforcement and the principle of confined concrete [7,19]. In the linear elastic condition, the BRC beam has shown a large displacement, but when the ultimate load is reached and the loading is released gradually, the displacement tends to return to zero. In this study, the reduction of stiffness in the non-linear phase was analyzed through the load vs. displacements that were validated using the finite element method (FEM) and the Artificial Neural Networks (ANN) method. It is suspected that the reduction of the cross-sectional stiffness of the BRC beam is different from the reduction in the stiffness of the SRC beam section. The parameter of the moment of inertia of the cross-section becomes a benchmark in determining the reduction of stiffness according to ACI-318M-14 [5].

2. Materials and Methods

2.1. Treatment of Materials

In this study, the treatment of bamboo material as concrete reinforcement is an important thing to do. The bamboo used is the bamboo “petung” (Dendrocalamus asper) which is between three and five years old [20,21,22]. The part of bamboo that is used as reinforcing of concrete is 6–7 m long from the base of the bamboo stem [23]. Bamboo is cut according to the size of the bamboo reinforcement to be used, which is 15 × 15 mm2. Then, bamboo is soaked for ±20–30 days [21]. After soaking, bamboo is dried in free air until it has an absorption level of ±12%.
Application of adhesive or waterproof coating [24,25] is done after the bamboo reinforcement is cleaned and trimmed according to the planned size. The application of a waterproof layer is carried out to prevent the hydrolysis process between bamboo and concrete. Sand sprinkling on bamboo reinforcement is done when the adhesive is half dry to make it stronger [21,26]. The application of sand aims to increase the adhesion strength of bamboo reinforcement to concrete.
An installation of a hose-clamp at both ends of the bamboo reinforcement is done to match the concept of hooks or bends in steel reinforcement. An installation of the hose-clamp only on tensile reinforcement is done to increase bond-stress between bamboo reinforcement and concrete [27,28]. The tensile force on the bamboo reinforcement will be distributed to the concrete through the hose-clamp, which functions as a shear connector. Bamboo treatment is shown in Figure 1.

2.2. Materials

The concrete mixture used in this study is a normal concrete mixture consisting of Portland Pozzolana Cement (PPC), sand, coarse aggregate, and water with a proportion of 1:1.8:2.82:0.52. Sand and gravel come from the Jember area of Indonesia. The cylindrical specimen measures 150 mm in diameter and 300 mm in height. The cylindrical specimens were press-tested using a Universal Testing Machine (UTM) with a capacity of 2000 kN after the concrete was 28 days old. The procedure for the cylinder specimen compressive test follows ASTM C 39 [29]. The average compressive strength of cylindrical concrete is 31.31 MPa with an average weight of 125.21 N. The properties and characteristics of the concrete are shown in Table 1.
The tensile test of bamboo reinforcement produces the average tensile stress of 126.68 N/mm2 with an average strain of 0.0074. The modulus of elasticity of bamboo reinforcement was calculated using the formula E = σ/ε and obtained 17,235.74 MPa. The modulus of elasticity of steel is obtained by 207,735.92 MPa. The properties and characteristics of bamboo and steel reinforcement are shown in Table 1.
The adhesive layer or waterproof coating used was Sikadur®-752 produced by PT. SIKA Indonesia [30]. The specifications for the adhesive sikadur®-752 are shown in Table 2. Installation of hose-clamp on bamboo reinforcement is done when the waterproof layer is half dry [21]. The diameter of the hose-clamp used is ¾” made in Taiwan.

2.3. Experimental Procedure

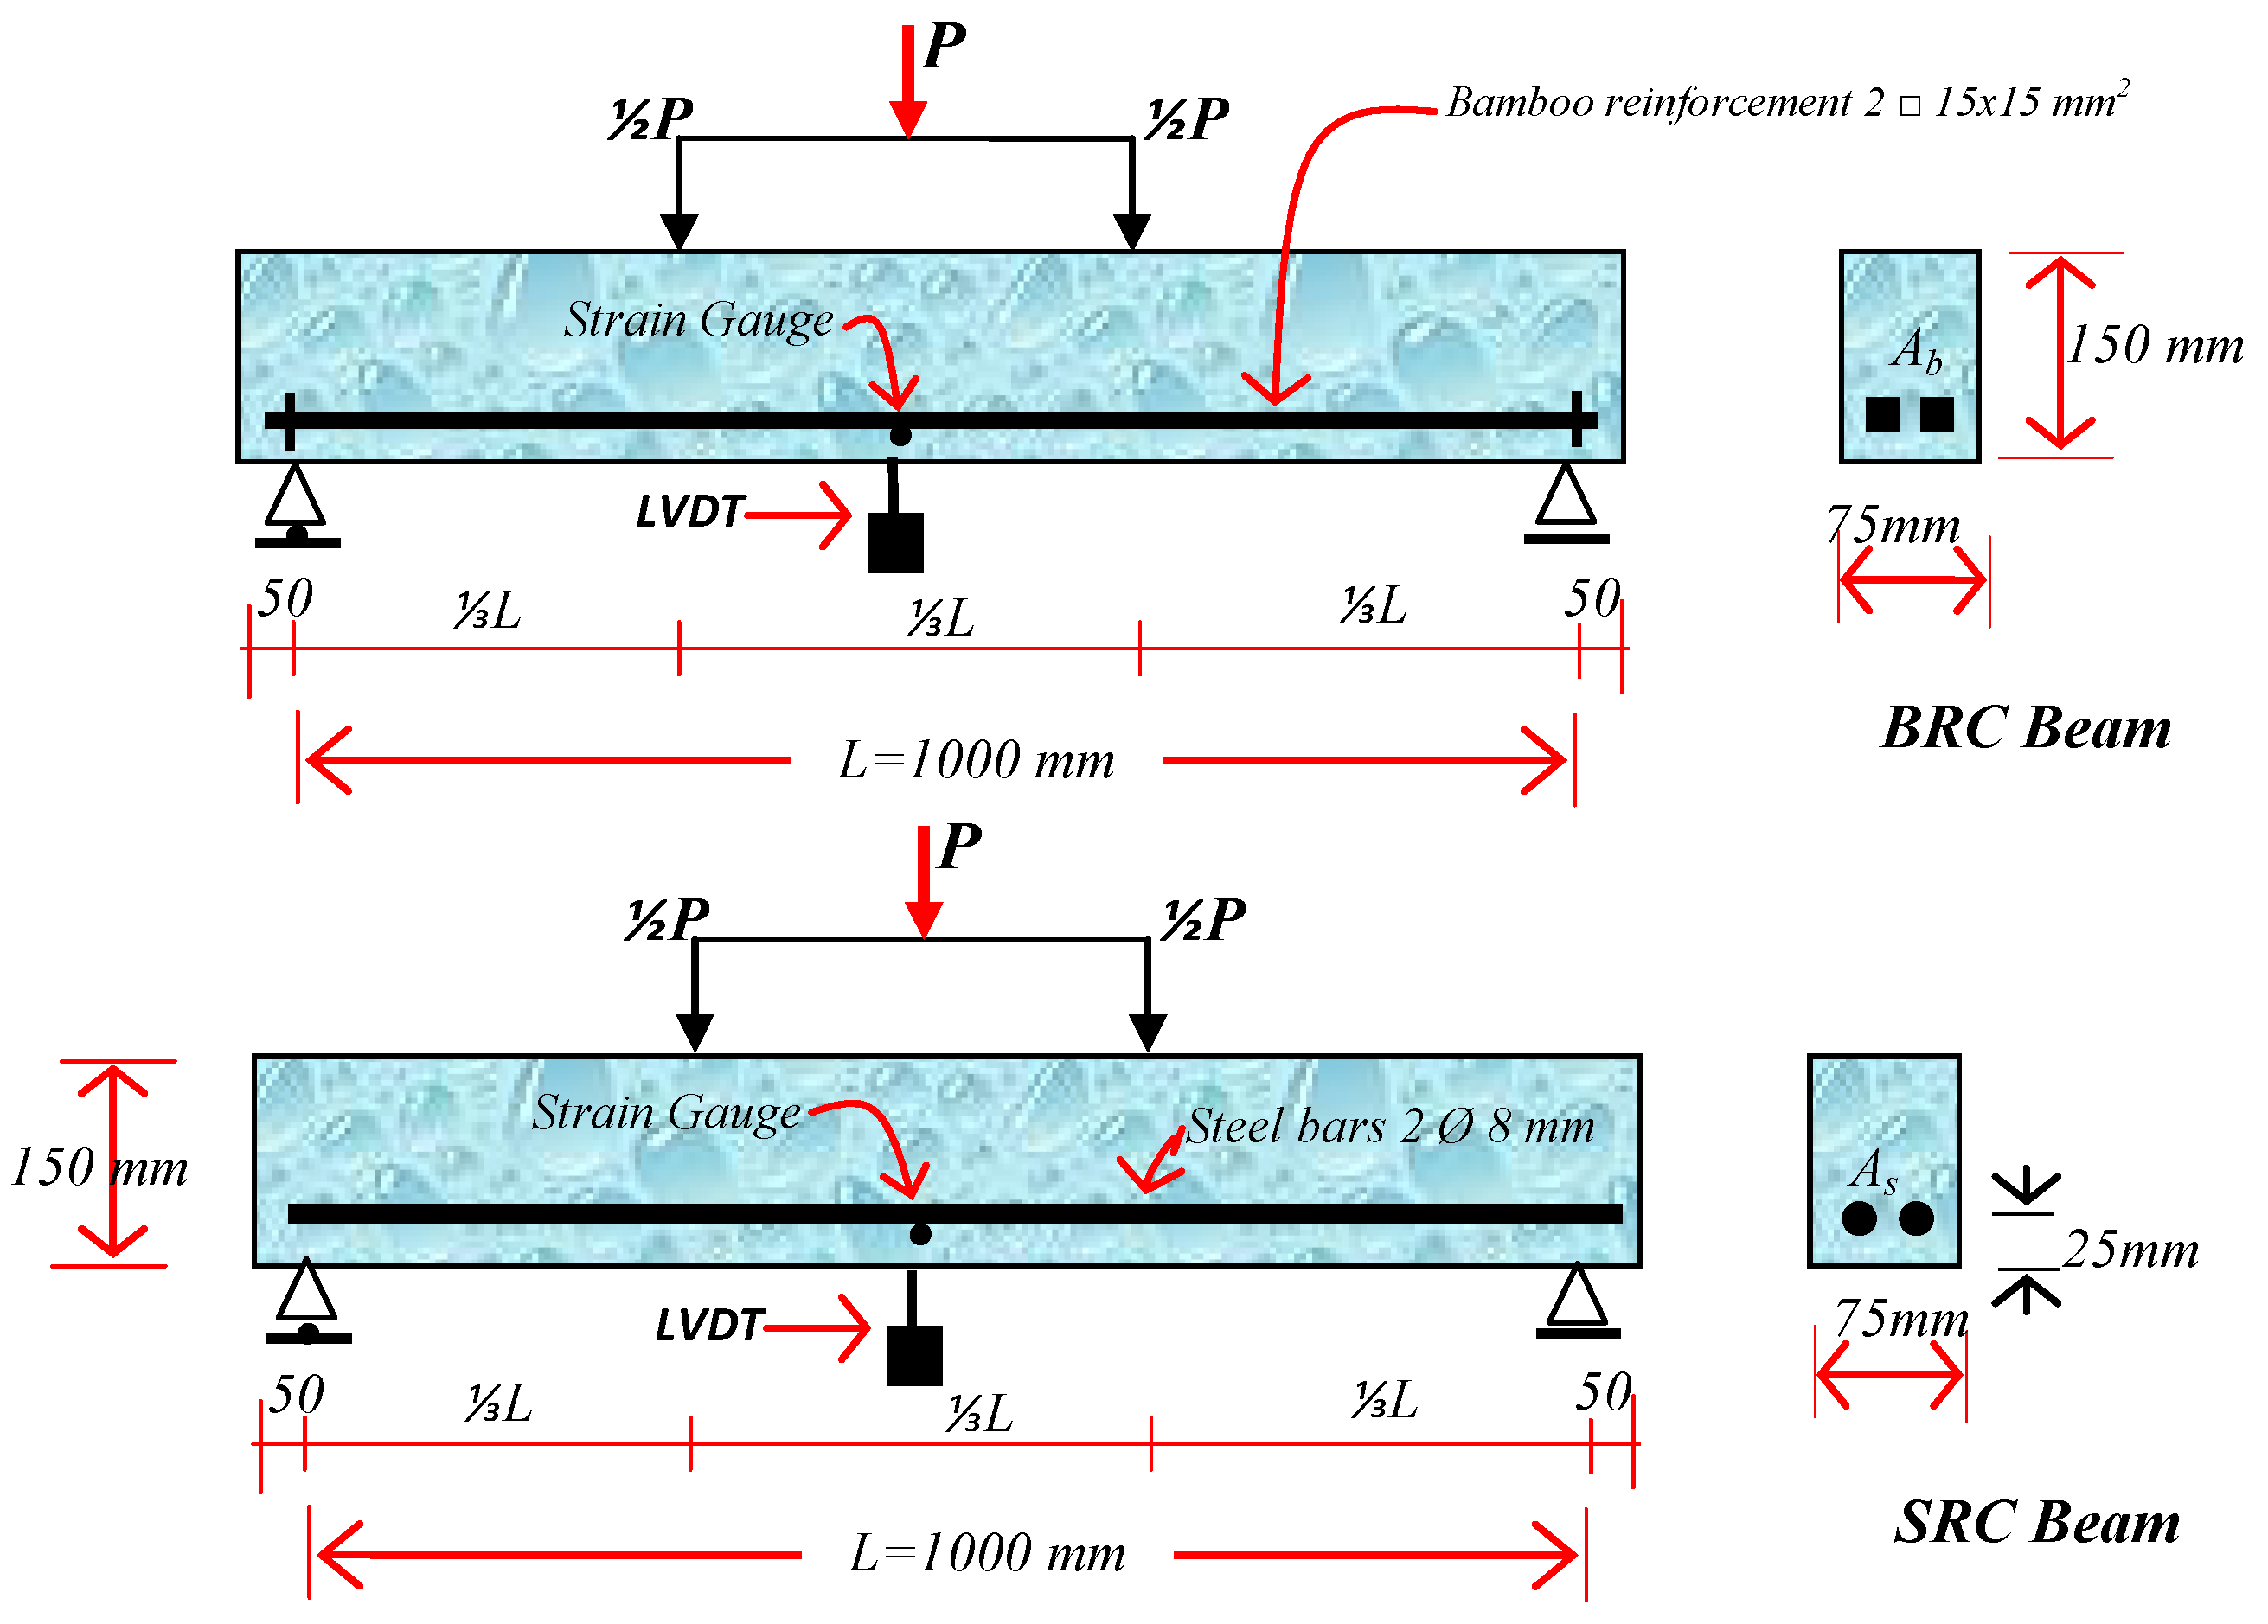
The test object consisted of 9 beams with a size of 75 mm × 150 mm × 1100 mm, consisting of 8 bamboo reinforced concrete beams (BRC) and one steel-reinforced concrete beam (SRC). Bamboo reinforcement is installed as tensile reinforcement with a reinforcement area of 450 mm2. The steel reinforcement used has a diameter of 8 mm with an area of As = 100.48 mm2. The beam geometry and reinforcement detail of the BRC and SRC beams are shown in Figure 2.
The beam flexural test method was carried out using the four-point method [31]. The test arrangement and load position are shown in Figure 2. Strain gauges are installed on the bamboo reinforcement at a distance of ½L from the support of the beam. Beam displacement measures use Linear Variable Displacement Transducers (LVDT) with a distance of ½L from the beam support.
The loading stages from zero to the collapse of the beam are used as a hydraulic jack and a load cell connected to a load indicator tool. The load reading on the load indicator is used as a hydraulic jack pump controller, displacement reading, and strain reading according to the planned loading stage. However, when the test object reaches its ultimate load, the displacement reading controls the strain and load reading, while the pumping of the hydraulic jack continues slowly according to the command of the displacement reader. The failure pattern was observed and identified by the cracks that occurred, from the time of the initial crack until the beam collapsed.

2.4. Validation of Numerical Methods

Validation of experimental data using the Finite Element Method (FEM) and Artificial Neural Networks (ANN). The relationship between load vs. displacement experiment results was validated by using the finite element method. The procedure used is inputting material data and loading stages to determine the behavior of the load vs. displacement of BRC beams and SRC beams. The data input for the loading stages is carried out following the loading stages from laboratory experimental data. The numerical method used is the finite element method, using the Fortran PowerStation 4.0 program [32]. The theoretical analysis is used to calculate the load causing the initial crack is the elastic theory (linear analysis) with cross-section transformation. For linear analysis, the input material data is the modulus of elasticity (E) and Poisson’s ratio (υ). The calculation of the modulus of elasticity of the composites (Ecomp) is shown in Table 3 and Table 4. The non-linear phase is approximated by decreasing the concrete strength from 0.25 to 0.5 for the calculation of the effective stiffness in the plastic plane [5]. In the analysis of the finite element constitutive relationship, the problem-solving method uses the plane-stress theory. Triangular elements are used to model plane-stress elements with a bidirectional primary displacement at each point so that the element has six degrees of freedom. The discretization of the beam plane is carried out using the triangular elements shown in Figure 3 for BRC beams and Figure 4 for SRC beams.
The modulus of elasticity (E) for each layer is calculated according to the condition of the material. Layers of concrete and bamboo reinforcement are calculated using the following Equation (2) [33].
E e = E b · V b + E c · V c
where Ee = the equivalent elasticity modulus of BRC beam, Eb = elastic modulus of bamboo reinforcement, Ec = modulus of elasticity of concrete, Vb = relative volume of bamboo reinforcement in calculated layers, and Vc = relative volume of concrete in calculated layers. The stress-strain relationship for plane-stress problems has the shape of an equation such as Equation (3).
{ σ x σ y τ x y } = E ( 1 + ν 2 ) [ 1 ν 0 ν 1 0 0 0 1 ν 2 ] { ε x ε y γ x y }
where E is the modulus of elasticity and ν is the Poisson’s ratio. And the principal stresses in two dimensions are calculated by Equation (4).
σ 1 , 2 = σ x + σ y 2 ± ( σ x σ y 2 ) 2 + τ x y 2 = σ max
The simulation and steps for preparing a FEM analysis with the Fortran PowerStation 4.0 program [32] are summarized as follows:
Step 1: 
Discretization of BRC and SRC beam planes with the discretization of triangular elements, the numbering of triangular elements, and the numbering of nodal points as shown in Figure 3 and Figure 4.
Step 2: 
Calculation and collection of geometry and material data, such as the modulus of elasticity of the material (E), Poisson’s ratio (ν), etc.
Step 3: 
Writing a programming language for triangular elements using the Fortran PowerStation 4.0 program according to the constitutive relationships and FEM modeling as shown in the following link: http://bit.ly/2F17w8F.
Step 4: 
Open the Fortran PowerStation 4.0 program. An example is shown at the following link: http://bit.ly/2MTh22j.
Step 5: 
Write programming language data (Step 3) in the Fortran PowerStation 4.0 program. Examples can be seen at the following link: http://bit.ly/2ZvZWMU.
Step 6: 
Input DATA.DAT of BRC beam and SRC beam in the Fortran PowerStation 4.0 program. Input data is displayed at the following links: http://bit.ly/351FPqU and http://bit.ly/2MBqas9. An example of displaying input data is shown on the following link: http://bit.ly/2u2K2xR.
Step 7: 
Analyze the program until there are no warnings and errors. If there are warnings and errors, check and correct program data and input data.
Step 8: 
Download stress data. The stress data are shown at the following link: http://bit.ly/2rDPeaI for the stress of BRC beam, and http://bit.ly/2Q4Ihc1 for the stress of the SRC beam. An example of displaying stress data from the Fortran PowerStation 4.0 program is shown at the following link: http://bit.ly/2ZybLCd.
Step 9: 
Download displacement data. An example of displaying data displacement from the Fortran PowerStation 4.0 program is shown on the following link: http://bit.ly/2Q7j2Wp.
Step 10: 
Enter stress and displacement data into the Surfer program to obtain contour image data of stress and displacement. Stress and displacement contour image data.

2.5. Validation of Artificial Neural Networks (ANN)

Artificial Neural Networks (ANN) is a computational system for solving complex problems in civil engineering. In this study, the validation carried out by the Artificial Neural Networks (ANN) method is the validation of the load vs. displacements from laboratory experimental results. The data on the loading and displacement stages of the experimental results were used as input data and target data in this analysis. Previous researchers concluded that Artificial Neural Networks (ANN) can be an alternative in calculating displacement in reinforced concrete beams. Several researchers have used the ANN method for many structural engineering studies, such as predicting the compressive strength of concrete [34], axial strength of composite columns [35], and determination of RC building displacement [36]. Kaczmarek and Szymańska (2016) [37] concluded that the results of calculating displacement in reinforced concrete using ANN proved to be very effective. Abd et al. (2015) [38] concluded that the ANN method is also very good for predicting displacement in concrete beams with a very strong correlation level of 97.27% to the test data. Tuan Ya et al. (2019) [39] used the ANN method to predict displacement in cantilever beams and concluded that the output was very accurate.
The ANN method is currently very popular with researchers in predicting and evaluating the behavior of structures in the field of civil engineering. This is because the ANN method has an advantage in the nonlinear correlation between the input variables presented. Khademi et al. (2017) [40] predicts the compressive strength of concrete at 28 days of age by considering the experimental results, three different models of multiple linear regression (MLR), artificial neural networks (ANN), and adaptive neuro-fuzzy inference system (ANFIS). The results of his research concluded that the ANN and ANFIS models can predict the 28-day concrete compressive strength more accurately and the ANN model can perform better than the ANFIS model in terms of R2. The ANN and ANFIS models are preferred because the nonlinear correlation between the input variables presented is better. The ANN and ANFIS models have higher accuracy requirements than the multiple linear regression (MLR) model. The accuracy of the prediction is very much dependent on the number of input variables. The greater the number of input parameters, the more accurate the results of the predictor model will be.
Xuan Li et al. (2019) [41] predict the service life of corroded concrete sewer pipes using three data-driven models, namely multiple linear regression (MLR), artificial neural networks (ANN), and adaptive neuro-fuzzy inference system (ANFIS). The one conclusion suggests that the ANN and ANFIS models perform better than the MLR models for corrosion prediction, with or without considering the interactions between environmental factors.
The ANN data is divided into three different subsets [40], namely (1) Training: at this stage, the subset is trained and studied as occurs in the human brain, where the number of epochs is repeated until an acceptable model accuracy is obtained; (2) Validation: at this stage, the subset shows how well the model is trained, and estimates model properties such as misclassification, mean error for numerical predictors; and (3) Test: at this stage, the subset verifies the performance of the training subset built into the ANN model.
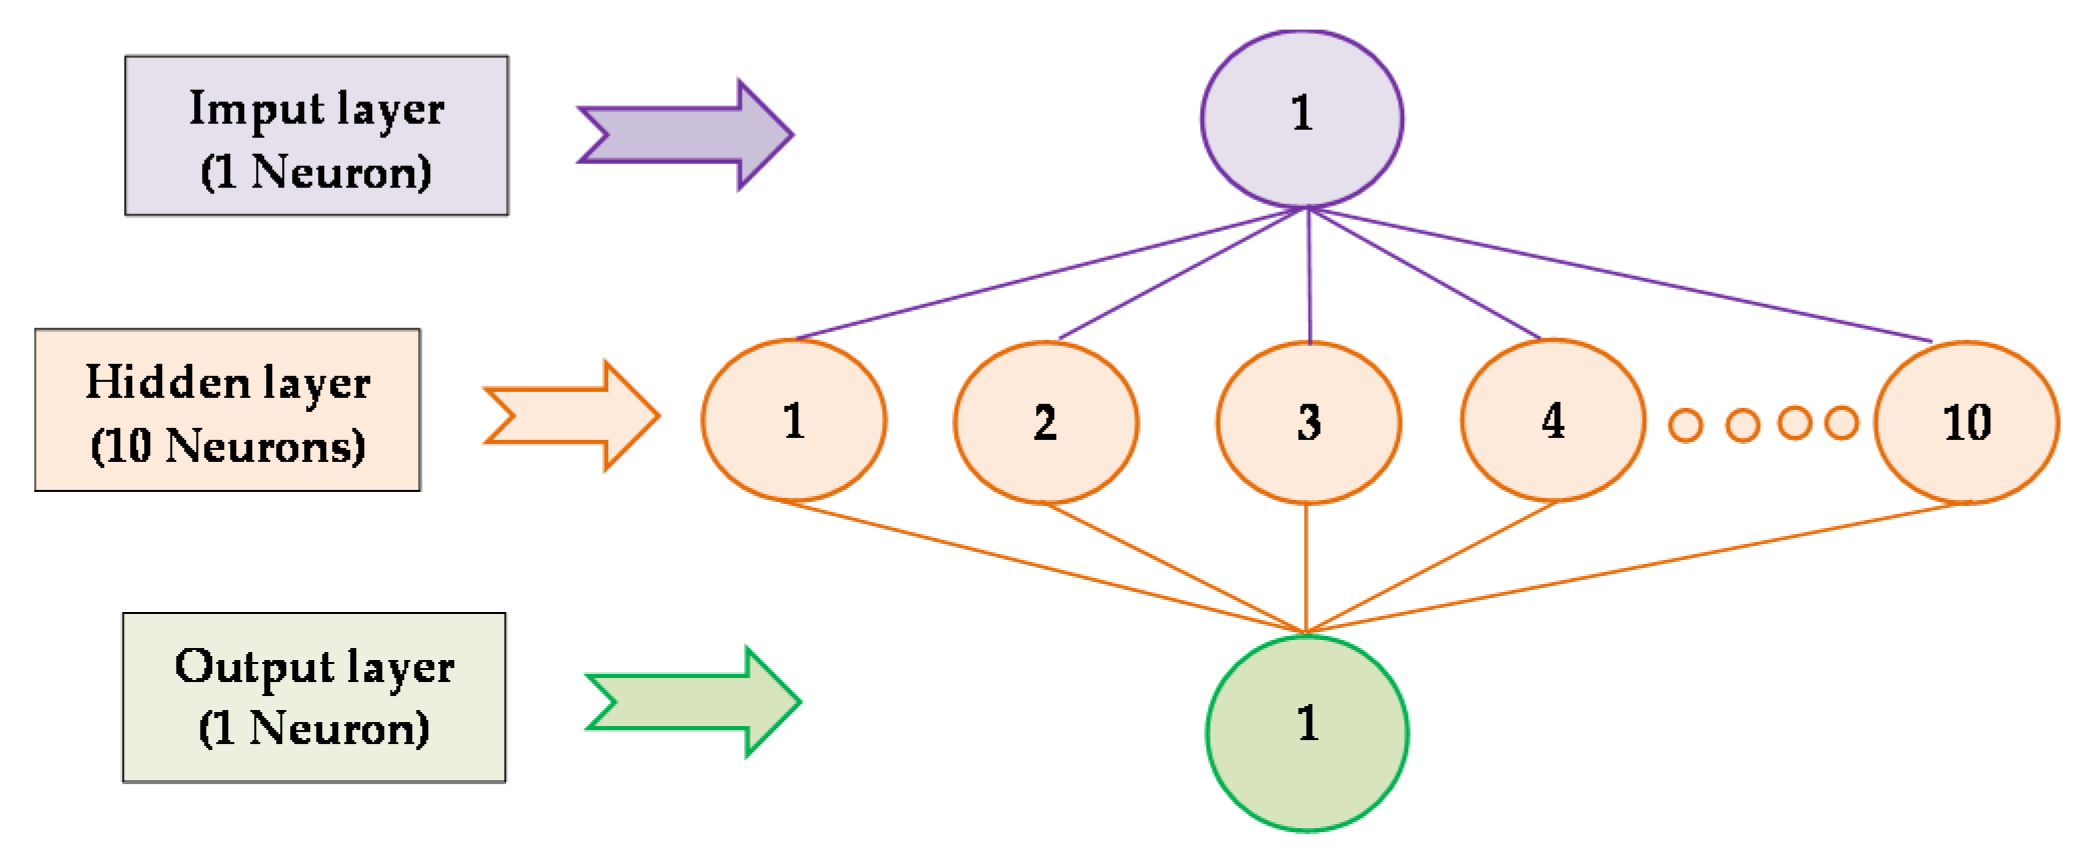
This paper uses even load input data, while the target data is the displacement of the laboratory test results. The distribution of the ANN model data composition consists of training 70%, validation 15%, and testing 15%. ANN architecture on a rectangular beam is shown in Figure 5. The process of implementing input data in the ANN model architecture consists of (1) Input layer, consisting of 1 neuron, namely displacement data variable of experimental results; (2) Hidden layer, consisting of 10 neurons. At this stage, the input layer will forward the data to the hidden layer or the output layer through a set of weights. This weight is a link from each neuron to other neurons in the next layer which will help adjust the ANN structure to the given displacement data pattern using learning. In the learning process, the weights will be updated continuously until one of the numbers of iterations, errors, and processing time has been reached. This is done to adjust the ANN structure to the desired pattern based on certain problems that will be solved using ANN. Weight is known as the independent parameter. During the training process, the weights will be modified to improve the accuracy of the results. The third layer is (3) Output layer, consisting of 1 neuron which is the expected output target, error, and weight. Error is the error rate of the displacement data node of the process carried out, while weight is the weight of the displacement data node with a value ranging between −1 and 1. Then the displacement data resulting from the training process is processed into a graphic image of the load vs. displacement relationship.

3. Results

3.1. Experimental

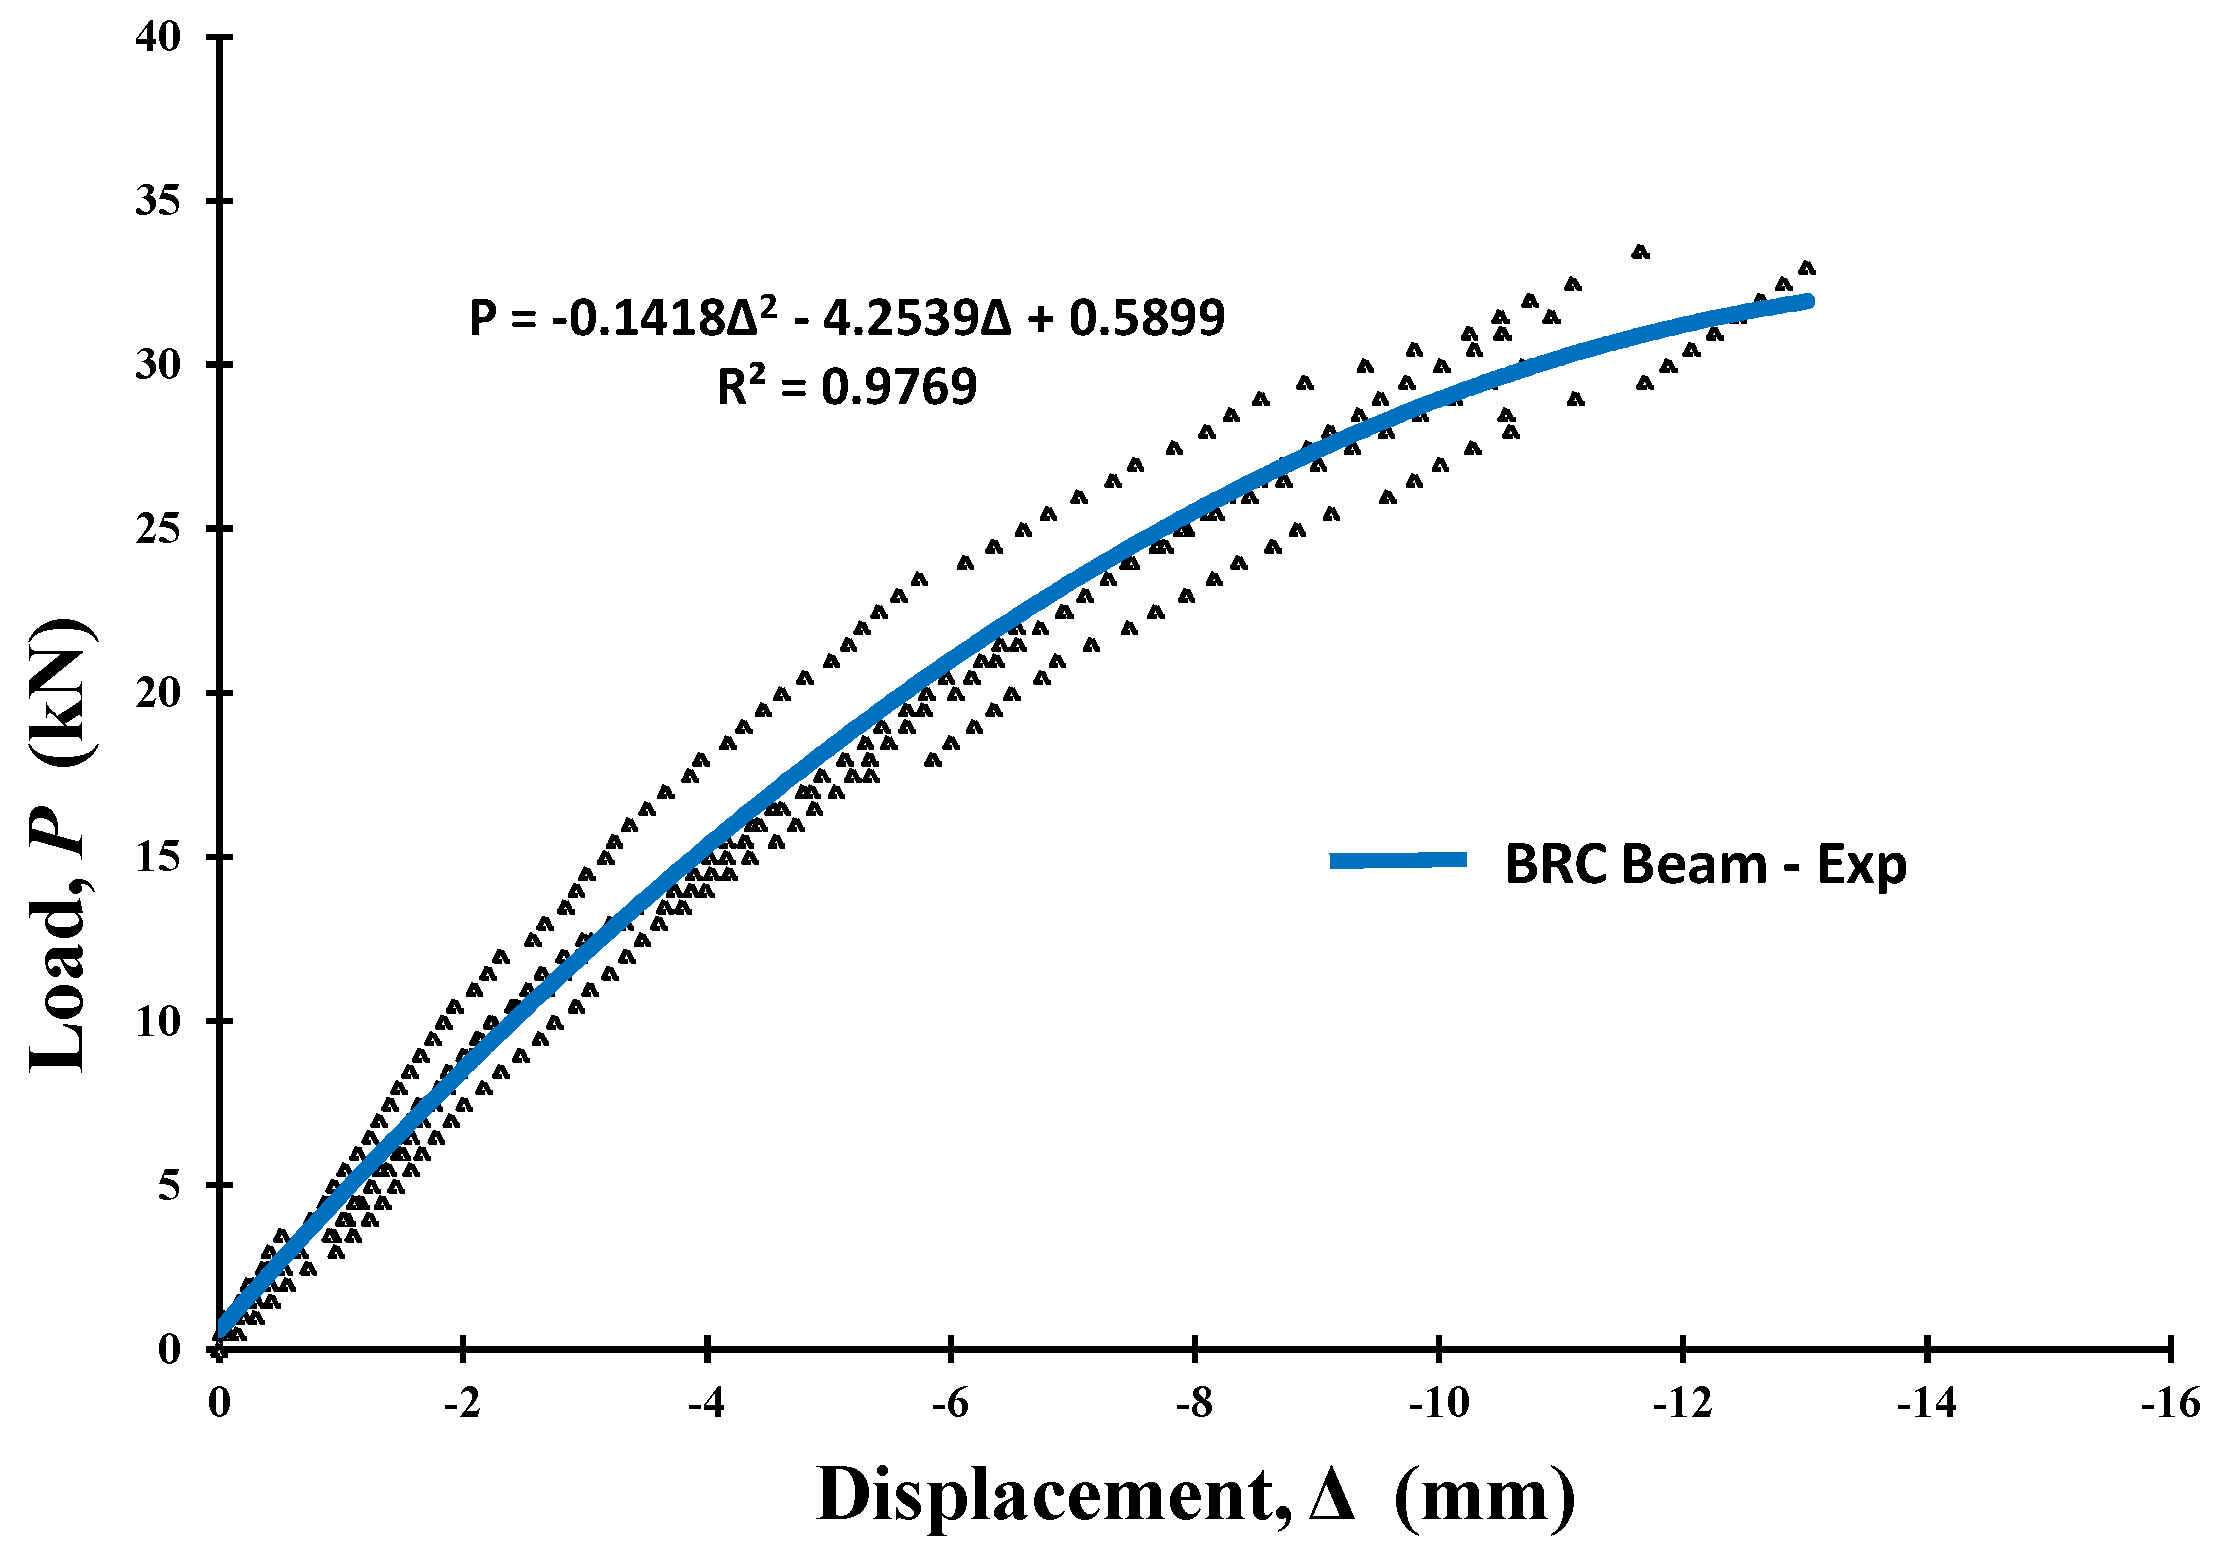
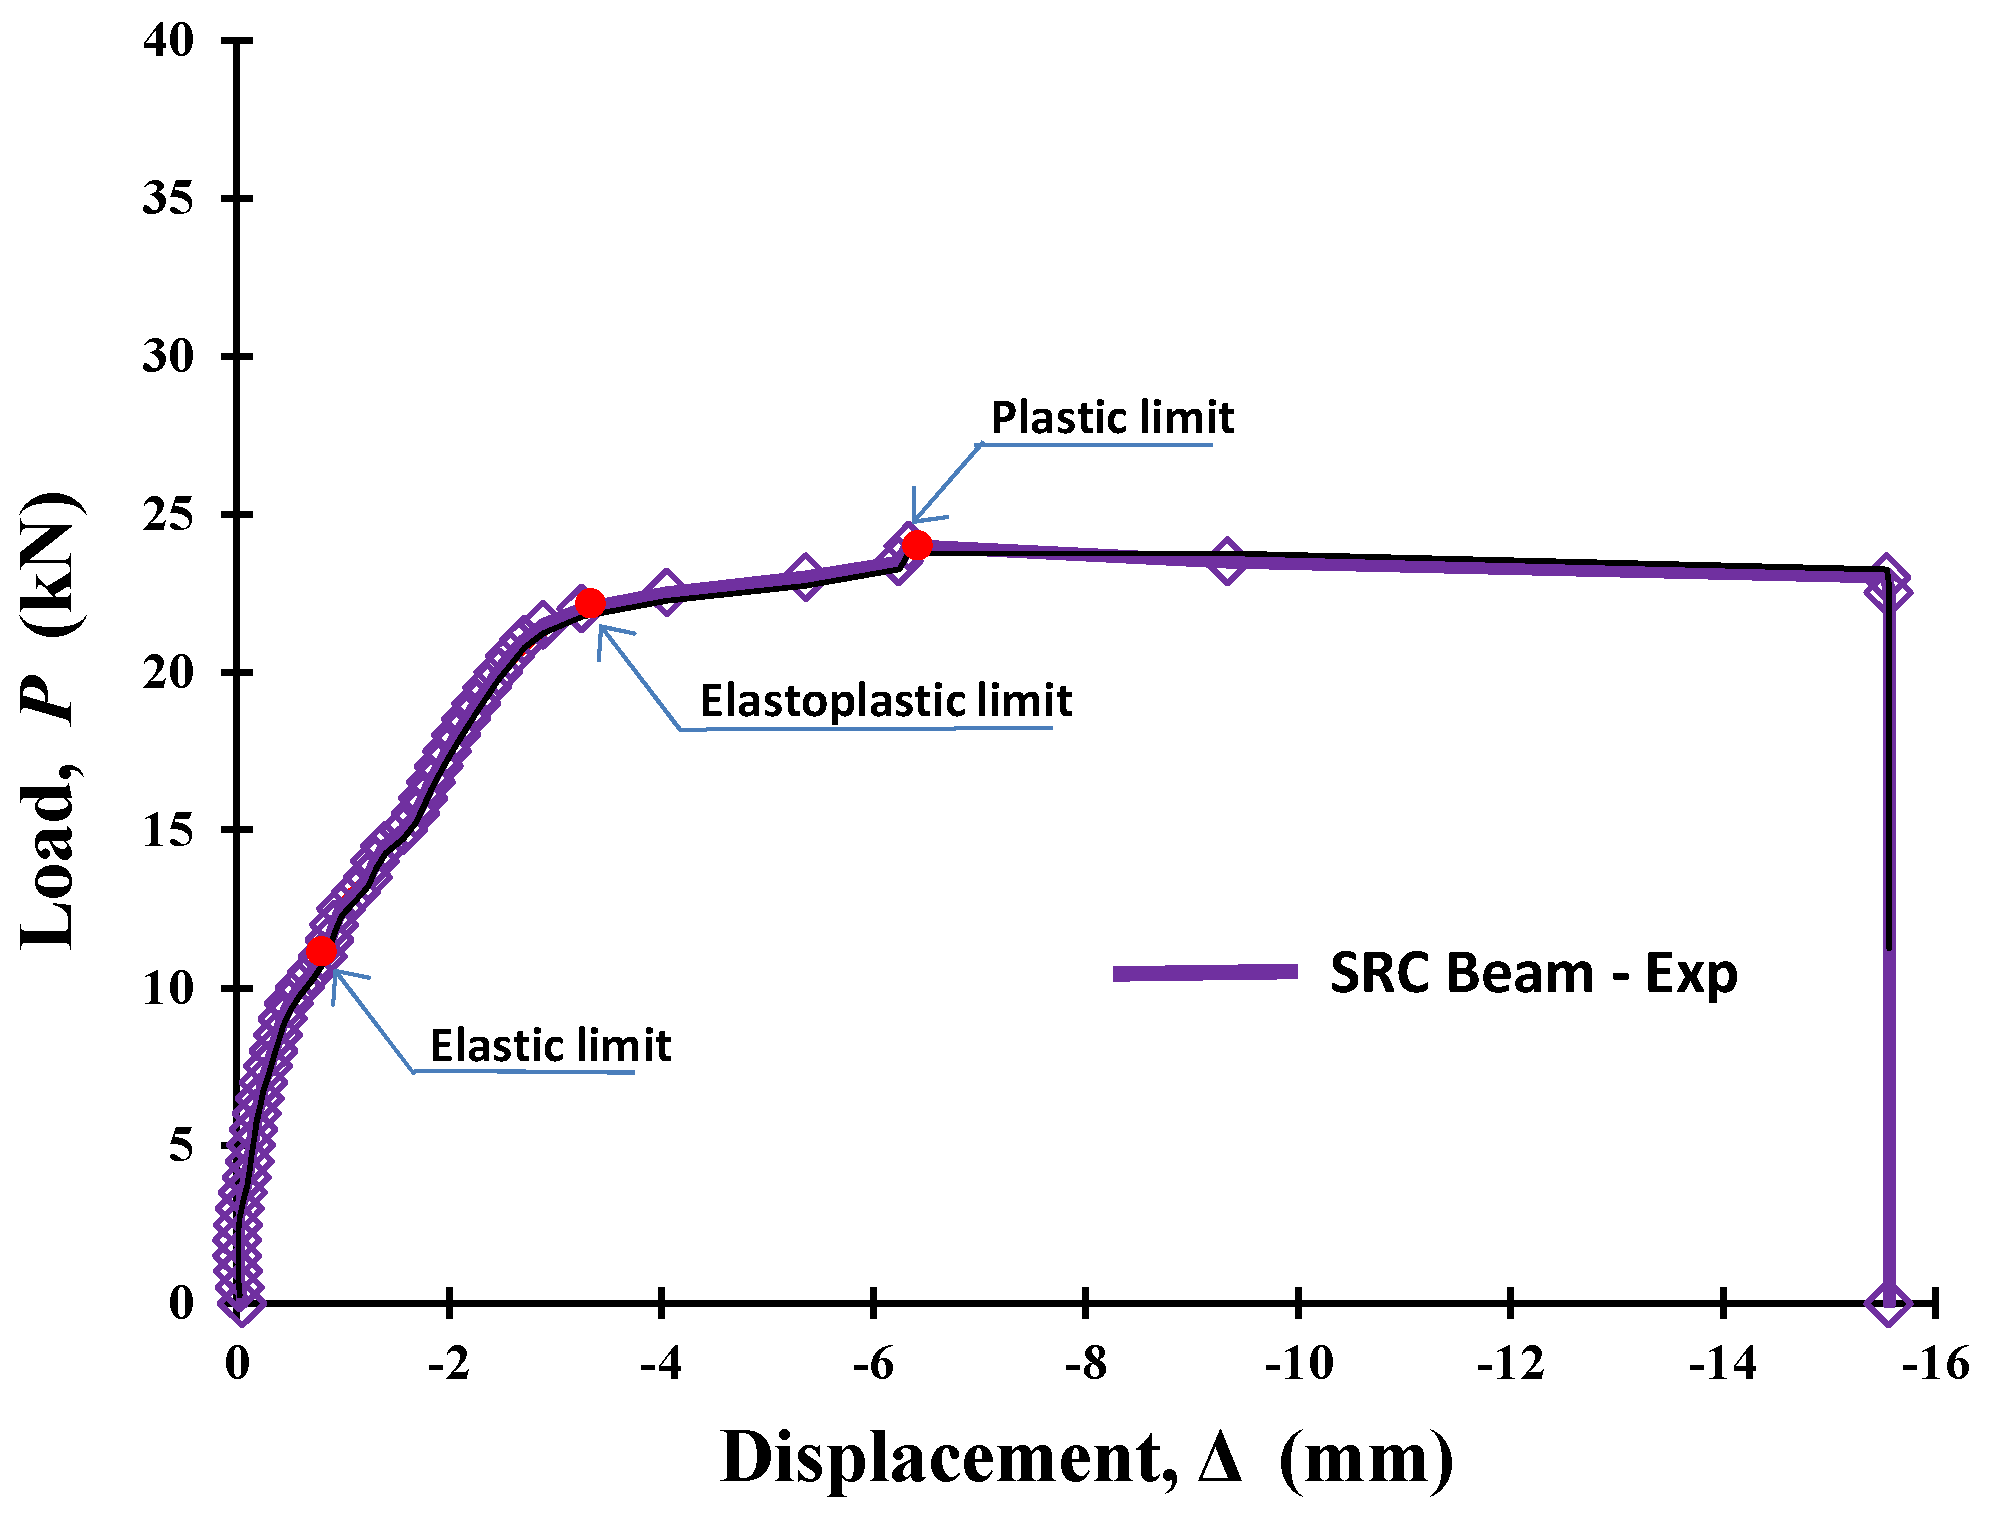
Table 5 shows the results of theoretical calculations and experiments for BRC and SRC beams. From the theoretical calculation, the BRC beam has an initial crack load of 6.87 kN and an SRC beam of 6.51 kN. The laboratory test results of the BRC beam experienced an initial crack at a load of 7.69 kN and an SRC beam had an initial crack at a load of 10 kN. The average ultimate load of the BRC beam occurs at a load of 31.31 kN or 97.27% of the theoretical collapse load of 32.19 kN. This shows that with the correct treatment of bamboo reinforcement, the BRC beam can reach load capacity according to the results of the theoretical calculations. As is known, the researchers concluded that the ultimate load of BRC beams is very low when compared to the theoretical calculations. Dewi et al. (2017) [42] concluded that the bending capacity of bamboo reinforced concrete beams only reaches 56% of its capacity if the tensile strength of bamboo is full. Nathan (2014) [43] concluded that the flexural capacity of reinforced concrete beams only reaches 29% to 39% of the beam capacity steel-reinforced concrete with the same width and reinforcement dimensions. Khare (2005) [44] concluded that the flexural capacity of reinforced concrete beams is only 35% of steel-reinforced concrete beams at the same strength level.
SRC beams reach a collapse load of 24 kN or almost approaching the theoretical collapse load of 24.12 kN. This shows that the adhesion strength of steel-reinforcement with concrete is higher. Figure 6 and Figure 7 show that the relationship of the load vs. displacement of the BRC beam and the SRC beam is different. The SRC beam shows the regions of the elastic limit, elastoplastic limit, and plastic limit. Meanwhile, the BRC beam only shows the plastic limit point or the ultimate load point. This shows that the behavior of reinforced concrete beams is very much determined by the properties and characteristics of the materials used.
Mechanical properties and characteristics of steel and bamboo materials are the dominant factors in the behavior model of the load and displacement relationship [6]. The difference between the stress and strain relationship patterns of bamboo and steel is in the position of the melting point and the fracture stress. Steel material shows a clear melting point, while bamboo reinforcement does not show a clear melting point. However, after the fracture stress, the relationship pattern of the stress-strain relationship tends to return to zero. This shows that bamboo has good elastic properties [7].

3.2. Validation with the ANN Method

The load vs. displacement relationship data from the experimental results is the basis used for the train and the network. Neural networks are designed by determining their structure experimentally. The data that trains the artificial neural network is the input, and the ability to reproduce the training pattern is tested. Convergence analysis was carried out to determine the optimal number of neurons in the hidden layer of ANN. Excessive neurons reduce the computational performance of ANN, whereas a lack of neurons causes difficulties in characterizing the input-output relationship. As suggested by Caudill and Mishra et al. (2019) [45], the upper limit of the number of neurons in the hidden layer is twice the number of inputs plus 1. After the number of neurons in the hidden layer is reached, the MSE, RMSE, and R2 observations are stopped and no increase is assumed significant. The artificial neural network architecture used in this paper: IHO: 1-10-1 [Input-Hidden-Output] means that this artificial neural network consists of 1 input neuron, one hidden layer with 10 neurons, and 1 output neuron (predictive values of the load vs. displacement relationship).
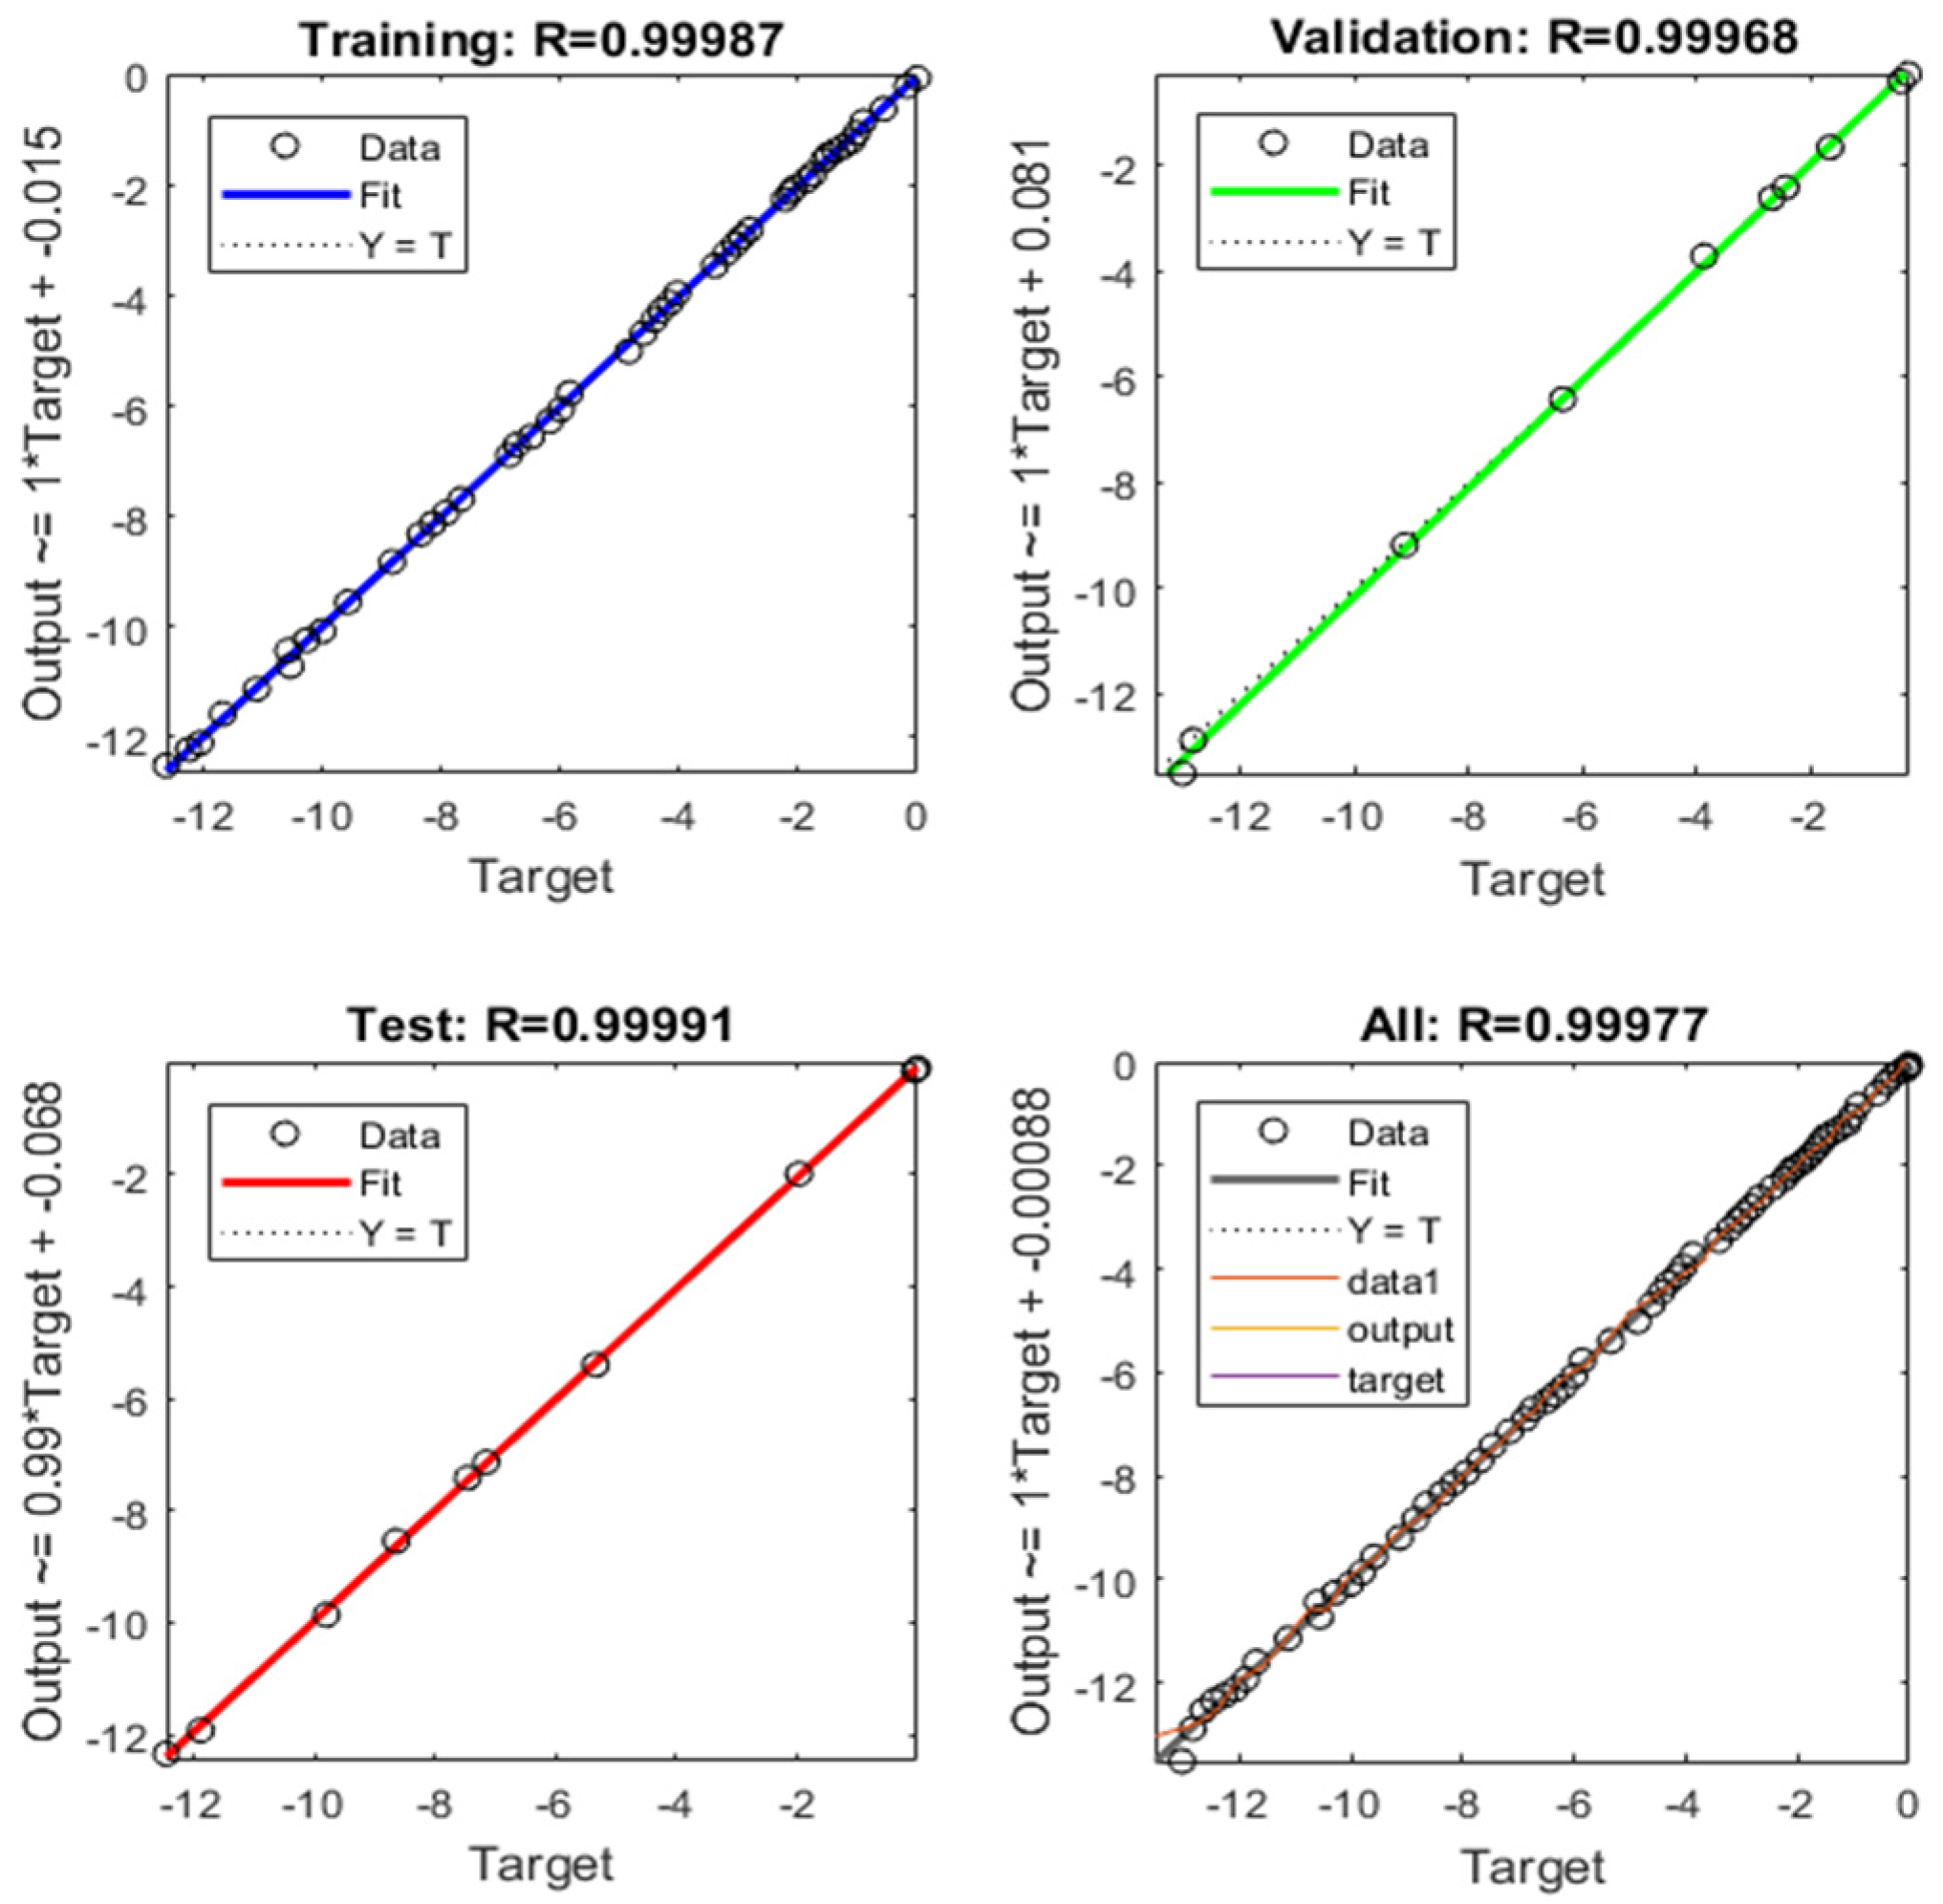
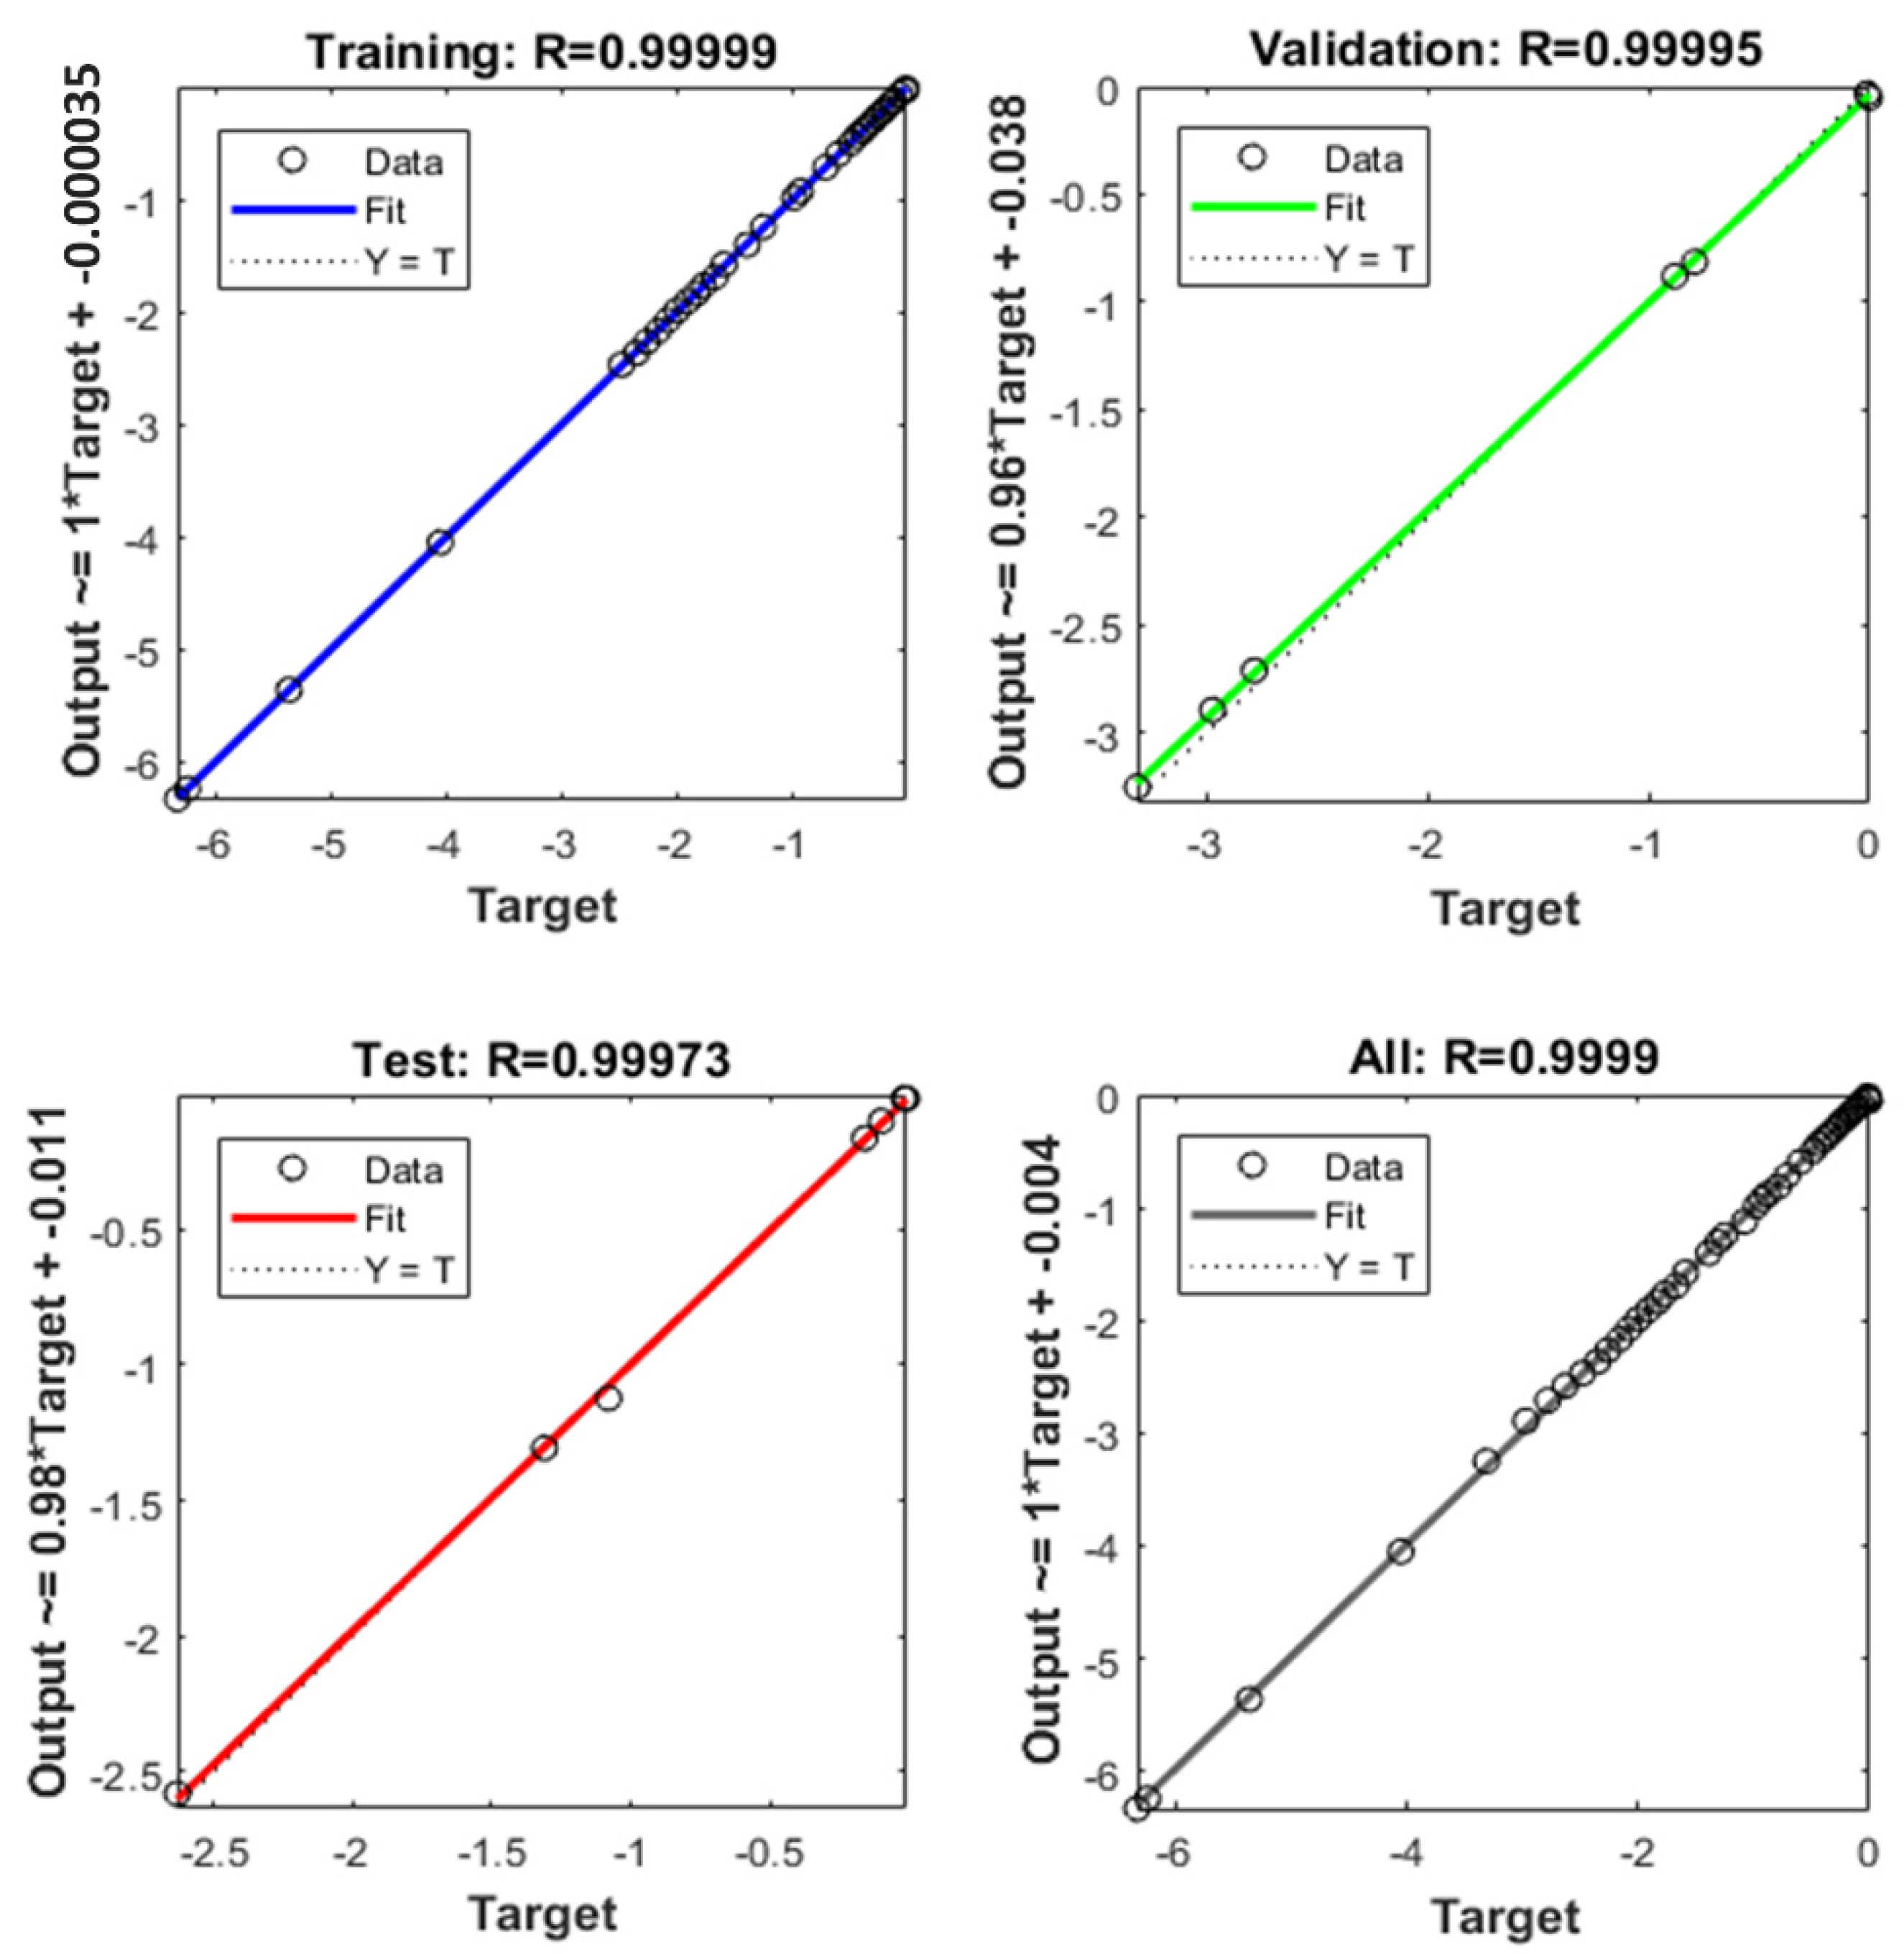
Table 6 presents the performance results of ANN architecture for ten simulations. The process which has the lowest MSE is selected for comparison with experimental data. Figure 8, Figure 9, Figure 10, Figure 11 and Figure 12 illustrate the prediction of the load vs. displacement of the BRC and SRC beams obtained when using the ANN model after training and when using the data obtained experimentally for training data, validation data, test data, and all data. Figure 8, Figure 9, Figure 10, Figure 11 and Figure 12 shows the correlation between the value of the BRC beam and the SRC beam relationship obtained in the laboratory and the load vs. displacement values obtained using ANN analysis. The convergence of the position of the point with the line y = x indicates the identification of values with very high accuracy. The correlation value of laboratory data using ANN shows an average value of R Square of 0.999. This indicates that the two results are consistent. The prediction results of the ANN method show that the percentage of errors is very small, with a maximum error of 0.26%. Overall, the comparison of experimental data with the predicted results of the ANN method shows an error of not more than 1%. From the data from the two analyses and the load vs. displacement relationship pattern, it can be concluded that the stiffness of the BRC beam has similarities.
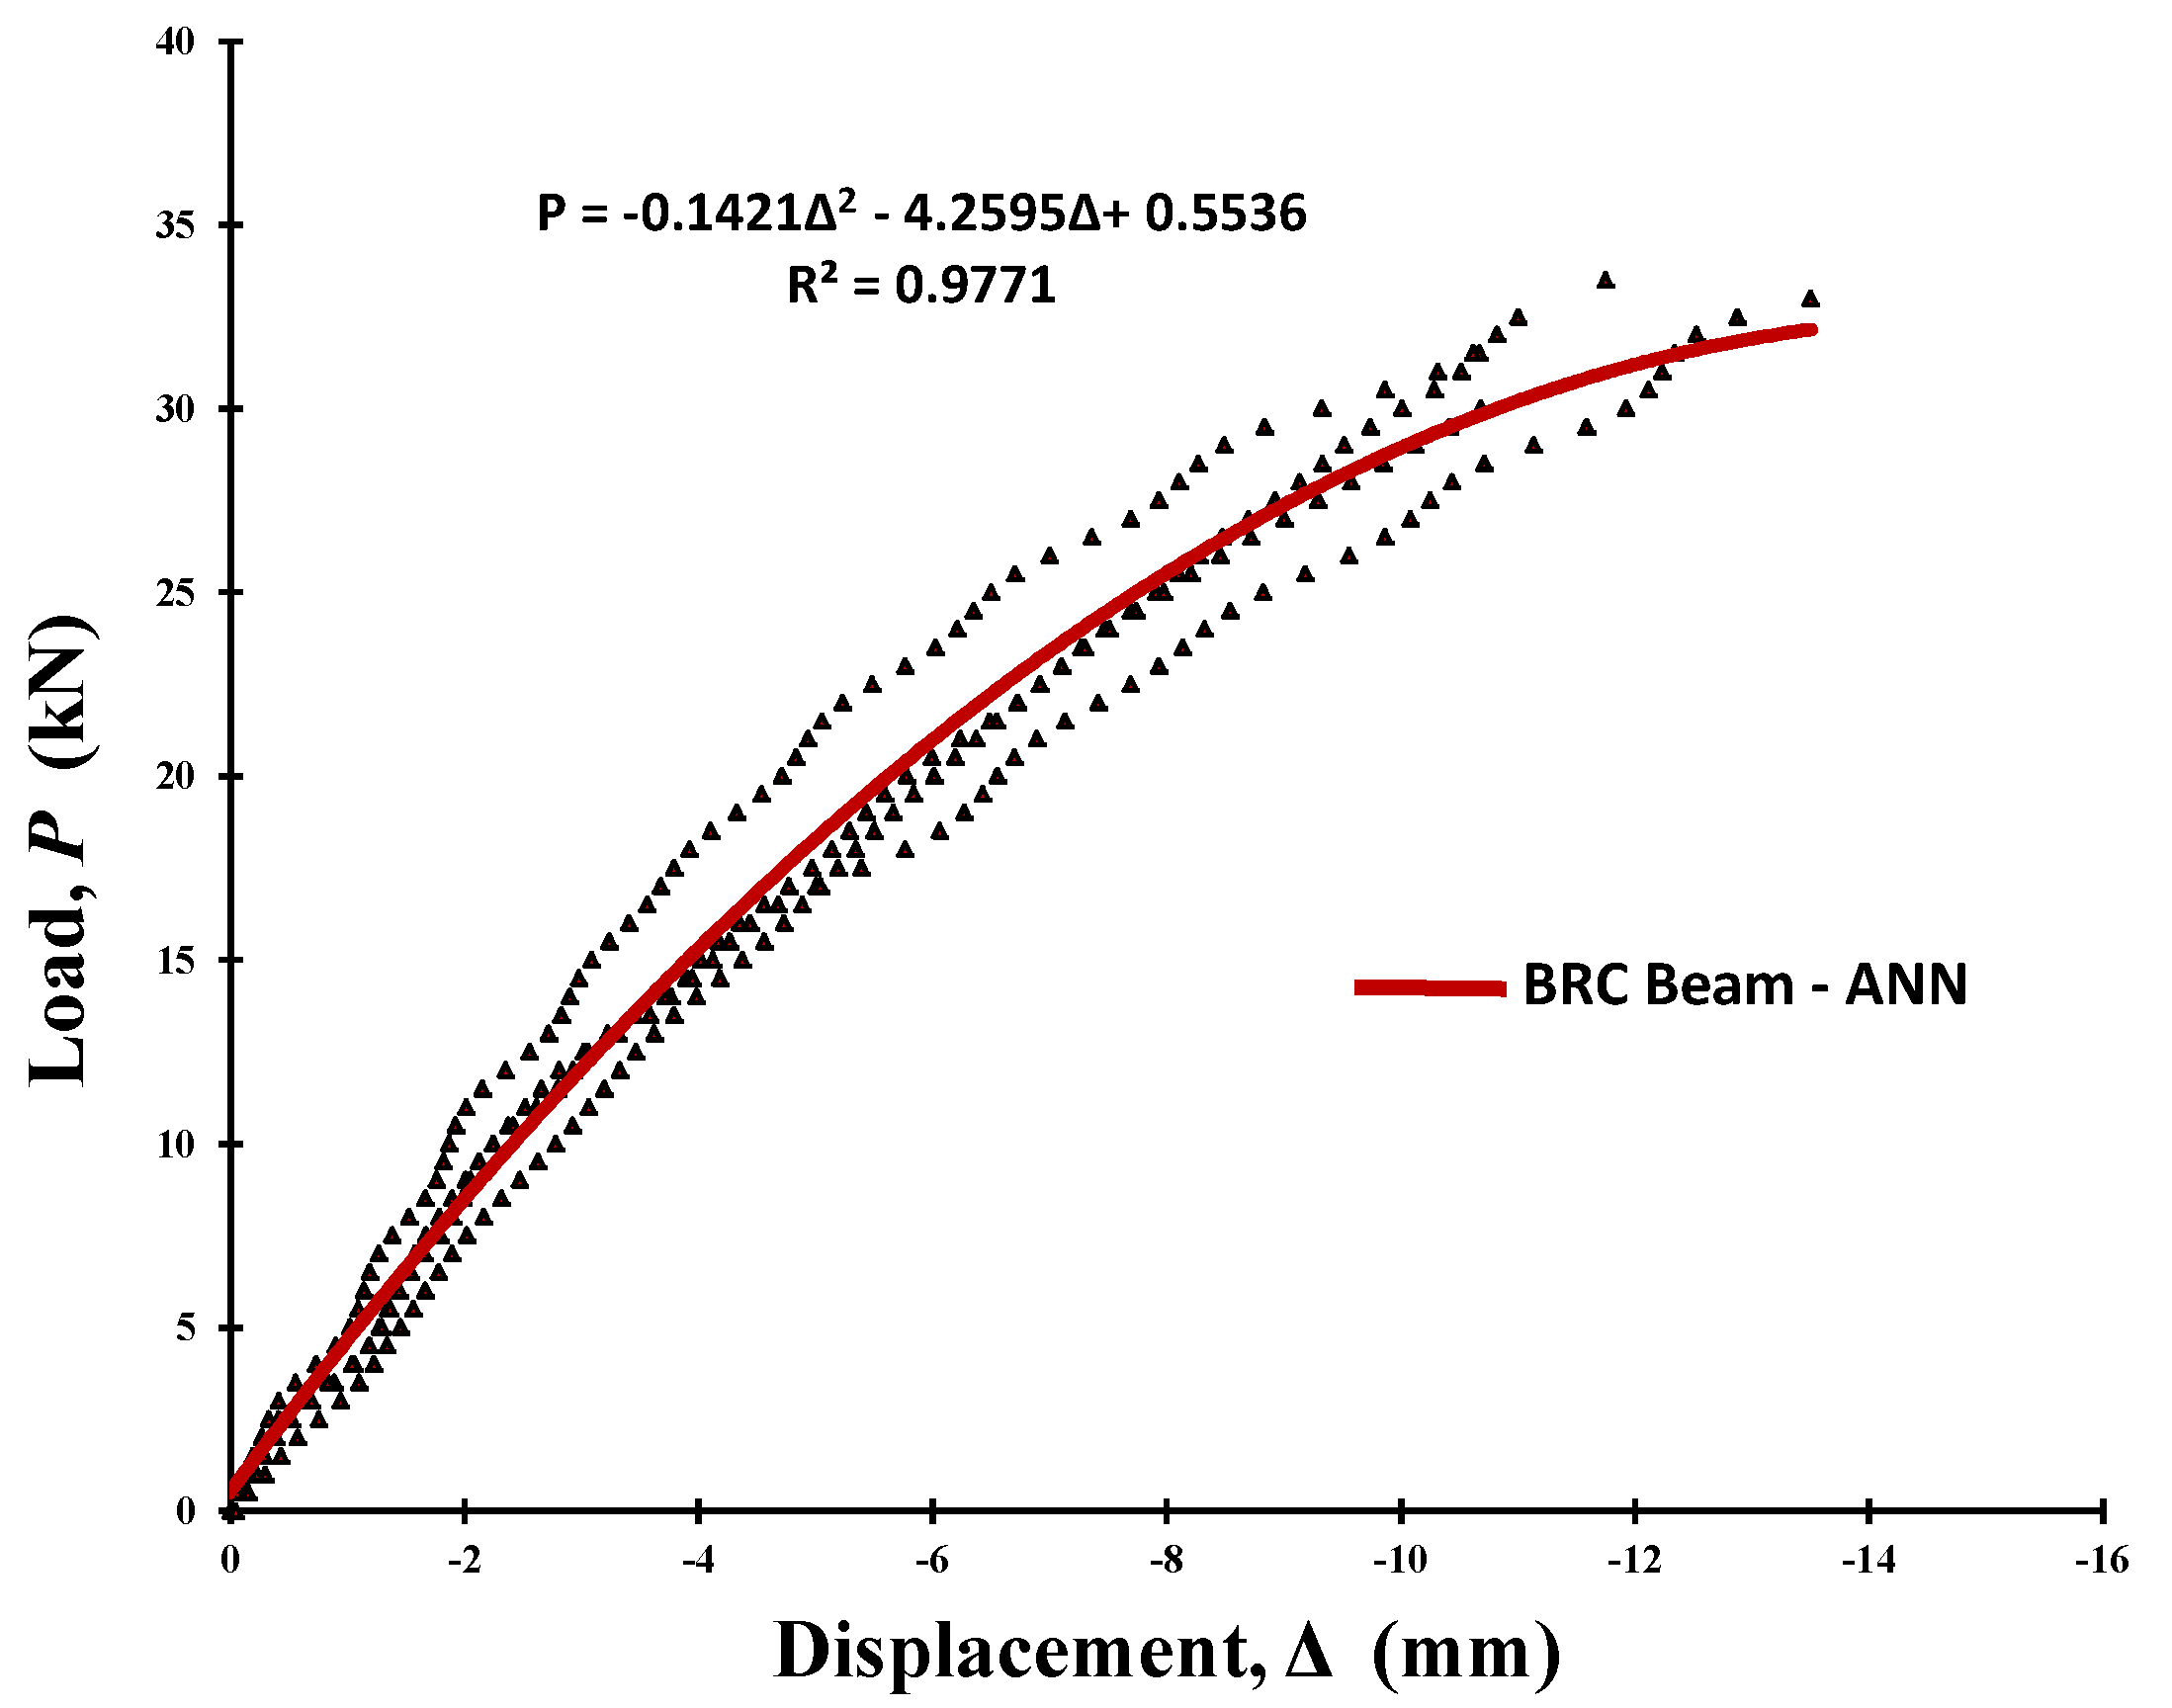
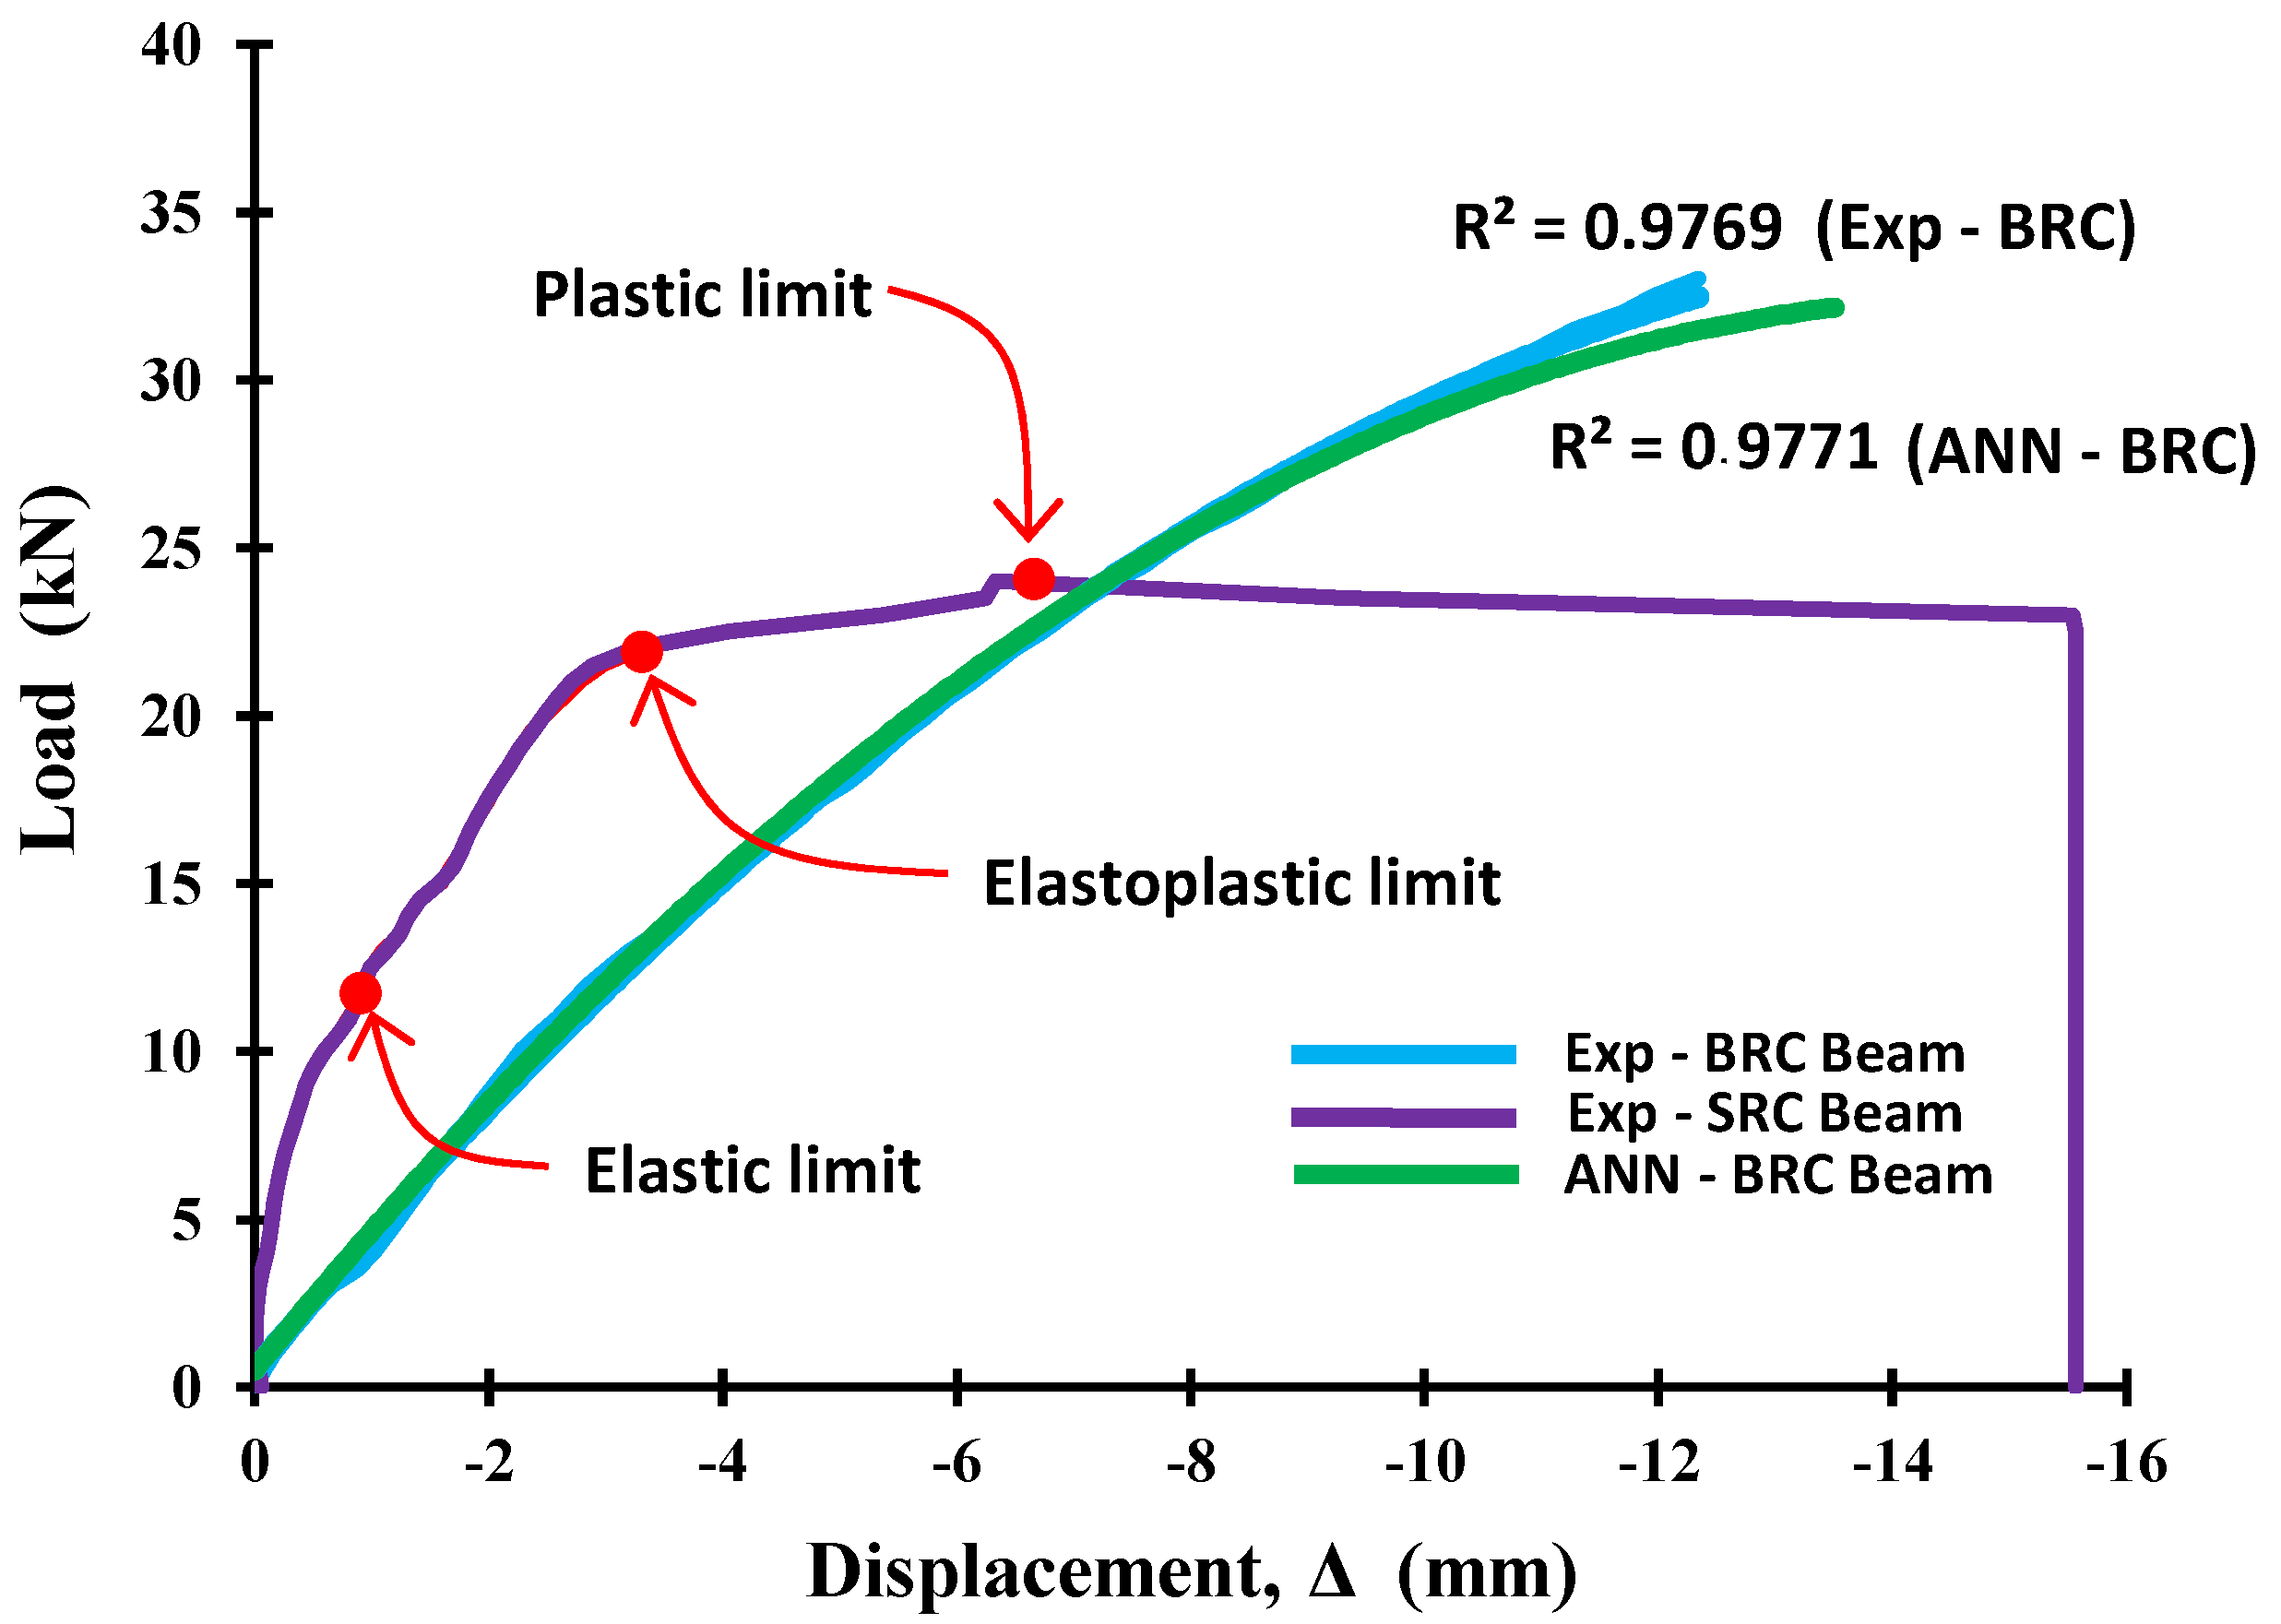
The data merger of ANN analysis results from each BRC beam specimen into a load vs. displacement relationship. The merger is done to determine the suitability of the load vs. displacement relationship model through the R2 parameter. From the results of the regression analysis, it is found that R2 = 0.9771, or almost close to 1. This shows that the model has high suitability, as shown in Figure 13. Figure 13 illustrates the load vs. displacement relationship for all BRC beam typologies from ANN analysis.

3.3. Validation with the Finite Element Method

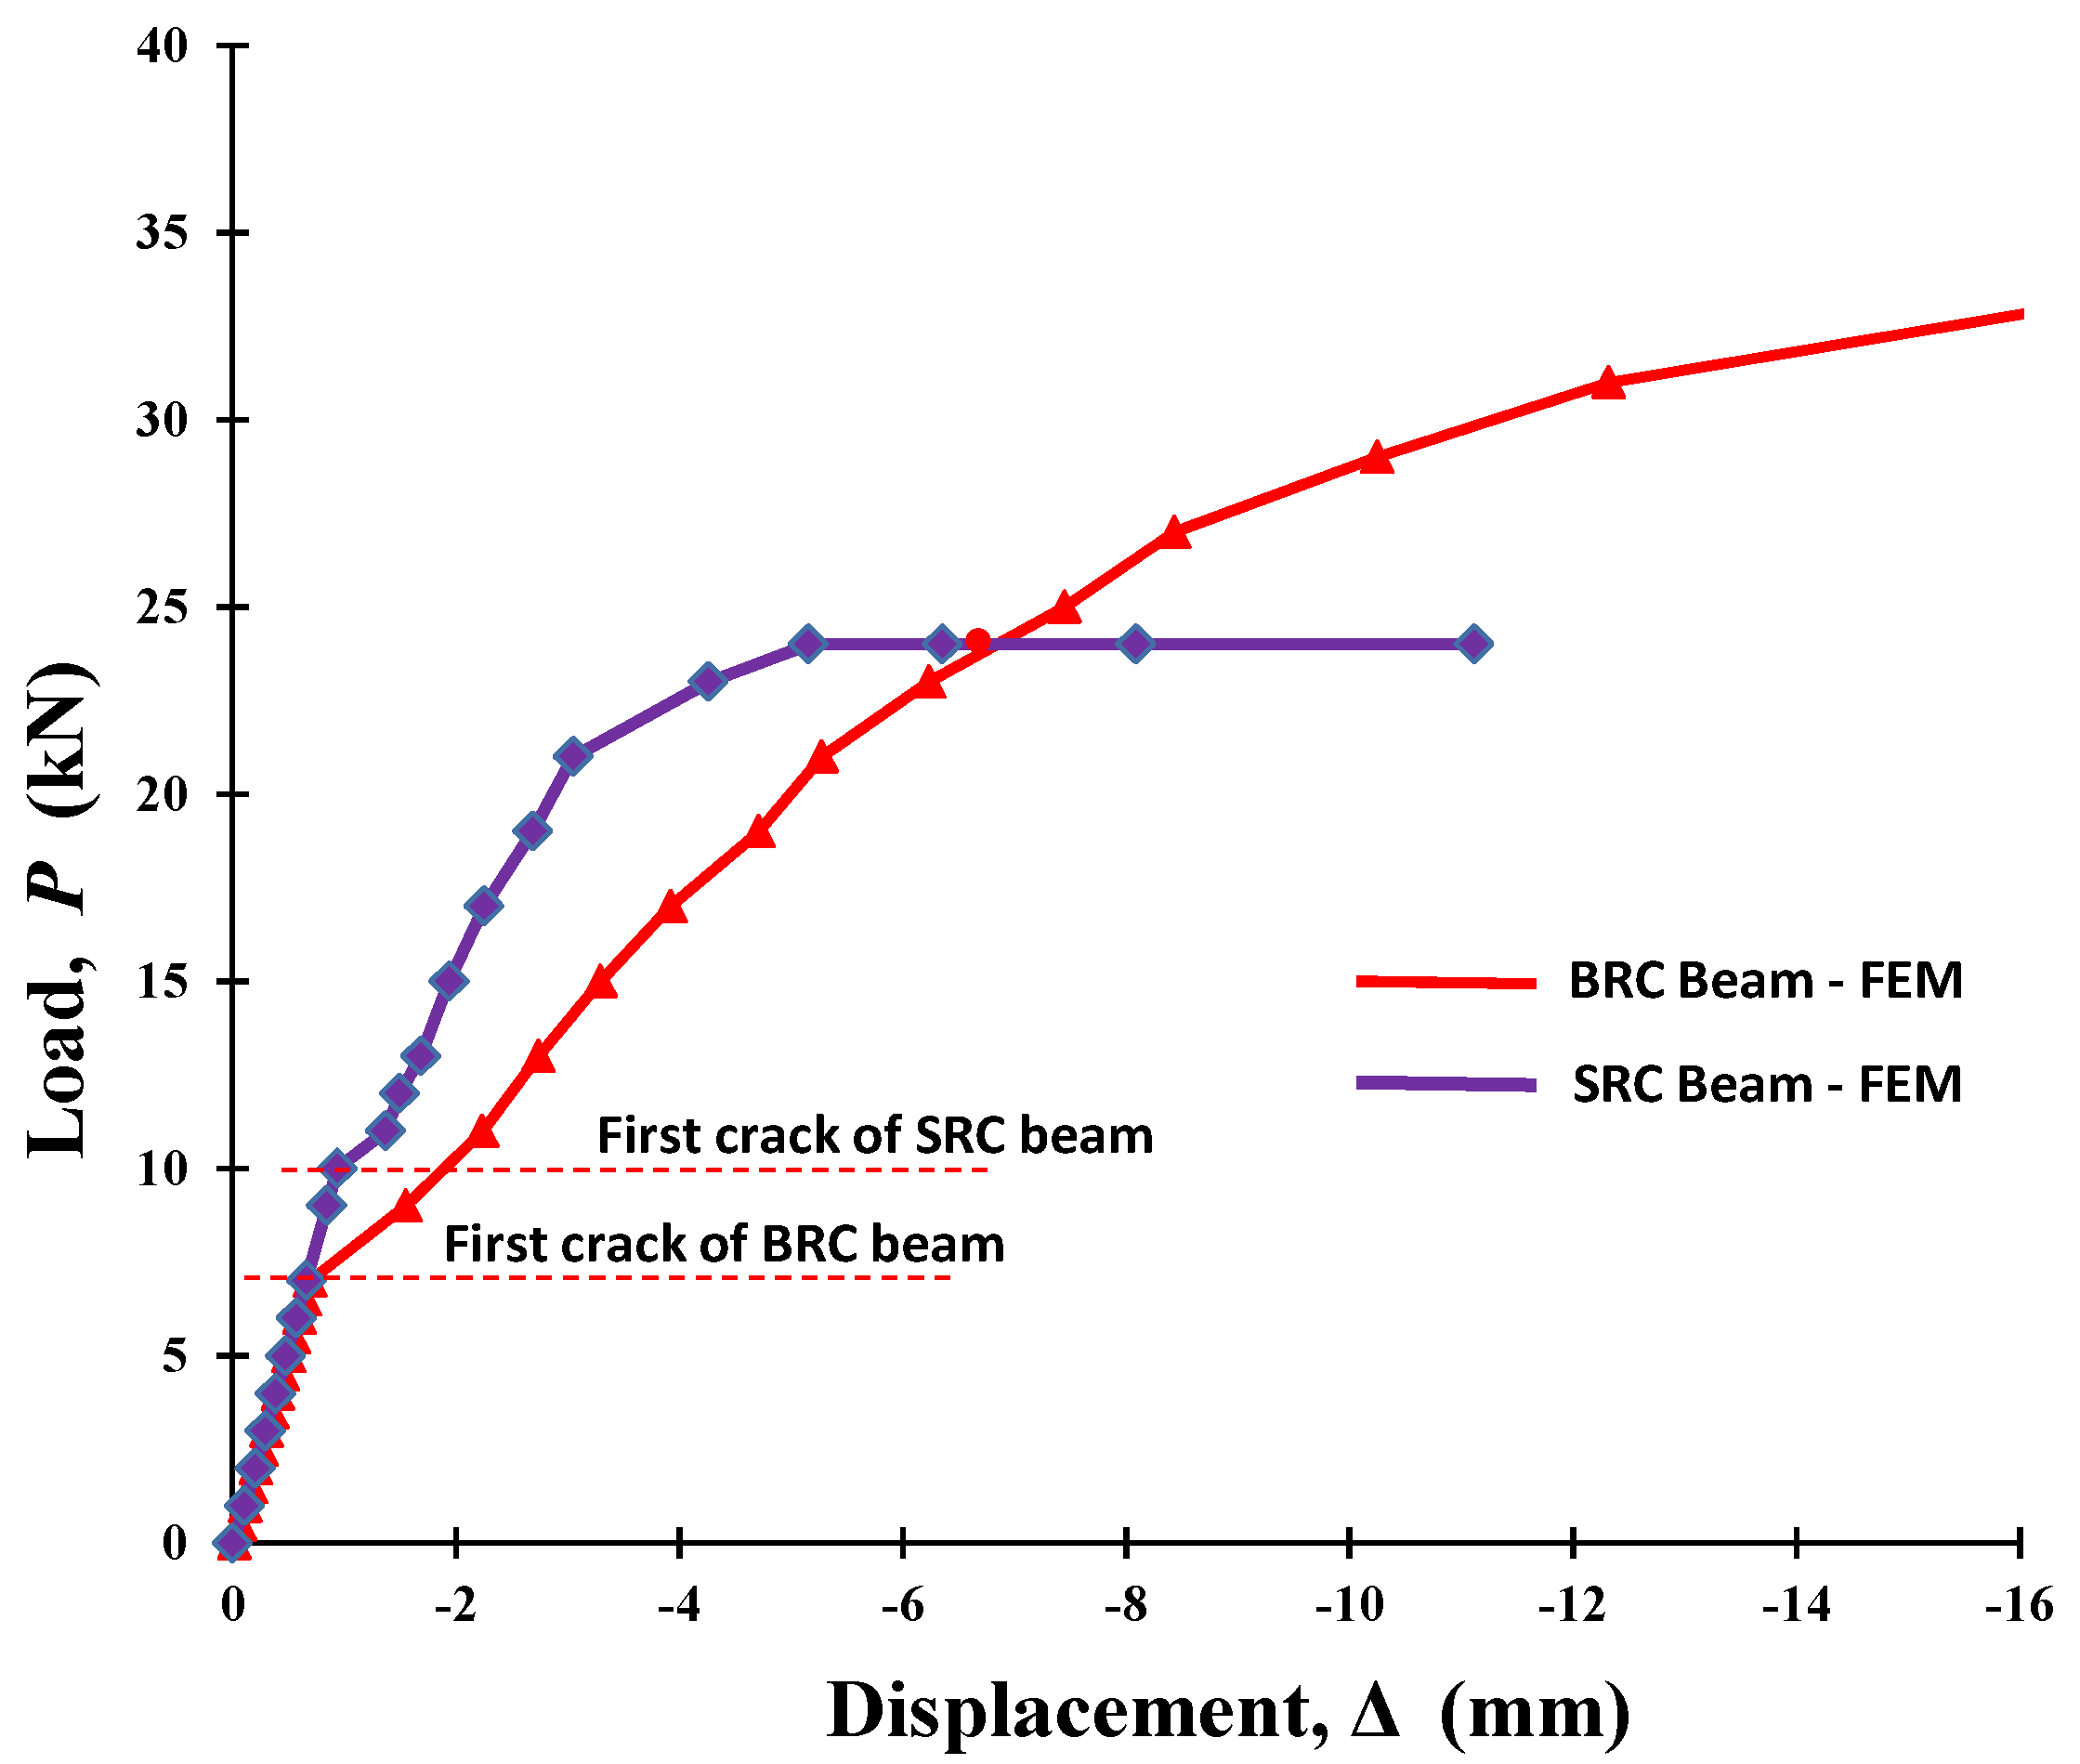
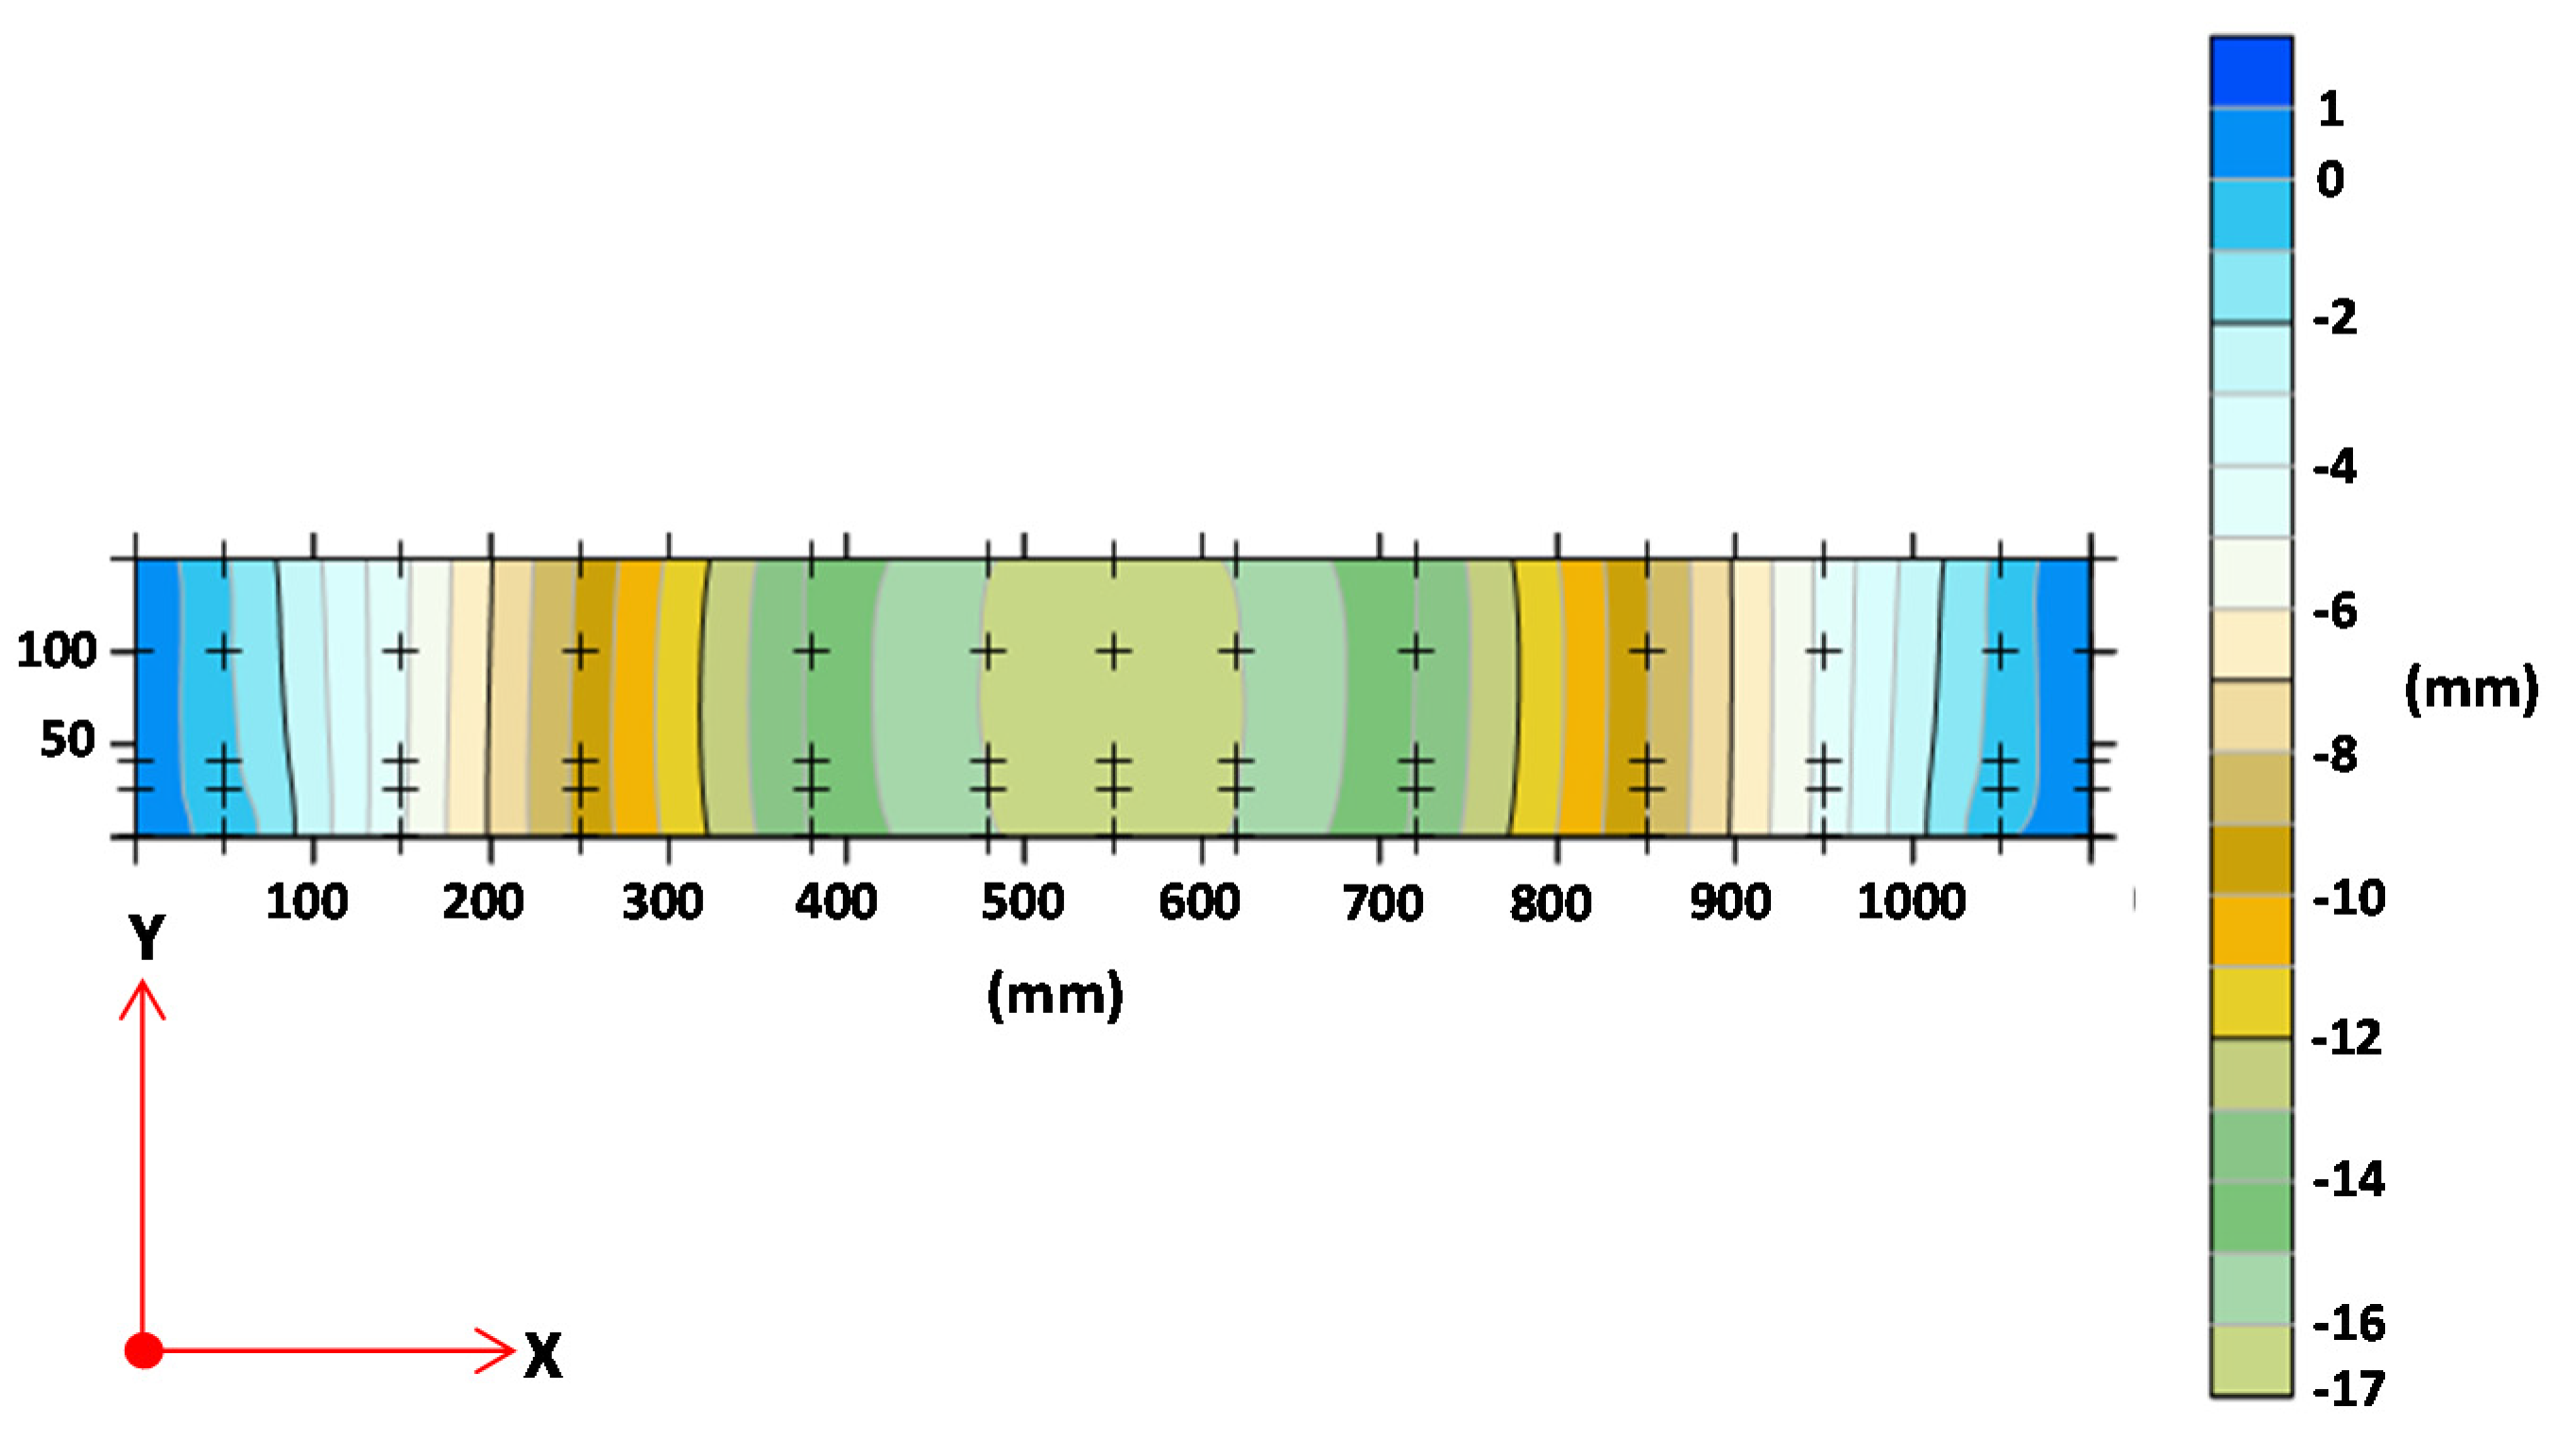
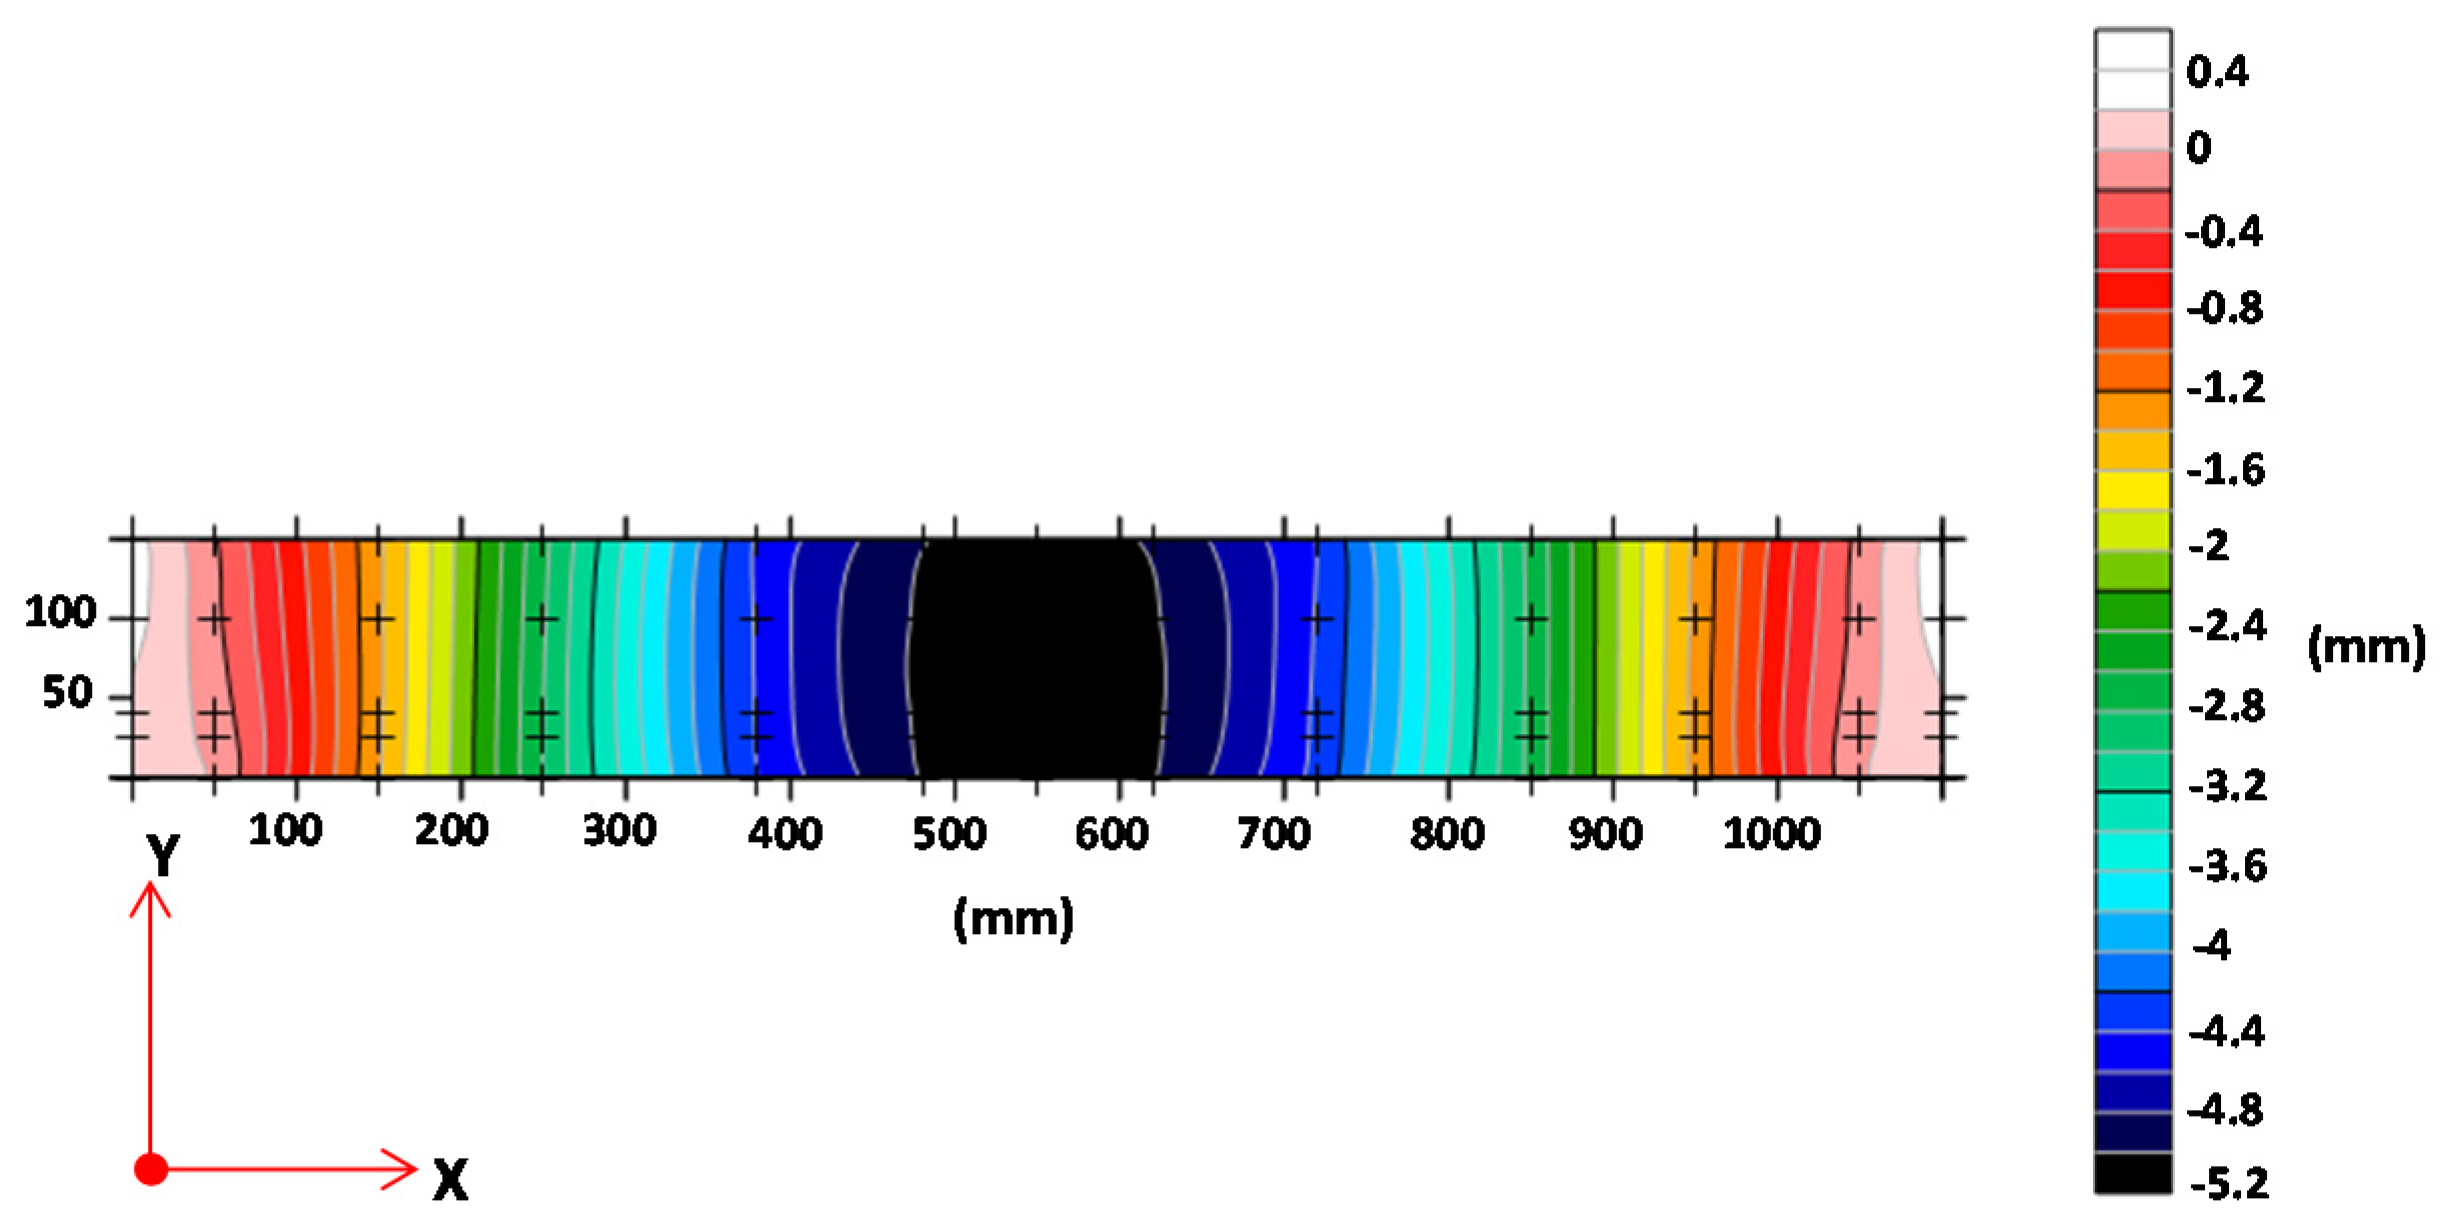
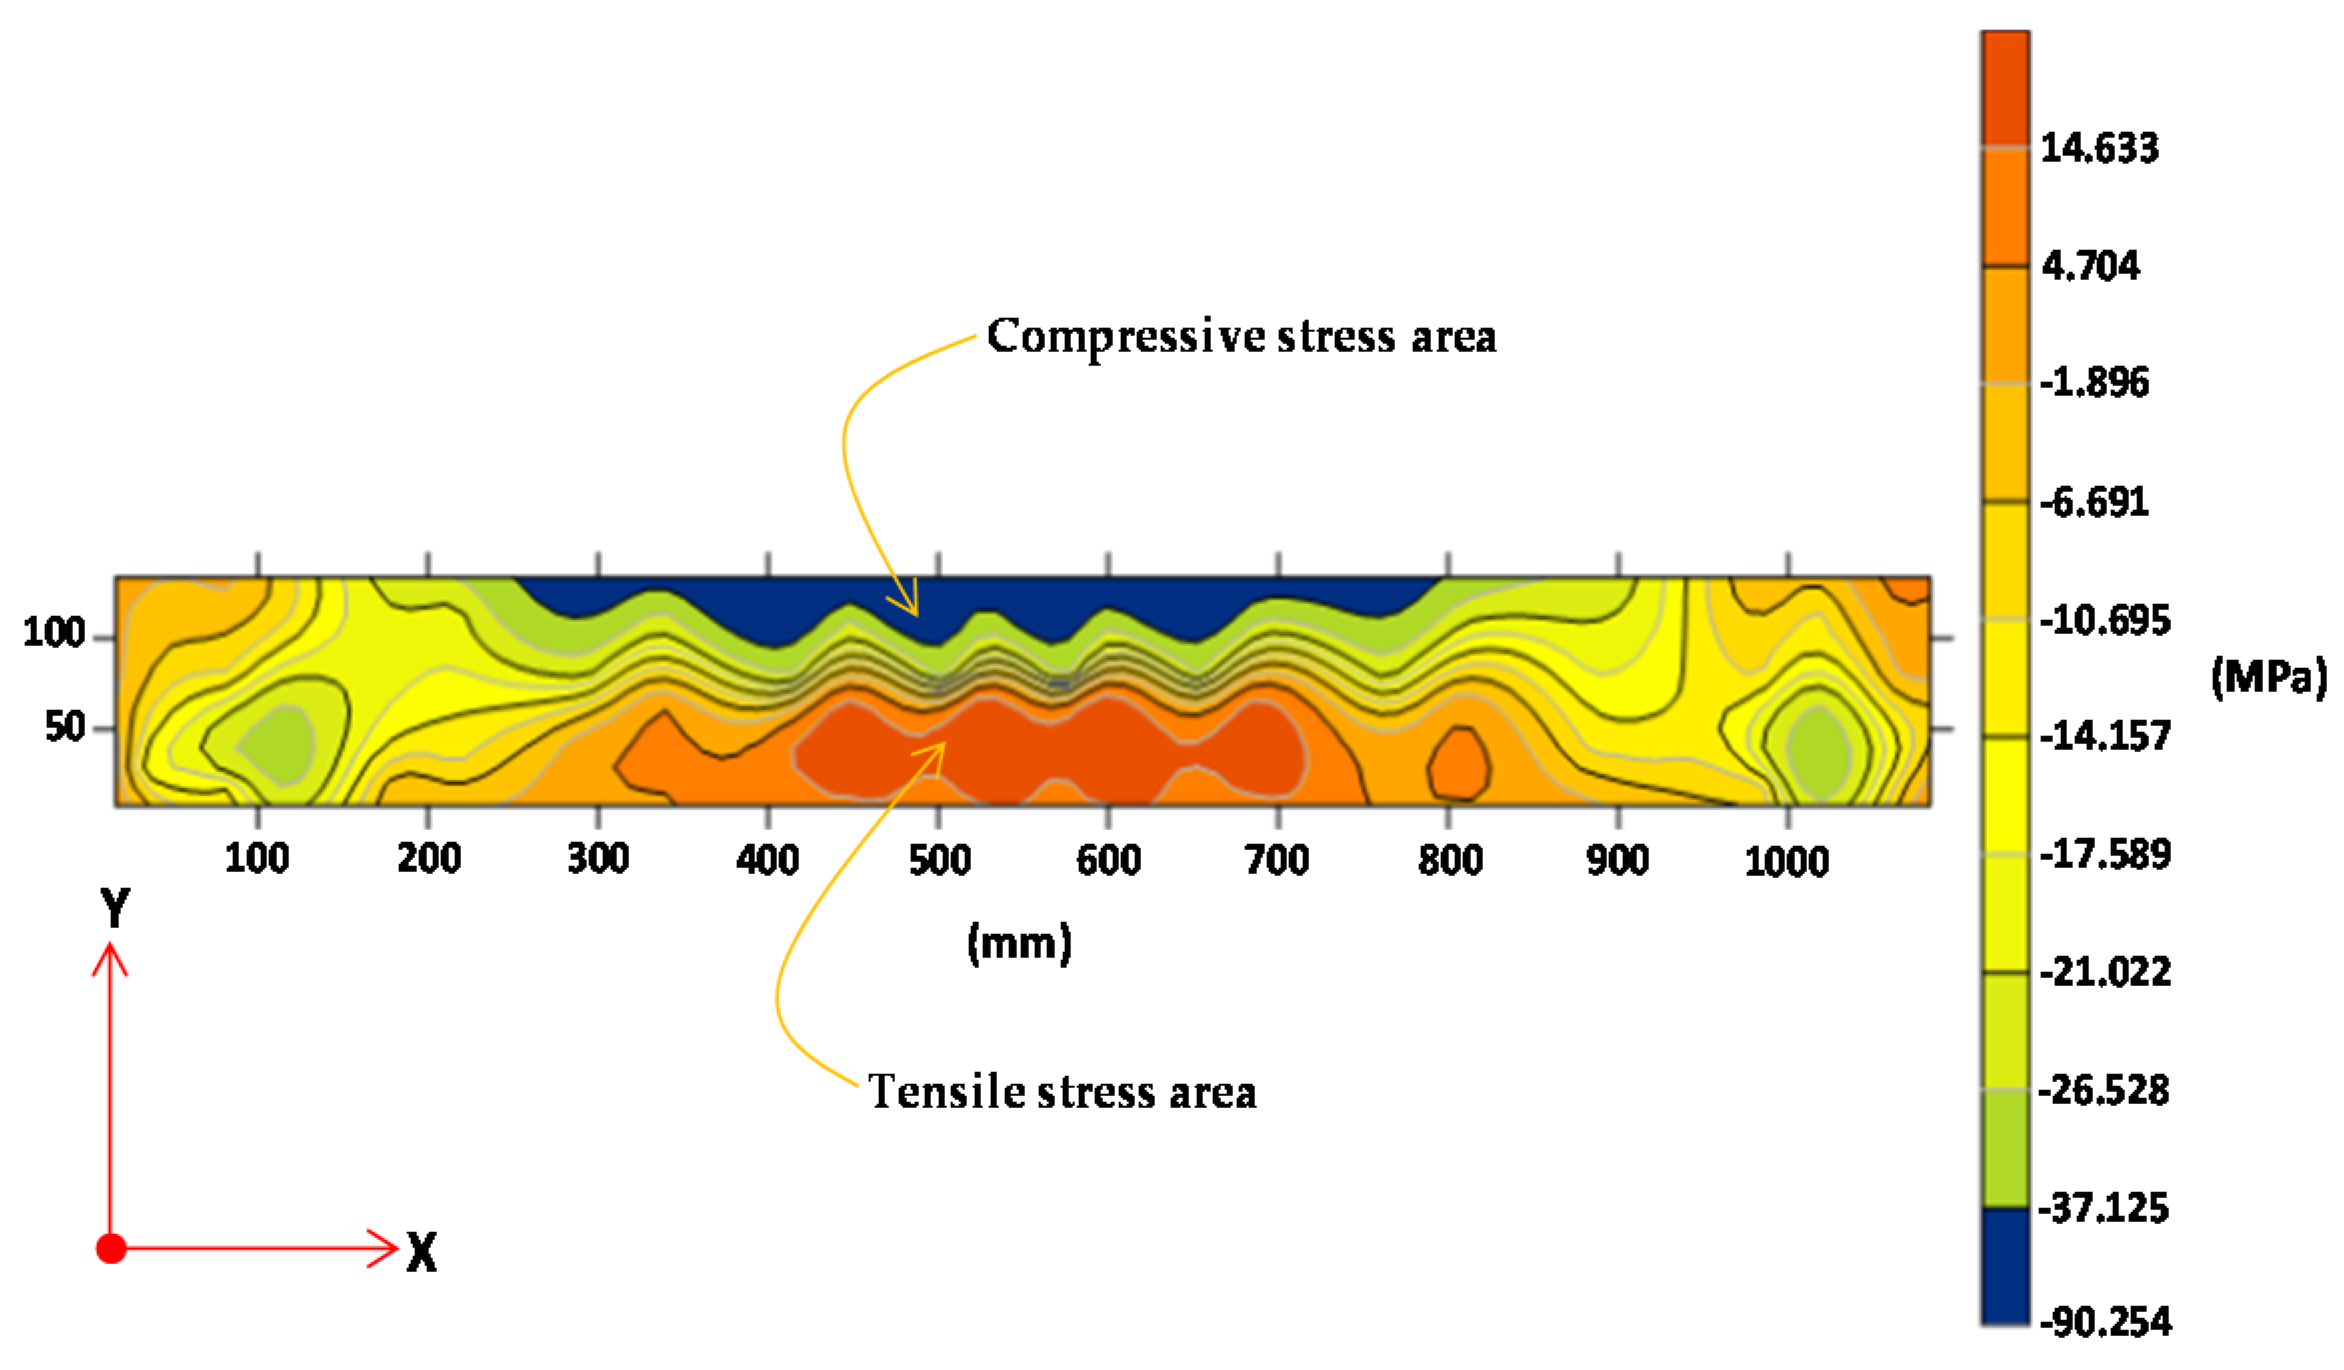
Validation of the relationship of load vs. displacement with the finite element method is done by inputting the geometry of the cross-section, load data, modulus of elasticity (E) per layer, and Poisson’s ratio (υ). The load vs. displacement relationship diagram of the experimental results as shown in Figure 6 and Figure 7 is used as a guide for the stages of the analysis process using the finite element method. And the cross-sectional stiffness input via the per-layer modulus of elasticity (E) is shown in Table 7 and Table 8. The analysis execution using the finite element method uses the Fortran PowerStation 4.0 program. The process of calculating displacement and stress with the Fortran PowerStation 4.0 program is carried out in stages according to the loading and stiffness stages per layer from the beam’s elastic condition, initial crack, elastoplastic, and plastic conditions until the beam collapses. The displacement data resulting from the finite element method is processed into a load vs. displacement relationship as shown in Figure 14. The displacement contours when the ultimate load are shown in Figure 15 for BRC beams and Figure 16 for SRC beams. The stress contours at the time of the load collapse are shown in Figure 17 for BRC beams and Figure 18 for SRC beams.

4. Discussion

Merging is carried out on the load vs. displacement relationship diagram from the experimental results, ANN analysis, and finite element method (FEM) analysis. Figure 19 shows the combined load vs. displacement diagram of the ANN analysis results with the experimental results. Figure 19 shows that the load vs. displacement relationship diagram the two analyses results are very coincided or show high suitability. However, at a load of approximately 90% of the collapse load, the load vs. displacement relationship diagram shows different behavior. Figure 20 shows the combined load vs. displacement diagram of the experimental results, ANN analysis, and the results of the finite element method analysis. Figure 19 shows that the artificial neural networks (ANN) model has a higher R2 value when compared to the R2 value of the multiple linear regression model (MLR). ANN analysis has better predictive accuracy. This is the same as the conclusion of 2 researchers, namely Khademi et al. (2017) [40], who concluded that the ANN model has higher accuracy than the multiple linear regression (MLR) model, and Xuan Li et al. (2019) [41], who concluded that the ANN model performs better than the MLR models with or without considering the interactions between factors. The accuracy of the prediction is very much dependent on the number of input variables. The greater the number of input parameters, the more accurate the results of the predicted model.
The diagram of the relationship between load and displacement of the BRC beam from FEM analysis and experimental results shows the difference in elastic conditions or until the initial crack occurs. The experimental results showed negative differences with the results of the FEM analysis. This shows the influence of the nature and characteristics of bamboo. The parts of bamboo stems have a non-uniform or uncertain modulus of elasticity. Tensile strength and modulus of elasticity of bamboo tested in the laboratory are sometimes different from bamboo which is used as beam reinforcement. As is known, bamboo trees from base to tip have different tensile strength and fiber density. Meanwhile, the relationship diagram of load vs. displacement of the SRC beam experiment results is positively different from the results of the FEM analysis when the elastic condition or until the initial crack occurs. Positive differences can be ignored, in the sense that the quality of the steel used is better than the quality of steel tested in the laboratory. However, in this study, the analysis of stiffness reduction in BRC and SRC beams was focused after the beam experienced an initial crack or non-linear phase.
Figure 20 shows that inelastic conditions there is a difference in stiffness between the two types of beams. The stiffness of bamboo reinforced concrete beams (BRC) is lower than the stiffness of steel-reinforced concrete beams (SRC). This difference occurs not due to reduced cross-section inertia or Ig of cross-sectional reduction, but due to the nature of the material used. This is because the BRC beam uses bamboo reinforcing material, which has high elastic and resilience properties. BRC beams with bamboo reinforcement will be able to accept high impact loads without causing over stress at the elastic limit, even though displacement has occurred. This indicates that the energy absorbed during loading is stored and released if the material is not loaded. Meanwhile, the SRC beam uses steel material that has high stiffness and toughness, so that the SRC beam in the service load range or elastic conditions does not experience excessive displacement or deformation. Beams that use materials with high stiffness and toughness will be able to withstand high impact loads or shock loads. If the SRC beam gets an impact load, then some of the energy is absorbed and some of the energy is transferred.
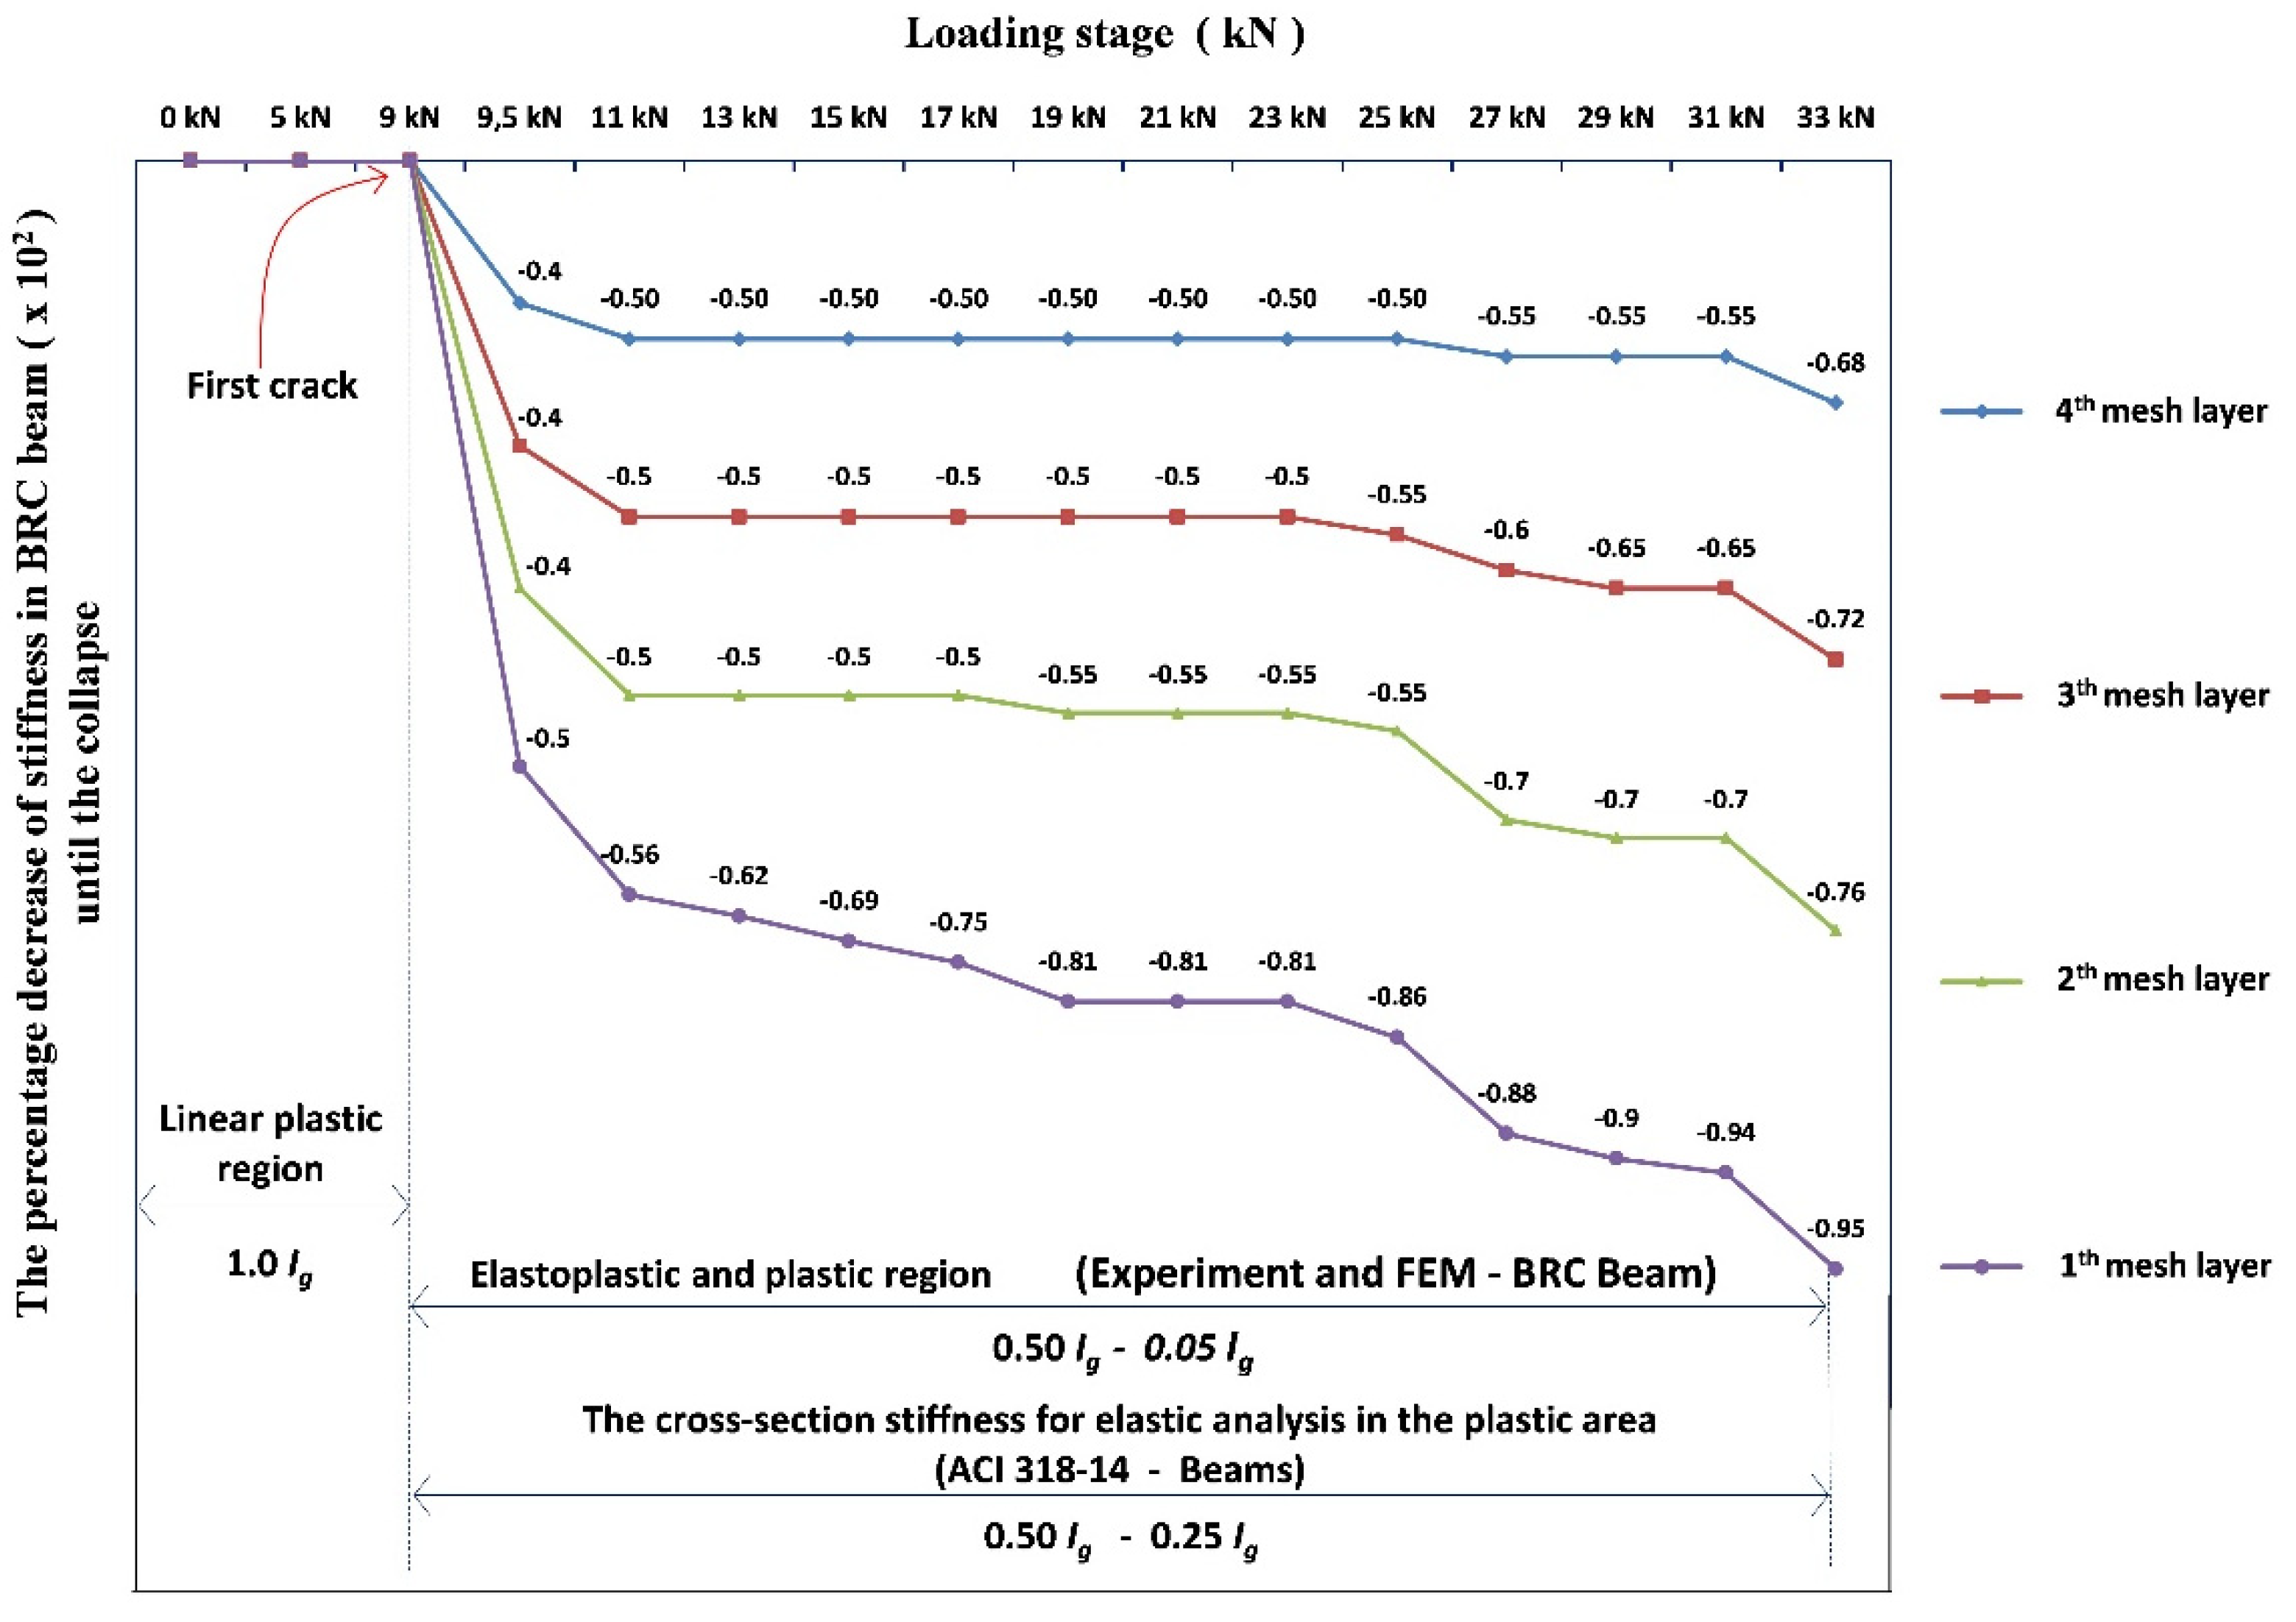
In the non-linear phase or after initial cracking, the beam stiffness changes from the full-sectional flexural stiffness, EcIg, to the effective bending stiffness, EcIeff. In the non-linear phase, the stiffness of the beam section continues to decrease with increasing loads, moments, and cracks. The area of the beam section continues to decrease with increasing cracks and automatically causes the beam section stiffness (EcIg) to decrease. As shown in Table 6 and Figure 21, the stiffness of the BRC beam decreases after the initial cracking occurs as the increasing loading stage is applied. The increase in load causes the flexural moment to increase, the displacement increases, and the crack propagation continues to spread towards the compressed block of the beam cross-section. The crack propagation from 1st mesh layer to the 2nd mesh layer onwards runs linearly with reduced cross-sectional stiffness from the lower fiber of the cross-section tensile block to the upper fiber of the compressive block of the beam cross-section. The increase in crack propagation towards the compressive block of cross-section causes the neutral line to change. Chunyu Fu et al. (2018) [13] concluded that the presence of cracks causes a nonlinear stress distribution along the beam cross-section, which changes the neutral axis of the cross-section and further affects the stiffness of the beam. Figure 21 shows that the stiffness of the BRC beam cross-section decreases from the initial crack until the beam collapses. The stiffness of BRC beams is reduced by 50% after initial cracking to 95% at collapse. The stiffness reduction goes step by step according to the moment (Ma) applied to the beam. Sang-Whan Han et al. (2009) [4] revealed that the stiffness reduction factor was significantly affected by the amount of moment or the applied load, while the stiffness reduction factor did not differ from the amount of reinforcement. The decrease in the moment of inertia of the full cross-sectional Ig of the BRC beam ranged from 0.5Ig–0.05Ig for the elastoplastic and plastic regions. Meanwhile, ACI-318M-14 [5] recommends the stiffness of the beam cross-section for elastic analysis in the non-linear phase of 0.5Ig–0.25Ig. The difference in the value of the reduction in the stiffness of the cross-section at collapse correlates with the differences in the properties and characteristics of the material used as beam reinforcement. Bamboo reinforced concrete beams (BRC) exhibit high displacement behavior, but once the collapse load is reached and gradually released, displacement tends to return to zero. It is linear with its elastic properties and the stress vs. strain relationship behavior of bamboo.
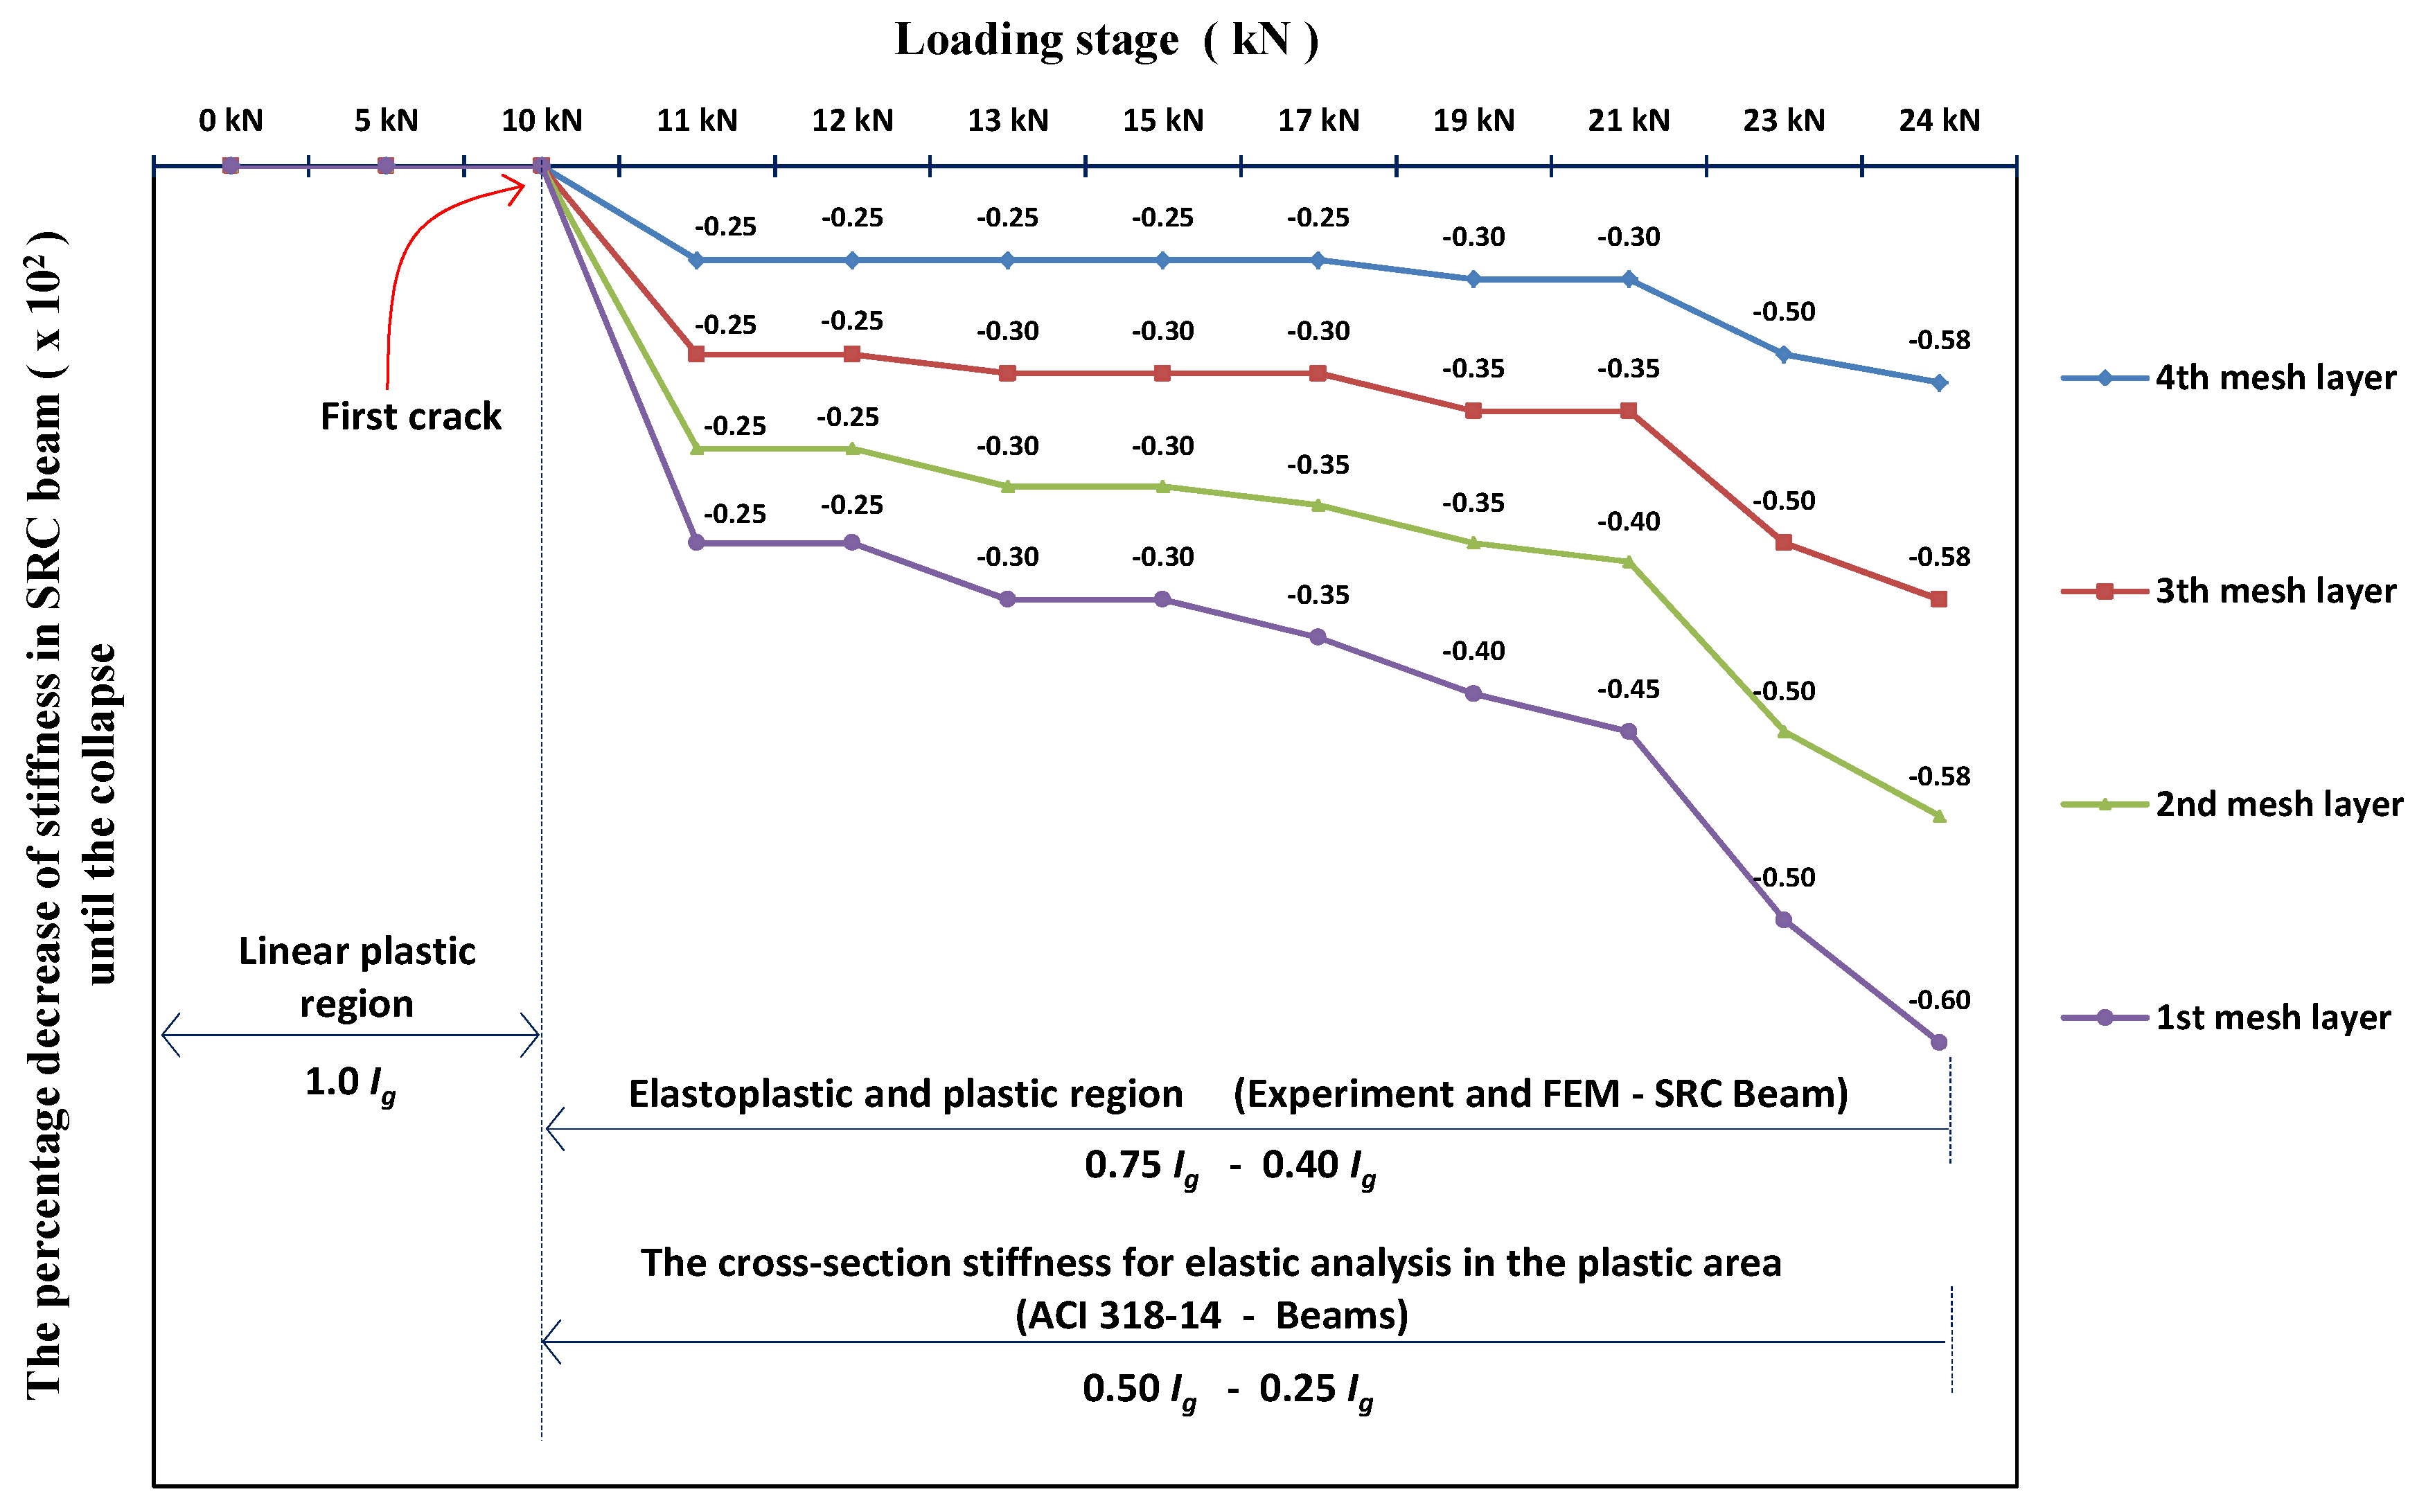
Table 7 and Figure 22 show a decrease in stiffness or a decrease in the moment of inertia of the SRC beam cross-section. Stiffness decreases after initial cracking as the applied load increases. Figure 22 shows that the cross-sectional stiffness of the SRC beam decreases from the initial crack until the beam collapses. The stiffness of the SRC beam was reduced by 25% after initial cracking to 60% at collapse. The decrease in the moment of inertia full cross-section (Ig) for SRC beams ranged from 0.75Ig–0.40Ig for the elastoplastic and plastic regions. Meanwhile, ACI-318M-14 [5] recommends the cross-sectional stiffness of reinforced concrete beams for elastic analysis in the non-linear phase of 0.5Ig–0.25Ig. The difference in the value of the reduction in the cross-sectional stiffness of the SRC beam with the ACI-318M-14 [5] requirements is due to the beam cross-section reinforcement method, namely the SRC beam in this study using a single reinforcement method. SRC beam with single reinforcement shows that when the steel reinforcement undergoes second melting and the moment of inertia of the cross-section is still around 40%, the steel reinforcement is not able to withstand the tensile stress that occurs so that the neutral line of the cross-section continues to shift upwards towards the upper fiber of the compression block of the cross-section. Meanwhile, BRC beams with bamboo reinforcement have good elastic properties, where after the ultimate load is reached, the large displacement shrinks back to near-zero or the beam returns flat [7], as shown in the video at the following link: https://goo.gl/6AVWmP. Although the stiffness or inertia of the BRC beam cross-section is still around 5%, bamboo reinforcement is still able to withstand the tensile stress that occurs, as stated by Ghavami (2005) [24] that bamboo has high tensile strength. If we control with the crack pattern, the crack lines on the BRC beam majority stop below the cross-section neutral line, while the crack lines on the SRC beam tend to continue to propagate upwards towards the upper fibers of the compressive block of the beam cross-section, as shown in Figure 23 and Figure 24. And if we look at Figure 17 and Figure 18, the tensile stress contour of the BRC beam has a wider zone and spreads to the side when compared to the SRC beam.
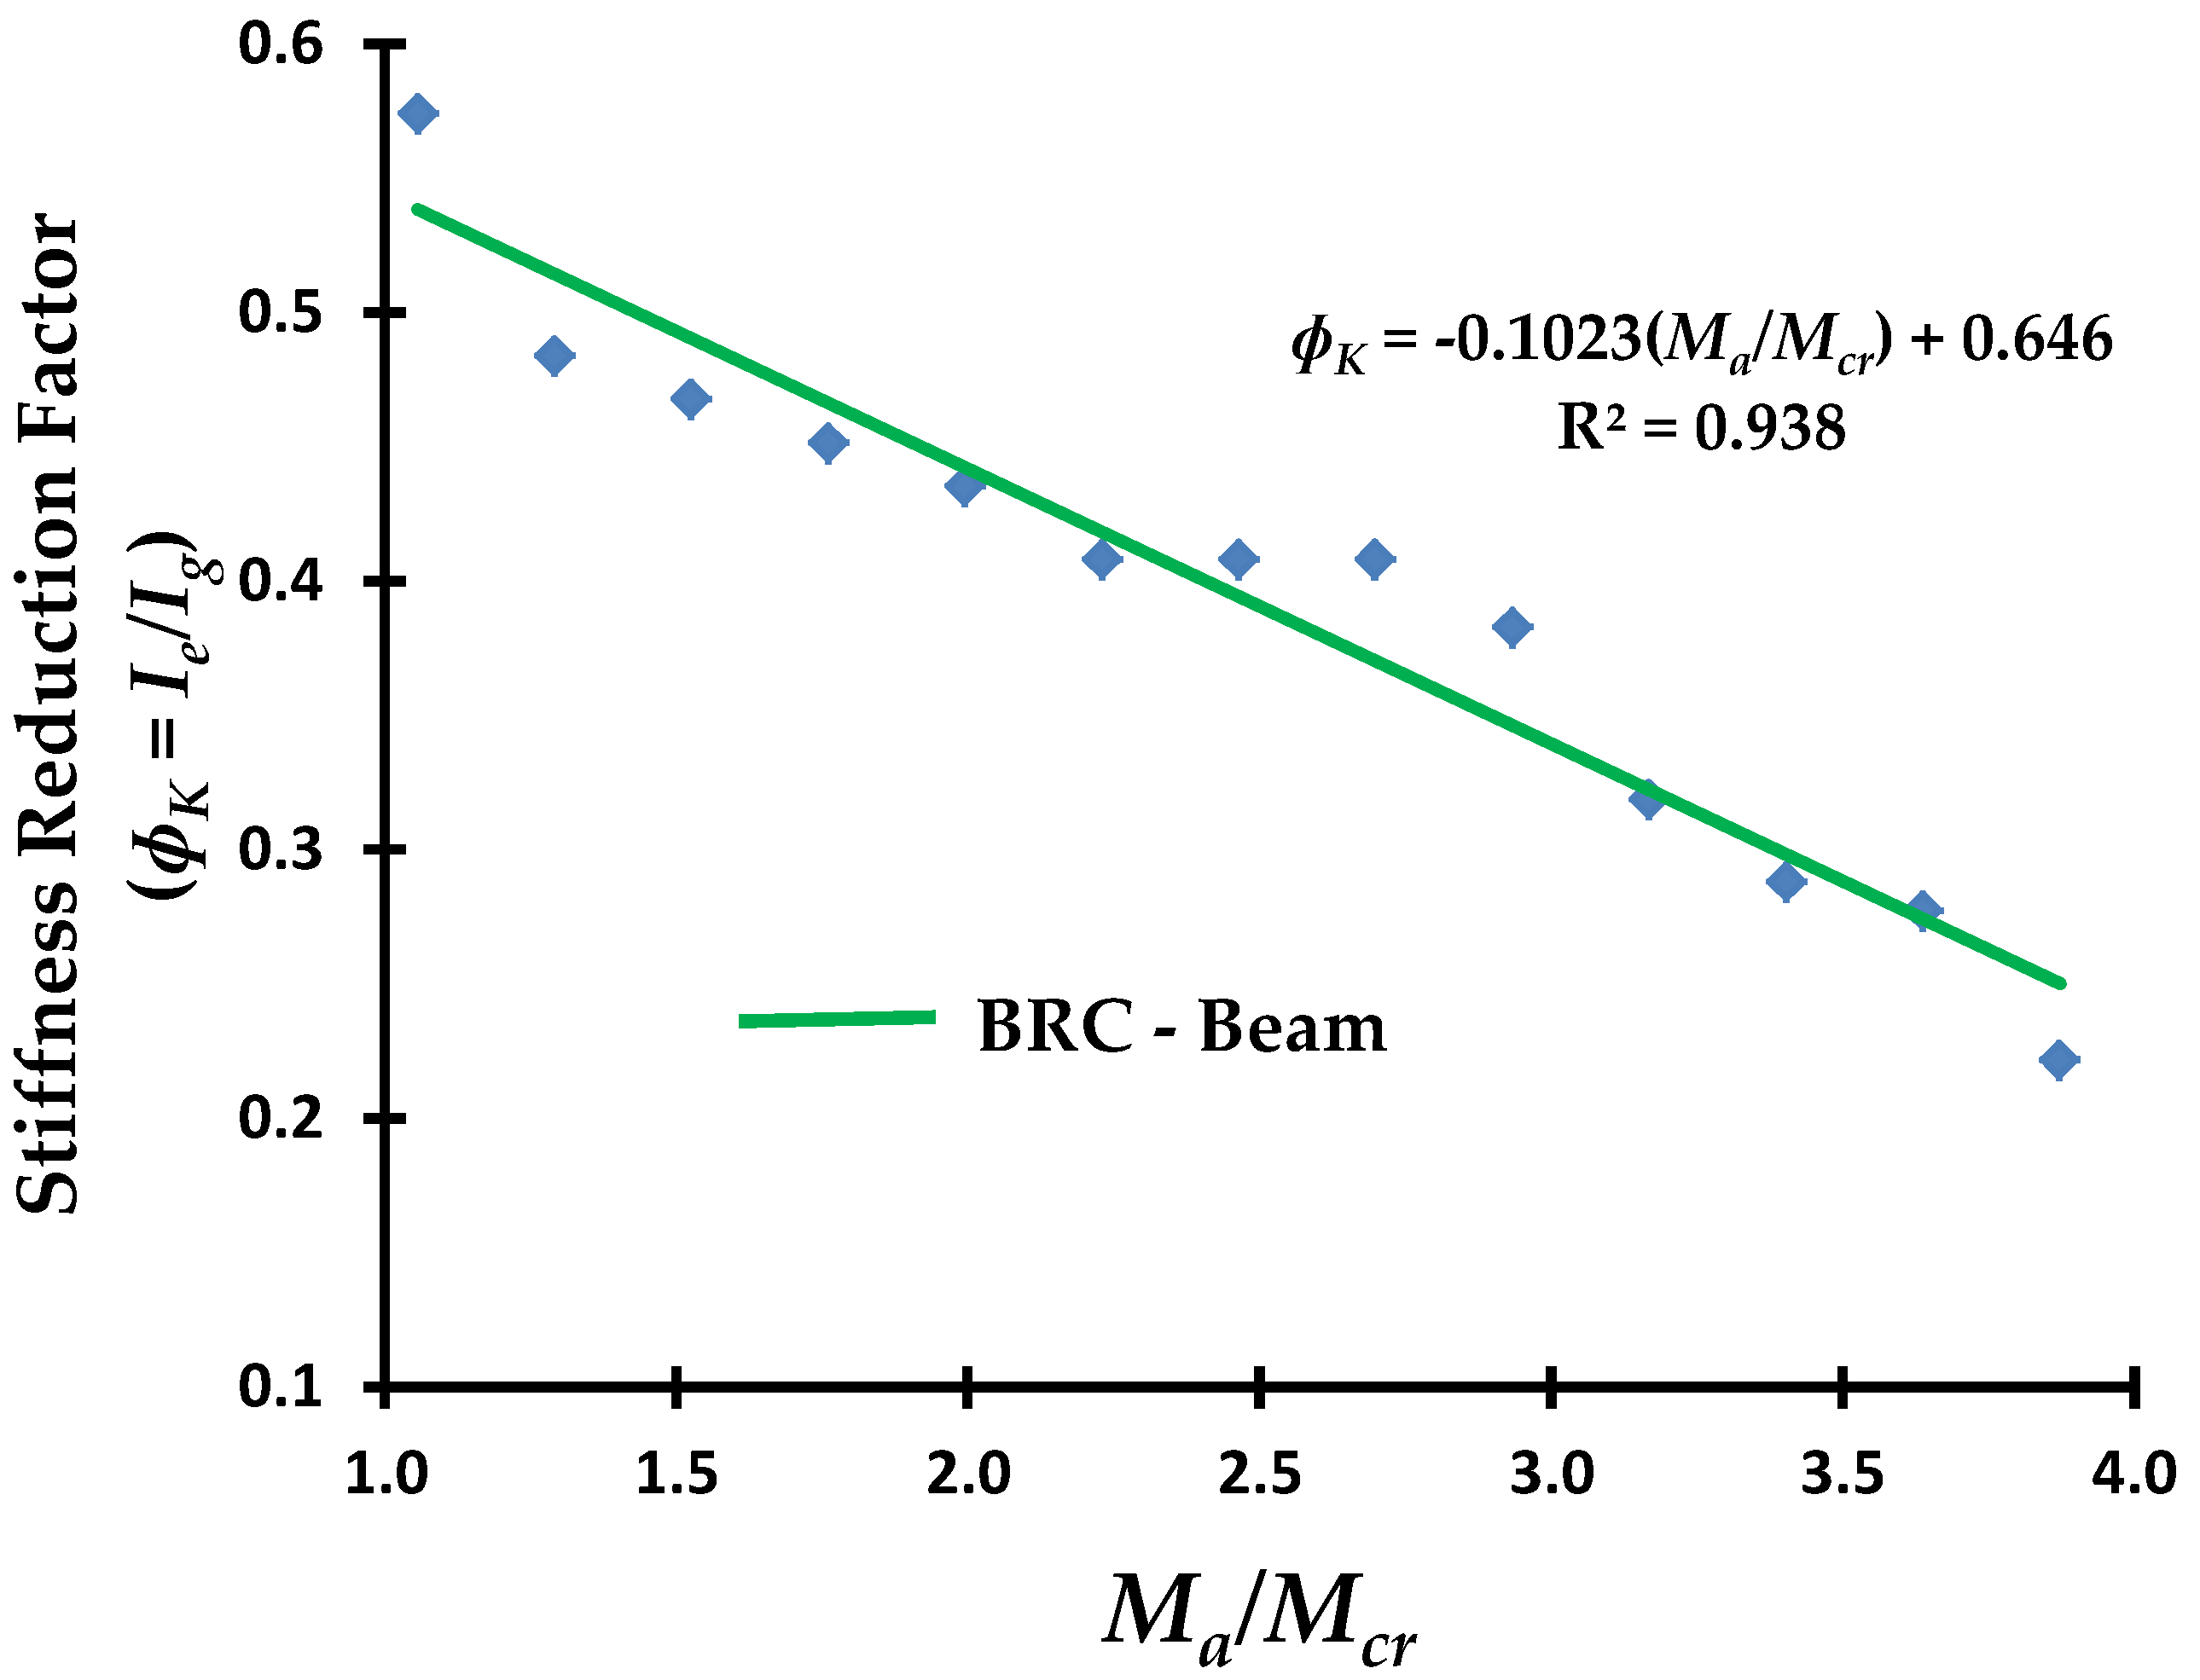
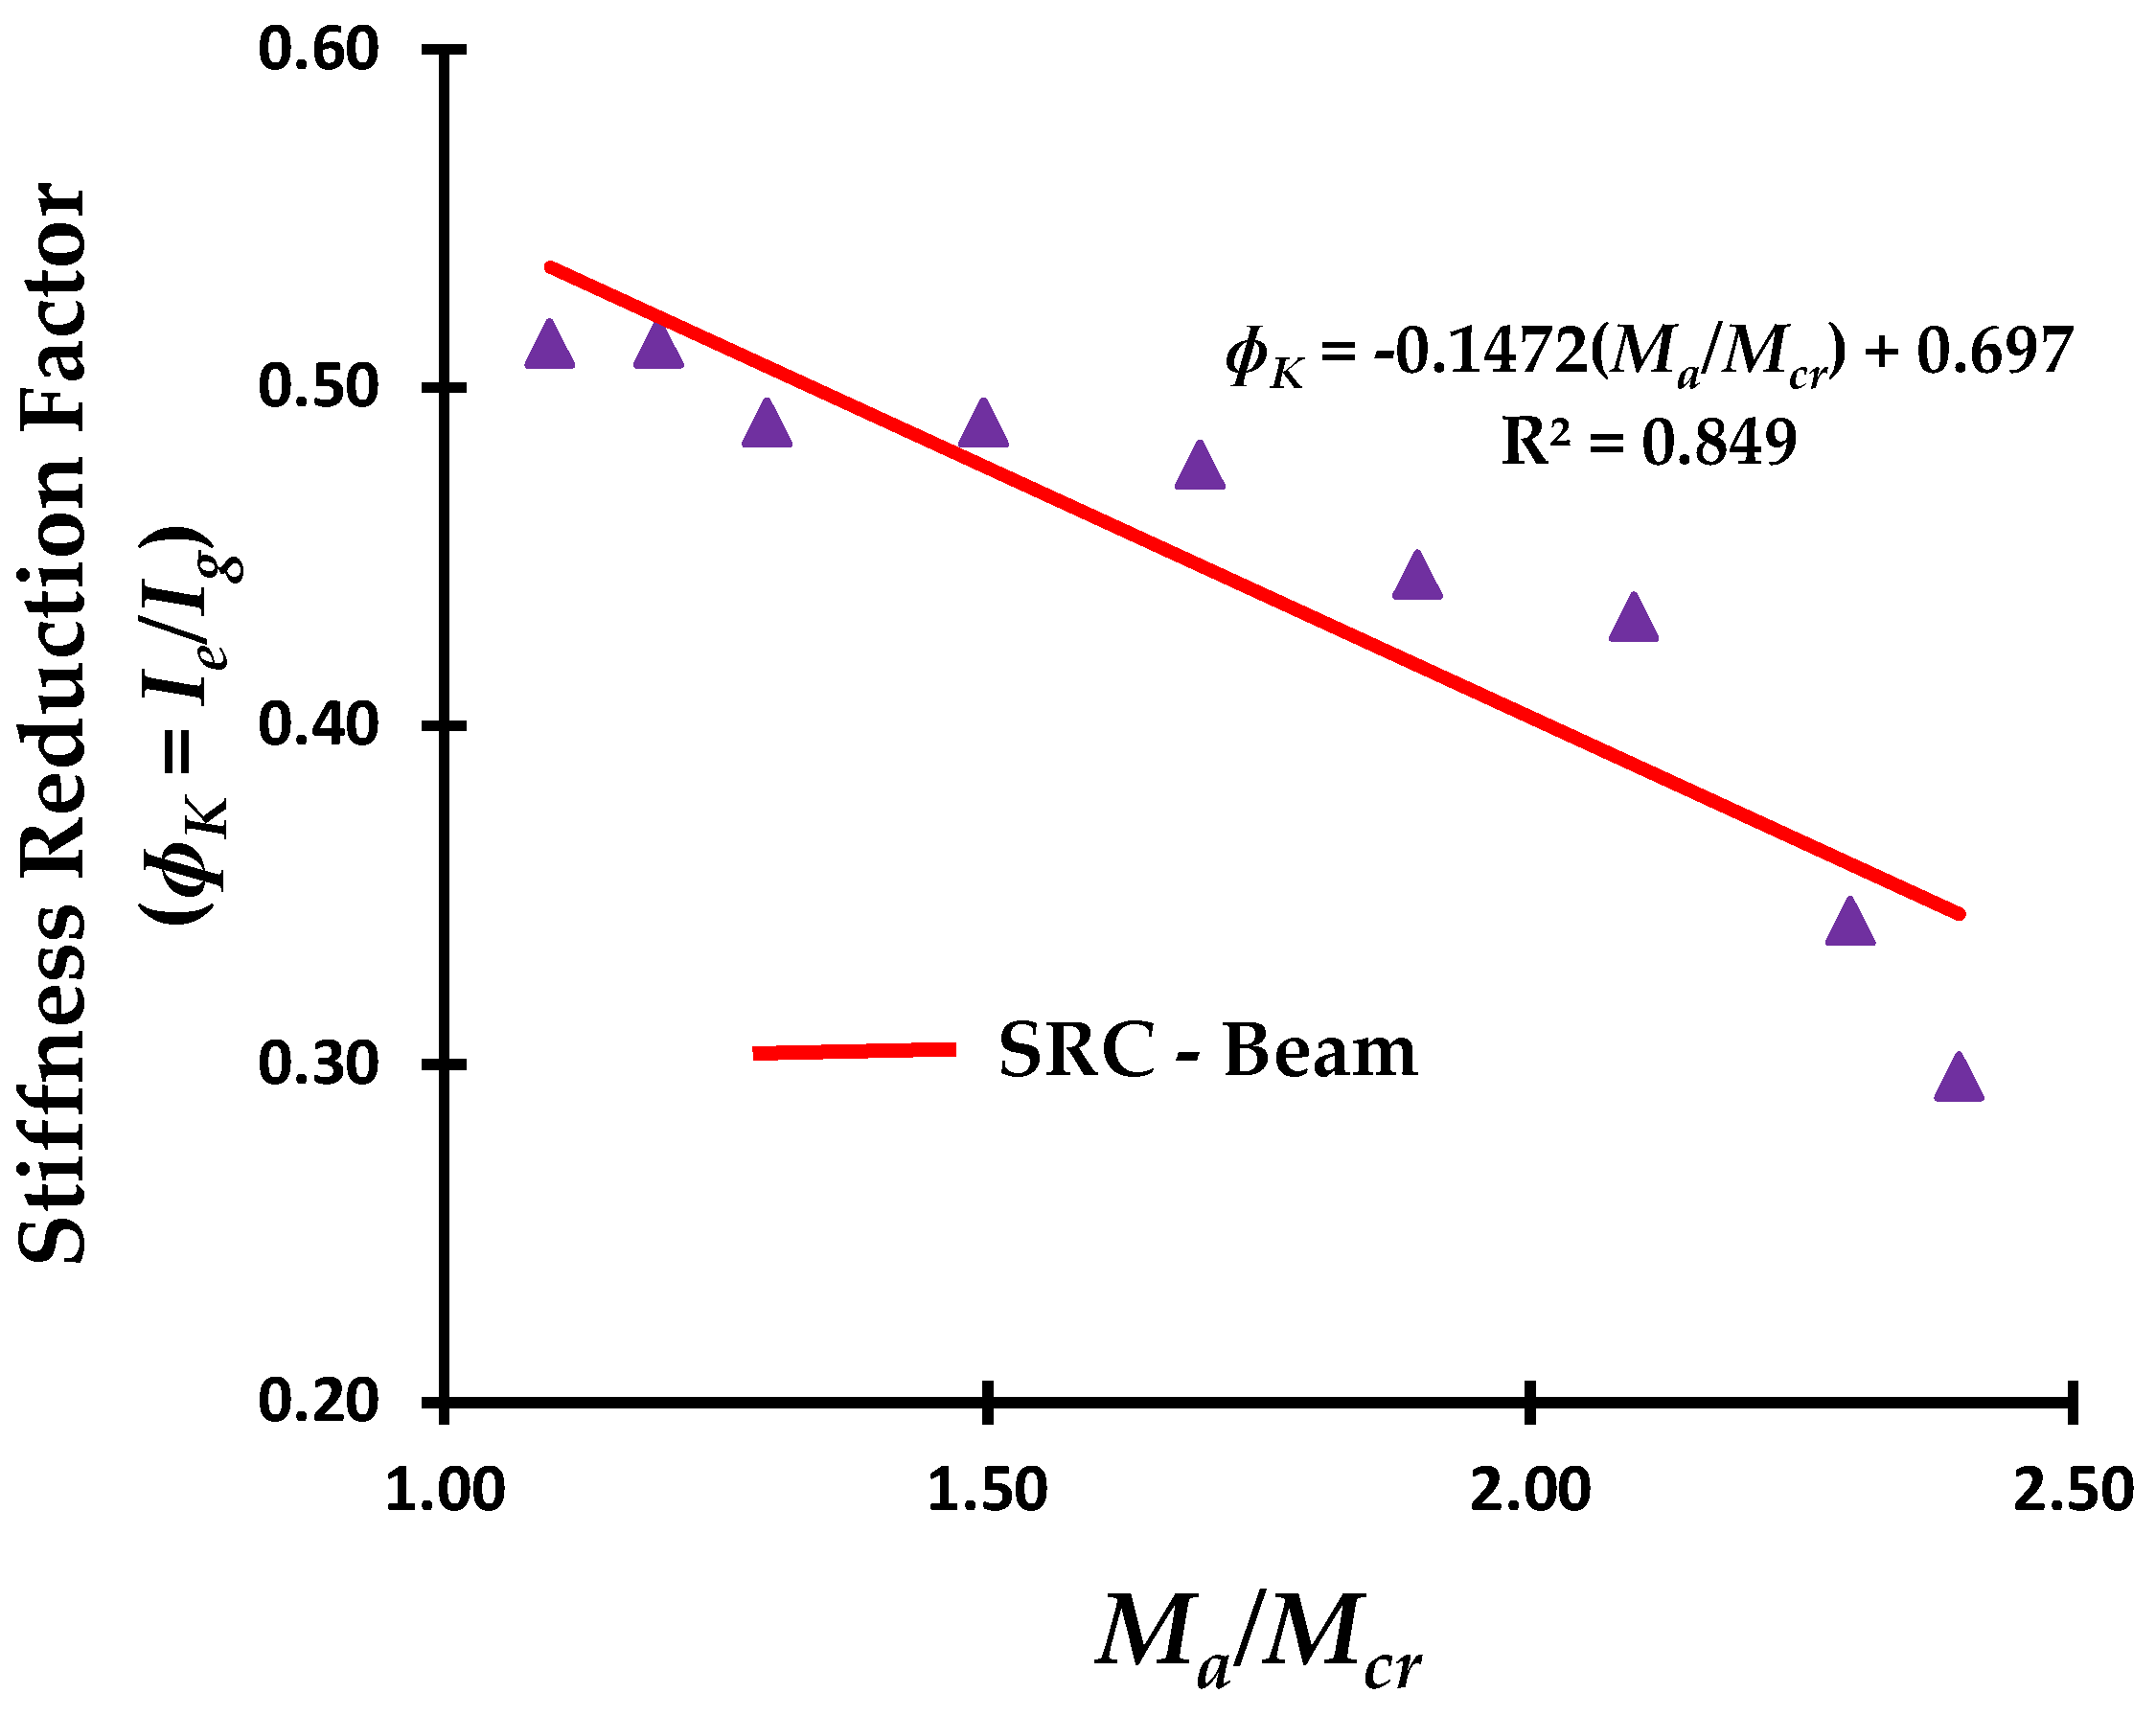
Figure 25 and Figure 26 show the relationship between the stiffness reduction factor (ϕK) and the Ma/Mcr of the BRC beam and the SRC beam. The stiffness reduction factor (ϕK) is the ratio of the moment of inertia of the effective section (Ie) divided by the moment of inertia of the cross-section (Ig). The stiffness reduction factor (ϕK) is significantly influenced by the applied moment level. The equation of the beam stiffness reduction factor is related to the ratio between the applied moment and an initial crack moment or Ma/Mcr. The equation for the stiffness reduction factor is shown in Equation (5) or Equation (6) for a BRC beam. The stiffness reduction factor equation for the SRC beam is shown in Equation (7) or Equation (8). Figure 27 shows a comparison of the relationship between the stiffness reduction factor and the Ma/Mcr of the BRC beam and SRC beam. The diagram of the relationship between the stiffness reduction factor and Ma/Mcr shows that the SRC beam has a smaller stiffness reduction factor than the BRC beam in the non-linear phase. However, the SRC beam shows a collapse at the moment of inertia of the effective cross-section (Ie), which is relatively still large when compared to BRC beams. BRC beams collapse at the effective cross-section inertia of about 5%, and SRC beams collapse at the effective section inertia of about 40%. The alternative of moments of inertia from various sources is shown in Table 9.
ϕ K = 0.646 0.1023 ( M a M c r )
I e I g = 0.646 0.1023 ( M a M c r )
ϕ K = 0.697 0.1472 ( M a M c r )
I e I g = 0.697 0.1472 ( M a M c r )

5. Conclusions

The relationship pattern of load vs. displacement reflects the stiffness pattern of structural elements. The properties and characteristics of the material in the reinforcing concrete elements have a dominant influence on the relationship pattern of the load vs. displacement of reinforced concrete elements. Bamboo reinforced concrete beams (BRC) have a different load vs. displacement relationship pattern when compared to steel reinforced concrete beams (SRC). BRC beams have elastic properties and high resilience properties that can accept high impact loads without causing over stress at the elastic limit, even though displacement has occurred. While SRC beams have high stiffness and toughness so that SRC beams are not subject to excessive displacement or deformation at service load ranges or elastic conditions.
Results of the validation of the relationship pattern of the load vs. displacement of the BRC beams shows that the ANN model has a higher R2 value when compared to the R2 value of the MLR model. ANN analysis has a higher prediction accuracy. The accuracy of the prediction depends very much on the number of input variables. The greater the number of input parameters, the more accurate the prediction model results.
The cross-sectional stiffness of BRC beams is reduced by 50% after initial cracking and reduced by 95% at collapse. The cross-sectional stiffness of the SRC beam was reduced by 25% after initial cracking and reduced by 60% at collapse. The reduction in stiffness is significantly affected by the amount of applied moment (Ma) or the load applied that caused cracks and a reduction in the moment of inertia of the cross-section.
The initial decrease in cross-sectional stiffness of BRC beams occurs at a load of about 24% of the ultimate load and BRC beams occur at loads of about 40% ultimate load. BRC beam collapse occurs when the moment of inertia of the effective cross-section (Ie) is 5%, while the SRC beam collapse occurs when the moment of inertia of the effective cross-section (Ie) is 40%. The reduction in stiffness in the cross-section of the beam in the non-linear phase ranged from 0.5Ig–0.05Ig for BRC beams, and 0.75Ig–0.40Ig for SRC beams. ACI-318M-14 standard recommends the cross-sectional stiffness of reinforced concrete beams for elastic analysis in the non-linear phase of 0.5Ig–0.25Ig.
The SRC beams have a smaller stiffness reduction factor (ϕK) than BRC beams in the non-linear phase. However, the SRC beam shows a collapse at the moment of inertia of the effective cross-section (Ie), which is relatively large when compared to BRC beams.

Funding

APC financing entirely by the DPRM Republic of Indonesia and LPPM of the University of Muhammadiyah Jember, Indonesia.

Acknowledgments

My gratitude goes to the LPPM of the Muhammadiyah University of Jember, Indonesia, and DPRM of the Republic of Indonesia as the funder of this research and APC.

Conflicts of Interest

The author declares no conflict of interest.

References

  1. Pandey, K.K.; Ramakantha, V.; Chauhan, S.S.; Kumar, A.A. Wood is Good; Springer: Singapore, 2017. [Google Scholar]
  2. Mohammadabadi, M.; Jarvis, J.; Yadama, V.; Cofer, W. Predictive Models for Elastic Bending Behavior of a Wood Composite Sandwich Panel. Forests 2020, 11, 624. [Google Scholar] [CrossRef]
  3. Ministry of Environment and Forestry of the Republic of Indonesia. Memanfaatkan Bambu Sebagai Salah Satu Potensi Hutan Rakyat. 18 October 2018. Available online: https://www.menlhk.go.id/site/single_post/1444 (accessed on 24 October 2020).
  4. Han, S.W.; Park, Y.M.; Kee, S.H. Stiffness Reduction Factor for Flat Slab Structures under Lateral Loads. J. Struct. Eng. 2009, 135, 743. [Google Scholar] [CrossRef]
  5. ACI Committee 318 Standard. Building Code Requirements for Structural Concrete; American Concrete Institute: Farmington Hills, MI, USA, 2014. [Google Scholar]
  6. Gunasti, A.; Dewi, I.C.; Dasuki, M.; Ariyani, S.; Mahmudi, I.; Abadi, T.; Rahman, M.; Hidayatullah, S.; Nilogiri, A.; Galuh, S.D.; et al. The Prediction of Stiffness of Bamboo-Reinforced Concrete Beams Using Experiment Data and Artificial Neural Networks (ANNs). Crystals 2020, 10, 757. [Google Scholar]
  7. Muhtar; Dewi, S.M.; Wisnumurti; Munawir, A. Enhancing bamboo reinforcement using a hose-clamp to increase bond-stress and slip resistance. J. Build. Eng. 2019, 26, 100896. [Google Scholar] [CrossRef]
  8. Muhtar; Dewi, S.M.; Wisnumurti; Munawir, A. The flexural behavior model of bamboo reinforced concrete beams using a hose clamp. Proc. Mater. Sci. Eng. Chem. 2019, 276, 1033. [Google Scholar] [CrossRef] [Green Version]
  9. Zhang, K.; Zhang, J.; Jin, W.; Mao, J.; Long, J. Stiffness degradation for the fatigue of reinforced concrete beams after electrochemical rehabilitation. Constr. Build. Mater. 2020, 260, 120455. [Google Scholar] [CrossRef]
  10. Salam, A.S.A.; Debra, L.F. Use of negative stiffness in failure analysis of concrete beams. Eng. Struct. 2016, 126, 187–199. [Google Scholar]
  11. Hu, H.S.; Nie, J.G.; Wang, Y.H. Effective stiffness of rectangular concrete-filled steel tubular members Hong-Song. J. Constr. Steel Res. 2016, 116, 233–246. [Google Scholar] [CrossRef]
  12. Patel, K.A.; Bhardwaj, A.; Chaudhary, S.; Nagpal, A. Explicit expression for effective moment of inertia of RC beams. Lat. Am. J. Solids Struct. 2015, 12, 542–560. [Google Scholar] [CrossRef] [Green Version]
  13. Fu, C.; Wang, Y.; Tong, D. Stiffness Estimation of Cracked Beams Based on Nonlinear Stress Distributions Near the Crack. Math. Probl. Eng. 2018, 2018, 5987973. [Google Scholar] [CrossRef] [Green Version]
  14. Pique, J.R.; Burgos, M. Effective rigidity of reinforced concrete elements in seismic analysis and design. In Proceedings of the 14 World Conference on Earthquake Engineering, Beijing, China, 12–17 October 2008. [Google Scholar]
  15. Akmaluddin, A.; Pathurahman. Effective Moment of Inertia Approach for Predicting Displacement of Concrete Beams Reinforced with Twisted Bamboo Cables. Int. J. Civ. Environ. Eng. IJCEE-IJENS 2012, 12, 6–13. [Google Scholar]
  16. Kalkan, İ. Displacement Prediction for Reinforced Concrete Beams through Different Effective Moment of Inertia Expressions. Int. J. Eng. Res. Dev. 2013, 5, 1. [Google Scholar]
  17. Fu, C.; Tong, D.; Wang, Y. Assessing the Instantaneous Stiffness of Cracked Reinforced Concrete Beams Based on a Gradual Change in Strain Distributions. Adv. Mater. Sci. Eng. 2020, 2020, 7453619. [Google Scholar] [CrossRef] [Green Version]
  18. Feng, X.; Shen, M.; Sun, C.; Chen, J.; Luo, P. Research on flexural stiffness reduction factor of the reinforced concrete column with equiaxial shaped section. In Proceedings of the 13th COTA International Conference of Transportation Professionals (CICTP 2013), Shenzhen, China, 13–16 August 2013; pp. 168–174. [Google Scholar]
  19. Muhtar; Dewi, S.M.; Wisnumurti; Munawir, A. The stiffness and cracked pattern of bamboo reinforced concrete beams using a hose clamp. Int. J. Civ. Eng. Technol. 2018, 9, 273–284. [Google Scholar]
  20. Agarwal, A.; Nanda, B.; Maity, D. Experimental investigation on chemically treated bamboo reinforced concrete beams and columns. Constr. Build. Mater. 2014, 71, 610–617. [Google Scholar] [CrossRef]
  21. Muhtar. Experimental data from strengthening bamboo reinforcement using adhesives and hose-clamps. Data Brief 2019, 27, 104827. [Google Scholar] [CrossRef]
  22. Rahman, M.M.; Rashid, M.H.; Hossain, M.A.; Hasan, M.T.; Hasan, M.K. Performance evaluation of bamboo reinforced concrete beam. Int. J. Eng. Technol. IJET-IJENS 2011, 11, 113–118. [Google Scholar]
  23. Muhtar. Precast Bridges of Bamboo Reinforced Concrete in Disadvantaged Village Areas in Indonesia. Appl. Sci. 2020, 10, 7158. [Google Scholar] [CrossRef]
  24. Ghavami, K. Bamboo as reinforcement in structural concrete elements. Cem. Concr. Compos. 2005, 27, 637–649. [Google Scholar] [CrossRef]
  25. Javadian, A.; Wielopolski, M.; Smith, I.F.C.; Hebel, D.E. Bond-behavior study of newly developed bamboo-composite reinforcement in concrete. Constr. Build. Mater. 2016, 122, 110–117. [Google Scholar] [CrossRef]
  26. Muhtar, M.; Dewi, S.; Wisnumurti; Munawir, A. Bond-slip improvement of bamboo reinforcement in the concrete beam using hose clamps. In Proceedings of the 2nd International Multidisciplinary Conference, Jakarta, Indonesia, 15 November 2016; pp. 385–393. [Google Scholar]
  27. Gunasti, A.; Manggala, A.S.; Nusant, A.F.P.; Nilogiri, A. Effect of Reinforcement Details on Precast Bridge Frames of Bamboo Reinforced Concrete to Load Capacity and Crack Patterns. Int. J. Eng. Res. Technol. 2020, 13, 631–636. [Google Scholar]
  28. Muhtar. Cracked Pattern of Bamboo Reinforced Concrete Beams Using Double Reinforcement with the Strengthening on Tensile Reinforcement. Int. J. Eng. Res. Technol. 2020, 13, 608–612. [Google Scholar]
  29. ASTM C 39 Standard. Standard Test Method for Compressive Strength of Cylindrical Concrete Specimens; ASTM International: West Conshohocken, PA, USA, 2003. [Google Scholar]
  30. PT SIKA Indonesia. Sikadur®-752. 02, 2-3. 2016. Available online: https://www.scribd.com/document/374071630/Sikadur-752 (accessed on 24 October 2020).
  31. ASTM C 09 Standard. Standard Test Method for Flexural Strength of Concrete (Using Simple Beam with Third-Point Loading); ASTM International: West Conshohocken, PA, USA, 2002. [Google Scholar]
  32. Muhtar. Numerical validation data of tensile stress zones and crack zones in bamboo reinforced concrete beams using the Fortran PowerStation 4.0 program. Data Brief 2020, 29, 105332. [Google Scholar] [CrossRef]
  33. Avram, C.; Facaoaru, I.; Filimon, I.; Mirsu, O.; Tertea, I. Concrete Strength and Strain. In Developments in Civil Engineering 3; Elsvier S.P. Company: New York, NY, USA, 1981. [Google Scholar]
  34. Naderpour, H.; Kheyroddin, A.; Amiri, G.G. Prediction of FRP-confined compressive strength of concrete using artificial neural networks. Compos. Struct. 2010, 92, 2817–2829. [Google Scholar] [CrossRef]
  35. Ahmadi, M.; Naderpour, H.; Kheyroddin, A. Utilization of artificial neural networks to prediction of the capacity of CCFT short columns subject to short term axial load. Arch. Civ. Mech. Eng. 2014, 14, 510–517. [Google Scholar] [CrossRef]
  36. Khademi, F.; Akbari, M.; Nikoo, M. Displacement determination of concrete reinforcement building using data-driven models. Int. J. Sustain. Built Environ. 2017, 6, 400–411. [Google Scholar] [CrossRef]
  37. Kaczmarek, M.; Szymanska, A. Application of Artificial Neural Networks to Predict the Displacements of Reinforced Concrete Beams. Studia Geotech. Mech. 2016, 38, 37–46. [Google Scholar] [CrossRef] [Green Version]
  38. Abd, A.M.; Salman, W.D.; Ahmed, Q.W. ANN, and Statistical Modelling to Predict the Displacement of Continuous Reinforced Concrete. Diyala J. Eng. Sci. 2015, 08, 134–143. [Google Scholar]
  39. Ya Tuan, T.M.Y.S.; Alebrahim, R.; Fitri, N.; Alebrahim, M. Analysis of Cantilever Beam Displacement under Uniformly Distributed Load using Artificial Neural Networks. In Proceedings of the MATEC Web of Conferences, Los Angeles, CA, USA, 3–4 February 2018. [Google Scholar]
  40. Khademi, F.; Akbari, M.; Mohammadmehdi, S.; Nikoo, M. Multiple linear regression, artificial neural network, and fuzzy logic prediction of 28 days compressive strength of concrete. Front. Struct. Civ. Eng. 2017, 11, 90–99. [Google Scholar] [CrossRef]
  41. Li, X.; Khademi, F.; Liu, Y.; Akbari, M.; Wang, C.; Bond, P.L.; Keller, J.; Jiang, G. Evaluation of data-driven models for predicting the service life of concrete sewer pipes subjected to corrosion. J. Environ. Manag. 2019, 234, 431–439. [Google Scholar] [CrossRef]
  42. Dewi, S.M.; Nuralinah, D. The Recent Research on Bamboo Reinforced Concrete. MATEC Web Conf. 2017, 103, 2001. [Google Scholar] [CrossRef] [Green Version]
  43. Nathan, S. Application of Bamboo for Flexural and Shear Reinforcement in Concrete Beams; Clemson University: Clemson, SC, USA, 2014. [Google Scholar]
  44. Khare, L. Performance Evaluation of Bamboo Reinforced Concrete Beams; UT Arlington: Arlington, TX, USA, 2005. [Google Scholar]
  45. Mishra, M.; Agarwal, A.; Maity, D. Neural-network-based approach to predict the displacement of plain, steel-reinforced, and bamboo-reinforced concrete beams from experimental data. SN Appl. Sci. 2019, 1, 584. [Google Scholar] [CrossRef] [Green Version]
  46. FEMA 356 Standard. Prestandard and Commentary for the Seismic Rehabilitation of Buildings; American Society of Civil Engineers: Reston, VA, USA, 2000. [Google Scholar]
  47. New Zealand Standard. Code of Practice for the Design of Concrete Structures; Part 1; Standards New Zealand: Wellington, New Zealand, 1995. [Google Scholar]
  48. Paulay, T.; Priestley, M.J.N. Seismic Design of Reinforced Concrete and Masonry Buildings; Wiley Interscience: New York, NY, USA, 1992. [Google Scholar]
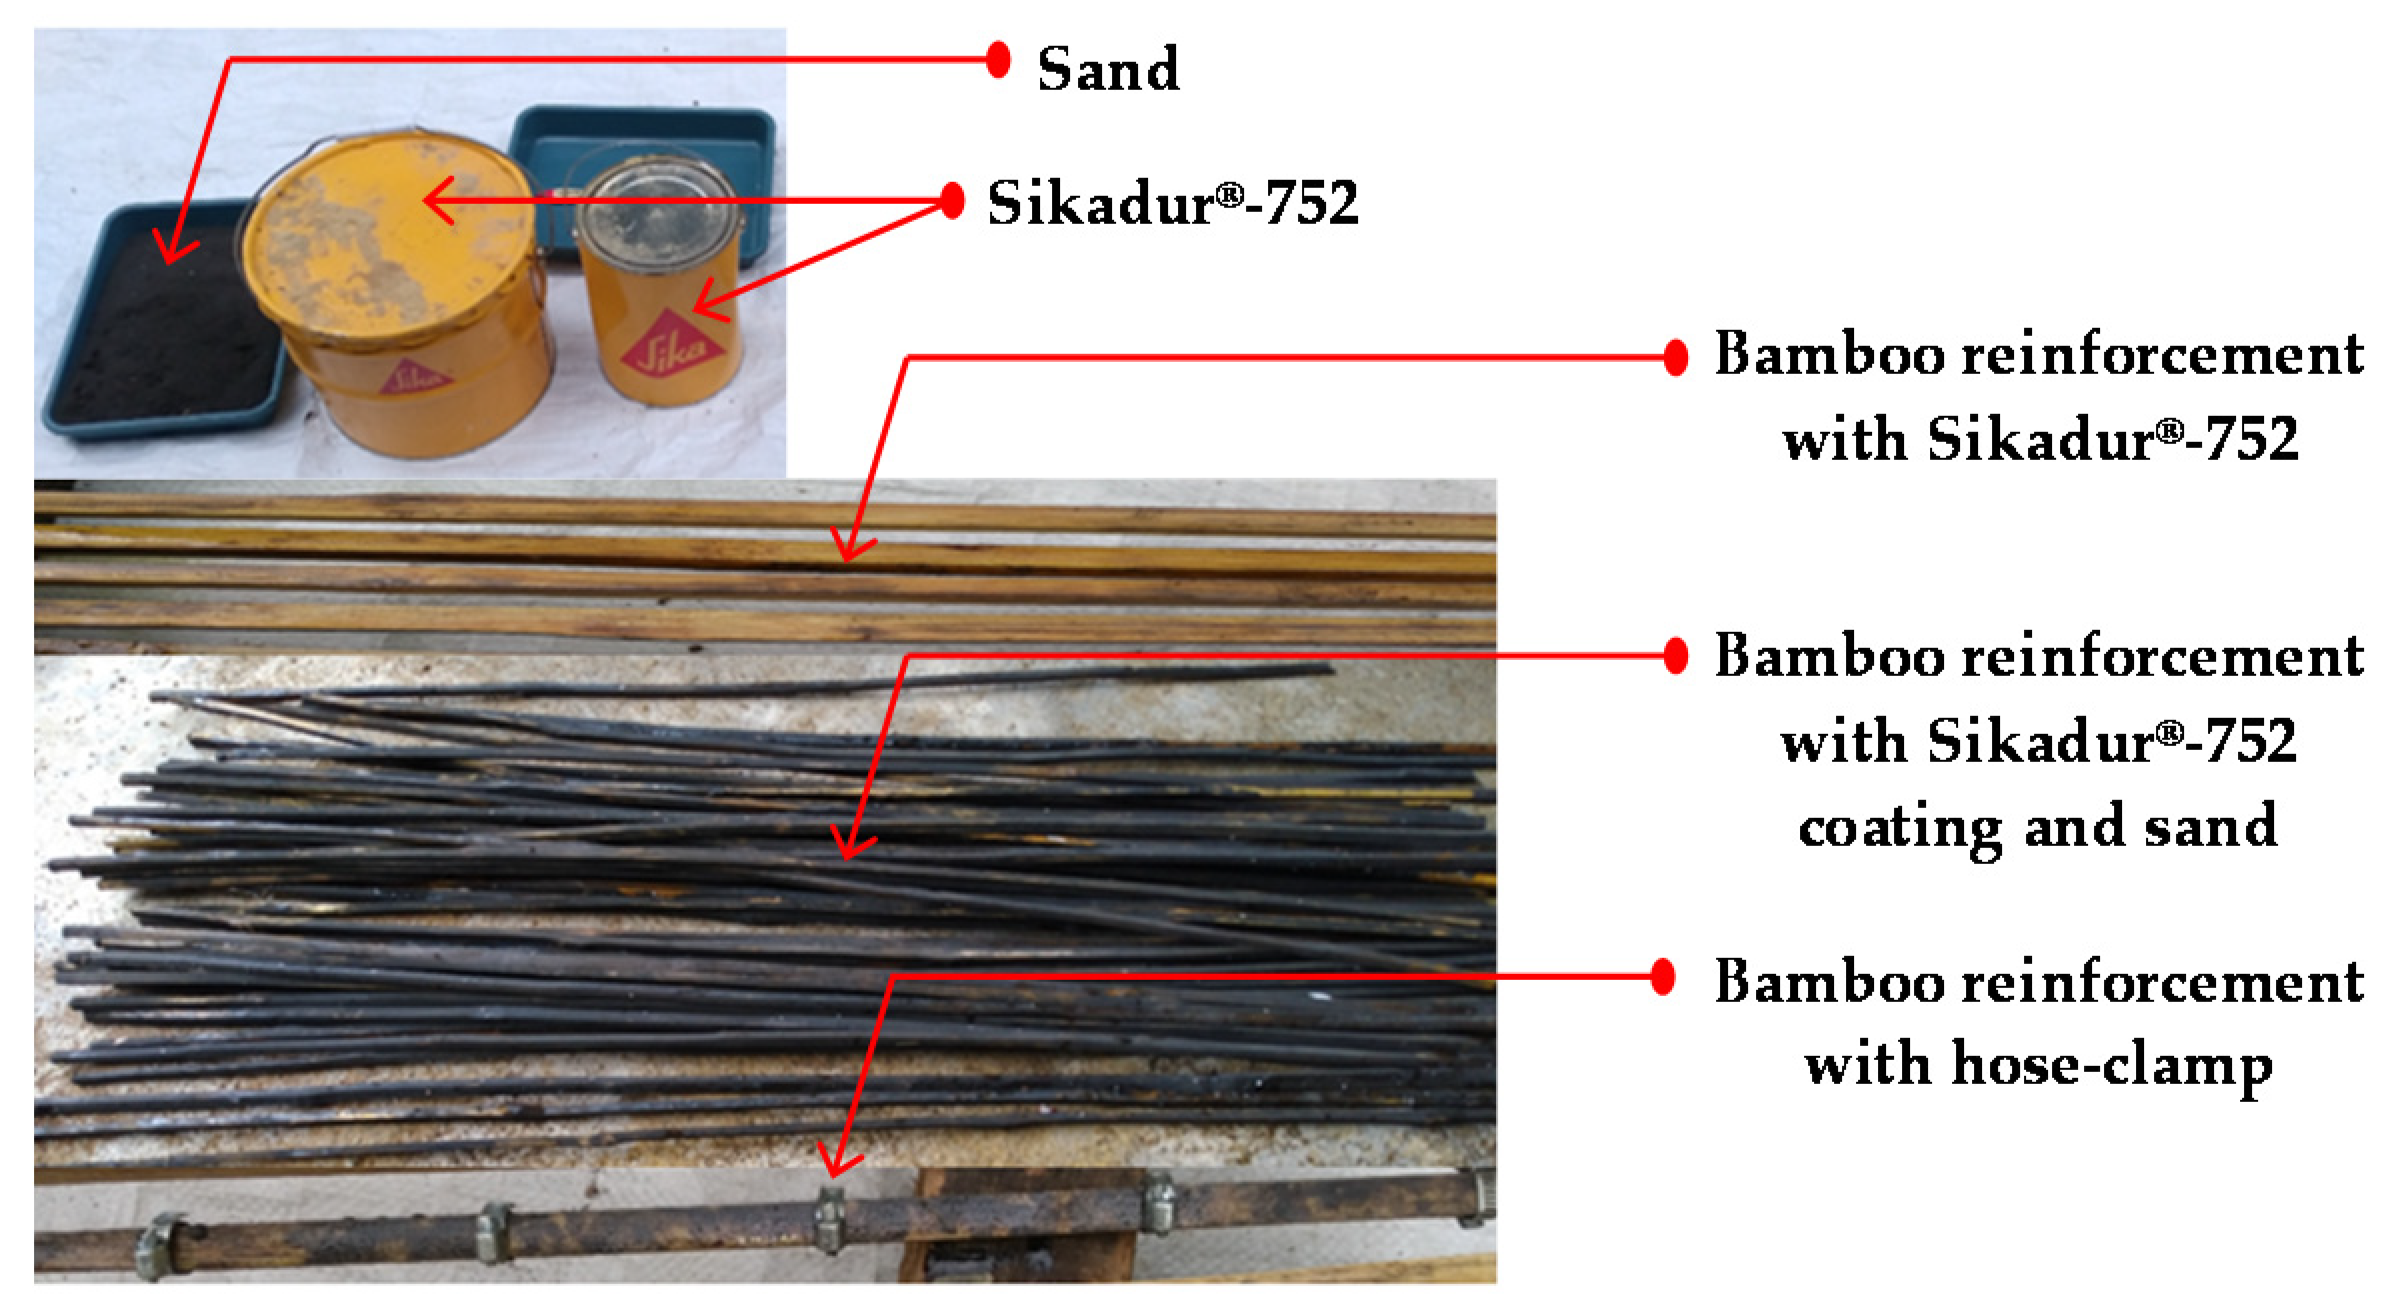
Figure 1. The materials and treatments of bamboo reinforcement.
Forests 11 01313 g001
Figure 2. Reinforcement details and beam test settings.
Forests 11 01313 g002
Figure 3. Discretization of the triangular element on the bamboo reinforced concrete (BRC) beam.
Forests 11 01313 g003
Figure 4. Discretization of the triangular element on the steel-reinforced concrete (SRC) beam.
Forests 11 01313 g004
Figure 5. Schematic of Artificial Neural Networks (ANN) model architecture for BRC beam and SRC beam.
Forests 11 01313 g005
Figure 6. The relationship of load vs. displacement of BRC beam of experimental results.
Forests 11 01313 g006
Figure 7. The relationship of load vs. displacement of SRC beam of experimental results.
Forests 11 01313 g007
Figure 8. Prediction of the load vs. displacement relationship using ANN and using experimental observation for the training, validation, testing, and all datasets (BRC-1).
Forests 11 01313 g008
Figure 9. Prediction of the load vs. displacement relationship using ANN and using experimental observation for the training, validation, testing, and all datasets (BRC-2).
Forests 11 01313 g009
Figure 10. Prediction of the load vs. displacement relationship using ANN and using experimental observation for the training, validation, testing, and all datasets (BRC-3).
Forests 11 01313 g010
Figure 11. Prediction of the load vs. displacement relationship using ANN and using experimental observation for the training, validation, testing, and all datasets (BRC-4).
Forests 11 01313 g011
Figure 12. Prediction of the load vs. displacement relationship using ANN and using experimental observation for the training, validation, testing, and all datasets (SRC).
Forests 11 01313 g012
Figure 13. The relationship of load vs. displacement of BRC beam of ANN results.
Forests 11 01313 g013
Figure 14. The relationship of load vs. displacement of BRC beam of finite element method (FEM) results.
Forests 11 01313 g014
Figure 15. The displacement contour of Y-direction of BRC beam.
Forests 11 01313 g015
Figure 16. The displacement contour of Y-direction of SRC beam.
Forests 11 01313 g016
Figure 17. The stress contour of X-direction of BRC beam.
Forests 11 01313 g017
Figure 18. The stress contour of X-direction of SRC beam.
Forests 11 01313 g018
Figure 19. The combined of the load vs. displacement relationship of BRC beam of the experimental results and ANN analysis.
Forests 11 01313 g019
Figure 20. The combined of the load vs. displacement relationship of BRC beam and SRC beam of the experimental results, ANN analysis, and FEM.
Forests 11 01313 g020
Figure 21. Decreased stiffness of BRC beam cross-section in the span middle.
Forests 11 01313 g021
Figure 22. Decreased stiffness of SRC beam cross-section in the span middle.
Forests 11 01313 g022
Figure 23. The crack pattern and tensile stress zone of BRC beam.
Forests 11 01313 g023
Figure 24. The crack pattern and tensile stress zone of SRC beam.
Forests 11 01313 g024
Figure 25. The relationship of the stiffness reduction factor (ϕK) and the Ma/Mcr of the BRC beam.
Forests 11 01313 g025
Figure 26. The relationship of the stiffness reduction factor (ϕK) and the Ma/Mcr of the SRC beam.
Forests 11 01313 g026
Figure 27. Comparison of the relationship of the stiffness reduction factor (ϕK) and the Ma/Mcr of the BRC beam and SRC beam.
Forests 11 01313 g027
Table 1. Material properties of reinforcing and concrete.
Bar Type and ConcreteDiameter, d (mm)Modulus of Elasticity (E), (MPa)Poisson’s Ratio (ν)Tensile Strength, fy (MPa)Compressive Strength, f′c (MPa)
Bamboo□ 15 × 1517,235.740.20126.68-
Steelϕ 8207,735.920.25392.28-
Concrete-26,324.790.30-31.31
□: a sign of the rectangular cross-sectional shape of bamboo reinforcement.
Table 2. The specification of Sikadur®-752 [30].
ComponentsProperties
ColorYellowish
DensityApprox. 1.08 kg/L
Mix comparison (weight/volume)2:1
Pot life at +30 °C35 min
Compressive strength62 MPa at 7 days (ASTM D-695)
64 MPa at 28 days
Tensile strength40 MPa at 28 days (ASTM D-790)
Tensile Adhesion Strength2 MPa (Concrete failure, over mechanically prepared concrete surface)
Coefficient of Thermal Expansion−20 °C to + 40 °C
89 × 10−6 per °C
Modulus of elasticity1060 MPa
Table 3. Elasticity Modulus of Composite of BRC beam.
Layer NumberCompressive Strength of Concrete, f′cDimensions of per LayerModulus of Elasticity of the Material (E)Elasticity Modulus of Composite (Ecomp)
Mpab (mm)h (mm)Concrete, Ec (MPa)Bamboo, Eb
(MPa)
MPa
4th mesh layer31.31755026,851.29026,851.29
3rd mesh layer31.31756026,851.29026,851.29
2nd mesh layer31.31751526,851.291723.5723,140.89
1st mesh layer31.31752526,851.29026,851.29
Table 4. Elasticity Modulus of Composite of SRC beam.
Layer NumberCompressive Strength of Concrete, f′cDimensions of per Layer Modulus of Elasticity of the Material (E)Elasticity Modulus of Composite (Ecomp)
Mpab (mm)h (mm)Concrete, Ec (MPa)Steel, Es
(MPa)
MPa
4th mesh layer31.3155026,851.29026,851.29
3rd mesh layer31.31756726,851.29026,851.29
2nd mesh layer31.3175826,851.29207,735.9243,209.32
1st mesh layer31.31752526,851.29026,851.29
Table 5. Results of theoretical calculations and experimental for the load capacity of BRC beams and SRC beams.
SpecimensSample NoTheoretical CalculationsFlexural Test Results
First Crack Load (kN)Ultimate Load (kN)First Crack Load, Pcr (kN)Failure Load, Pult (kN)Displacement at Failure (mm)Pcr/Pult
(%)
(a) BRC-116.9032.208.5031.5010.9226.98
28.0029.0011.9027.59
(b) BRC-237.0031.0013.0222.58
47.5033.0012.1822.73
(c) BRC-358.0033.5014.6923.88
67.5033.009.3222.73
(d) BRC-477.5029.507.6125.42
87.5030.0010.6925.00
Average: 7.6931.31 24.61
(e) SRC96.5024.2010.0024.006.3341.57
Table 6. The validation results of the relationship load vs. displacement using the ANN method.
SpecimensThe Correlation Coefficient (R)Mean Square Error (MSE)
TrainingValidationTestingTrainingValidationTesting
BRC-11.00000.99990.99970.00040.00110.0110
BRC-20.99990.99970.99990.00380.02760.0048
BRC-30.99980.99990.99930.00340.00750.0152
BRC-41.00001.00001.00000.00010.00090.0010
SRC1.00001.00000.99970.00010.00270.0006
Table 7. The modulus of elasticity for each layer of the BRC beam in the non-linear phase.
Layer NumberModulus of Elasticity (E) of the BRC Beam
Elastic ConditionPlastic Conditions with Gradual Loads
0–8.5 kN9 kN11 kN13 kN15 kN17 kN19 kN21 kN23 kN25 kN27 kN29 kN31 kN33 kN
4th mesh layer26,851.2916,110.7716,110.7716,110.7716,110.7716,110.7716,110.7716,110.7716,110.7716,110.7712,083.0811,277.5411,277.548592.41
3th mesh layer26,851.2916,110.7716,110.7716,110.7716,110.7716,110.7716,110.7716,110.7716,110.771208.3110,740.529397.959397.957518.36
2nd mesh layer23,140.8913,884.5311,570.4411,570.4411,570.4411,570.4410,413.4010,413.4010,413.4010,413.406942.276942.276942.275553.81
1st mesh layer26,851.2913,425.6511,814.5710,203.498323.906712.825101.755101.755101.753759.183222.162685.131611.081329.14
Table 8. The modulus of elasticity for each layer of the SRC beam in the non-linear phase.
Layer NumberModulus of Elasticity (E) of the SRC Beam
Elastic ConditionPlastic Conditions with Gradual Loads
0–9 kN10 kN11 kN12 kN13 kN15 kN17 kN19 KN21 KN23 kN24 kN
4th mesh layer26,851.2926,851.2920,138.4720,138.4720,138.4720,138.4720,138.4718,795.9018,795.9013,425.6511,411.80
3th mesh layer26,851.2926,851.2920,138.4720,138.4718,795.9018,795.9018,795.9017,453.3417,453.3413,425.6511,411.80
2nd mesh layer43,209.3243,209.3230,586.9330,586.9328,547.8028,547.8026,508.6726,508.6724,469.5420,391,2917,332.60
1st mesh layer26,851.2926,851.2920,138.4720,138.4718,795.9018,795.9017,453.3416,110.7714,768.2113,425.6512,083.08
Table 9. The alternative value of I for elastic analysis from various sources.
Source and InformationAlternative Value of I for Elastic Analysis
ACI-318M-14 [5]0.25Ig–0.5Ig
FEMA 356-2000 [46]0.5 EIg–0.8EIg
New Zealand Code [47]0.35Ig
Paulay and Priestley, 1992 [48]0.30Ig–0.50Ig
In this research (singly reinforced beam)
-BRC Beam0.05Ig–0.5Ig
-SRC Beam0.4Ig–0.75Ig
Publisher’s Note: MDPI stays neutral with regard to jurisdictional claims in published maps and institutional affiliations.