Article

Management Intensity and Forest Successional Stages as Significant Determinants of Small Mammal Communities in a Lowland Floodplain Forest

1
Department of Zoology, Fisheries, Hydrobiology and Apiculture, Faculty of AgriSciences, Mendel University in Brno, Zemědělská 1, 613 00 Brno, Czech Republic
2
Department of Forest Protection and Wildlife Management, Faculty of Forestry and Wood Technology, Mendel University in Brno, Zemědělská 3, 613 00 Brno, Czech Republic
*
Author to whom correspondence should be addressed.
Forests 2020, 11(12), 1320; https://doi.org/10.3390/f11121320
Submission received: 24 November 2020 / Revised: 6 December 2020 / Accepted: 8 December 2020 / Published: 11 December 2020
(This article belongs to the Section Forest Ecology and Management)

Abstract

:
The conversion of forests from complex natural ecosystems to simplified commercial woodlands is one of the major causes of biodiversity loss. To maintain biodiversity, we need to understand how current management practices influence forest ecosystems. We studied the effects of forest successional stage and management intensity on the abundance, species richness, and assemblage composition of small mammals. Our results show that management intensity significantly contributes to reducing the number of species after clearcutting. We revealed that intensively managed clearings can make the dispersal or foraging activity of small mammals difficult and hence negatively influence their abundance and species richness. The significantly higher species richness of small mammal species was recorded within more extensively rather than intensively managed clearings. In contrast, we did not observe significant changes in species richness and abundance after intensive management in old-growth forests. Species Clethrionomys glareolus and Apodemus flavicollis reached the greatest abundance in old-growth forest patches. On the other hand, Microtus arvalis and Microtus subterraneus were species mainly associated with the successionally youngest forest stands. Our analysis suggests that intensive management interventions (i.e., vegetation destruction by pesticides and wood debris removal by soil milling) in clearings produce unhostile environments for majority of the small mammal species.

1. Introduction

Nowadays, 34% of the Czech Republic area is covered by woodland of which most of the area is occupied by commercial forests [1]. Commercial forests are managed by different types of harvesting practices. The dominant forest management practice is using clearcutting as a logging technique, which is often followed by mechanical site preparation presented by soil milling (especially in lowland floodplain forests). Clearcutting also generates forest stands of different ages, introducing a mosaic of spatially divided stands to a landscape, which ranges from more open habitats to strongly shaded habitats (i.e., forest cycling). Only a small proportion of commercial forests are covered by old-growth forest stands [2]. A number of studies have demonstrated that even commercial forests provide good conditions for various species of organisms and thus support biodiversity [3,4,5,6]. The high number of species in managed commercial forests is largely due to the between site variations [7,8]. On the other hand, a number of studies have demonstrated that intensively managed forest plantations negatively influence the diversity of carabids [9,10], birds [11,12], moths [13], and plants [14]. The impact of commercial forests can also be seen in the composition and abundance of individual species [4,5,15]. For instance, most of the species of litter-dwelling arthropods in open habitats are small macropterous species with good dispersal abilities. On the other hand, closed canopy forest sites have a higher proportion of large carnivorous species [4,15,16].
Retaining the forest biodiversity is one of the main objectives of sustainable forestry [17]. The topic of sustainable forestry should be reflected mostly in the management of European forests because temperate biomes are found to be generally more disturbed than tropical biomes [18]. Central Europe’s temperate forests have been identified as the ecosystems most impacted by human activity, e.g., only 0.2% of the Central European deciduous forests remain in a relatively natural state [18]. It is generally accepted that the maintaining high biodiversity of forests is important for sustaining and promoting ecosystem services in human communities, such as carbon storage, water retention, timber, recreation, and nutrient cycling [19]. Another result of greater biodiversity is the promotion of forest resistance and resilience to human-induced pressures such as global climate change [20]. This natural capacity to mitigate environmental changes is mainly caused by a sufficient species pool with important roles in ecosystem processes, such as pollinators, seed dispersals, predators, herbivores, and decomposers [20].
Forest heterogeneity is a key factor influencing species diversity and composition [21,22,23]. Heterogeneity can be manifested on spatially different scales [24]. On a landscape scale, commercial forests planted in stands of different ages generate a heterogeneous mosaic of spatially divided stands [4,25]. On a stand scale, forests can be influenced by either the complexity of vertical vegetation structure or by the formation of different microhabitats [22,23]. The main difference between commercial and natural forests is that clearcutting significantly decrease forest complexity, mainly at the local scale, because it removes all live and dead wood and gets rid of the herb layer by applying herbicides. On the other hand, biodiversity can be sustained by forest cycling, maintaining spatial heterogeneity on the landscape scale [3,4,5].
Overall, it is well documented that management type and forest stand age are important factors influencing biodiversity and community structure in commercial and noncommercial forests [25,26,27,28]. On the other hand, the combined effect of forest management intensity and stand age has only been sporadically tested on small mammals [29]. Thus, this paper reports the effect of management intensity and forest successional stage on small mammal assemblage.
In this study, we mainly focus on comparing assemblages and the diversity of small mammals in commercial forests at varying age stages and management. We hypothesize that: (i) an intensive type of management in the form of mechanical soil preparation will decrease the biodiversity of forest clearings; (ii) an intensive type of management in the form of cutting understory vegetation will decrease biodiversity in the old-growth forests, and (iii) differently old stands will be invaded by different assemblages of small mammals.

2. Materials and Methods

2.1. Study Area

The study area is situated in the South Moravian Region of the Czech Republic along the alluvium of the lower reach of the River Svratka in the vicinity of the villages of Vranovice and Ivaň (48°57′57 N, 16°36′23 E). The floodplain forests in the alluvium of the lower reach of the River Svratka are important floodplain forest complexes in the Czech Republic, providing heterogeneous conditions in an otherwise unified landscape of southern Moravia [14]. The largest part of the monitored area (25 km2) is covered by hardwood floodplain forest vegetation, Fraxino-Quercion roboris, often with altered tree layers [30]. The study area is dominated mostly by forest plantations of oak Quercus robur L. The other plantations are ash Fraxinus excelsior L., hornbeam Carpinus betulus L., black alder Alnus glutinosa L., and black walnut Juglans nigra L. The plantations are of various ages, from young to matured. All studied locations were commercial forests, afforested with at least 90% representation of Quercus robur used for timber harvesting, except extensive (natural) old-growth forest stands, where logging activities were forbidden. The geological substrate is characterized as black soils on loess. The territory belongs to the Thermophyticum phytogeographical region [31]. The average annual temperature is 9.2 ℃ and the average annual rainfall is 550 mm. Its surrounding landscape is composed mainly by agriculture fields (cereals, sunflowers, oil seed rape).

2.2. Study Design and Sampling

Study sites were divided into 6 age categories and two management type categories. Age categories were as follows: (a) 1 year, (b) 3 years, (c) 10 years, (d) 20 years, (e) 60 years, (f) 120 years. Two types of management of forest clearings (1 year) and old-growth forest (120 years) were recognized: (a) Intensive (commercial) and (b) extensive (natural). There was herbicide application and wide-area mechanical soil preparation (e.g., soil milling, stump removal) on intensively managed clearings. Extensive clearings were without soil preparation and herbicide application. There was only hand-operated mowing of unwanted vegetation during the summer. Intensive (commercial forest, artificially planted) old-growth forests were characterized by a dominant representation of Quercus robur, stands were more open due to logging activities, and the habitat structure was homogeneous. On the other hand, extensive (natural) old-growth forests were highly heterogeneous, with various tree species (naturally regenerated) typical for floodplain forests. The logging operations were forbidden in these habitats.
The study sites of various ages and management intensity were distributed randomly in the study area, with a mean distance between sites (stands) of 625 m (SD = 455,82; range = 280–1850 m). All study sites (forest stands) were of similar size (1 ha). Every age category/management type had three spatial replications, totaling 24 study sites.
The sampling was conducted during the vegetation period of 2016 using 2 different collecting methods at each study site. First, trapping by snaps was carried out during spring (3–6 May) and autumn (2–5 November). Snap traps were laid in line of 20 traps each, approximately 3 m apart such that the total length of each line was about 60 m across the center of each study site. Traps were baited with peanut butter and exposed for 3 successive nights. They were checked once per day in the morning and the bait was replaced if necessary (when eaten away or washed away by precipitation). Secondly, pitfall traps (plastic 500 mL jars, 9 cm in diameter, depth 15 cm), filled up to one-third with a solution of 4% formaldehyde with a few drops of detergent as a killing and preserving agent, were used. In the center of each study site, 5 pitfall traps placed 10 m apart such that the total length of each line was about 50 m. The traps were installed on 10 April and deactivated on 27 September. Traps were emptied monthly. After collecting, the samples were preserved in 70% ethanol. All aspects of trapping complied with EU Council Directive 86/609/EEC on experimental use of animals.

2.3. Evaluation of Environmental Characteristics

In order to assess the influence of forest management on the environmental characteristics and small mammal communities, we measured 5 environmental variables during July 2016: (a) Herbaceous cover, (b) shrub cover, (c) height of litter, (d) amount of woody debris, and (e) canopy openness. The herbaceous and shrub coverage was estimated by eye as a percentage proportion within five 5 × 5 m squares randomly placed within each of the studied site. Woody debris was divided into fine woody debris (FWD) of between 1–10 cm in diameter and coarse woody debris (CWD) of over 10 cm in diameter [32]. FWD was present as fine and thicker twigs in a relatively thin layer on the surface of the soil. CWD was represented by tree stumps, fallen trunks, and thick branches covering the surface of the soil. The quantity on the plot was estimated as the percentage cover on the soil surface within five 5 × 5 m squares randomly placed within each of the studied sites. The height of litter was measured as the thickness from 5 random samples per study site in centimeters using a ruler. The litter depth of each site was determined as the mean of these 5 samples. Canopy openness was classified for each study site using hemispherical images captured 1 meter above the ground for 1 day to rule out seasonal effects (14 July 2016). These images were analyzed and the relative proportion of canopy openness was estimated using the software Gap Light Analyser 2.0 [33].

2.4. Statistical Analyses

2.4.1. Regression Analysis

To analyze the effect of the site preparation after clearcutting (extensive/intensive) in young stands and the natural regeneration/artificial thinning in old-growth forest on small mammal species richness and abundance, a generalized linear mixed-effects model (GLMM) with negative binomial error distribution was used [34]. Based on the experimental design (at each site, samples were collected by repeated measures in time), a mixed model was designed as a random intercept and slope model in which locality was included as the random intercept effect and month was included as the random slope effect. The partial effect of each explanatory variable was tested with the likelihood ratio (LR) analysis of deviance using a chi-square statistic. The likelihood ratio analysis tested whether the deviance of the full model significantly increased after each explanatory variable was excluded from the model. Data were analyzed in the R program [35].

2.4.2. Multivariate Data Analysis

The assemblage change of the small mammal communities in relation to management intensity in old-growth forests, soil preparation practices after clearcutting, and forest successional stages were visualized by partial canonical correspondence analysis (pCCA) with the study month as covariable. We set the month as covariable to eliminate possible systematic or successional change in species composition that would take place on all plots regardless of treatment. In addition, small mammals were sampled sequentially from May to November. Therefore, we maintained the time autocorrelation of individual records using cyclic shifts. The abundances of each species were transformed by a decimal logarithm. The significance of the canonical axis was tested with a restricted Monte Carlo permutation test for the time series with 2000 permutations. To test the effect of forest characteristics on small mammal species composition, locality and successional age were used as covariables. It this case, randomization was restricted by randomizing time records within each locality separately using cyclic shifts. The significance of each explanatory variable was then tested by the forward selection procedure. All ordination analyses were conducted by the statistical software CANOCO, v. 5 [36].

3. Results

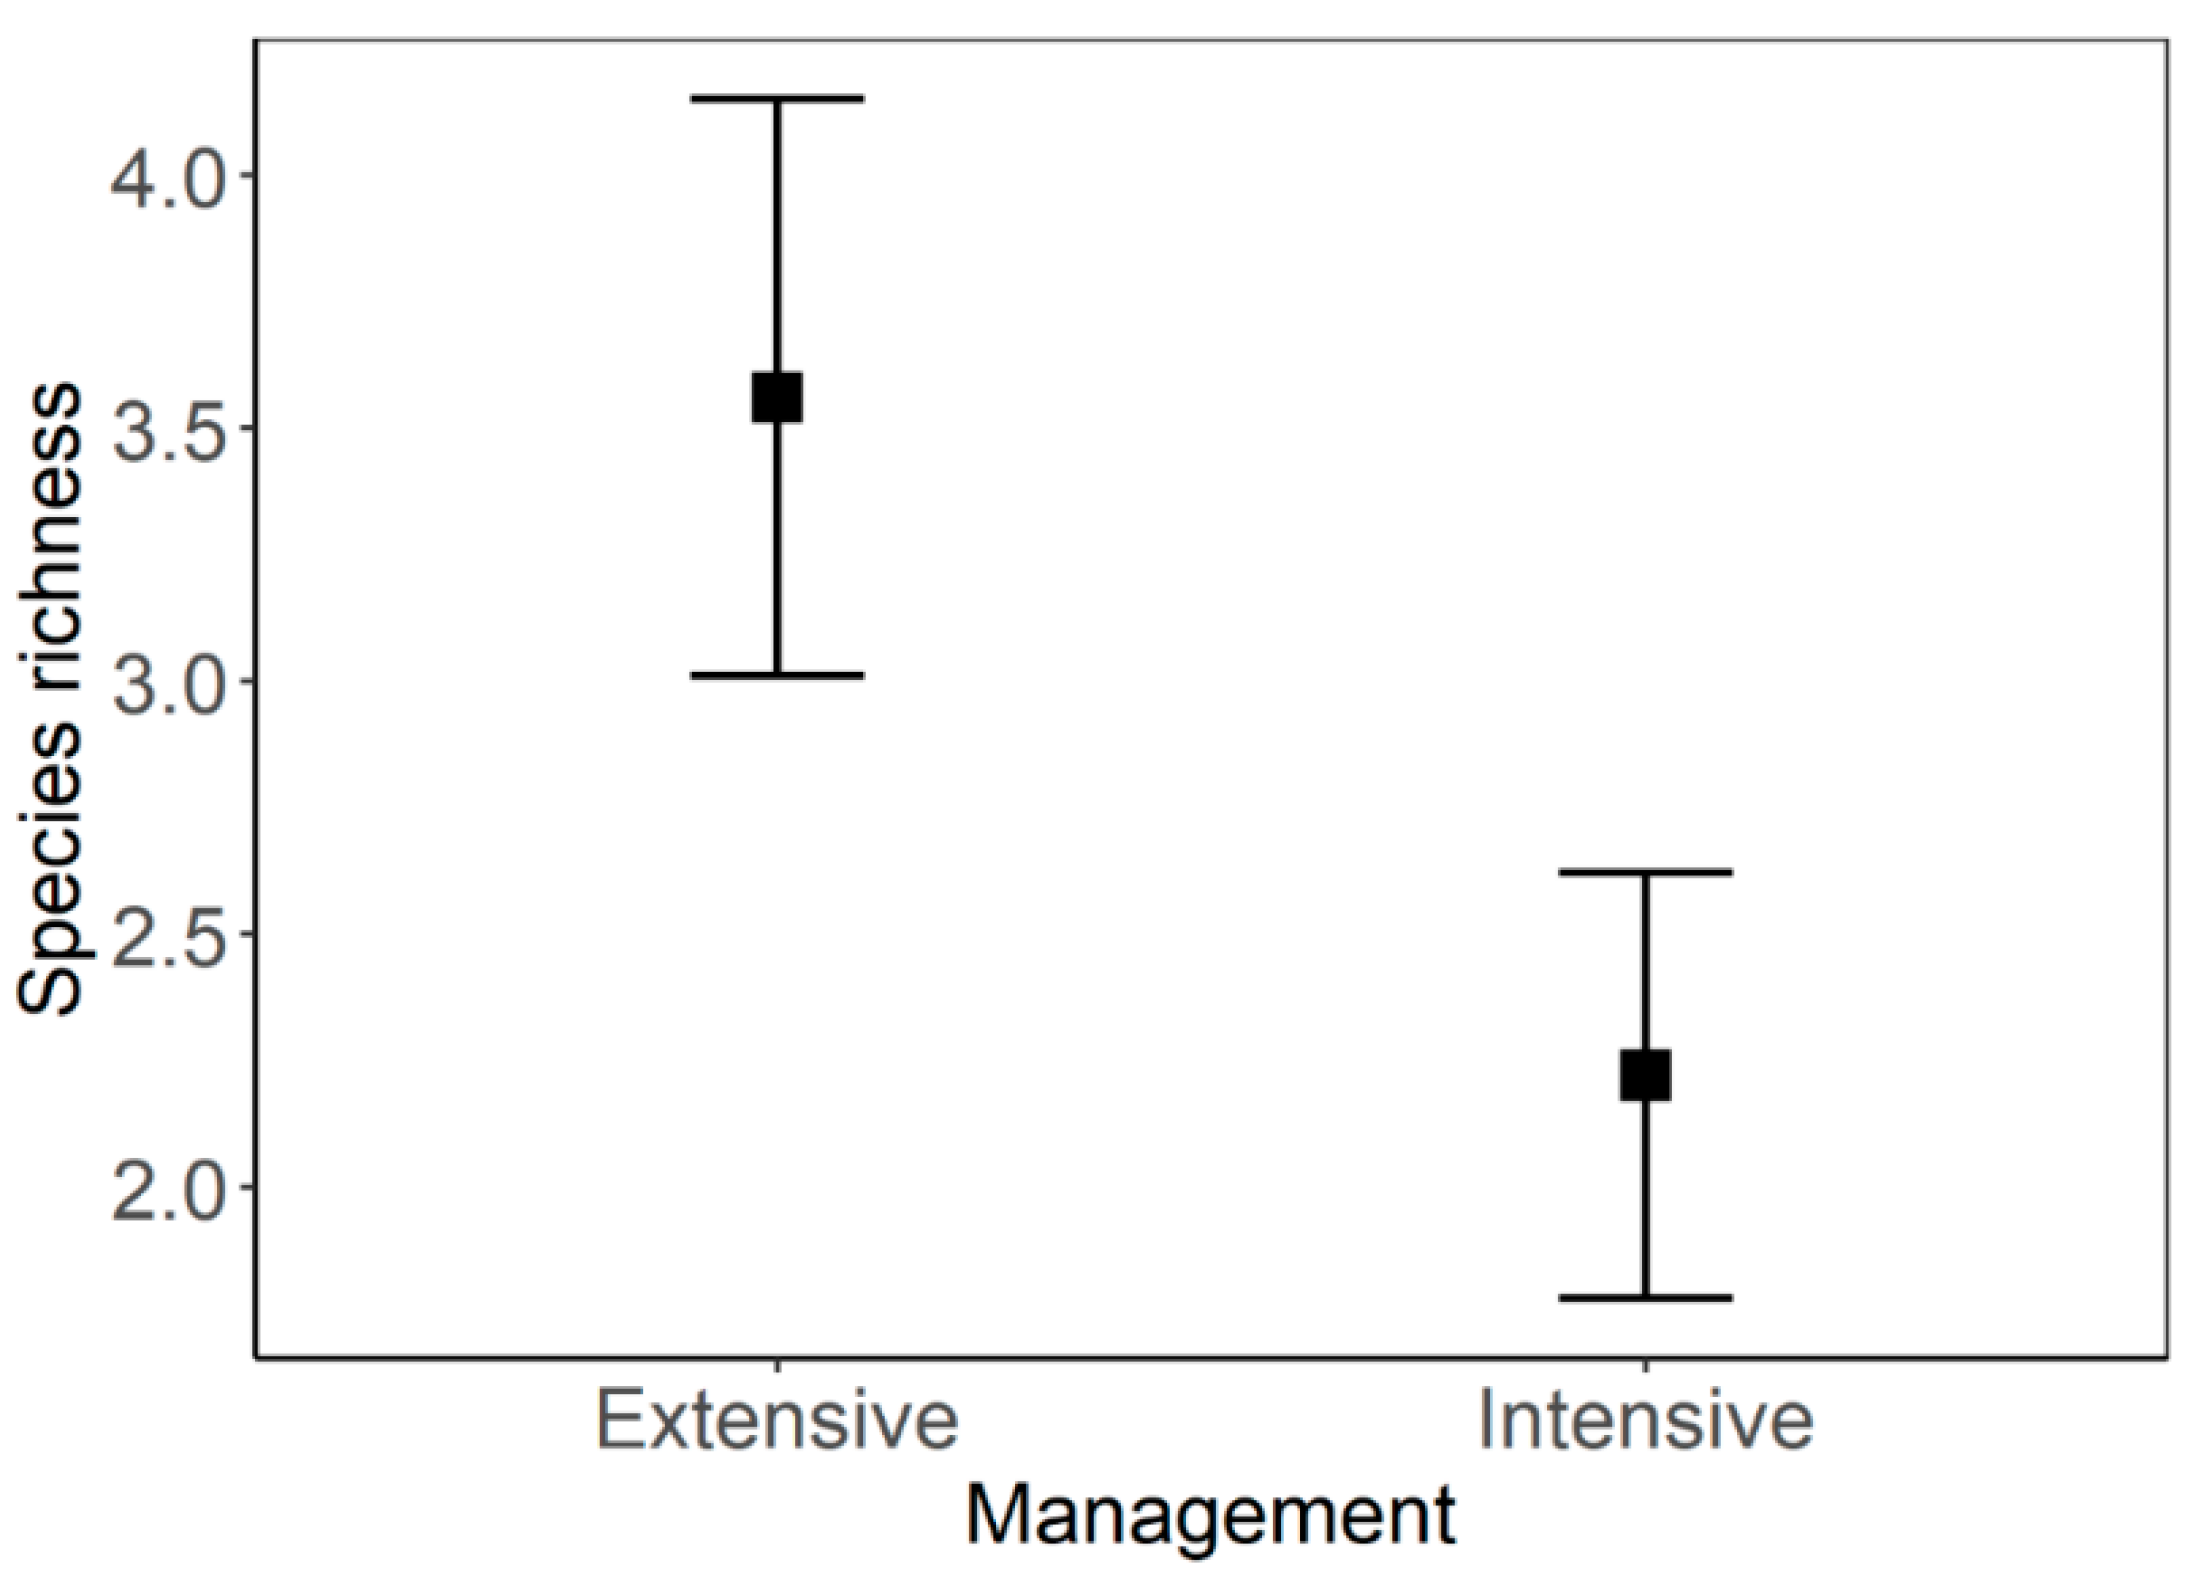
3.1. Species Richness and Abundance

A total of 771 individuals belonging to 10 different species were collected (Table 1). Rodents were the most abundant group, comprising 76% of the total number of individuals collected, with the dominant species being Microtus arvalis. Insectivora were the other abundant group, which encompassed 24% of the total number of individuals collected, with the dominant species being Sorex minutus. Overall, three different families were presented: Soricidae, Muridae, and Cricetidae. The number of species significantly differed only between intensively and extensively managed clearings (glmmANOVA, LRT = 3.947, p = 0.0469). The plots with intensively prepared soil after clearcutting significantly decreased the number of species in comparison to extensively managed plots after clearcutting (Figure 1). Moreover, the small mammal species richness and abundance were not significantly different among the chronosequences of forest stands in different stages of succession or between intensively and extensively managed old-growth forests. The analysis of the species response curve also revealed that only one out of ten sampled species had significantly higher predicted abundance in the plots with intensively managed clearings. On the other hand, two species had significantly higher predicted abundance in intensively managed old-age forest stands (Table 1).

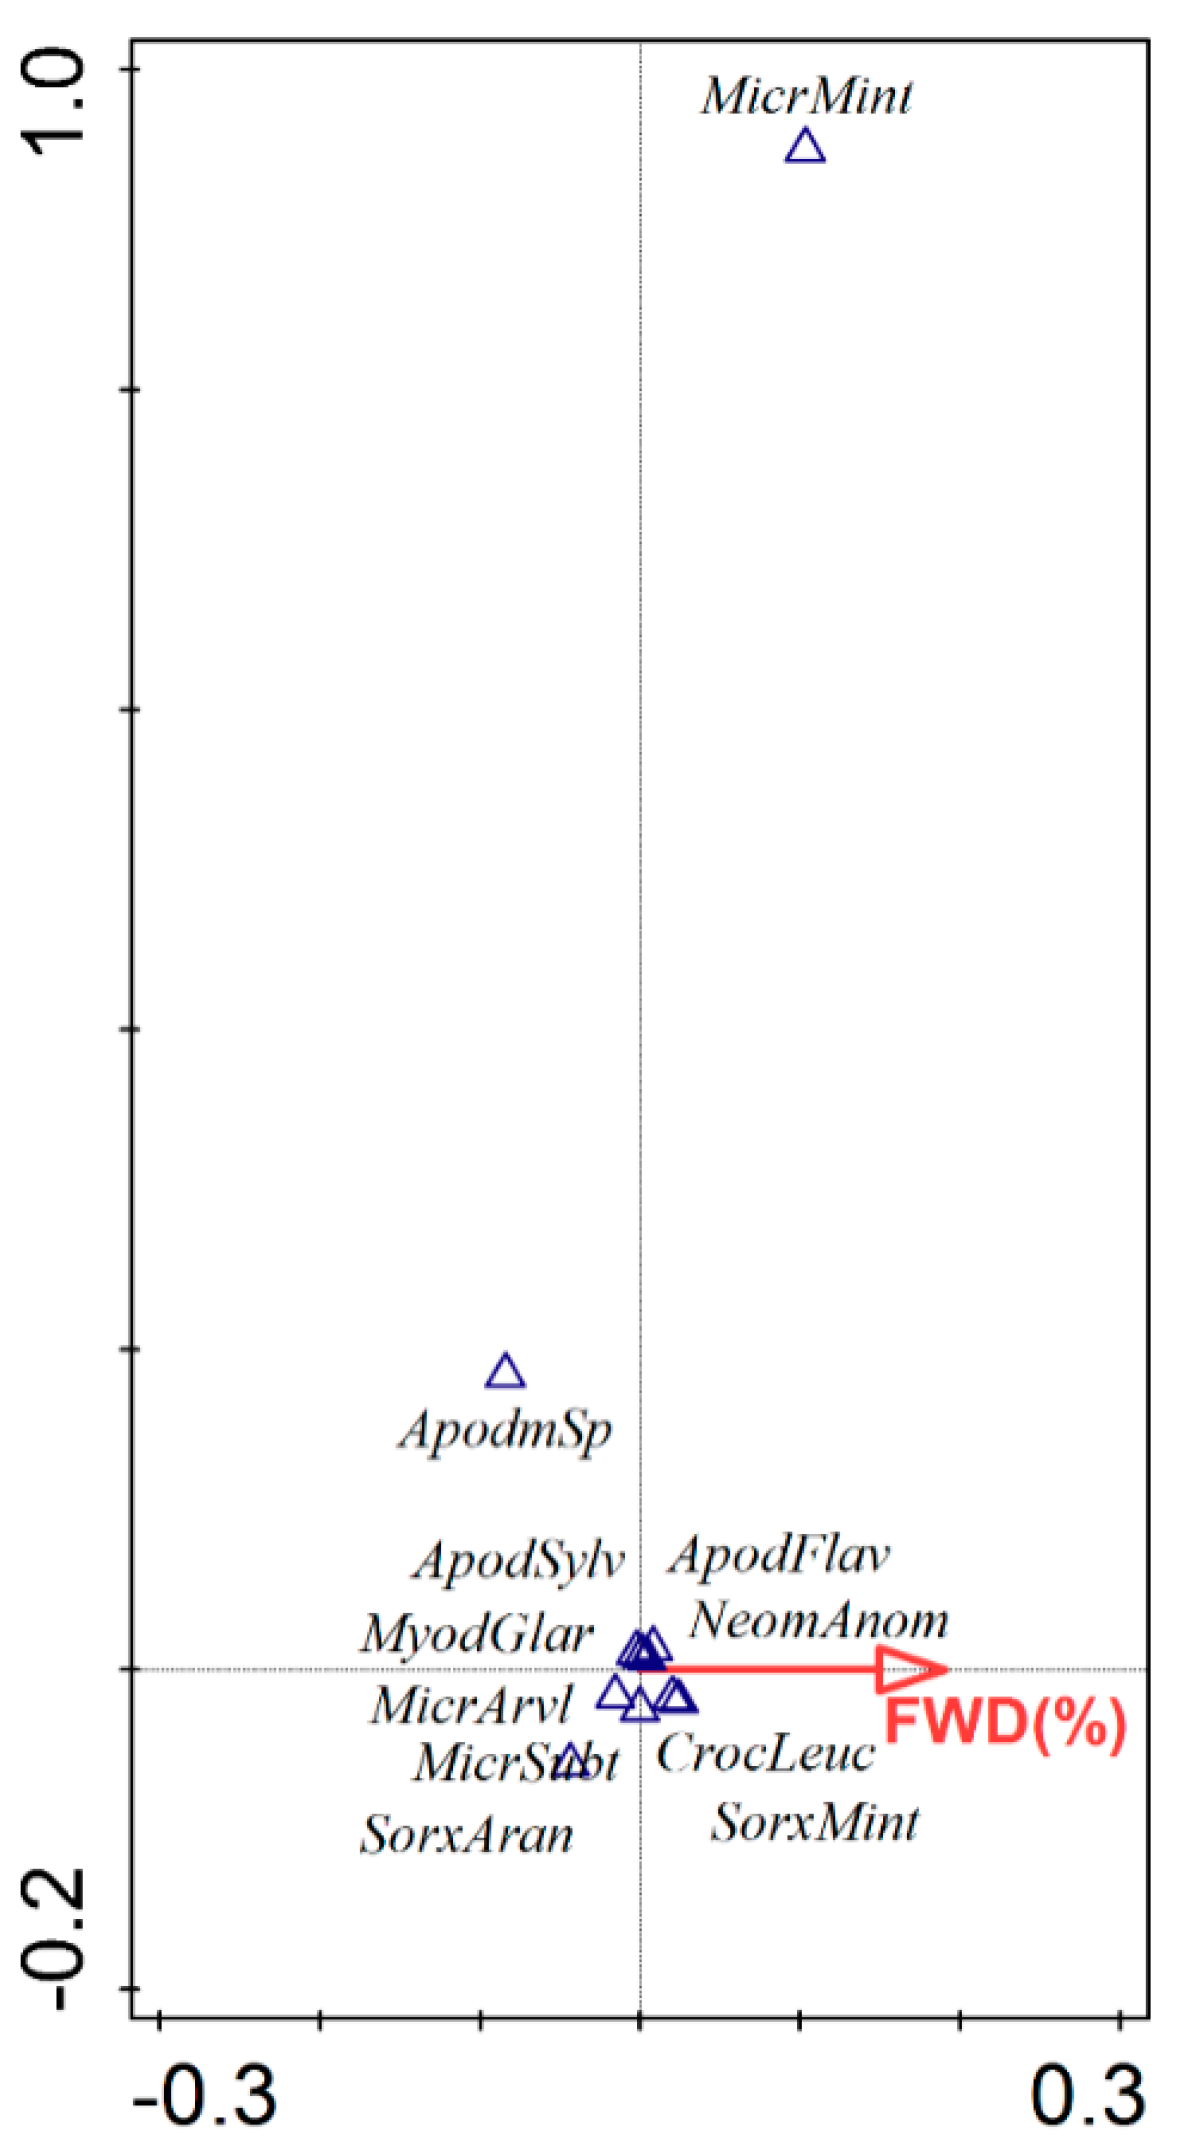
3.2. Species Assemblage

The small rodent assemblages significantly differed between intensively and extensively soil preparation of clearings (pseudo-F = 8.6, p = 0.004) (Figure 2a). After partialing out the effects of covariables, the management intensity explained 6.72% of the variance of the species data. Assemblages in adult forest stands also differed between intensive and extensive forest management (pseudo-F = 2.6, p = 0.021) (Figure 2b). After partialing out the effects of covariables, the management intensity in old-growth forest explained 2.07% of the variance of the species data. Based on the forest characteristics passively projected into the ordination space, extensively managed adult forests (i.e., naturally regenerated) were characterized by a high amount of litter, low canopy openness, and high shrub coverage, while intensively managed old forests were characterized by less shady conditions and a low amount of litter (Figure 2b). Among the measured forest properties, the percentage of woody debris was found to be the most influential for small mammal assemblages (pseudo-F = 2.4, p = 0.002) and explained 1.6% of the variance of the species data. We detected the highest abundances of the Soricidae family in the plots with high abundances of fine woody debris (Figure 3). In addition, the CCA revealed difference between assemblages of small mammals in the forest stands under different successional stages (pseudo-F = 4.0, p = 0.004) (Figure 4). After partialing out the effects of covariables, the successional stage of the forest stands explained 6.87% of the variance of the species data. Species related to successionally youngest plots were typical ruderal open habitat species such as Microtus arvalis and Microtus subterraneus. On the other hand, species that occurred in the old stands represent typical forest species, Apodemus flavicollis and Clethrionomys glareolus.

4. Discussion

In this study, we analyzed the effect of forest successional stage and management intensity on abundance, species richness, and assemblage composition of small mammals in lowland floodplain forest stands. We found evidence of a marked effect of mechanical soil preparation after clearcutting on species richness and assemblage composition. The majority of species reduced their abundance in response to intensively managed clearings. On the other hand, the opposite trend was observed in old-growth forest stands. Among the studied abiotic characteristics of the forest, we revealed that only fine woody debris significantly influenced small mammal composition. There was evidence that insectivorous mammal species have a tendency to forage in habitats with highly accumulated wood biomass.

4.1. Responses of Species Richness and Abundance to Forest Managements

We demonstrated that intensively managed forest clearings (i.e., mechanical soil preparation after clearcutting) had detrimental effects on the number of small mammal species. Our results are in contrast with works indicating only small effects or no effect of clearings on small mammal species richness or assembly composition [3,37]. The results of the meta-analysis also revealed that the species of small mammals increased in abundance after clearcutting [29]. We assume that vegetation destruction by pesticides and wood debris removal by soil milling are important factors leading to the loss of suitable habitats to find shelter, food, or nesting places. All insectivores and rodent species except Apodemus sylvaticus seemed to avoid intensively managed clearings. This is not so surprising, considering that Apodemus sylvaticus occurs more in open habitats and is a generalist with regard to habitat requirements, with wide ecological tolerances [38]. On the other hand, more species showed significant associations with intensively (i.e., thinning management applied) rather than extensively (i.e., naturally regenerated) managed adult forests. This could be explained by seed and plant biomass production, which is generally lower in shady than light forests [26,39,40].
Moreover, we did not observe a significant decrease in species richness and abundance during the chronosequence of different aged forest stands [41,42,43]. This could be explained by the small number of species we sampled and by the great ability of small mammals to migrate between forest stands of different successional stages [37]. Small mammals are characterized by intensive breeding with high litter production, population fluctuation, and very active foraging patterns [44,45]. These characteristics allow rapid reproduction and spread to the surrounding landscape with roughly equivalent environmental conditions.

4.2. Responses of Species Assemblage to Forest Managements

Small mammal assemblages significantly changed along the chronosequence of forest stands in different stages of succession. We therefore claim that forest stands with different successional stages create unique environmental conditions with the specific assemblage of small mammal species. Moreover, our result contradicts the assumption that the high forest is a less preferred habitat for C. glareolus, possibly due to its lack of food and scarce herb layer [39]. On the other hand, some authors have found that C. glareolus is positively affected by large, highly connected patches of old-growth forest [29,46,47]. It has been documented that Clethrionomys glareolus prefers forests with a thick herb layer and thin crown canopy [40]. We assume that C. glareolus may have great flexibility in food selection, which allows it, under certain circumstances, to dominantly colonize old-growth forests [48]. Another potential explanation why bank vole preferred old-growth forests is that some of the forest stands were intensively managed (i.e., artificial thinning) and an increased amount of light could have a positive effect on the herb layer. In addition, fine woody debris was the only environmental characteristic that significantly influenced small mammal assemblage. We observed that insectivorous mammal species had a tendency to forage in habitats with a high accumulation of wood biomass. It is well known that thick and heterogeneous layers of forest litter with presence of woody debris are colonized by a large number of invertebrates [49].
Results regarding the composition of small mammal assemblages in intensive and extensive managed forest stands showed significant differences. In old-growth forests, the abundance of Apodemus flavicollis and Apodemus sylvaticus showed significantly opposite patterns, which is likely related to their different ecological requirements [50]. Apodemus flavicollis was significantly associated with intensively managed old-growth forest characterized by increased light availability. Specific conditions of thinned forest stands are probably related to the large production of seeds, which are a major food source for Apodemus flavicollis [51]. To the contrary, higher abundance of Apodemus sylvaticus in extensive managed forests may be related to its lower specialization in feeding on tree seeds and its submissive position toward Apodemus flavicollis [39,52].
In forest clearings, the composition of assemblages significantly changed in response to intensive or extensive management. We also revealed that intensively managed clearings can make the dispersal or foraging activity difficult and hence significantly influence the species composition. Vegetation destruction by pesticides and wood debris removal by soil milling was of sufficient intensity to significantly negatively affect the abundance of majority of individual species in the assemblage. New assemblages formed after the disturbance were dominantly formed only by Apodemus sylvaticus, while the rest of the species showed a negative association with intensively managed clearings.

5. Conclusions

Our study showed that intensive management interventions in clearings significantly contribute to the decrease of species number and abundance in forest stands. Our results also suggest that, in some circumstances (i.e., mechanical site preparation presented by soil milling on a large area), intensively managed clearings may create a migration barrier for the most of small mammal species. Thus, we conclude that the soil preparation after clearcutting produces an unhostile environment for the majority of small mammal species and therefore active forest management, increasing habitat complexity (e.g., accumulation of dead wood or preservation of standing dead trees) in lowland floodplain forests is needed. We also suggest that some trees (i.e., nonvigorous low-quality trees) per hectare (at least 5–10 trees) should be retained at the stand level to mitigate the effects of timber harvesting on organisms [53].

Author Contributions

O.K. conceived and designed the research. O.K. performed the field survey. J.Š. conducted data analyses. J.S., J.Š. and O.K. wrote the original draft. All authors have read and agreed to the published version of the manuscript.

Funding

The study was financially supported by the Specific University Research Fund of the FFWT Mendel University in Brno (Reg. numbers: LDF_VT_2016002/2016 and LDF_PSV_2017004/2017).

Acknowledgments

We are very grateful to Židlochovice Enterprise, a division of Czech National Forests, Inc., for access to the forest stands and for their cooperation within the implementation of this research. We are indebted to the following people who assisted in various aspects of this work: Maria Larionova, Shaldayya Kuruganti, Šárka Mašová, Luboš Purchart and Kamila Surovcová. Furthermore, we would like to thank to the two anonymous reviewers for their comments.

Conflicts of Interest

The authors declare no conflict of interest.

References

  1. Stachová, J. Forests in the Czech public discourse. J. Landsc. Ecol. 2019, 11, 33–44. [Google Scholar] [CrossRef] [Green Version]
  2. Lindenmayer, D.B.; Franklin, J.F. Conserving Forest Biodiversity: A Comprehensive Multiscaled Approach; Island Press: Washington, DC, USA, 2002. [Google Scholar]
  3. Anthony, R.G.; Forsman, E.D.; Green, G.A.; Witmer, G.; Nelson, S.K. Small mammal populations in riparian zones of different-aged coniferous forests. Murrelet 1987, 68, 94–102. [Google Scholar] [CrossRef] [Green Version]
  4. Mullen, K.; O’Halloran, J.; Breen, J.; Giller, P.; Pithon, J.; Kelly, T. Distribution and composition of carabid beetle (Coleoptera, Carabidae) communities across the plantation forest cycle—Implications for management. For. Ecol. Manag. 2008, 256, 624–632. [Google Scholar]
  5. Purchart, L.; Tuf, I.H.; Hula, V.; Suchomel, J. Arthropod assemblages in Norway spruce monocultures during a forest cycle—A multi-taxa approach. For. Ecol. Manag. 2013, 306, 42–51. [Google Scholar] [CrossRef]
  6. Lešo, P.; Lešová, A.; Kropil, R.; Kanuch, P. Response of the dominant rodent species to close-to nature logging practices in a temperate mixed forest. Ann. For. Sci. 2016, 59, 259–268. [Google Scholar]
  7. Gallé, R.; Gallé-Szpisjak, N.; Torma, A. Habitat structure influences the spider fauna of short-rotation poplar plantations more than forest age. Eur. J. For. Res. 2017, 136, 51–58. [Google Scholar] [CrossRef]
  8. Niemelä, J.; Haila, Y.; Halme, E.; Lahti, T.; Pajunen, T.; Punttila, P. The distribution of carabid beetles in fragments of old coniferous taiga and adjacent managed forest. Ann. Zool. Fenn. 1988, 25, 107–119. [Google Scholar]
  9. Elek, Z.; Magura, T.; Tóthmérész, B. Impacts of non-native Norway spruce plantation on abundance and species richness of ground beetles (Coleoptera: Carabidae). Web Ecol. 2001, 2, 32–37. [Google Scholar] [CrossRef] [Green Version]
  10. Magura, T.; Bogyó, D.; Mizser, S.; Nagy, D.D.; Tóthmérész, B. Recovery of ground-dwelling assemblages during reforestation with native oak depends on the mobility and feeding habits of the species. For. Ecol. Manag. 2015, 339, 117–126. [Google Scholar] [CrossRef] [Green Version]
  11. Lindenmayer, D.B.; Wood, J.; McBurney, L.; Blair, D.; Banks, S.C. Single large versus several small: The SLOSS debate in the context of bird responses to a variable retention logging experiment. For. Ecol. Manag. 2015, 339, 1–10. [Google Scholar] [CrossRef]
  12. Manuwal, D.A.; Huff, M.H. Spring and winter bird populations in a Douglas-fir forest sere. J. Wildl. Manage. 1987, 51, 586–595. [Google Scholar] [CrossRef]
  13. Luque, C.A.; Gers, C.; Lauga, J.; Mariano, N.; Wink, M.; Legal, L. Analysis of forestry impacts and biodiversity in two Pyrenean forests through a comparison of moth communities (Lepidoptera, Heterocera). Insect Sci. 2007, 14, 323–338. [Google Scholar] [CrossRef]
  14. Košulič, O.; Hamřík, T.; Lvončík, S. Patterns of change in the species composition of vascular plants during different succession stages and management intensity of a lowland floodplain forest. Biologia 2020, 75, 1801–1813. [Google Scholar] [CrossRef]
  15. Niemelä, J.; Langor, D.; Spence, J.R. Effects of clear-cut harvesting on boreal ground-beetle assemblages (Coleoptera: Carabidae) in western Canada. Conserv. Biol. 1993, 7, 551–561. [Google Scholar]
  16. Sipos, J.; Hodecek, J.; Kuras, T.; Dolny, A. Principal determinants of species and functional diversity of carabid beetle assemblages during succession at post-industrial sites. Bull. Entomol. Res. 2017, 107, 466–477. [Google Scholar] [CrossRef] [PubMed]
  17. Bengtsson, J.; Nilsson, S.G.; Franc, A.; Menozzi, P. Biodiversity, disturbances, ecosystem function and management of European forests. For. Ecol. Manag. 2020, 132, 39–50. [Google Scholar] [CrossRef]
  18. Hannah, L.; Carr, J.L.; Lankerani, A. Human disturbance and natural habitat: A biome level analysis of a global data set. Biodiv. Conserv. 1995, 4, 128–155. [Google Scholar] [CrossRef]
  19. Millennium Ecosystem Assessment. Ecosystems and Human Well-Being: Synthesis; Island Press: Washington, DC, USA, 2005. [Google Scholar]
  20. Thompson, I.; Mackey, B.; McNulty, S.; Mosseler, A. Forest Resilience, Biodiversity, and Climate Change. A Synthesis of the Biodiversity/Resilience/Stability Relationship in Forest Ecosystems; Secretariat of the Convention on Biological Diversity: Montreal, QC, Canada, 2009. [Google Scholar]
  21. Hodecek, J.; Kuras, T.; Sipos, J.; Dolny, A. Role of reclamation in the formation of functional structure of beetle communities: A different approach to restoration. Ecol. Eng. 2016, 94, 537–544. [Google Scholar] [CrossRef]
  22. Khanaposhtani, M.G.; Kaboli, M.; Karami, M.; Etemad, V. Effect of habitat complexity on richness, abundance and distributional pattern of forest birds. Environ. Manag. 2012, 50, 296–303. [Google Scholar] [CrossRef]
  23. McElhinny, C.; Gibbons, P.; Brack, C.; Bauhus, J. Forest and woodland stand structural complexity: Its definition and measurement. For. Ecol. Manag. 2005, 218, 1–24. [Google Scholar] [CrossRef]
  24. Niemelä, J. Management in relation to disturbance in the boreal forest. For. Ecol. Manag. 1999, 115, 127–134. [Google Scholar] [CrossRef] [Green Version]
  25. Gallé, R.; Maák, I.; Szpisjak, N. The effects of habitat parameters and forest age on the ground dwelling spiders of lowland poplar forests (Hungary). J. Insect Conserv. 2014, 18, 791–799. [Google Scholar] [CrossRef]
  26. Hédl, R.; Šipoš, J.; Chudomelová, M.; Utinek, D. Dynamics of herbaceous vegetation during four years of experimental coppice introduction. Folia Geobot. 2017, 52, 83–99. [Google Scholar] [CrossRef] [PubMed]
  27. Machar, I.; Schlossarek, M.; Pechanec, V.; Uradnicek, L.; Praus, L.; Sıvacıoğlu, A. Retention forestry supports bird diversity in managed, temperate hardwood floodplain forests. Forests 2020, 10, 300. [Google Scholar] [CrossRef] [Green Version]
  28. Šipoš, J.; Hédl, R.; Hula, V.; Chudomelová, M.; Košulič, O.; Niedobová, J.; Riedl, V. Patterns of functional diversity of two trophic groups after canopy thinning in an abandoned coppice. Folia Geobot. 2017, 52, 45–58. [Google Scholar]
  29. Bogdziewicz, M.; Zwolak, R. Responses of small mammals to clear-cutting in temperate and boreal forests of Europe: A meta-analysis and review. Eur. J For. Res. 2014, 133, 1–11. [Google Scholar] [CrossRef] [Green Version]
  30. Mucina, L.; Bültmann, H.; Dierßen, K.; Theurillat, J.P.; Raus, T.; Čarni, A.; Šumberová, K.; Willner, W.; Dengler, J.; García, R.G.; et al. Vegetation of Europe: Hierarchical floristic classification system of vascular plant, lichen, and algal communities. Appl. Veg.Sci. 2016, 19, 1–264. [Google Scholar] [CrossRef]
  31. Quitt, E. Climatic regions of Czechoslovakia. Studia Geographica 1971, 16, 1–73. [Google Scholar]
  32. Castro, A.; Wise, D.H. Influence of fine woody debris on spider diversity and community structure in forest leaf litter. Biodivers. Conserv. 2009, 18, 3705–3731. [Google Scholar] [CrossRef]
  33. Frazer, G.W.; Canham, C.D.; Lertzman, K.P. Gap Light Analyzer (GLA), Version 2.0: Imaging Software to Extract Canopy Structure and Gap Light Transmission Indices from True-Colour Fisheye Photographs. User’s Manual and Program Documentation; Simon Fraser University, Institute of Ecosystem Studies: Burnaby, BC, Canada, 1999; 40p. [Google Scholar]
  34. Bates, D.; Maechler, M.; Bolker, B.; Walker, S. Fitting linear mixed effects models using lme4. J. Stat. Soft. 2015, 67, 1–48. [Google Scholar] [CrossRef]
  35. R Development Core Team. R: A Language and Environment for Statistical Computing. R Foundation for Statistical Computing, 2020, Vienna. Available online: https://www.r-project.org/ (accessed on 6 June 2020).
  36. ter Braak, C.J.F.; Smilauer, P. Canoco Reference Manual and User’s Guide: Software for Ordination, Version 5.0.; Microcomputer Power: Ithaca, NY, USA, 2012. [Google Scholar]
  37. Krojerová-Prokešová, J.; Homolka, M.; Barančeková, M.; Heroldová, M.; Baňař, P.; Kamler, J.; Purchart, L.; Suchomel, J.; Zejda, J. Structure of small mammal communities on small-sized clearings in managed central European forests. For. Ecol. Manag. 2016, 367, 41–51. [Google Scholar] [CrossRef]
  38. Hoffmeyer, I. Interaction and habitat selection in the mice Apodemus flavicollis and A. sylvaticus. Oikos 1973, 24, 108–116. [Google Scholar] [CrossRef]
  39. Gasperini, S.; Mortelliti, A.; Bartolommei, P.; Bonacchi, A.; Manzo, E.; Cozzolino, R. Effects of forest management on density and survival in three forest rodent species. For. Ecol. Manag. 2016, 382, 151–160. [Google Scholar] [CrossRef]
  40. Suchomel, J.; Čepelka, L.; Purchart, L. Structure and diversity of small mammal communities of lowland forests in the rural central European landscape. Eur. J For. Res. 2012, 131, 1933–1941. [Google Scholar] [CrossRef]
  41. Balčiauskas, L.; Čepukienė, A.; Balčiauskienė, L. Small mammal community response to early meadow–forest succession. For. Ecosyst. 2017, 4, 11. [Google Scholar] [CrossRef]
  42. Briani, D.C.; Palma, A.R.T.; Vieira, E.M. Post-fire succession of small mammals in the Cerrado of central Brazil. Biodivers. Conserv. 2004, 13, 1023–1037. [Google Scholar] [CrossRef]
  43. Schoonmaker, P.; McKee, A. Species composition and diversity during secondary succession of coniferous forest in the western cascade mountains of Oregon. For. Sci. 1988, 34, 960–979. [Google Scholar]
  44. Perrin, A. Alternative life-history styles of small mammals. In Alternative Life-History Styles of Animals (Perspectives in Vertebrate Science); Burton, M.N., Ed.; Kluwer Academic Publishers: Dordrecht, The Netherlands, 1989; pp. 209–242. [Google Scholar]
  45. Šipoš, J.; Suchomel, J.; Purchart, L.; Kindlmann, P. Main determinants of rodent population fuctuations in managed Central European temperate lowland forests. Mammal Res. 2017, 62, 283–295. [Google Scholar] [CrossRef]
  46. Fitzgibbon, C.D. Small mammals in farm woodlands: The effects of habitat, isolation and surrounding land-use patterns. J. Appl. Ecol. 1997, 34, 530–539. [Google Scholar] [CrossRef]
  47. Schlinkert, H.; Ludwig, M.; Batáry, P.; Holzschuh, A.; Kovács-Hostyánszki, A.; Tscharntke, T.; Fischer, C. Forest specialist and generalist small mammals in forest edges and Hedges. Wildlife Biol. 2016, 22, 86–94. [Google Scholar] [CrossRef] [Green Version]
  48. Butet, A.; Delettre, Y.R. Diet diferentiation between European arvicoline and murine rodents. Acta Theriol. 2011, 56, 297–304. [Google Scholar] [CrossRef]
  49. Kara, Ö.; Bolat, İ.; Çakiroğlu, K.; Öztürk, M. Plant canopy effect on litter accumulation and soil microbial biomass in two temperate forests. Biol. Fertil. Soils 2008, 45, 193–198. [Google Scholar] [CrossRef]
  50. Montgomery, W.I.; Gurnell, J. The behaviour of Apodemus. In The Ecology of Woodland Rodents Bank Voles and Wood Mice; Flowerdew, S.R., Gurnell, J., Gipps, J.M.W., Eds.; Oxford University Press: Oxford, UK, 1985; pp. 89–115. [Google Scholar]
  51. Čepelka, L.; Šipoš, J.; Suchomel, J.; Heroldová, M. Can we detect response differences among dominant rodent species to climate and acorn crop in a Central European forest environment? Eur. J For. Res. 2020, 139, 539–548. [Google Scholar] [CrossRef]
  52. Montgomery, W.I. Intra- and interspecific interactions of Apodemus sylvaticus (L.) and A. flavicollis (Melchior) under laboratory conditions. Anim. Behav. 1978, 26, 1247–1254. [Google Scholar] [CrossRef]
  53. Kraus, D.; Krumm, F. Integrative Approaches as an Opportunity for the Conservation of Forest Biodiversity; European Forest Institute: Joensuu, Finland, 2013; 284p. [Google Scholar]
Figure 1. Effect of extensive (without soil preparation) and intensive (mechanical soil preparation) site preparation after clearcutting on small mammal species richness. Error bars represent ± 95% confidence interval.
Forests 11 01320 g001
Figure 2. Partial canonical correspondence analysis biplot with the study month as a covariable showing (a) the change in small mammal assemblages at intensive (mechanical soil preparation after clearcutting) and extensive (without soil preparation) study plots; (b) differences within small mammal assemblages according to different management intensity (intensive—artificial thinning; extensive—natural regeneration) in old-growth forest stands. Forest characteristic were passively projected onto the ordination diagram. ApodFlav, Apodemus flavicollis; ApodSylv, Apodemus sylvaticus; MicrSubt, Microtus subterraneus; MicrArvl, Microtus arvalis; MicrMint, Micromys minutus; MyodGlar, Clethrionomys glareolus; CrocLeuc, Crocidura leucodon; NeomAnom, Neomys anomalus; SorxAran, Sorex araneus; SorxMint, Sorex minutus.
Forests 11 01320 g002
Figure 3. Partial canonical correspondence analysis biplot showing the effect of fine woody debris on small mammal species composition with the locality and successional age as a covariable. ApodFlav, Apodemus flavicollis; ApodSylv, Apodemus sylvaticus; MicrSubt, Microtus subterraneus; MicrArvl, Microtus arvalis; MicrMint, Micromys minutus; MyodGlar, Clethrionomys glareolus; CrocLeuc, Crocidura leucodon; NeomAnom, Neomys anomalus; SorxAran, Sorex araneus; SorxMint, Sorex minutus.
Forests 11 01320 g003
Figure 4. Partial canonical correspondence analysis biplot with the study month as a covariable showing the change in small mammal assemblages in relation to different forest successional stages. ApodFlav, Apodemus flavicollis; ApodSylv, Apodemus sylvaticus; MicrSubt, Microtus subterraneus; MicrArvl, Microtus arvalis; MicrMint, Micromys minutus; MyodGlar, Clethrionomys glareolus; CrocLeuc, Crocidura leucodon; NeomAnom, Neomys anomalus; SorxAran, Sorex araneus; SorxMint, Sorex minutus.
Forests 11 01320 g004
Table 1. Summary table of the analysis of the species response curve visualizing species responses to an environmental gradient (i.e., management intensity) on the first ordination axis. Species response curves were fitted by generalized linear models with Poisson error distribution and a control for overdispersion. Positive scores of species among old-growth forest patches represent a positive association with extensive forest management and vice versa. Positive scores of species among clearing patches represent a positive association with intensive forest management and vice versa.
Old-Growth Forest
SpeciesAbundanceScores on the First CCA AxisExplained Variance Fp
IntensiveExtensive
Apodemus flavicollis359−0.21616.45.2<0.01
Apodemus sylvaticus270.98716.63.50.037
Clethrionomys glareolus44290.0162.80.840.599
Crocidura leucodon061.06232.39.0<0.001
Microtus arvalis83−0.3255.41.30.288
Sorex araneus53−0.0782.40.430.651
Sorex minutus1411−0.1099.03.20.047
Clearings
Apodemus flavicollis6140.0410.10.030.852
Apodemus sylvaticus46111.09218.312.6<0.001
Clethrionomys glareolus012−0.77135.121.4<0.001
Crocidura leucodon118−0.69525.20.630.571
Micromys minutus02−0.2621.80.320.572
Microtus arvalis27103−0.0953.23.70.056
Microtus subteraneus130.15700.0080.928
Neomys anomalus03−0.66814.15.20.024
Sorex araneus027−0.3667.35.70.018
Sorex minutus134−0.50112.811.2<0.01
Publisher’s Note: MDPI stays neutral with regard to jurisdictional claims in published maps and institutional affiliations.

