Article

Gene Set Subtraction Reveals 633 Candidate Genes for Bamboo Culm Wall Thickening

1
Co-Innovation Center for Sustainable Forestry in Southern China, Nanjing Forestry University, Nanjing 210037, China
2
International Center of Bamboo and Rattan, Beijing 100102, China
*
Author to whom correspondence should be addressed.
Forests 2020, 11(12), 1331; https://doi.org/10.3390/f11121331
Submission received: 6 November 2020 / Revised: 5 December 2020 / Accepted: 12 December 2020 / Published: 14 December 2020
(This article belongs to the Section Forest Ecophysiology and Biology)

Abstract

:
Abundant research has been conducted on the physiological, biochemical, and anatomical aspects of bamboo culm wall thickening, but its molecular mechanism has not yet been investigated. In this study, we performed whole-genome resequencing of Phyllostachys edulis ‘Pachyloen’, Phyllostachys nidularia f. farcta, Phyllostachys heteroclada f. solida with significantly thicker culm walls, and Schizostachyum dumetorum var. xinwuense with extremely thin culm walls. Moreover, we pioneered the innovative use of gene set subtraction to explore candidate genes that regulate bamboo culm wall thickening. A candidate gene set, containing 633 genes, was obtained by eliminating shared genes that help maintain physiological processes after alignment with the P. edulis reference genome. Starch and sucrose, oxidative phosphorylation, and ribosome were the three most important pathways enriched by differentially expressed genes. Although it cannot be used for hyperfine localization of bamboo wall thickness-regulatory genes, gene set reduction narrows down the range of candidate genes at minimal cost and provides new clues for the application of bioinformatics in plant research.

1. Introduction

Bamboo is the fastest growing and most versatile plant on earth, holding significant economic and cultural value [1,2]. Bamboo products have become an integral part of the daily lives of people globally, bringing immeasurable benefits. There are approximately 75 bamboo genera with approximately 1300 species and varieties covering 25 million hectares worldwide [3]. The thickness of the culm wall is one of the remarkable characteristics of the different species of bamboo plants, which directly affects their use. For example, bamboo with significantly thickened culm walls, such as Phyllostachys edulis ‘Pachyloen’, can be used as wood [4]. Therefore, the growth process and regulatory mechanisms of bamboo culm wall thickening are being continuously explored.
Using anatomical and mathematical modeling methods, the shoot apical meristem has been found to be a key factor in bamboo culm wall thickening [5]. The walls of bamboo stalks are primarily composed of thin-walled basic tissue cells and vascular bundles, with thick-walled cells forming the main body. Vascular bundle-related genes regulate the growth and development of vascular bundles, and improve plant resistance [6]. Comparison of transcriptomic data from P. edulis and P. edulis ‘Pachyloen’ at different developmental stages revealed several P. edulis ‘Pachyloen’-specific genes that may play an important role in bamboo wall thickening [7]. However, it is still unclear which genes might contribute to the physiological process of bamboo culm wall thickening. Investigating regulatory genes for culm wall thickening is an important addition to bamboo studies.
The development of molecular biology assessment techniques has resulted in a new field of plant research. The use of molecular biology to study a particular trait in plants has gained increasing interest [8,9,10,11]. By constructing large-scale artificial or natural plant populations, assisted by high-throughput sequencing technology, it is possible to discover regulatory genes and mechanisms for specific traits [12,13,14]. However, it is also undoubtedly costly, both financially and timewise. In this study, we applied gene set subtraction to investigate genes that regulate bamboo culm wall thickening (Figure 1). Schizostachyum dumetorum var. xinwuense belongs to Schizostachyum genus and has a thin culm wall. In contrast, P. edulis ‘Pachyloen’, P. nidularia f. farcta, and P. heteroclada f. solida are members of the genus Phyllostachys, with distinctly thickened culm walls that are 1–2 times thicker than S. dumetorum var. xinwuense [15,16,17]. We re-sequenced the whole genomes of these four bamboo species simultaneously and compared them with the P. edulis reference genome. We then intersected the obtained differential gene sets to narrow the candidate range of bamboo culm wall thickening regulatory genes. Gene set subtraction is an innovative technique for biological genome research.

2. Materials and Methods

2.1. Plant Materials, DNA Extraction, and Whole Genome Resequencing

The samples of P. edulis ‘Pachyloen’, P. nidularia f. farcta, P. heteroclada f. solida, and S. dumetorum var. xinwuense were collected at 1.5 cm from the apex of the shoot on 21 March 2020, from the experimental bamboo forest (113.1124° E, 28.2698° N; 44.9 m above sea level) in Lukou Town, Changsha, Hunan Province, China. The collected shoots were immediately washed with distilled water, wrapped in foil, placed in a liquid nitrogen tank, and stored at −80 °C until DNA extraction. The voucher specimens were deposited in the College of Forestry, Nanjing Forestry University (NJFU2019-857). Genomic DNA was extracted using the DNeasy Plant Mini Kit (Qiagen, Germany) according with the manufacturer’s instructions. Whole genome resequencing was performed using an Hiseq 2500 platform (Illumina, San Diego, CA, USA) at the Tsinghua University, Beijing, China.

2.2. Sequence Alignment and Detection of Single Nucleotide Polymorphisms (SNPs) and Insertion-Deletion Mutations (InDels)

Clean reads were mapped to the bamboo reference genome (P. edulis) [18] using the Burrows-Wheeler Aligner [19] and submitted to the National Center for Biotechnology Information (NCBI) Short Reads Archive (SRA) database (accession numbers SRP269283, SRP270039, SRP269348, and SRP269303 for S. dumetorum var. xinwuense, P. edulis ‘Pachyloen’, P. heteroclada f. farcta, and P. nidularia f. solida, respectively. The DRAGEN toolkit (https://www.illumina.com/products/by-type/informatics-products/dragen-bio-it-platform.html) was used to conduct read mapping and SNP identification, with the clean reads of FASTQ files used for alignment, sorting, duplicate removal, and variant identification. The hidden Markov model and Smith-Waterman alignment in GATK 4.0 Haplotype variant caller [20] were used for SNP identification. The raw SNP/InDel sets were called by SAM-tools with the parameters ‘−q 1−C 50−m 2−F 0.002−d 1000, filtered for the mapping quality >20, and the depth of the variate position of >6.

2.3. Genetic Annotation and Identification of Candidate Genes

The SNP variations, InDel mutations, and copy number variations located in the coding/exon regions were enriched to identify genetic annotations and candidate genes. Gene ontology (GO) enrichment analysis (http://www.geneontology.org) was implemented using the GOseq R package [21], in which gene length bias was corrected. GO terms with a corrected p-value < 0.01 were considered significantly enriched. Kyoto encyclopedia of genes and genomes (KEGG) pathway enrichment analysis (http://www.kegg.jp) was performed using KOBAS 2.0 [22] and visualized using the clusterProfiler R package. According to the condition of corrected p-value < 0.01, the KEGG terms were considered significantly enriched.

3. Results

3.1. Genome-Wide Variation of Four Species of Bamboo

P. edulis ‘Pachyloen’, P. nidularia f. farcta, P. heteroclada f. solida, and S. dumetorum var. xinwuense generated a large amount of SNP and InDel loci information when compared with the reference genome of P. edulis (Table 1). The resequencing results of P. edulis ‘Pachyloen’ showed that the ratio of base transitions to transversions (Ts/Tv) was 2.93, which was slightly higher than that reported in Arabidopsis [23]. The frequency of the four base conversions from high to low was as follows: C→T (19.07%) > G→A (19.01%) > A→G (18.27%) > T→C (18.19%). There were 1,718,960 SNPs in the P. edulis ‘Pachyloen’ genome, with an average of about 1093 bases showing a mutation, representing a mutation frequency of 0.6%, which was lower than the 1% mutation frequency reported previously [24]. A total of 72,337 InDels were found in the P. edulis ‘Pachyloen’ genome, of which 33,127 (45.80%) were homozygous, 38,799 (53.64%) were heterozygous, and 411 (0.56%) affected multiple alleles.
The number of SNPs in the genomes of P. nidularia f. farcta and P. heteroclada f. solida was far greater than that of P. edulis ‘Pachyloen’. On average, one SNP was found for every 94 and 103 bases of P. nidularia f. farcta, and P. heteroclada f. solida, respectively. Among the 489,064 InDels in P. nidularia f. farcta, 88,095 were heterozygous, 398,617 were homozygous, and 2352 affected multiple alleles. Among the 335,745 InDels of P. heteroclada f. solida, 282,184 (84.05%) were distributed in the intergenic region, 33,489 (9.97%) were in intron regions, and 12,290 (3.66%) were in exon regions.
The number of SNPs detected in S. dumetorum var. xinwuense with obvious thin-walled characteristics was 1,683,311, with an average of 958 bases appearing in one SNP, which is close to the frequency of base mutations in the P. edulis ‘Pachyloen’, but significantly lower than that of P. nidularia f. farcta and P. heteroclada f. solida.

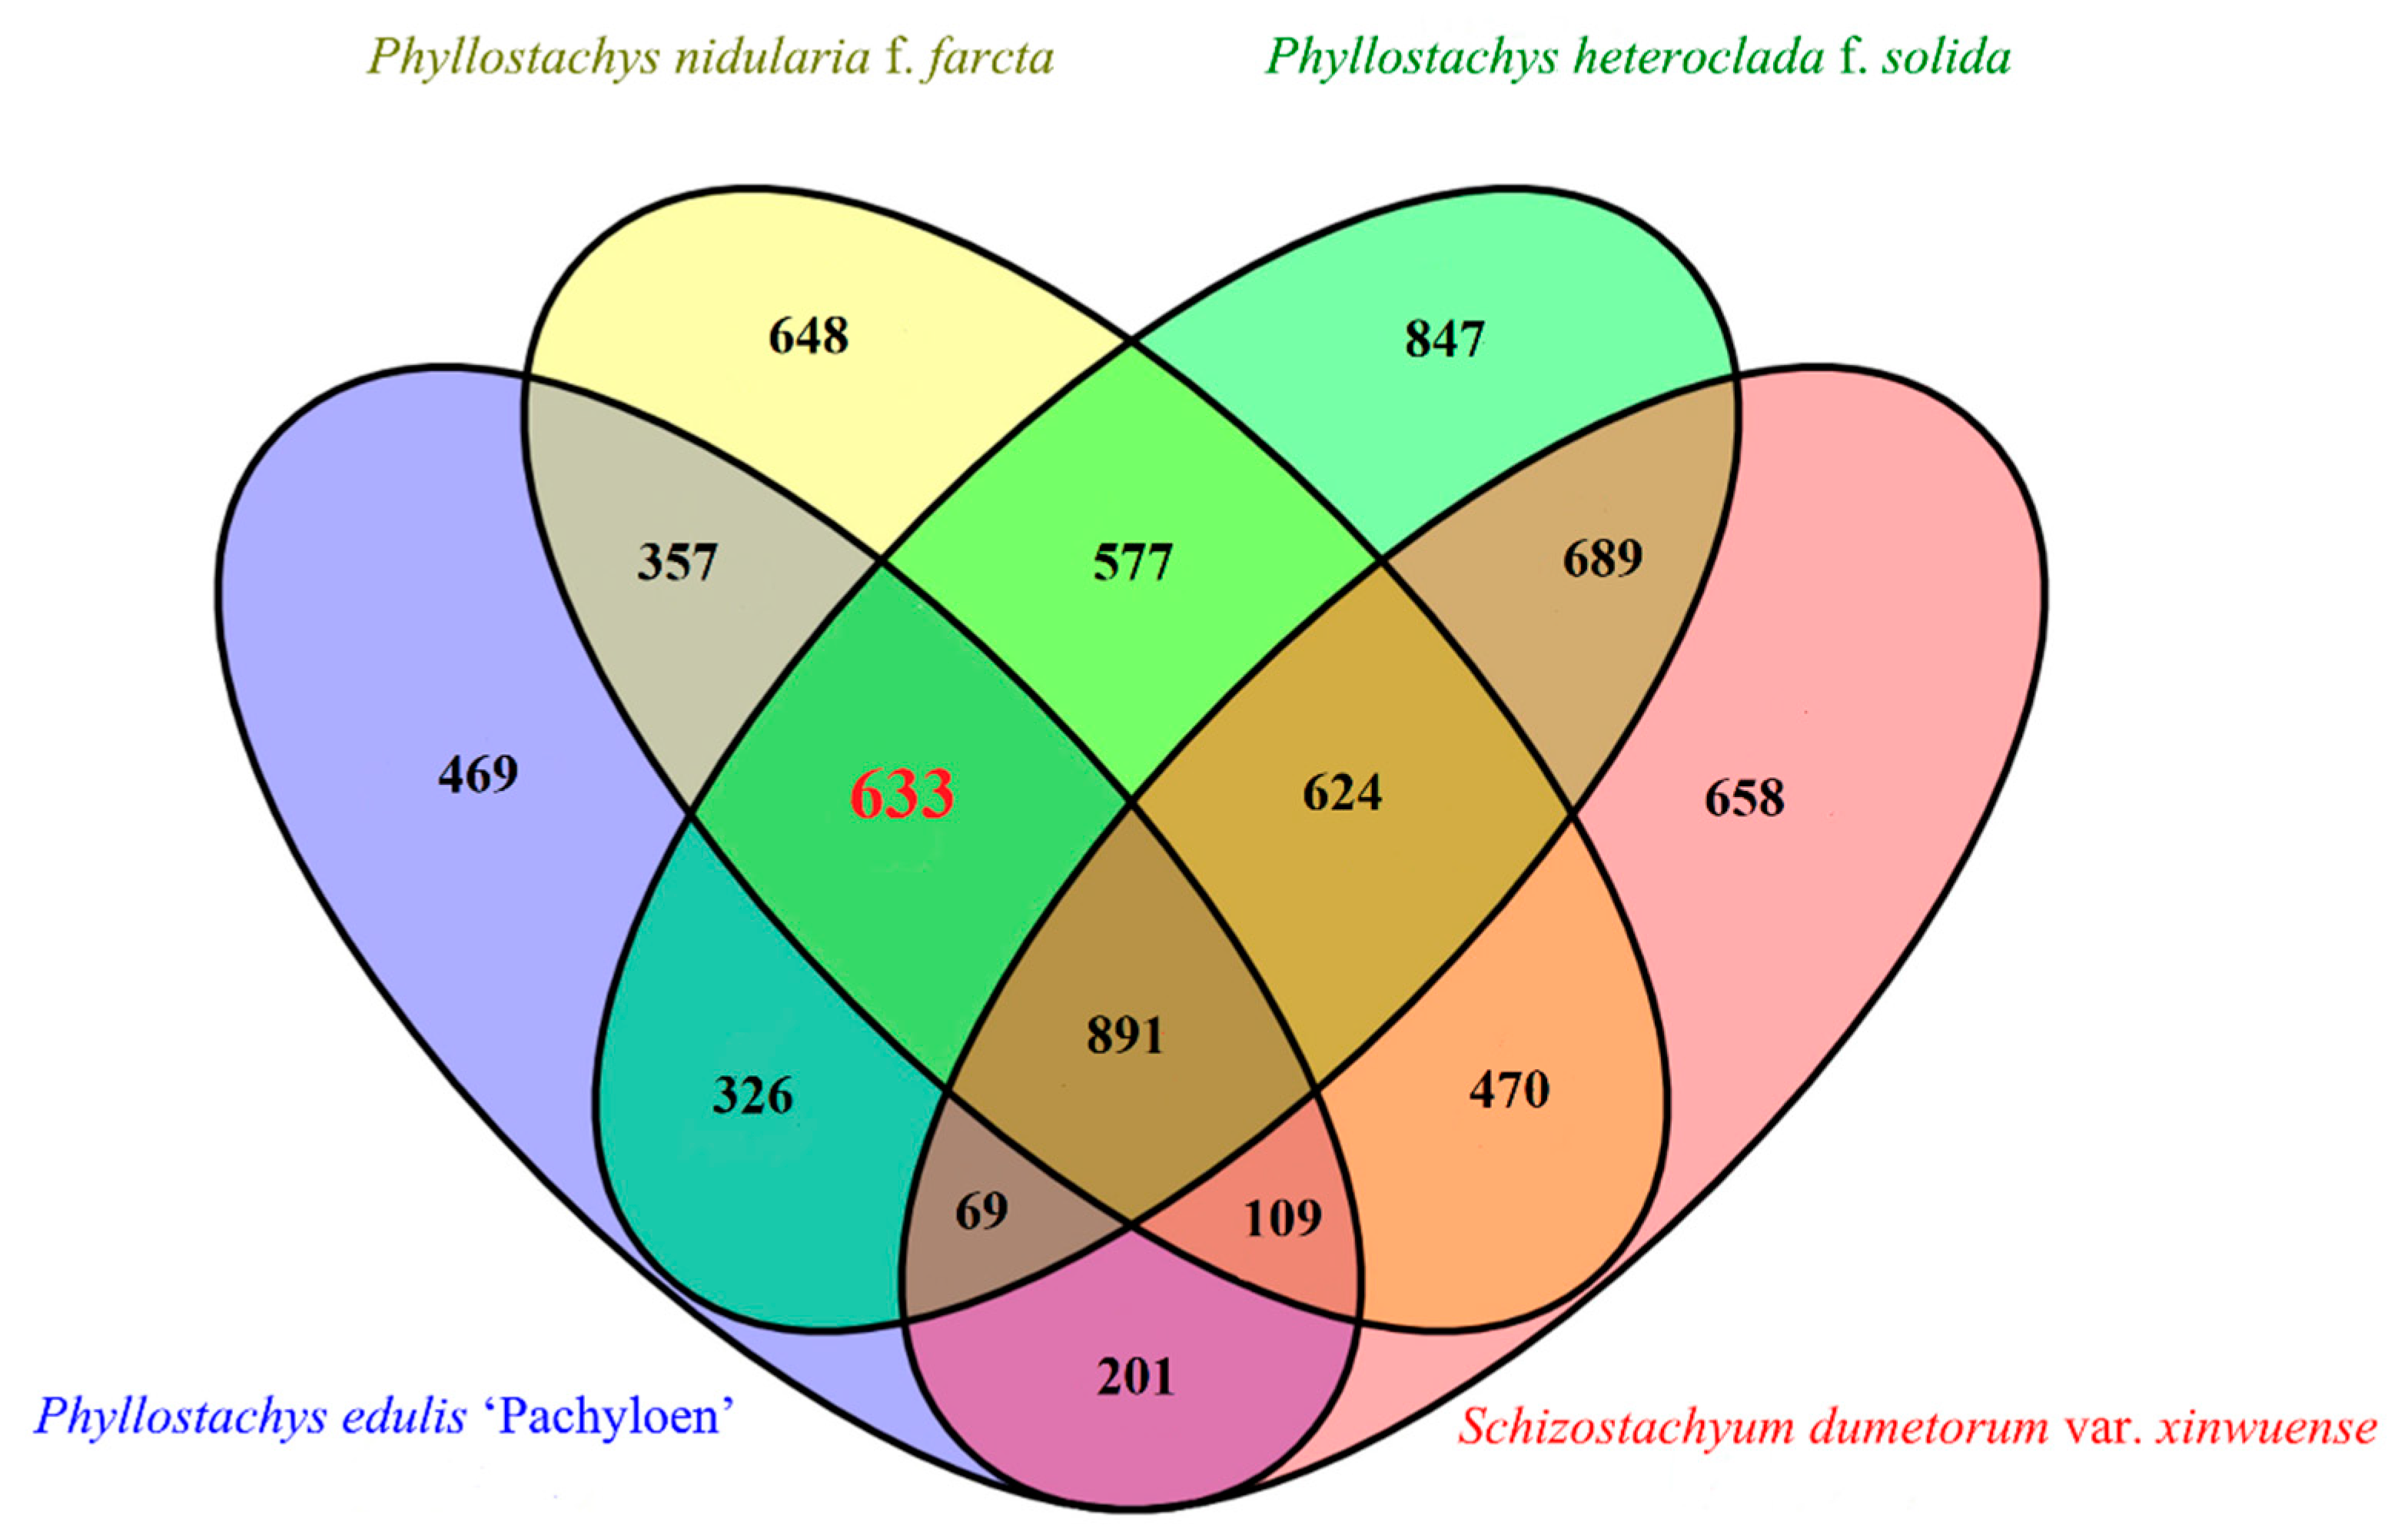
3.2. Determination of the Differential Gene Set

Alignment of P. edulis ‘Pachyloen’, P. nidularia f. farcta, P. heteroclada f. solida, and S. dumetorum var. xinwuense sequences to the reference genome generated 3055; 4309; 4656; and 3711 differential genes, respectively. There were a total of 891 genes in the different intersections of the four bamboo species, which regulate the common physiological activities (Figure 2). P. edulis ‘Pachyloen’, P. nidularia f. farcta, and P. heteroclada f. solida, all of which have thick-walled traits, had 1524 identical differentially expressed genes. Therefore, the remaining 633 genes may be solely related to the regulation of bamboo wall thickening. The IDs of these genes are provided in Supplementary File S1.

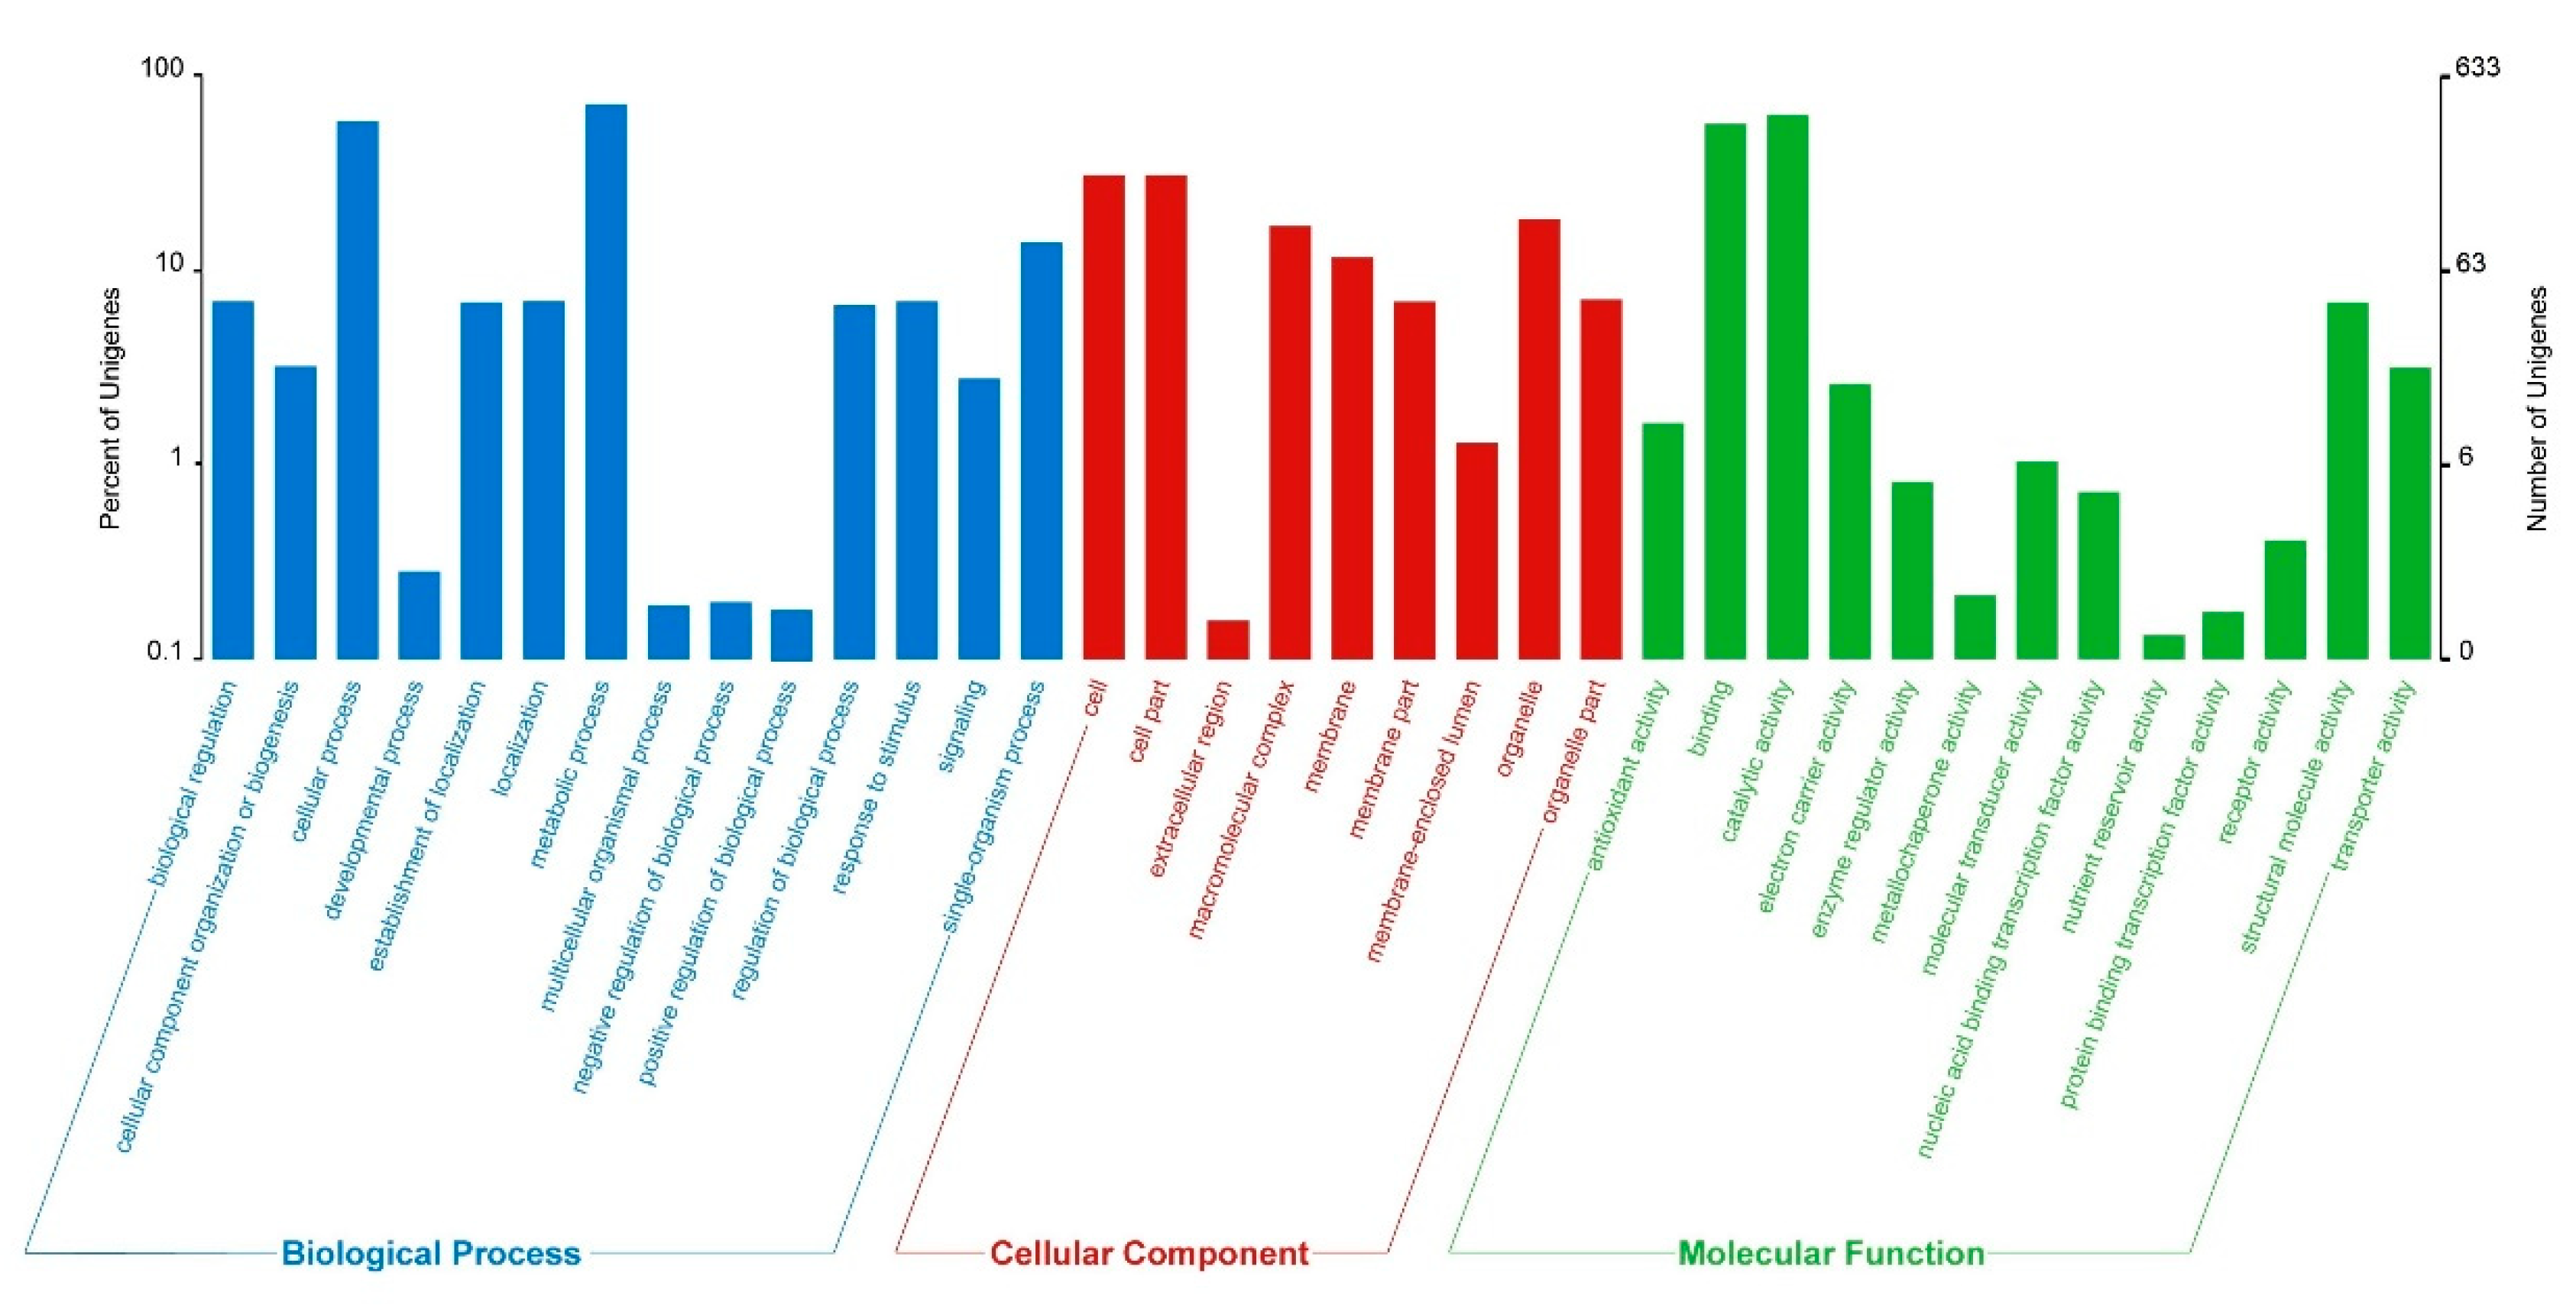
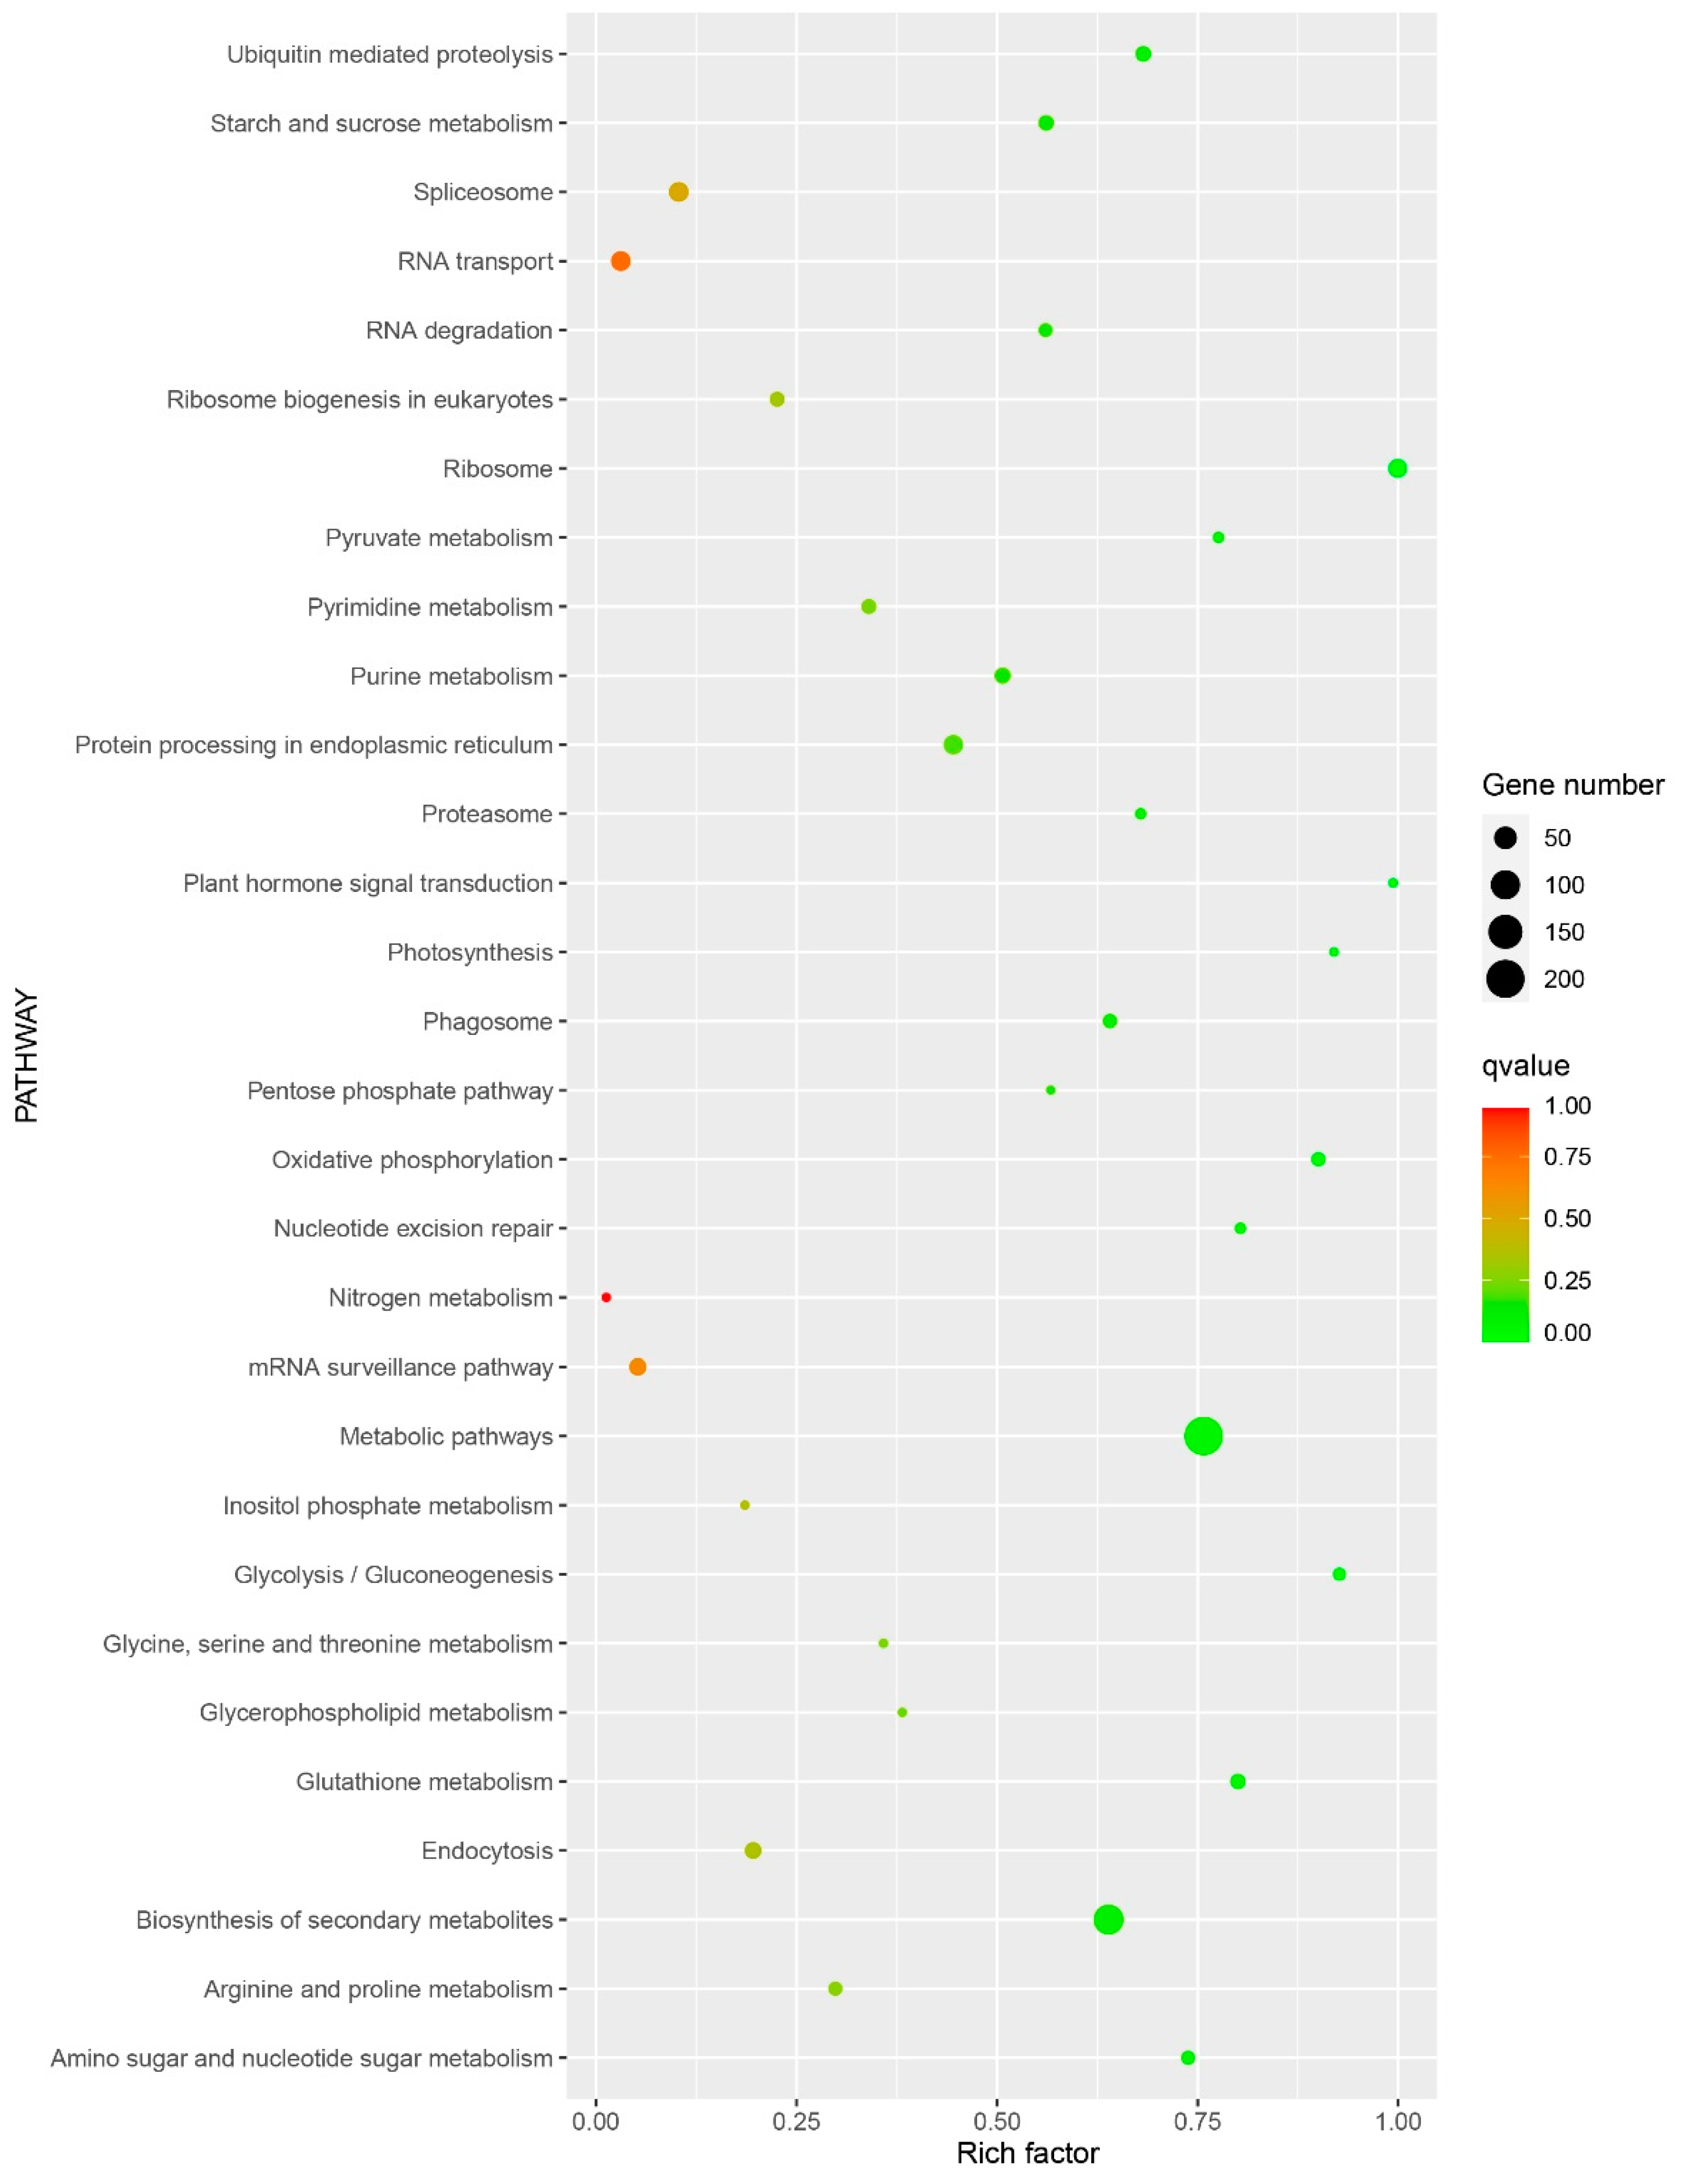
3.3. GO and KEGG Enrichment Analysis of Differentially Expressed Genes (DEGs)

The identified 633 DEGs were enriched and analyzed according to the latest GO and KEGG annotation information on the Moso bamboo reference genome (http://bamboogdb.com). These genes were enriched in 36 GO terms, of which 14 belonged to biological processes (BP), 9 belonged to cellular components (CC), and 13 belonged to the molecular function (MF) subset (Figure 3). Overall, the number of DEGs enriched in ‘catalytic activity’ was the largest, reaching 516, whereas the ‘nutrient reservoir activity’ had only one gene. In the BP category, the vast majority of unigenes were enriched in cellular and metabolic processes. It was also found that ‘binding’ and ‘catalytic activity’ had the highest degree of enrichment in the MF category.
KEGG analysis provided a more intuitive understanding of the function and interaction of differential genes, revealing that the 633 DEGs were enriched in 116 pathways. The analysis showed (Figure 4) that the most significantly enriched pathway was ‘nitrogen metabolism’, followed by ‘RNA transport’. The pathway with the largest amount of DEGs enrichment was the ‘metabolic pathway’, and ‘biosynthesis of secondary metabolites’ was the second. The KEGG enrichment pathway information for the 633 DEGs is provided in Supplementary File S2.
From the perspective of the secondary classification level of the KEGG metabolic pathway analysis, in the ‘Carbohydrate metabolism’, the ‘Starch and sucrose metabolism’ pathway was the most enriched core profile, encompassing 19 genes. In ‘lipid metabolism’, the highest number of genes was annotated to the ‘Glycerophospholipid metabolism’ pathway, with 10 genes. In ‘Glycan biosynthesis and metabolism’, six core genes were linked to ‘N-Glycan biosynthesis’. Among ‘Transcription’ and ‘Translation’, the most differentially enriched subsets were ‘Spliceosome’ and ‘RNA transport’ with 34 genes, each.

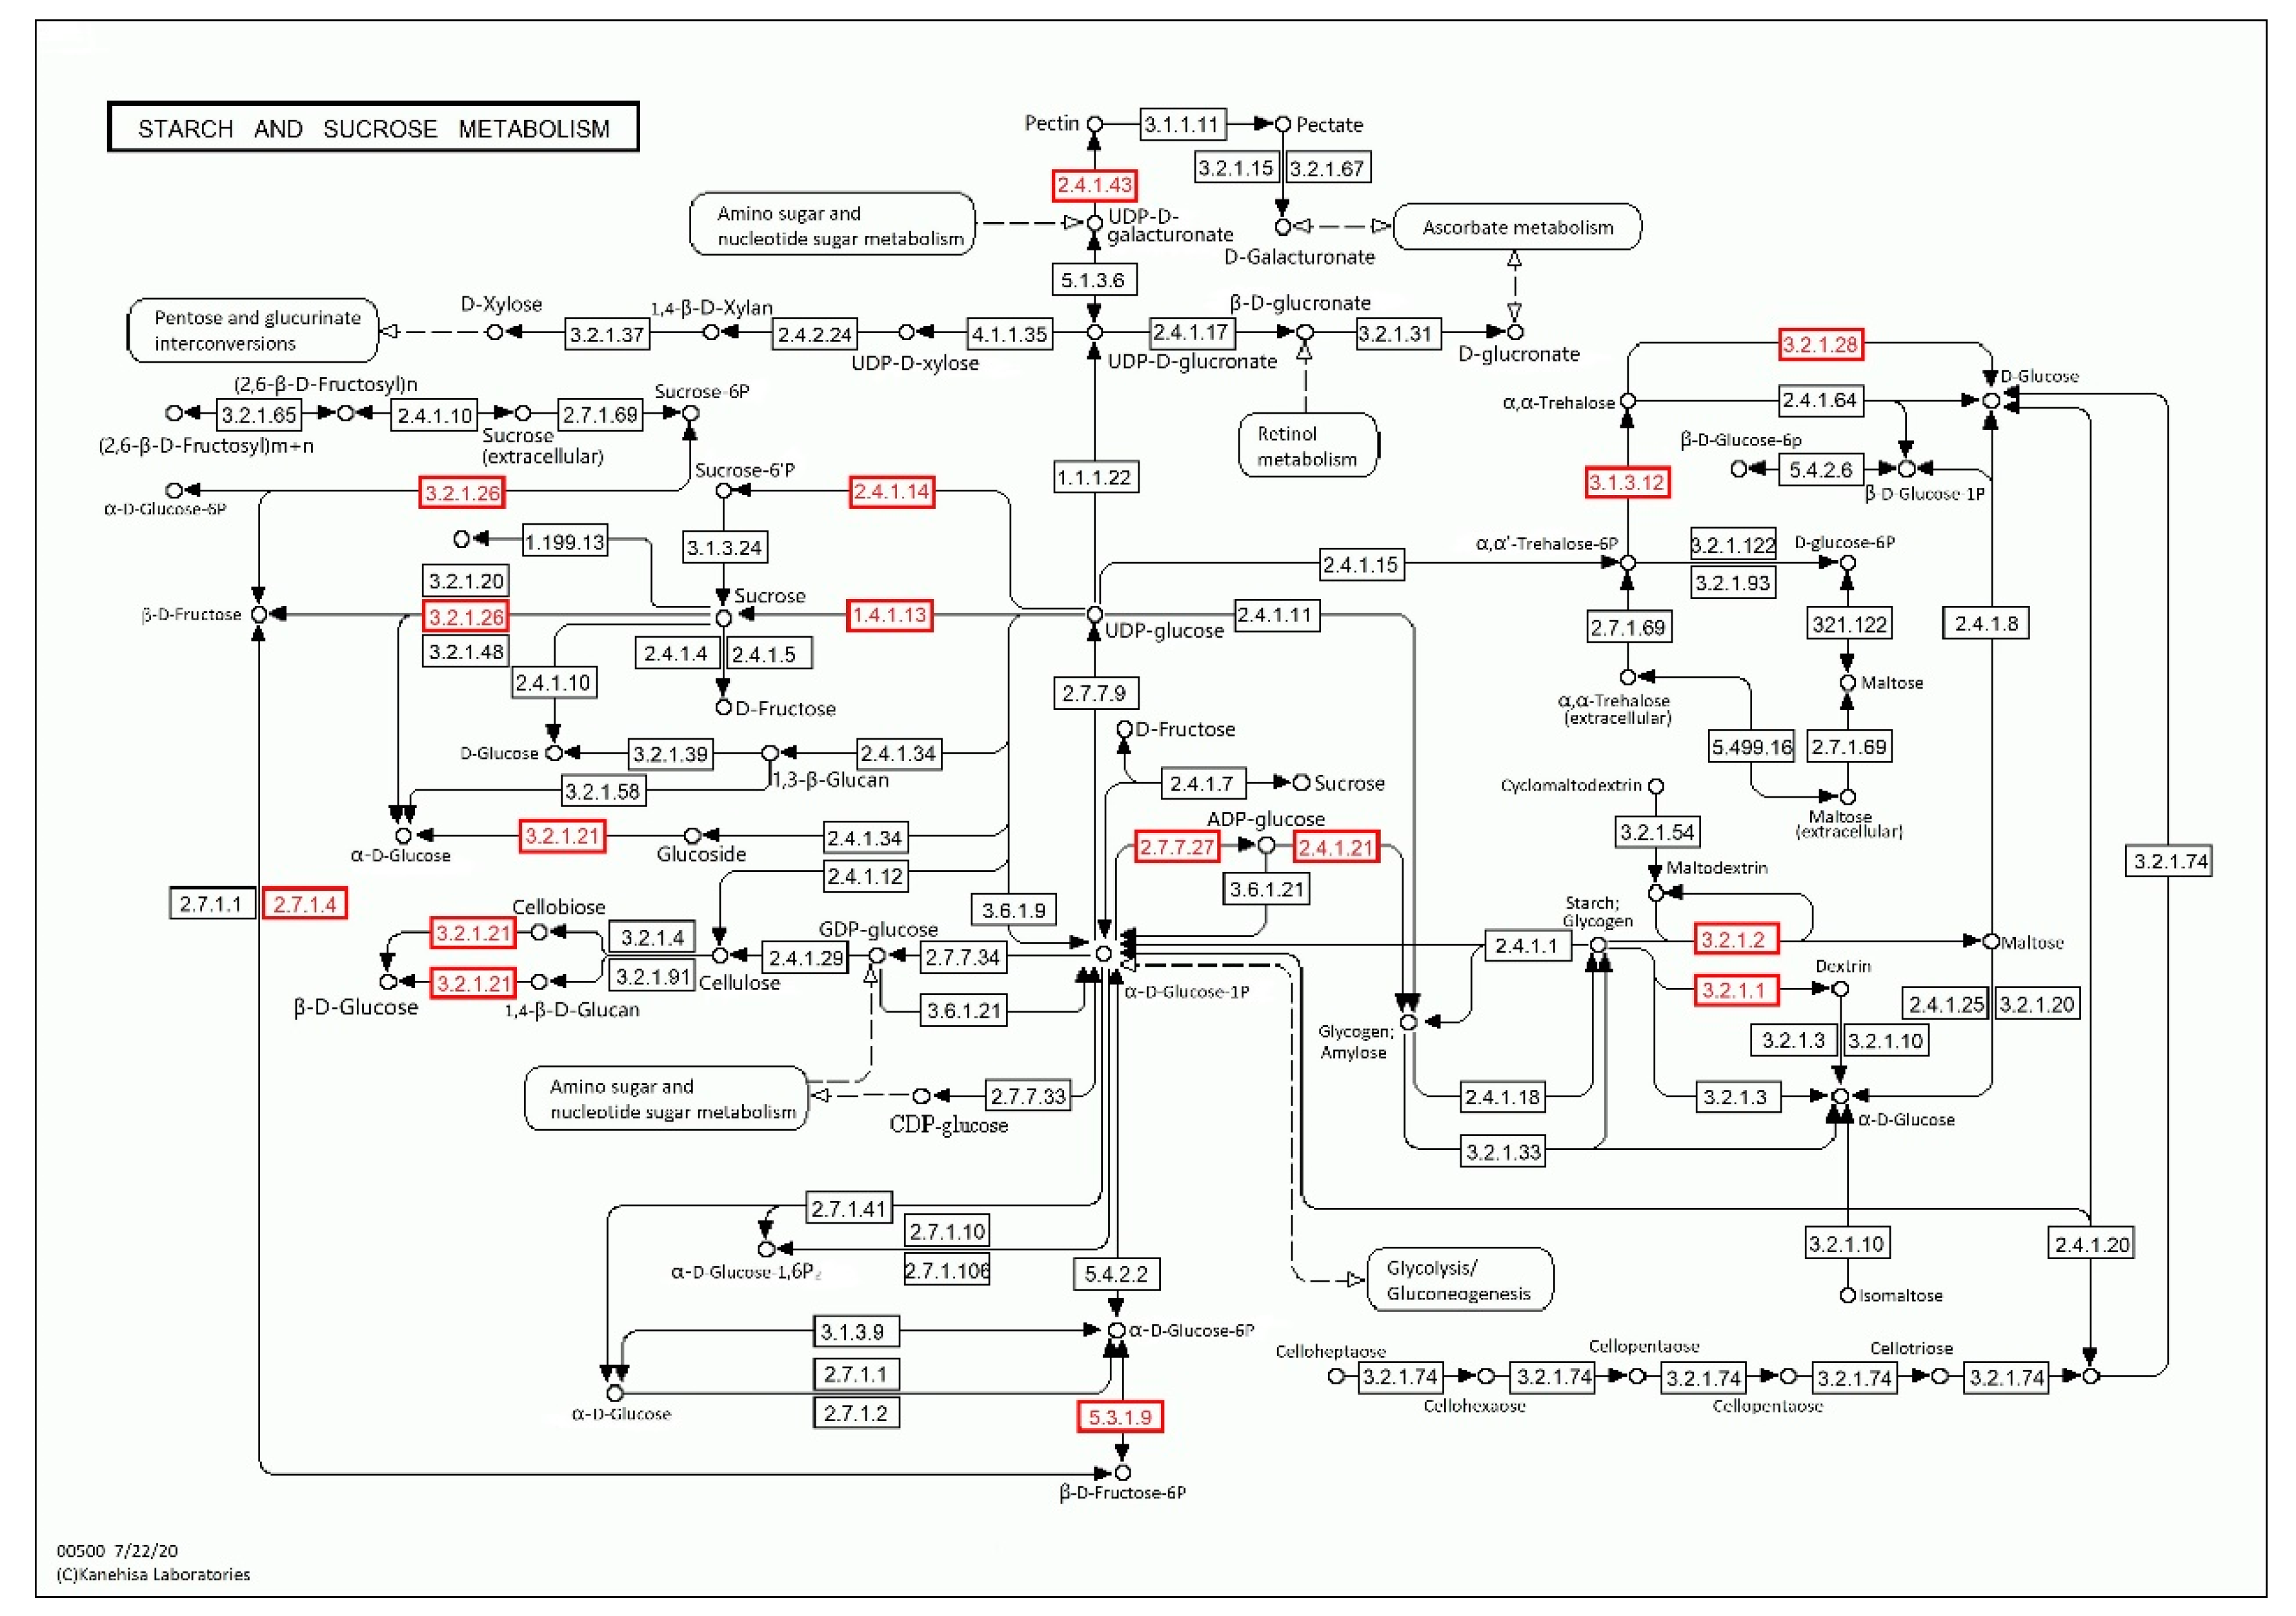
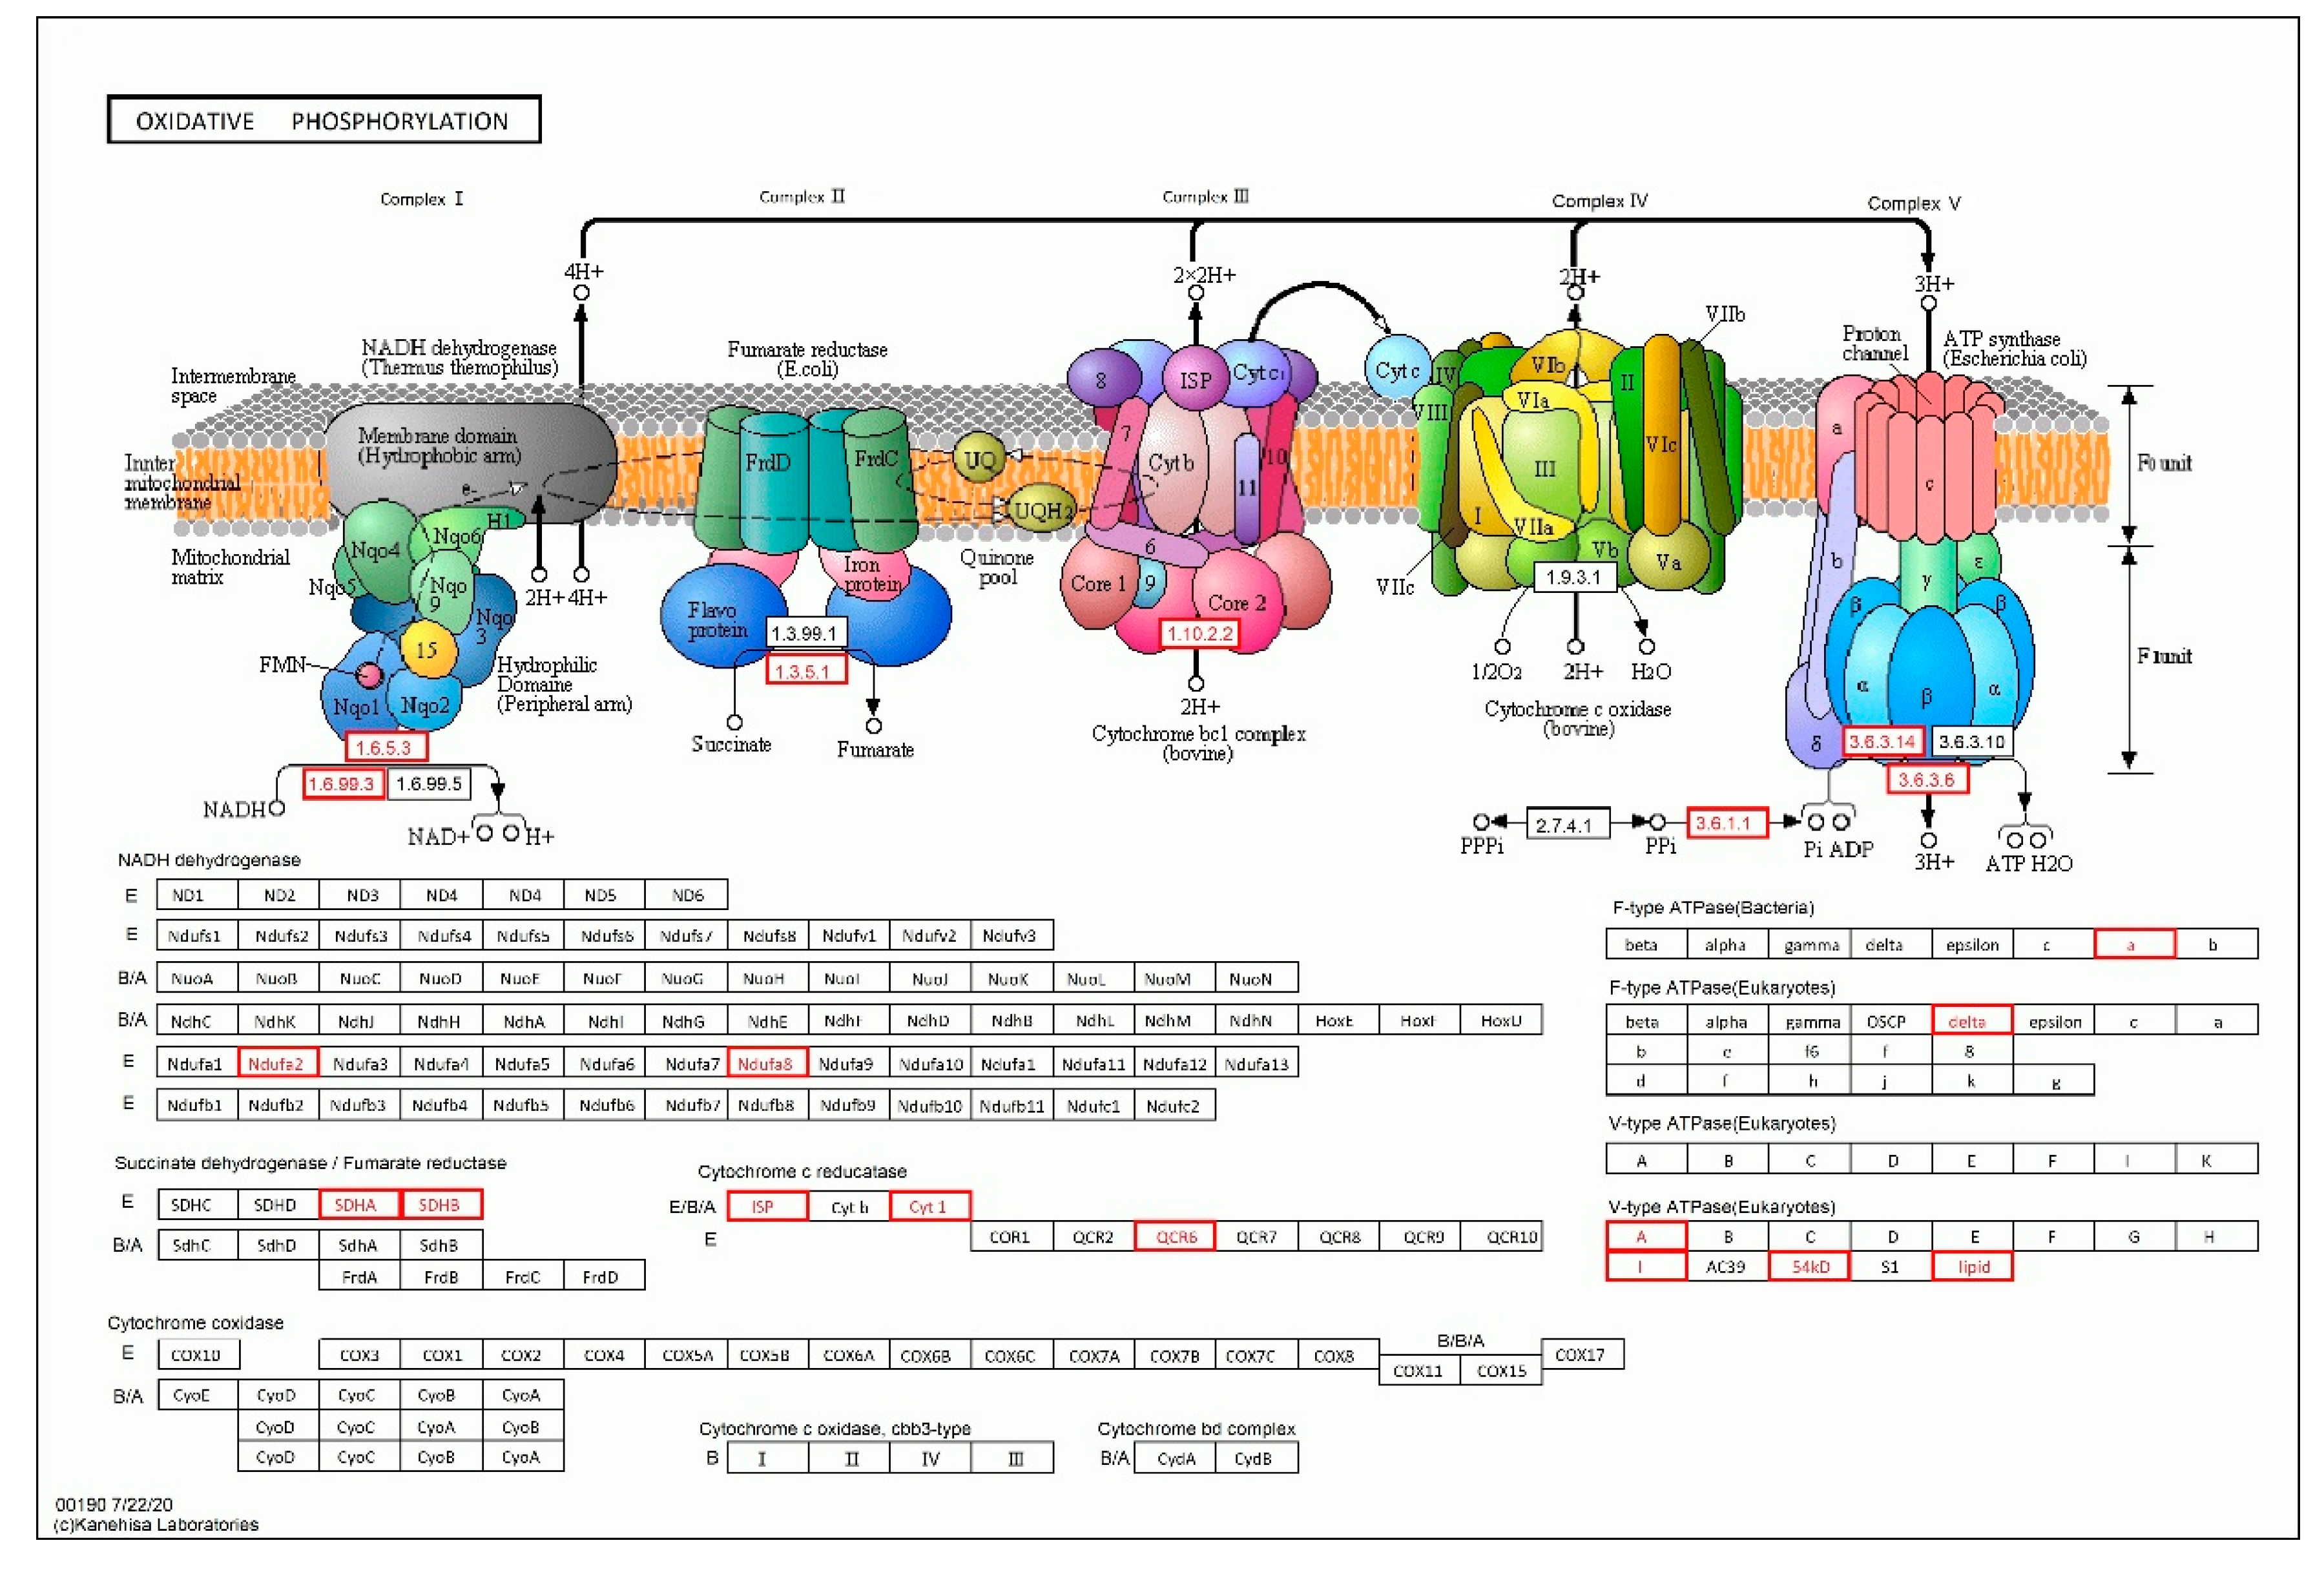
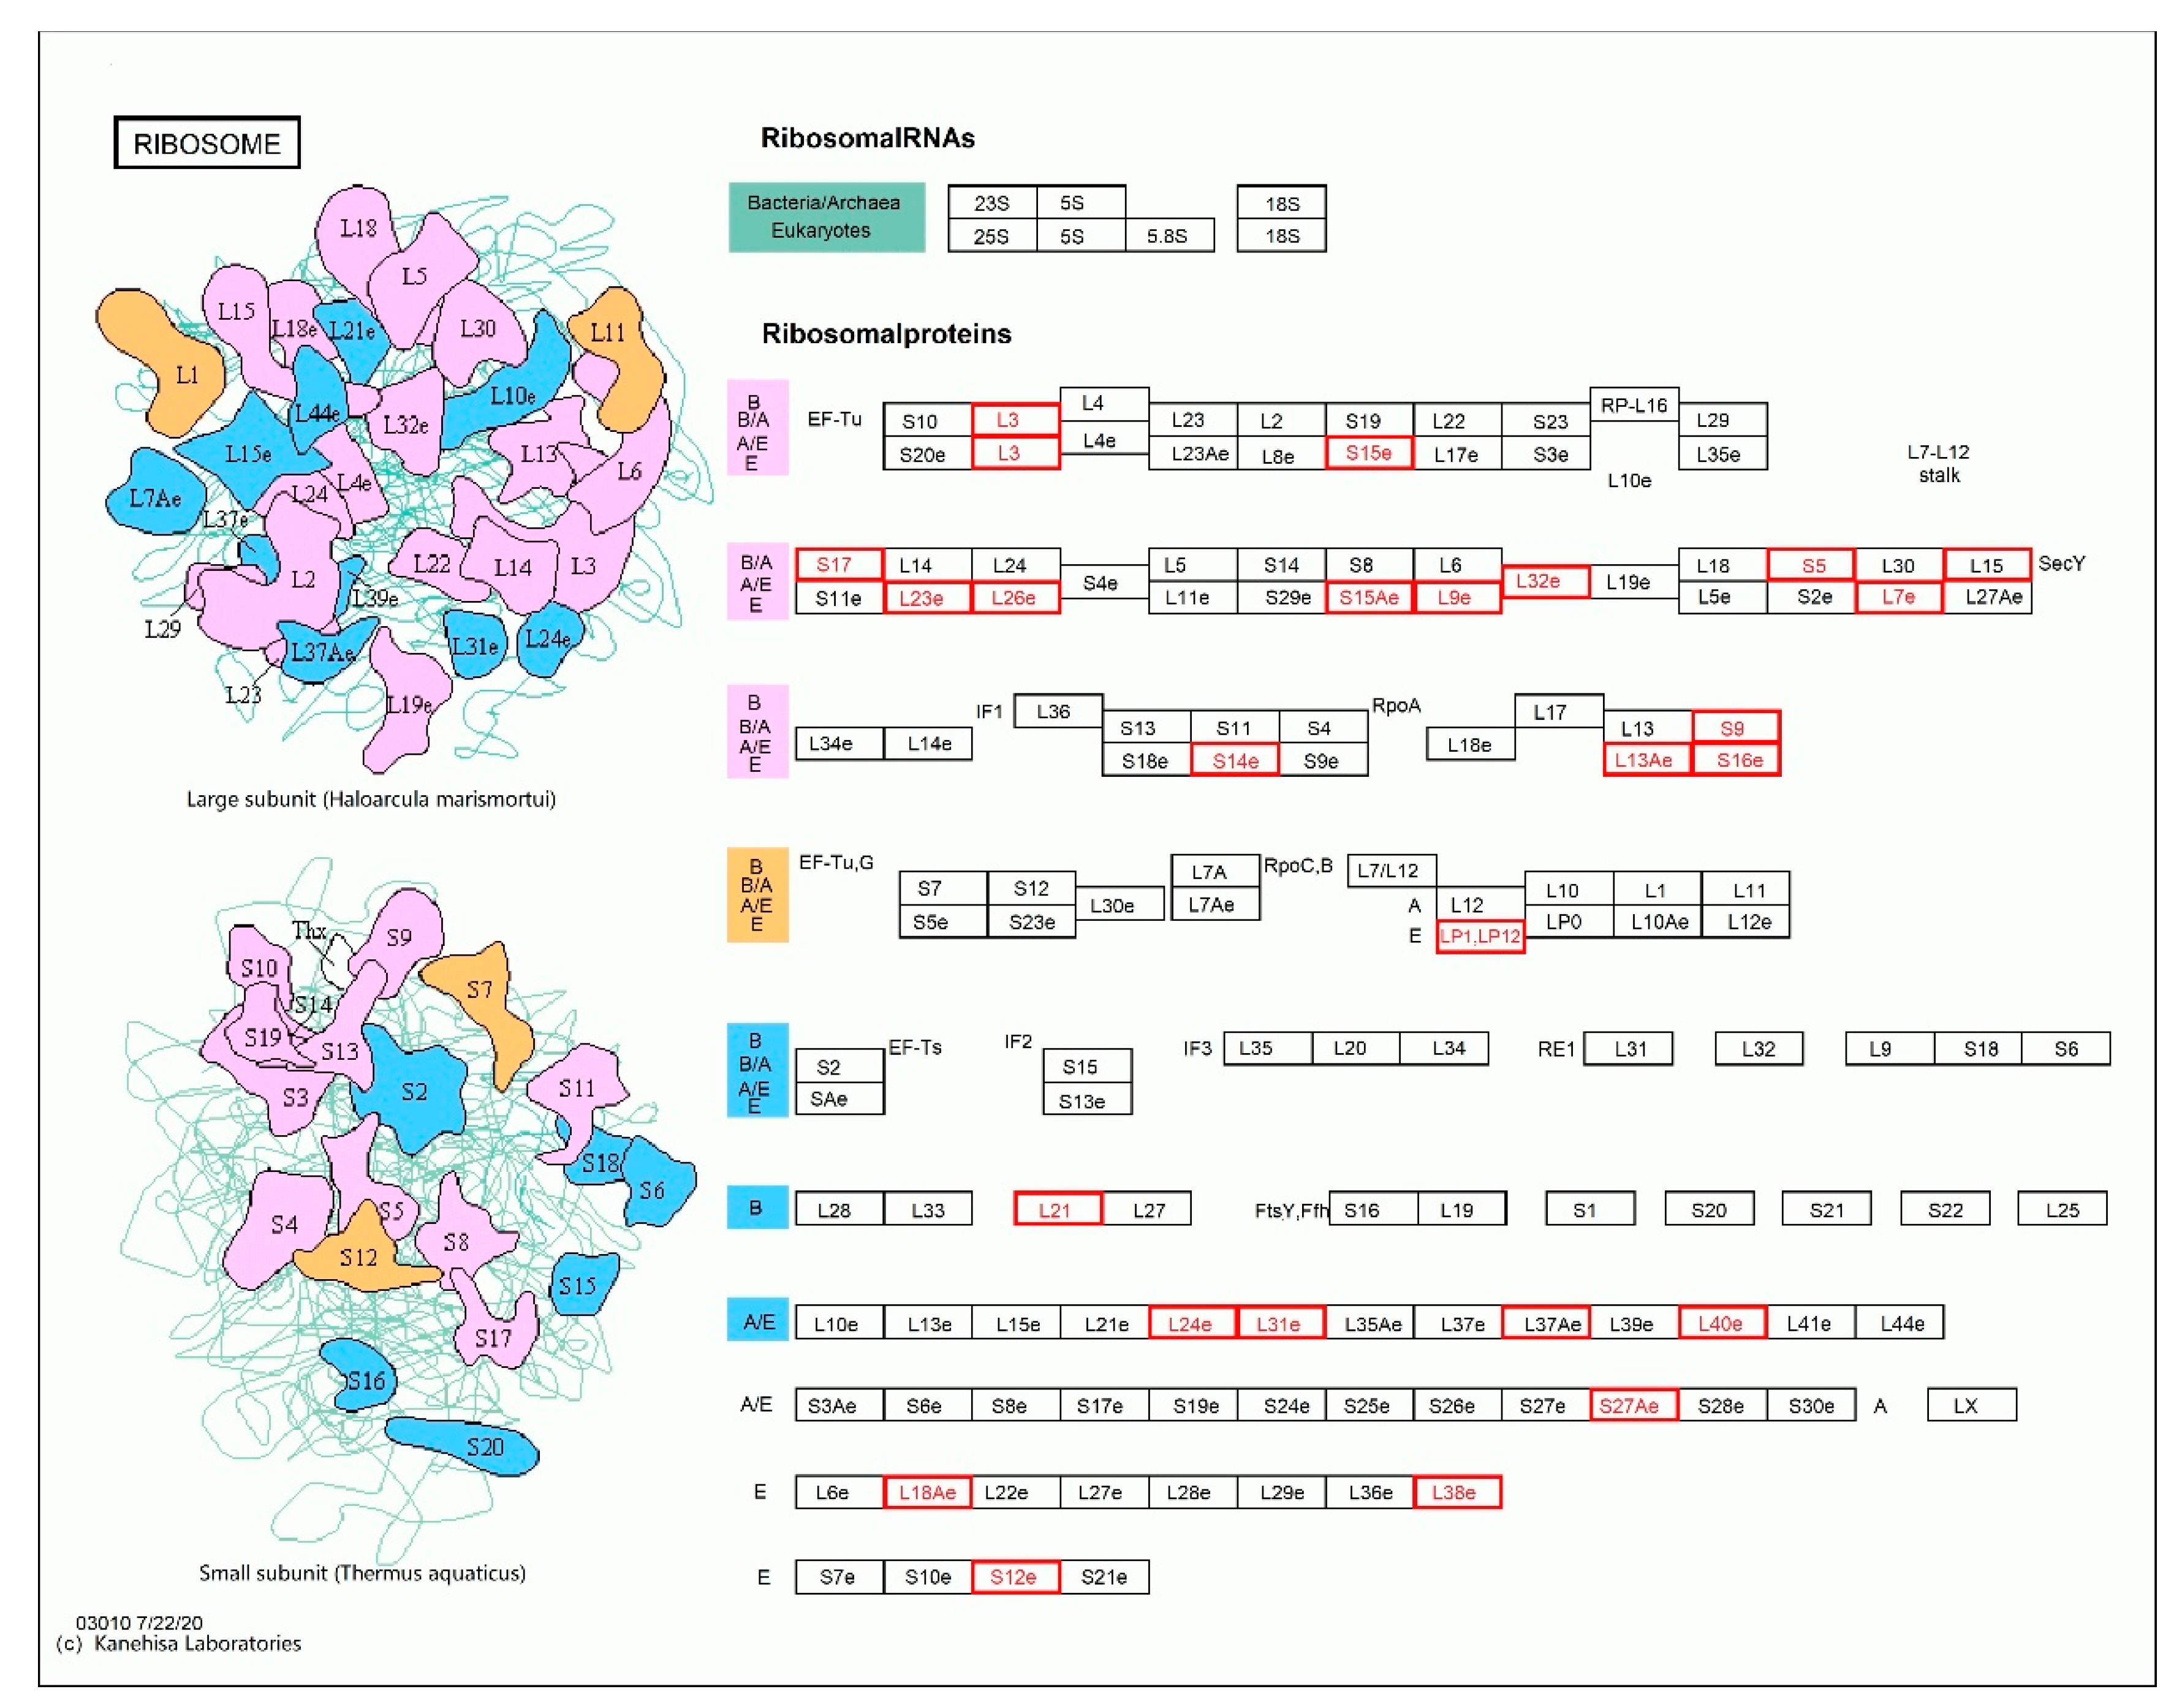
3.4. Analysis of Critical Pathways

The greater the number of DEGS in a particular type or metabolic pathway, the greater the redundancy of genes, involved in that type of life activity, the richer the metabolic pathways that may occur, resulting in a greater variety of physiological phenomena. A high number of DEGs in metabolic pathways makes it more likely for those genes to regulate life activities and have a greater impact on the phenotypic traits of species [25,26,27,28]. The analysis of the main enrichment pathways among the 633 core genes could help better understand the molecular basis of bamboo culm wall-thickening. The culm wall requires the mobilization of more sugars for synthesis and more active energy metabolism during the thickening growth [29,30,31]. Therefore, we selected the three pathways with a higher number of genetic mutations occurring in metabolic pathways, as well as representative genes of those pathways, to explore further.
Starch and sucrose are the main end-products of plant photosynthesis [32]. SNPs or InDels were present in 19 of the core poor genes in the starch and sucrose metabolic pathways (Figure 5), but there were six genetic mutations that did not cause amino acid changes (PH01000679G0170, PH01000035G0110, PH01000026G0020, PH01005567G0040, PH01000376G0610, PH01001213G0550). The remaining 13 mutant genes changed the number of amino acids that were not the same (Table 2).
Oxidative phosphorylation is an important part of the process by which substances release energy during oxidation in plants [33]. Among the 633 DEGs set, 15 genes were enriched in the metabolic pathway of oxidative phosphorylation, of which seven gene mutations (PH01000465G0500, PH01003254G0190, PH01001083G0220, PH01002804G0240, PH01002320G0330, PH01002524G0200, PH01000299G0200) did not cause amino acid changes (Figure 6 and Table 3).
The ribosome is the place where the process of RNA translation into protein occurs, which directly affects the performance of organisms [34]. A total of 29 core DEGs were annotated into the ‘ribosomal metabolic’ pathways, 10 of which were distributed on the ‘small subunit’ and 19 on the ‘large subunit’ (Figure 7). Mutations in 18 of the 29 DEGs altered the sequence of amino acids, 11 on the ‘large subunit’ and 7 on the ‘small subunit’. The number of amino acid changes caused by the PH01000716G0300 gene was large, leading to six amino acid sequence changes. PH01000145G0580, PH01000632G0190, PH01001171G0230, PH01002396G0040, PH01000716G0300, PH01000553G0230, and PH01001955G0010 also had base insertions and deletions at the same time in the exon region, which had a stronger impact on RNA translation (Table 4).

4. Discussion

4.1. A New Perspective on Gene Set Subtraction

The subtraction of gene sets provides new clues for bioinformatics research applications in plants. Plant traits are regulated by a network of numerous genes [35], thus, probing those genes through bioinformatics is often costly as it requires the analysis of large populations and expensive sequencing. Although the cost of sequencing has been reduced as a result of technological advances, conventional research strategies for plant trait regulation, such as bulked segregant analysis (BSA) [36,37] and genome-wide association studies (GWAS) [38,39], require large populations and large sample sizes to meet the needs, ultimately resulting in high research costs. The set of differential genes obtained by phase-down whole-genome resequencing can greatly narrow the range of candidate differential genes. The use of gene set subtraction provides a new strategy to apply bioinformatics. Not only resequencing data, but also transcriptomic and proteomic data, can be used to explore questions along these lines. The combination of bioinformatics and mathematics can provide a shortcut to complex biological problems.
However, it cannot be denied that this method is flawed and does not allow for hyperfine localization of trait-regulated genes. There are countless differences between each life form. The DEGs set obtained by subtracting the gene set may be related to all the differences. Therefore, we cannot be completely sure which specific gene in the gene set is responsible for which differences. By analyzing the regulatory and metabolic pathways influenced by these genes, we can essentially identify the main physiological activity differences responsible for the significant differences in traits.

4.2. A Gene Set for Bamboo Culm Wall Thickness Regulation Containing 633 Candidate Genes

Bamboo culm walls vary in thickness, regardless if it is herbal bamboo or woody bamboo. The growth of bamboo shoots before being unearthed is dominated by thickening growth, and the thickness of culm after being unearthed has already been determined. After being excavated, the growth of bamboo culm wall will not be thickened, and the growth of internodes will be dominated by high growth. The most significant difference between P. edulis ‘Pachyloen’, P. nidularia f. farcta, P. heteroclada f. solida, and S. dumetorum var. xinwuense is the thickness of the culm wall [40]. We have identified a gene set, containing 633 thickness-associated regulatory candidate genes of bamboo culm, by sampling during the thickening growth process and using gene set subtraction. In addition to the thickness of the culm wall, there are still imperceptible differences between the four bamboo species. The genes associated with these differences were essentially included in this candidate set. The screening of candidate gene sets can be of great help for subsequent research.

4.3. Reticulation Pathway for Bamboo Culm Wall Thickness Control

It was found that starch and sucrose, oxidative phosphorylation, and ribosome were the major metabolic pathways involved in bamboo culm wall thickening, with up to 116 metabolic pathways regulating these processes in a meshwork of metabolic pathways. It has been shown that the shoot apical meristem (SAM) plays an important role in the development of bamboo culm wall thickening. A larger SAM leads to elevated levels of hormones (e.g., cytokinin and growth hormone) and upregulation of hormone signaling and downstream functional genes (e.g., metabolism-related genes), ultimately leading to thickening of the bamboo culm wall [41]. The growth of SAM requires large amounts of energy and nutrients, which is consistent with the results of this study showing that many differential genes are enriched in the metabolic pathway of starch and sucrose and oxidative phosphorylation. Therefore, the study of the major metabolic pathways can help explain the differences in bamboo wall thickness, with a mutation in one or more of these pathways may result in a significant change in the trait. We have selected the three most abundant pathways to analyze the mutated genes, and although these genes will need to be validated in subsequent studies, we are significantly closer to confirming them. Bamboo with a thick culm wall is more valuable than thin-walled bamboo and has more applications. The use of modern breeding methods to cultivate good varieties with thickened bamboo culm walls after exploring the gene regulation network for thickened bamboo walls could be a boon to the bamboo industry.

5. Conclusions

In this study, we obtained a set comprising 633 genes related to bamboo culm wall thickness regulation by gene set reduction. Starch and sucrose, oxidative phosphorylation, and ribosome were the major metabolic pathways leading to bamboo culm wall thickening, as determined by DEGs enrichment analysis. Although it cannot be used for hyperfine localization of bamboo wall thickness-regulated genes, gene set reduction narrows down the range of candidate genes at minimal cost and provides new clues for the application of bioinformatics in plant research.

Supplementary Materials

The following are available online at https://www.mdpi.com/1999-4907/11/12/1331/s1, Supplementary File S1: The IDs of 633 candidate genes; Supplementary File S2: The KEGG enrichment pathway information for the 633 DEGs.

Author Contributions

Data curation, Y.H.; Formal analysis, J.Z. and Z.Y.; funding acquisition, Q.G.; investigation, J.C., J.L. and G.W.; writing—original draft, Y.H.; writing—review and editing, Q.G. All authors read and approved the final version of the manuscript.

Funding

This research was funded by The National Natural Science Foundation of China, grant number 31971648.

Acknowledgments

We thank the Co-Innovation Center for Sustainable Forestry in Southern China and the International Center of Bamboo and Rattan for allowing us to use their research facilities.

Conflicts of Interest

The authors declare no conflict of interest.

Abbreviations

GOGene Ontology
InDelInsertion-Deletion
KEGGKyoto Encyclopedia of Genes and Genomes
SNPSingle Nucleotide Polymorphism

References

  1. Xie, J.; Hong, M. Effects of ecological factors on growth of Arundinaria spanostachya shoots in Liziping National Nature Reserve, China. Glob. Ecol. Conserv. 2020, 23. [Google Scholar] [CrossRef]
  2. Safial, A.Z.; Ramlah, L.; Azizi, B.; Binti, A.N.F.L.; Binti, E.N. Malay Wisdom in the Motifs of Bamboo Shoots. Shs Web Conf. 2018, 45, 02004. [Google Scholar]
  3. Soreng, R.J.; Peterson, P.M.; Romaschenko, K.; Davidse, G.; Zuloaga, F.O.; Judziewicz, E.J.; Filgueiras, T.S.; Davis, J.I.; Morrone, O. A worldwide phylogenetic classification of the Poaceae (Gramineae). J. Syst. Evol. 2015, 53, 117–137. [Google Scholar] [CrossRef]
  4. Huang, N.-J.; Li, J.-P.; Yang, G.-Y.; Yu, F. Two plastomes of Phyllostachys and reconstruction of phylogenic relationship amongst selected Phyllostachys species using genome skimming. Mitochondrial DNA Part B Resour. 2020, 5, 69–70. [Google Scholar] [CrossRef] [Green Version]
  5. Wang, Y.; Sun, X.; Ding, Y.; Fei, Z.; Jiao, C.; Fan, M.; Yao, B.; Xin, P.; Chu, J.; Wei, Q. Cellular and molecular characterization of a thick-walled variant reveal a pivotal role of shoot apical meristem in transverse development of bamboo culm. J. Exp. Bot. 2019, 70, 3911–3926. [Google Scholar] [CrossRef] [PubMed]
  6. Miyashima, S.; Sebastian, J.; Lee, J.-Y.; Helariutta, Y. Stem cell function during plant vascular development. EMBO J. 2013, 32, 178–193. [Google Scholar] [CrossRef] [Green Version]
  7. Hu, Y.; Zhang, Y.; Zhou, J.; Wang, G.; Guo, Q. Transcriptome Reveals the Specificity ofPhyllostachys edulis’Pachyloen’ Shoots at Different Developmental Stages. Forests 2020, 11, 861. [Google Scholar] [CrossRef]
  8. Meraj, T.A.; Fu, J.; Raza, M.A.; Zhu, C.; Shen, Q.; Xu, D.; Wang, Q. Transcriptional Factors Regulate Plant Stress Responses Through Mediating Secondary Metabolism. Genes 2020, 11, 346. [Google Scholar] [CrossRef] [Green Version]
  9. Sharma, L.; Priya, M.; Kaushal, N.; Bhandhari, K.; Chaudhary, S.; Dhankher, O.P.; Prasad, P.V.V.; Siddique, K.H.M.; Nayyar, H. Plant growth-regulating molecules as thermoprotectants: Functional relevance and prospects for improving heat tolerance in food crops. J. Exp. Bot. 2020, 71, 569–594. [Google Scholar] [CrossRef]
  10. Toleco, M.R.; Naake, T.; Zhang, Y.; Heazlewood, J.L.; Fernie, A.R. Plant Mitochondrial Carriers: Molecular Gatekeepers That Help to Regulate Plant Central Carbon Metabolism. Plants 2020, 9, 117. [Google Scholar] [CrossRef] [Green Version]
  11. Yin, J.; Yi, H.; Chen, X.; Wang, J. Post-Translational Modifications of Proteins Have Versatile Roles in Regulating Plant Immune Responses. Int. J. Mol. Sci. 2019, 20, 2807. [Google Scholar] [CrossRef] [PubMed] [Green Version]
  12. Trneny, O.; Vlk, D.; Mackova, E.; Matouskova, M.; Repkova, J.; Nedelnik, J.; Hofbauer, J.; Vejrazka, K.; Jakesova, H.; Jansa, J.; et al. Allelic Variants for Candidate Nitrogen Fixation Genes Revealed by Sequencing in Red Clover (Trifolium pratense L.). Int. J. Mol. Sci. 2019, 20, 5470. [Google Scholar] [CrossRef] [PubMed] [Green Version]
  13. Zhao, C.; Liu, L.; Safdar, L.B.; Xie, M.; Cheng, X.; Liu, Y.; Xiang, Y.; Tong, C.; Tu, J.; Huang, J.; et al. Characterization and Fine Mapping of a Yellow-Virescent Gene Regulating Chlorophyll Biosynthesis and Early Stage Chloroplast Development inBrassica napus. G3-Genes Genomes Genet. 2020, 10, 3201–3211. [Google Scholar] [CrossRef]
  14. Khanh Le, N.; Grondin, A.; Courtois, B.; Gantet, P. Next-Generation Sequencing Accelerates Crop Gene Discovery. Trends Plant Sci. 2019, 24, 263–274. [Google Scholar] [CrossRef]
  15. Lin, X.C.; Ruan, X.S.; Lou, Y.F.; Guo, X.Q.; Fang, W. Genetic similarity among cultivars of Phyllostachys pubescens. Plant Syst. Evol. 2009, 277, 67–73. [Google Scholar] [CrossRef]
  16. Darwis, A.; Iswanto, A.H.; Jeon, W.-S.; Kim, N.-H.; Wirjosentono, B.; Susilowati, A.; Hartono, R. Variation of Quantitative Anatomical Characteristics in the Culm of Belangke Bamboo (Gigantochloa pruriens). Bioresources 2020, 15, 6617–6626. [Google Scholar] [CrossRef]
  17. Zhang, B.; Guo, Y.; Liu, X.e.; Chen, H.; Yang, S.; Wang, Y.g. Mechanical Properties of the Fiber Cell Wall in Bambusa pervariabilis Bamboo and Analyses of Their Influencing Factors. Bioresources 2020, 15, 5316–5327. [Google Scholar] [CrossRef]
  18. Peng, Z.; Lu, Y.; Li, L.; Zhao, Q.; Feng, Q.; Gao, Z.; Lu, H.; Hu, T.; Yao, N.; Liu, K.; et al. The draft genome of the fast-growing non-timber forest species moso bamboo (Phyllostachys heterocycla). Nat. Genet. 2013, 45, 456–461. [Google Scholar] [CrossRef] [Green Version]
  19. Li, H.; Durbin, R. Fast and accurate short read alignment with Burrows-Wheeler transform. Bioinformatics 2009, 25, 1754–1760. [Google Scholar] [CrossRef] [Green Version]
  20. DePristo, M.A.; Banks, E.; Poplin, R.; Garimella, K.V.; Maguire, J.R.; Hartl, C.; Philippakis, A.A.; del Angel, G.; Rivas, M.A.; Hanna, M.; et al. A framework for variation discovery and genotyping using next-generation DNA sequencing data. Nat. Genet. 2011, 43, 491. [Google Scholar] [CrossRef]
  21. Young, M.D.; Wakefield, M.J.; Smyth, G.K.; Oshlack, A. Gene ontology analysis for RNA-seq: Accounting for selection bias. Genome Biol. 2010, 11. [Google Scholar] [CrossRef] [PubMed] [Green Version]
  22. Mao, X.Z.; Cai, T.; Olyarchuk, J.G.; Wei, L.P. Automated genome annotation and pathway identification using the KEGG Orthology (KO) as a controlled vocabulary. Bioinformatics 2005, 21, 3787–3793. [Google Scholar] [CrossRef] [PubMed]
  23. Ossowski, S.; Schneeberger, K.; Lucas-Lledo, J.I.; Warthmann, N.; Clark, R.M.; Shaw, R.G.; Weigel, D.; Lynch, M. The Rate and Molecular Spectrum of Spontaneous Mutations in Arabidopsis thaliana. Science 2010, 327, 92–94. [Google Scholar] [CrossRef] [PubMed] [Green Version]
  24. Wang, Z.; Moult, J. SNPs, protein structure, and disease. Hum. Mutat. 2001, 17, 263–270. [Google Scholar] [CrossRef] [PubMed]
  25. Nishitani, C.; Inoue, E.; Saito, T.; Ogata, N.; Kita, K.; Gonai, T.; Kasumi, M.; Ishii, R.; Sawamura, Y.; Takada, N.; et al. Transcriptome analysis of watercore in Pyrus pyrifolia by comparing pairs of susceptible and resistant F1 sibs. Sci. Hortic. 2020, 264. [Google Scholar] [CrossRef]
  26. Zhang, L.; Yin, X.; Zhang, J.; Wei, Y.; Huo, D.; Ma, C.; Chang, H.; Cai, K.; Shi, H. Comprehensive microbiome and metabolome analyses reveal the physiological mechanism of chlorotic Areca leaves. Tree Physiol. 2020. [Google Scholar] [CrossRef]
  27. Zhou, Q.; Fu, H.; Yang, D.; Ye, C.; Zhu, S.; Lin, J.; Ye, W.; Ji, G.; Ye, X.; Wu, X.; et al. Differential alternative polyadenylation contributes to the developmental divergence between two rice subspecies, japonica and indica. Plant J. 2019, 98, 260–276. [Google Scholar] [CrossRef]
  28. Sharma, N.; Singh, S.K.; Mahato, A.K.; Ravishankar, H.; Dubey, A.K.; Singh, N.K. Physiological and molecular basis of alternate bearing in perennial fruit crops. Sci. Hortic. 2019, 243, 214–225. [Google Scholar] [CrossRef]
  29. Yin, K.; Mylo, M.D.; Speck, T.; Wegst, U.G.K. Bamboo-inspired tubular scaffolds with functional gradients. J. Mech. Behav. Biomed. Mater. 2020, 110. [Google Scholar] [CrossRef]
  30. Luo, J.; Liu, R.; Zhang, S.; Lian, C.; Yang, F.; Fei, B. Comparative culm anatomy of metaxylem vessel pits in three different types of bamboo rhizome. IAWA J. 2020, 41, 141–158. [Google Scholar] [CrossRef]
  31. Wang, K.-L.; Wang, B.; Hu, R.; Zhao, X.; Li, H.; Zhou, G.; Song, L.; Wu, A.-m. Characterization of hemicelluloses in Phyllostachys edulis (moso bamboo) culm during xylogenesis. Carbohydr. Polym. 2019, 221, 127–136. [Google Scholar] [CrossRef] [PubMed]
  32. Boardman, K.N. Comparative Photosynthesis of Sun and Shade Plants. Annu. Rev. Plant Physiol. 1977, 28, 355–377. [Google Scholar] [CrossRef]
  33. Heiden, M.G.V.; Cantley, L.C.; Thompson, C.B. Understanding the Warburg Effect: The Metabolic Requirements of Cell Proliferation. Science 2009, 324, 1029–1033. [Google Scholar] [CrossRef] [PubMed] [Green Version]
  34. Jacob, F.; Monod, J. Genetic regulatory mechanisms in the synthesis of proteins. J. Mol. Biol. 1961, 3, 318–356. [Google Scholar] [CrossRef]
  35. Chen, Z.J. Genetic and epigenetic mechanisms for gene expression and phenotypic variation in plant polyploids. Annu. Rev. Plant Biol. 2007, 58, 377–406. [Google Scholar] [CrossRef] [Green Version]
  36. Abe, A.; Kosugi, S.; Yoshida, K.; Natsume, S.; Takagi, H.; Kanzaki, H.; Matsumura, H.; Yoshida, K.; Mitsuoka, C.; Tamiru, M.; et al. Genome sequencing reveals agronomically important loci in rice using MutMap. Nat. Biotechnol. 2012, 30, 174–178. [Google Scholar] [CrossRef] [Green Version]
  37. Xue, H.; Shi, T.; Wang, F.; Zhou, H.; Yang, J.; Wang, L.; Wang, S.; Su, Y.; Zhang, Z.; Qiao, Y.; et al. Interval mapping for red/green skin color in Asian pears using a modified QTL-seq method. Hortic. Res. 2017, 4. [Google Scholar] [CrossRef] [Green Version]
  38. Korte, A.; Farlow, A. The advantages and limitations of trait analysis with GWAS: A review. Plant Methods 2013, 9. [Google Scholar] [CrossRef] [Green Version]
  39. Visscher, P.M.; Wray, N.R.; Zhang, Q.; Sklar, P.; McCarthy, M.I.; Brown, M.A.; Yang, J. 10 Years of GWAS Discovery: Biology, Function, and Translation. Am. J. Hum. Genet. 2017, 101, 5–22. [Google Scholar] [CrossRef] [Green Version]
  40. Liese, W.; Khl, M. Bamboo—The Plant and its Uses; Springer: Berlin, Germany, 2015. [Google Scholar]
  41. Guo, L.; Sun, X.; Li, Z.; Wang, Y.; Fei, Z.; Jiao, C.; Feng, J.; Cui, D.; Feng, X.; Ding, Y.; et al. Morphological dissection and cellular and transcriptome characterizations of bamboo pith cavity formation reveal a pivotal role of genes related to programmed cell death. Plant Biotechnol. J. 2019, 17, 982–997. [Google Scholar] [CrossRef]
Figure 1. Subtraction of gene sets. The genome of P. edulis ‘Pachyloen’, P. nidularia f. farcta, P. heteroclada f. solida, and Schizostachyum dumetorum var. xinwuense was compared with the reference genome of P. edulis to obtain the different gene sets (AD). The intersection of AC contained essential genes that regulate bamboo wall thickness and maintain minimum survival functions. Similarly, the intersection of AD only contain essential genes for maintaining minimal survival functions. Thus, the intersection of AC minus the intersection of AD result in the genes regulating bamboo culm wall thickening.
Forests 11 01331 g001
Figure 2. Differential gene set generated by comparison to the reference genome.
Forests 11 01331 g002
Figure 3. Gene Ontology (GO) classification of the differentially expressed genes. All annotated genes were divided into three functional GO categories: Biological process (BP), cellular component (CC), and molecular function (MF).
Forests 11 01331 g003
Figure 4. Kyoto Encyclopedia of Genes and Genomes (KEGG) annotation of differentially expressed genes.
Forests 11 01331 g004
Figure 5. Differentially expressed genes in starch and sucrose metabolism. The red box shows the mutant gene.
Forests 11 01331 g005
Figure 6. Differentially expressed genes involved in the process of oxidative phosphorylation. The red box shows the mutant gene.
Forests 11 01331 g006
Figure 7. Differentially expressed genes in the ribosome. The red box shows the mutant gene.
Forests 11 01331 g007
Table 1. Distribution of the unique single nucleotide polymorphisms (SNPs) and insertion-deletion (InDels) mutations identified in the four bamboo sample genomes.
Genomic RegionSNPInDel
P. edulis ‘Pachyloen’P. nidularia f. farcta P. heteroclada f. solida S. dumetorum var. xinwuense P. edulis ‘Pachyloen’P. nidularia f. farcta P. heteroclada f. solida S. dumetorum var. xinwuense
Intergenic1,624,97218,353,18916,685,473691,85866,350415,448282,18414,663
Intron32,534795,600763,191295,724232449,07933,4898934
Splice site acceptor11917321710979917512967
Splice site donor12814851499104923194153102
Splice site region127121,86222,26825,098114166313271015
ExonDisruptive inframe insertion----390210219431002
Disruptive inframe deletion----252250822801594
Synonymous13,070131,717137,171195,782----
Stop gained113113,62214,29017,5972015720072
Stop lost92011,47711,74415,85615169128106
Stop retained163245524963001----
Synonymous13,070131,717137,171195,782----
Non-synonymous30,243310,187322,148441,538----
Multiple alleles30814,29416,683570241123522313269
Homozygote294,83214,912,67211,846,9911,158,56933,127398,617234,71122,002
Heterozygote1,423,8204,800,2126,178,104519,04038,79988,09598,7219668
Total1,718,96019,727,17818,041,7781,683,31172,337489,064335,74531,939
Table 2. Details on the differentially expressed genes in starch and sucrose metabolism.
Gene IDFunctionNumber of Amino Acid Changes
PH01001102G0470glycosyl hydrolases46
PH01001643G0420kinase, pfkB family31
PH01000125G0770sucrose synthase14
PH01000173G0770alpha-amylase precursor6
PH01005448G0030glycosyl transferase family 84
PH01000171G0500beta-amylase4
PH01004013G0130trehalose-6-phosphate synthase2
PH01003937G0060glucose-1-phosphate adenylyltransferase large
subunit, chloroplast precursor
2
PH01000269G0880starch synthase1
PH01000362G0480trehalose precursor1
PH01000453G0440trehalose synthase1
PH01003516G0050glycosyl hydrolase family 3 protein1
PH01000028G0260glycosyl hydrolases1
Table 3. Details regarding differentially expressed genes involved in oxidative phosphorylation.
Gene IDFunctionNumber of Amino Acid Changes
PH01000003G0420succinate dehydrogenase iron-sulfur subunit
2, mitochondrial precursor
15
PH01001308G0210soluble inorganic pyrophosphatase13
PH01000553G0250ATP synthase delta chain, mitochondrial precursor7
PH01003807G0010plasma membrane ATPase7
PH01002058G0310plasma membrane ATPase5
PH01004724G0090inorganic H+ pyrophosphatase1
PH01000202G0040protein kinase1
PH01004931G0020soluble inorganic pyrophosphatase1
Table 4. Details regarding differentially expressed genes in the ribosome.
DistributionGene IDFunctionNumber of Amino Acid ChangesType of Mutation in the Exon Region
Small subunitPH01001546G037040S ribosomal protein S151-
PH01000291G1180phosphoglycerate mutase1-
PH01000845G0690transportin-22-
PH01005914G0060ribosomal protein2-
PH01002868G0010ribosomal protein4-
PH01002189G0040ribosomal protein L7Ae1-
PH01000145G0580ribosomal protein L33Frameshift variant
Large subunitPH01000632G0190ribosomal protein L32Inframe deletion
PH01002363G0020ribosomal protein L32-
PH01000734G0730ribosomal protein L241-
PH01002396G004050S ribosomal protein L151Disruptive inframe insertion
PH01000215G118060S ribosomal protein L311-
PH01001171G0230expressed protein2Frameshift variant
PH01000716G0300ribosomal protein L136Frameshift variant
PH01000553G0230tyrosine protein kinase domain containing protein2Frameshift variant
PH01001955G001050S ribosomal protein L21, chloroplast precursor2Frameshift variant
PH01006046G008060S ribosomal protein L37a1-
PH01002417G002060S ribosomal protein L381-
Publisher’s Note: MDPI stays neutral with regard to jurisdictional claims in published maps and institutional affiliations.

