Abstract
Research Highlights: Mangrove forests are absorbing anthropogenically produced excess nitrogen under moderate to intensive human interaction in the study sites, further indicating the degree of deviation from the natural ecosystem condition. Background and Objectives: Mangrove species, when directly connected to anthropogenic activities such as sewage disposal, agricultural inputs, and receiving of animal manure, absorb excess nutrients from the systems and act as ecological indicators of long-term natural changes. However, there is a paucity of examples of how the mangroves respond to a land-use gradient comparing to the non-mangrove plants under indirect anthropogenic impacts. Materials and Methods: In this investigation, foliar total nitrogen (N), carbon to nitrogen (C/N) ratio, and δ15N of mangrove and non-mangrove species collected from 15 watersheds on three islands in Okinawa, Japan, have been compared. The land-use areas in the study watersheds were delineated by ArcGIS software, and the correlation between the foliar traits and the human-affected area ratios were examined. Results: Foliar δ15N of the mangroves, which was significantly different from those of the non-mangroves on each island, showed significantly higher values (5‰ to 14‰) in human-affected forests, whereas the values were up to 3‰ in pristine forests. Furthermore, the significant positive relationship between foliar nitrogenous traits and the human-affected area ratios suggested that the anthropogenic N might be regulating foliar N content and δ15N signature on the sites. Conclusion: Different degrees of foliar isotopic fractionation with the land-use gradient have clarified that mangroves can be a powerful tool for monitoring ecosystem conditions under anthropogenic disturbances.
1. Introduction
Mangrove forests are ecologically important in trapping and storage sediments, nutrients, and heavy metals from inland runoff [1,2,3,4] and protect the surrounding ocean ecosystems from eutrophication [5,6]. The ongoing increase of anthropogenically produced reactive nitrogen (N) in the environment is one of the major causes of impairment to the natural condition and the valuable ecosystem services of mangrove forests [7,8,9,10,11]. However, inconsistent findings are available, which unveil mangroves as unpredictable and site-specific ecosystems throughout the tropical and sub-tropical countries. Though Valiela et al. [12] showed no relationship between the population density and the loss of mangrove forests, Alongi [13] claimed a reduction of them for the population load. In some places, mangroves have declined from the direct interaction of sewage inputs, maricultural practices, urbanization, hydrological changes, and land-use variation regardless of population density [14,15]. The mangroves, connected to the nutrient enrichment, were reported as long-term indicators of monitoring eutrophication trends in the ecosystems [16,17,18]. However, there is a gap in the comparative study of foliar traits of how mangroves differ from co-existing non-mangroves. Therefore, investigation of the site-specific responses of mangrove forests to anthropogenic disturbances is important for understanding the changes of the natural condition and how the mangroves are effective as ecological indicators of the changes of the ecosystems.
The δ15N composition of plant tissues appears systematically in identical environments [19] and provides reliable information about the origin of N [5,16,20,21,22,23]. The higher N supply from anthropogenic activities [24,25,26,27,28,29] enhances the stable isotope fractionation processes [30,31] like ammonia volatilization, nitrification, and denitrification leading to an elevated δ15N signature of ecosystem components [16,25,28,32]. In contrast, the systems with lower N availability restrict the gaseous N loss resulting in a low value of δ15N [32]. Previous studies reported that the δ15N values ranging from 10‰ to 22‰ are characteristic to the human and animal origin, whereas the naturally produced N through fixation or from the atmospheric deposition attributes the values from −2‰ to 0‰ [33,34], even as negative as −5.6‰ by cyanobacterial fixation [35]. Therefore, the recent studies have followed the typical way of comparing foliar traits of mangroves in human-affected sites with those in the unaffected or less affected sites [5,36,37,38,39]. However, the comparative study of foliar nitrogenous traits viz. foliar total N content, C/N ratio, and ẟ15N between mangroves and non-mangroves is yet absent.
Mangroves cover a small area of about 800 ha in Okinawa Prefecture, the south-western part of Japan in the Ryukyu Archipelago [40,41]. Okinawa Prefecture is associated with enormous environmental issues such as intense agriculture, infrastructure [42], deformation of natural landforms [43], red soil erosion and runoff, which have accounted for a large extent of destruction of marine and coral lives [44,45,46]. Therefore, the authors believe it is important to determine the foliar δ15N signature of co-existing mangroves and non-mangroves in watersheds under moderate to intensive human activities for reducing the gaps in understanding (1) whether the mangroves differ from the adjacent non-mangrove species in functioning anthropogenically originated reactive N; (2) whether any relationship exists between the foliar traits and respective land-use areas in the sampling sites; and (3) whether mangroves can be used as ecological indicators of monitoring anthropogenic impacts on Iriomote (natural environment), Ishigaki (moderately human-affected) and Okinawa (intensively human-affected) islands in Okinawa Prefecture, Japan.
2. Materials and Methods
2.1. Study Sites
A total of 15 watersheds named Urauchi, Kura, Shiira, Maera, Mare, Hinai, and Nakama on Iriomote Is., Nagura, Fukido, Miyara, Hirakubo, and Todoroki on Ishigaki Is. and Manko, Kesaji, and Okukubi on Okinawa Is. were selected as the study sites. The coordinates of the sampling points and collected leaf types are available in Table 1.

Table 1.
Sampling points in watersheds with collected leaf types and corresponding coordinates on three islands.
Each watershed of the three islands commonly comprises short channels, creeks, and swamps, which support the growth of mangroves along the shorelines with distinct zonation from the river mouth to the upstream area [47]. The non-mangrove communities have grown in parallel at the backside of the mangroves. The nearly entire area of Iriomote Is. is covered by the National Reserved Forest Park [48], which is commonly used for scientific research and small-scale tourism. In contrast, Okinawa and Ishigaki islands are accompanied by intensive agricultural activities, animal husbandry, local construction, and tourism, which are frequently found close to the mangrove forests [44,49]. The islands are generally under the humid-subtropical climate [50]. The average yearly temperature, humidity, and rainfall of the last five years on the three islands ranged from 23 to 26 °C, about 78% to 80% and approximately 1900 to 2400 mm, respectively (Japan Meteorological Agency, data collected in 2019). The inland flow to the downstream creeks, channels, and swamps of these areas largely depends on short-term weather conditions [44] and may carry a risk of nutrient enrichment to the oceans. Particularly, livestock farms and agricultural fields are highly considered to influence local-scale N cycling in the mangrove forests on Ishigaki and Okinawa islands.
2.2. Leaf Sample Collection
The dominant mangrove species on the sites such as Bruguiera gymnorrhiza, Rhizophora stylosa, and Kandelia obovata and the randomly selected non-mangrove species closely grown at the backside of the mangroves were chosen for leaf sample collection during summer (May to September) in the year of 2017 and 2018. Three points respective to the down, middle, and upstream areas in each watershed were selected for leaf sampling, which was possible only in five watersheds of Urauchi, Nagura, Kesaji, Okukubi, and Manko. In the rest of the watersheds, one or two sampling points were chosen because the mangrove areas along the creek were too small to focus on three streams. Besides, the non-mangroves closely grown within an area of a maximum of 20 m2 to the mangroves were sampled at each point except in the Mare watershed, where no mangroves were found. In this watershed, the non-mangrove trees, directly connected to the creek water, and closely grown to the adjacent mangroves in Hinai watershed, were sampled. Variation in foliar δ15N was examined in those watersheds where two plant groups were available within the designed sampling plots.
Three or more trees of each mangrove species were used for the replicated sampling from the water vicinity to the inland. On the other hand, five trees of collective non-mangrove species growing backside of the selected mangroves were chosen for sampling based on their availability at each point. The list of the non-mangrove species collected in each watershed is shown in Supplementary Table S1. A total of five sun-facing mature leaves per individual were collected from the middle-stage branch of the tree.
2.3. Processing of Leaf Samples and Analysis of Foliar N Content, C/N Ratio, and ẟ15N
The leaf samples were washed with pure water and wiped on sites, then taken to the laboratory, and dried in an oven at 60 °C (DNE 910, Yamato) for 48 h. The samples were ground into fine powder by a wonder blender and stored in a desiccator until analysis. Before every analysis, they were dried at 105 °C for at least 4 h to remove moisture.
The total content of foliar N (% of dry weight) and C (% of dry weight) of powdered leaf samples was measured using an NCH (Nitrogen, Carbon, Hydrogen) analyzer (SUMIGRAPH; SCAS), and C/N ratio was calculated. Foliar δ15N was measured using an on-line isotope ratio mass spectrometer coupled to continuous flow interface (Temperature Conversion/Elemental Analyzer-IRMS), a combined set up of the ConFlo IV interface, Flash 2000 and Flash 2000 HT Plus, CNSOH and Delta V Advantage Isotope Ratio Mass Spectrometer (IRMS, Thermo Fisher Scientific, Waltham, MA, USA).
2.4. Processing the Land-Use Map
The land-use maps of the study watersheds (available in Supplementary Figure S1) were delineated by using ArcMap Geographic Information Services (GIS) software (ArC Map 10.4.1). The source data for the watershed borders and land-use were obtained from the National Land Policy Bureau, Japan Ministry of Land, Infrastructure, Transport, and Tourism. The baseline of the creek, swamp, and coastlines was obtained from the land conservation maps (1:200,000) from the Geospatial Information Authority of Japan (GSI). The mangrove areas in each watershed were adjusted by field survey and their visual observation on the Google map. Therefore, little inaccuracy in mangrove area delineation is considered. The land-use was divided into four groups viz. forest (mangroves plus non-mangroves), agricultural, residential, and creek and/or swamp areas, as shown in Table 2.
Table 2.
Land-use areas and population density in the study watersheds on three islands.
Generally, the forest areas in watersheds on Iriomote, Ishigaki, and Okinawa islands ranged from 92% to nearly 100%, 35% to 72%, and 14% to 78%, respectively. The largest forest area (about 100%) was found in Hinai and Shiira watersheds on Iriomote Is., whereas the largest human-affected area (agriculture plus residents; 84.5%) was found in Manko swamp watershed on Okinawa Is, followed by that (65.5%) in Todoroki watershed on Ishigaki Is. Eventually, the mangroves on Iriomote, Ishigaki, and Okinawa islands were categorized as pristine, moderately human-affected, and intensively human-affected forests, respectively.
2.5. Data Processing and Statistical Analysis
The measurement of δ15N is expressed in per mil unit (‰) calculated by the following equation:
where R is the ratio of heavier to lighter N isotope. Compressed N2 gas was served as the reference gas for measurement of 15N abundance in the sample relative to that in atmospheric N2. Isotopic values were calibrated using three working standards such as L-Alanine M9R2064 (AZ100: δ15N-Air = 1.79 ± 0.2‰); L-Alanine SS13 (AZ101; δ15N-Air = 13.7 ± 0.2‰) and L-Histidine M6M9675 (AZ120; δ15N-Air = 7.58 ± 0.2‰) supplied by the International Atomic Energy Agency.
δ15N = [(R sample − R reference)/R reference] × 1000
Foliar N, C, C/N ratio, and δ15N values were reported as mean ± standard error (SE). The analysis of variance (ANOVA) was performed to test the differences of foliar N, C/N ratio, and δ15N between the two plant groups (mangroves and non-mangroves) to compare within and among and the islands. The foliar data sets were examined for normality, and the mean values were investigated for the significance level of differences by Welch’s t-tests. Linear regression analyses were performed to detect the relationship between foliar data and land-use area. Data processing, statistical analysis, and presentation of graphs were done by using Excel 2010 (Microsoft, Redmond, WA, USA) and R software (version 3.5.1, R Core Team, Vienna, Austria).
3. Results
3.1. Variation in Foliar N Content, C/N Ratio, and δ15N on Islands
The distribution of foliar data sets of all the collected mangroves and non-mangroves has been shown in the boxplots representing their respective similarities and dissimilarities on the three islands (Figure 1). The highest values of foliar N (1.7 ± 0.7% N) and foliar δ15N (8.0 ± 1.6‰) of mangroves were found in Kandelia obovata on Okinawa Is., whereas the lowest values of those (0.92% ± 0.1% N and 1.4‰ ± 2.7‰) were determined in Rhizophora stylosa on Iriomote Is. Likewise, the highest foliar N and ẟ15N (1.9% ± 0.7% and 0.7‰ ± 1.4‰) and the lowest foliar N and ẟ15N (1.4% ± 0.7% and −2.6‰ ± 2.5‰) of non-mangroves were recorded on Okinawa Is. and Iriomote Is., respectively. However, the values of foliar N and δ15N for the mangroves and the non-mangroves collected from Ishigaki Is. placed between the values found on Iriomote Is. and Okinawa Is. The mean ± SE of foliar N, C/N ratio, and ẟ15N for the mangrove and the non-mangrove leaf samples used in this study are provided in Supplementary Table S2.
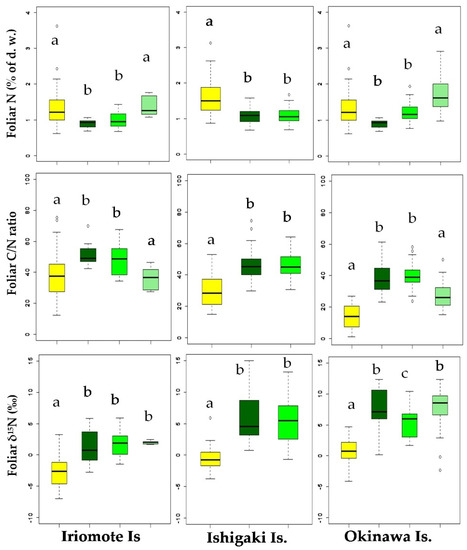
Figure 1.
Distribution of foliar data sets of N (% of dry weight), C/N ratio, and ẟ15N of mangroves and non-mangroves ( Non-mangroves
  R. stylosa
  B. gymnorrhiza
  K. obovate) on three islands. Boxplots represent the summary of data as a minimum, first quartile, median, third quartile, and a maximum. The whiskers are extended to the minimum and the maximum values from the first and the third quartiles, respectively. The outliers beyond the inner fence and the outer fence represent the extreme values that are outside of the summarized data. Different alphabets in each graph indicate the significant differences from each other.
Non-mangroves R. stylosa B. gymnorrhiza K. obovate) on three islands. Boxplots represent the summary of data as a minimum, first quartile, median, third quartile, and a maximum. The whiskers are extended to the minimum and the maximum values from the first and the third quartiles, respectively. The outliers beyond the inner fence and the outer fence represent the extreme values that are outside of the summarized data. Different alphabets in each graph indicate the significant differences from each other.
The Welch’s t-test analysis showed that average foliar N of the mangroves (Iriomote: 1.2% ± 0.05%; Ishigaki: 1.1% ± 0.20%, and Okinawa: 1.4% ± 0.05%) were significantly lower (p < 0.01) than those of the non-mangroves (Iriomote: 1.4% ± 0.22%; Ishigaki: 1.5% ± 0.16%, and Okinawa: 1.9% ± 0.16%) on each island. In accordance, average of foliar C/N ratio of the mangroves (Iriomote: 45.3 ± 1.5; Ishigaki: 46.1 ± 0.03, and Okinawa: 35.1 ± 1.3) were significantly higher (p < 0.01) from those of the non-mangroves (Iriomote: 38.9 ± 5.3; Ishigaki: 33.2 ± 3.3, and Okinawa: 24.9 ± 2.1) on each island. Similarly, average of foliar δ15N values of the mangroves were significantly higher (p < 0.01) than those of the non-mangroves on each island (Iriomote: mangroves, 1.7‰ ± 0.38‰; non-mangroves, −2.8‰ ± 0.76‰; Ishigaki: mangroves, 5.5‰ ± 0.62‰; non-mangroves, −0.6‰ ± 0.60‰; Okinawa: mangroves, 7.2‰ ± 0.55‰; non-mangroves, 0.7‰ ± 0.60‰). Furthermore, the foliar δ15N of both mangroves and non-mangroves collected from Okinawa Is. were significantly higher (p < 0.01) than those collected from Iriomote Is. and Ishigaki Is. In contrast to the foliar N, foliar C of the mangroves and the non-mangroves ranged from 43 to 48%, which varied significantly neither within the island nor among the islands.
3.2. Species Variation in Foliar δ15N in Watersheds
Foliar δ15N values of the mangroves and the non-mangroves were compared in each watershed. The comparison showed that the values of mangrove were significantly different from the values of non-mangroves (p <0.05) in all study watersheds (Figure 2). The foliar δ15N of the mangroves ranged from nearly 1‰ to 14‰ across the eight watersheds on the human-affected islands (Ishigaki and Okinawa). However, those ranged from 1 to 2‰ in four watersheds on Iriomote Is., which was assumed as a pristine environment. The lowest value of the mangroves foliar δ15N was found in B. gymnorrhiza (−0.02‰) in Kura watershed, followed by that in the same species (0.02‰) in Hinai watershed on Iriomote Is. Conversely, the highest value of the mangroves foliar δ15N was determined in R. stylosa (ca 14‰) in Todoroki watershed on Ishigaki Is., followed by those measured in R. stylosa and K. obovata (ca 10‰) in Manko swamp watershed on Okinawa Is. Moreover, all the values of foliar δ15N of the mangroves, collected from Ishigaki and Okinawa islands, were above 5‰ in all the watersheds except Fukido and Kesaji (Figure 2).
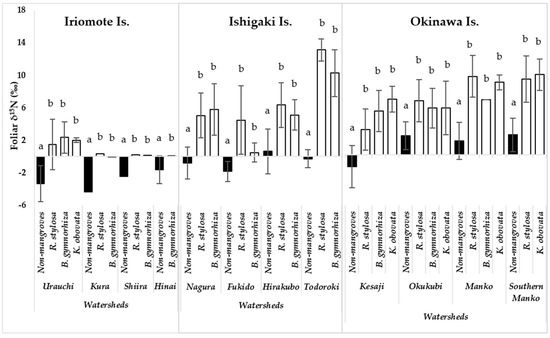
Figure 2.
Variation in foliar ẟ15N of non-mangrove and mangrove species in watersheds on three islands in Okinawa, Japan; Urauchi: Non-mangrove, n = 23; R. stylosa, n = 10; B. gymnorrhiza, n = 15; K. obovata, n = 5; Kura: Non-mangrove, n = 3; R. stylosa, n = 3; B. gymnorrhiza, n = 3; Shiira: Non-mangrove, n = 3; R. stylosa, n = 3; B. gymnorrhiza, n = 3; Hinai watershed: Non-mangrove, n = 5; B. gymnorrhiza, n = 3; Nagura: Non-mangrove, n = 19; R. stylosa, n = 16; B. gymnorrhiza, n = 16; Fukido: Non-mangrove, n = 4; R. stylosa, n = 5; B. gymnorrhiza, n = 5; Hirakubo: Non-mangrove, n = 7; R. stylosa, n = 7; B. gymnorrhiza, n = 10; Todoroki: Non-mangrove, n = 3; R. stylosa, n = 5; B. gymnorrhiza, n = 5; Kesaji: Non-mangrove, n = 9; R. stylosa, n = 7; B. gymnorrhiza, n = 14; K. obovata, n = 6; Okukubi: Non-mangrove, n = 6; R. stylosa, n = 6; B. gymnorrhiza, n = 15; K. obovata, n = 15; Manko: Non-mangroves, n = 5; R. stylosa, n = 9; B. gymnorrhiza, n = 3; K. obovata, n = 16; Southern Manko: Non-mangroves, n = 3; R. stylosa, n = 8, K. obovata, n = 22). The black and white columns represent non-mangrove and mangrove species, respectively. Error bars represent the standard error of the mean. The different alphabets indicate significant variation of foliar δ15N between non-mangrove and mangrove species in each watershed (p <0.05).
3.3. The Relationship among the Foliar N Content, C/N Ratio, ẟ15N and the Land-Use
For both the mangroves and the non-mangroves, the linear regression analyses between foliar δ15N and foliar N, as well as between foliar C/N ratio and foliar N, showed a significant correlation between them (Figure 3a). In addition, when foliar N and δ15N of both the mangroves and the non-mangroves were plotted against the human-affected areas, a significant positive correlation (p <0.01) was indicated (Figure 3b). The results suggested that the human activities particularly through the agricultural and residential areas might be responsible for higher N availability resulting in the N isotope ratio in foliar tissues of mangroves and non-mangroves on the study sites.
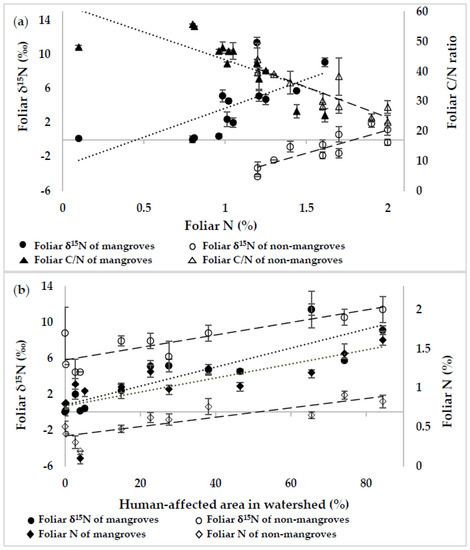
Figure 3.
The relationship of foliar ẟ15N and C/N ratio to foliar N content (a), and those of foliar ẟ15N and N content to human-affected area (b) in the study watersheds. Figure (a): the regression analysis between foliar δ15N (‰) and foliar N (%) of mangroves (y = −3.11 + 6.79x; R2 = 0.69; p = 0.008) and non-mangroves (y = −9.74 + 5.43x; R2 = 0.85; p = 0.001), and between foliar C/N ratio and foliar N (%) of mangroves (y = 62.5 − 18.6x; R2 = 0.65; p = 0.015) and non-mangroves (y = 65.5 − 20.5x; R2 = 0.86; p = 0.001); Figure (b): the regression analysis between foliar δ15N (‰) and total human-affected area (%) of mangroves (y = 0.42 + 0.11x; R2 = 0.89; p = 0.004) and non-mangroves (y = −2.63 + 0.05x; R2 = 0.85; p = 0.0008), and between foliar N (%) and total human-affected area (%) of mangroves (y = 0.88 + 0.01x; R2 = 0.86; p = 0.0001) and non-mangroves (y = 1.36 + 0.01x; R2 = 0.84; p = 0.0010). Error bars represent the standard error of the mean.
4. Discussion
4.1. Variation in Foliar Traits of Mangroves and Non-Mangroves
Many factors, including soil water availability, variable anthropogenic inputs, and disturbance history, can regulate the N availability and contribute to the foliar traits on sites [28]. The significant differences in foliar N, thereby in C/N ratio, and foliar ẟ15N between co-existing mangroves and non-mangroves reflected different levels of N availability for the nutrition of two plant groups on the sampling sites. Foliar C content of the two plant groups did not vary significantly (data not shown). It is known to be dependent on photosynthesis of the plants, regulated by the climatic variation, especially sunlight and air temperature [50]. Since the climatic parameters in the study sites do not vary remarkably, as mentioned in Section 2.1, the lifting of foliar N content and the consistent decrease of C/N ratio of both the mangroves and non-mangroves on Okinawa Is. (Table S2) compared to those on Iriomote Is. are probably due to relatively higher N availability in the intensively human-affected sampling sites on Okinawa Is. [51]. The results are also supported by the previous observation of Thimdee et al. [5] and Clough et al. [52] who have reported a higher value of foliar total N (about 2%) of mangroves receiving long-term sewage effluents than that (about 1%) of undisturbed mangroves.
In general, plants use a large portion of energy to root respiration for uptake and assimilation of N [53] to withstand in low-nutrient environments [54]. Moreover, it was reported that the mangroves are ones of the wood species that have the highest photosynthetic nitrogen-use efficiency (PNUE: the ratio of photosynthetic ability to N content in leaf) [55,56], which is one of the adaptive mechanisms of the mangroves [57] to grow under nutrient-limited conditions [58]. Therefore, it seems that mangroves are greatly able to absorb excess N from the external sources on the human-affected sites. The significantly lower values of foliar N and higher C/N ratio of the mangroves than those of the non-mangroves on each study island agree with the assumption.
4.2. Foliar ẟ15N of Mangroves and Non-Mangroves under Anthropogenic Impacts
Anthropogenic interaction regulates the local-scale N cycling [28] and sets the distinguishable signature of δ15N in plant tissues [19]. According to the inventory reported by Peterson and Fry [59] and Nadelhoffer et al. [60], the wood plants growing in the pristine environments throughout the world have a range of foliar δ15N values from −10‰ to 3‰. Although the foliar δ15N of all the non-mangroves collected from three islands placed within the natural range (Iriomote: −2.8‰ ± 2.4‰; Ishigaki: −0.6‰ ± 1.9‰; and Okinawa: 0.7‰ ± 1.9‰), only the Iriomote mangrove’s foliar δ15N (1.7‰ ± 2.1‰) followed them. The results are supported by the previous observation of Costanzo et al. [16] and Cole et al. [26] who reported foliar δ15N from 2‰ to 4‰ in the natural mangroves. In contrast, the foliar δ15N of mangroves on Ishigaki and Okinawa islands were 5.5‰ ± 3.4‰ and 7.2‰ ± 3.0‰, respectively, which were congruent with the previous studies of the disturbed mangroves [18]. In Florida, the foliar δ15N of disturbed mangroves directly connected to agricultural draining channels ranged between 11 and 16‰, whereas, the values ranged from −5‰ to 2‰ in a comparatively pristine mangrove forest [25]. In addition, the foliar δ15N of a Rhizophora apiculata community under the influence of higher N availability by anthropogenic inputs was recorded as 6‰ [15].
Okinawa and Ishigaki islands are associated with large extent disturbances of intensive agriculture, upland soil erosion, agricultural practices, urbanization, and tourism [42,43,44,45,46,49]. It seems that the mangroves on Okinawa Is. are receiving intensively elevated inputs of anthropogenic N with a mean foliar δ15N of 7.2‰, whereas there are slightly elevated inputs of anthropogenic N with a mean foliar δ15N of 5.5‰ on Ishigaki Is. [18]. Both were over the natural range of foliar δ15N (up to 3‰) of pristine mangroves, as found on Iriomote Is. The elevated foliar δ15N can be linked, firstly, to the isotopic composition of N pools and, secondly, the fractionation of isotopes during N uptake and assimilation by roots and leaves. Many studies have proved that no isotope fractionation occurs during root uptake [61] of ammonium [62], and nitrate [63] or the fractionation is very negligible (<0.3‰) in many plants [64]. Manko watershed on Okinawa Is. has the largest population density of 5460 km−2, and Todoroki and Miyara watersheds on Ishigaki Is. have the top two largest agriculture areas of 65% and 46%, respectively, associated with a relatively lower population density of 7 and 24 km−2, respectively (Table 2). It seems that those watersheds are responsible for the different degrees of isotope fractionation of external N on that respective islands.
Furthermore, the foliar ẟ15N values of mangroves were significantly higher (p <0.05) than those of the non-mangroves in every watershed on three islands (Figure 2). Different degrees of isotope fractionation and corresponding variation in foliar traits of mangroves in different watersheds are probably based on variable distances of waterways from N source to sinks [16,51], inter-species variation in N physiology, leaf life cycle of plants [65,66], and local-scale variability of microclimatic factors [51]. Costanzo et al. [16] have reported that δ15N of marine plant tissues declined gradually from 10‰ to 3‰ at the downstream river mouth with a relative decrease in the distance from the proximity of sewage outfalls. The highest foliar δ15N of mangrove (around 14‰) found in Todoroki watershed (Figure 2) might be due to the kinetic fractionation of N isotope via ammonia volatilization by urination from the large number of domestic animals (6198 of beef cattle, 389 pigs, 26 horses, and 8800 layers in an area of 49 km2; data collected from local municipality office; City Hall, Ishigaki Is.) closely grown to the sampling sites [21]. The second highest foliar δ15N of mangrove (around 9‰) was found in Manko swamp watershed, which was connected to large-scale urban development and agricultural fields (Table 2). In the previous studies, δ15N signatures were recorded as high as between 10‰ and 30‰ in the sources viz. livestock wastes, domestic wastewater [67] and wastewater treatment plant effluents [68,69], whereas those ranged from 11‰ to 16‰ in a mangrove forest directly connected to agricultural draining channels [25]. Contrastly, the depleted values of foliar δ15N of the mangroves on Iriomote Is. and all the non-mangroves on three islands firmly indicated that the plants were probably not absorbing anthropogenically produced N and were dependent on naturally produced N sources through fixation [70], atmospheric deposition [71], and mycorrhizal association [72].
The results of regression analysis of foliar data of the mangroves and non-mangroves clarified that the relative increase of N availability increases the foliar ẟ15N values significantly (p < 0.05) regardless of plant types (Figure 3a). The slopes between foliar ẟ15N and foliar N, and between foliar C/N ratio and foliar N of the mangroves (y = −3.11 + 6.79x and y = 62.5 − 18.6x, respectively) were slightly steeper than those of the non-mangroves (y = −9.74 + 5.43x and y = 65.5 − 20.5x, respectively). This suggested that the foliar traits of mangroves were more sensitive to relative N availability on the sites. In addition, foliar ẟ15N and foliar N content of both mangroves and non-mangroves showed a significant positive correlation (p <0.01) with the ratios of total human-affected area (Figure 3b). Although foliar N of the mangroves and the non-mangroves were found equally sensitive to increasing human-affected area (mangroves: y = 0.88 + 0.01x; non-mangroves: y = 1.36 + 0.01x), the change in foliar ẟ15N of the mangroves with the increase of human-affected areas was higher than that of the non-mangroves (mangroves: y = 0.42 + 0.11x; non-mangroves: y = −2.63 + 0.05x). Typically, all plants have the adaptabilities to withstand low-nutrient environments through the reduced requirement of nutrients and low growth rates over time [54]. Consequently, excess N supply may enhance relative uptake of N by plants if demanded, which is why non-mangroves also exhibit sensitivity to N availability from the anthropogenic sources. However, foliar ẟ15N signature of the non-mangroves showed that they relied mostly on naturally originated N sources. Even though both mangroves and non-mangroves can use different sources of N from precipitation along with soil solution depending on micrometeorological conditions on sites [73,74,75,76,77], mangroves are capable of using alternate nutrient sources of groundwater, river water, and tidal seawater [78,79] accordingly due to their unique root systems, distribution along the water vicinity of the rivers, and salt-tolerant plant physiology. Despite being tactful to relatively higher N availability on human-affected sites, the non-mangroves showed negative to nearly zero values of foliar ẟ15N values. The non-mangroves might be impotent to use anthropogenic N sources from the deeper groundwater, river water, and tidal saline water because of their relatively shorter root systems, growth backside of the mangroves, and lack of salt-tolerant plant physiology, respectively.
The relationship between foliar ẟ15N and foliar N content in watersheds has been widely debated in the study of anthropogenic impact assessment by macrophytes, particulate organic matter, zooplankton, and mangroves [18,30,51,80]. However, the discrepancy of such a relationship was also reported while monitoring the effectiveness of tropical macroalgae as a bioindicator of nutrient enrichment from shrimp farms [81]. Such an observation may result because of the inability of long-term N storage [82], related to species-specific nutrient physiology [65,66]. Though the mangrove plants, unlike algae and crabs, did not respond by δ15N to any change in a sewage outfall within a short period of 2 years in the Moreton Bay Catchment, Australia [65], they successfully indicated the magnitude of anthropogenic impacts throughout the sampling sites of this study. Mangrove plants have resorbed N-use efficiency of even more than 70% [83], with an average leaf life cycle of 16 months [55,84]. Therefore, not only Avicennia marina [18], mangrove species of R. stylosa, B. gymnorrhiza, and K. obovata (in this study) are likely absorbing, storing and recycling anthropogenic N in the environment and could be used as indicators to monitor the deviation of the natural condition in the mangrove forests.
5. Conclusions
Mangrove forests significantly vary from the adjacent non-mangrove communities for their distinctive plant physiology and habitat structure. Anthropogenically originated N may largely affect the growth of mangroves by providing excess nutrients to the N-limited natural condition of the mangrove forests. Thus, the external inputs of N are, thereby, regulating foliar N and ẟ15N of mangroves, which can be an effective index to evaluate ecosystem responses to environmental disturbances. As we observed that the mangroves could absorb anthropogenic N under any extent of human interaction, it is expected that the findings of this study will increase the use of mangroves in monitoring ecosystem status globally. However, it is important to understand the complete pathway of anthropogenically produced reactive N contributing to the enrichment of foliar ẟ15N in the watersheds in order to take any management and conservation steps for mangrove forests. The source identification of reactive N of surface and groundwater in the study watersheds is under investigation.
Supplementary Materials
The following are available online at https://www.mdpi.com/1999-4907/11/2/133/s1: Table S1: The list of non-mangrove species collected from the study watersheds on three islands, Table S2: Foliar total N, total C, C/N ratio and δ15N of mangrove and non-mangrove species in the study watersheds on three islands. Figure S1: Location of the study watersheds (left above) and the land use at sampling points on Iriomote, Ishigaki, and Okinawa islands.
Author Contributions
Conceptualization of the study: Y.N.; Sample collection: F.Z.T., Y.A., S.T., K.H.; Sample processing and analysis: F.Z.T. and Y.A.; Critical contribution in analysis: K.H.; Preparation of land-use map: S.T.; Statistical analysis and draft preparation: F.Z.T.; Revision and editing of the manuscript: F.Z.T. and Y.N., Supervision of the whole work: Y.N. All authors have read and agreed to the published version of the manuscript.
Funding
This research received no external funding except the annual laboratory budget from Tokyo University of Agriculture, Japan.
Acknowledgments
The author FZT is grateful to the Ministry of Education, Culture, Sports, Science and Technology, Japan, for the award of Monbukagakusho Scholarship 2017 which helps to carry out this work at the laboratory of Agricultural Environmental science, Dept. of International Agricultural Development, Tokyo University of Agriculture.
Conflicts of Interest
The authors declare no conflict of interest.
References
- Tam, N.F.Y.; Wong, Y.S. Mangrove soils as sinks for wastewater-borne pollutants. Hydrobiologia 1995, 295, 231–241. [Google Scholar] [CrossRef]
- Tam, N.F.Y.; Wong, Y.S. Retention and distribution of heavy metals in mangrove soils receiving wastewater. Environ. Pollut. 1996, 94, 283–291. [Google Scholar] [CrossRef]
- Alongi, D.M.; Mckinnon, A.D. The cycling and fate of terrestrially-derived sediments and nutrients in the coastal zone of the great barrier reef shelf. Mar. Pollut. Bull. 2005, 51, 239–252. [Google Scholar] [CrossRef] [PubMed]
- Jordan, S.J.; Stoffer, J.; Nestlerode, J.A. Wetlands as sinks for reactive nitrogen at continental and global scales: A meta-analysis. Ecosystems 2011, 14, 144–155. [Google Scholar] [CrossRef]
- Thimdee, W.; Deein, G.; Thimdee, W.; Sangrungruang, C.; Matsunaga, K. High %N and δ15N values in mangrove leaves and sediments of a mangrove-fringed estuary, Thailand—Effects of shrimp pond effluents. Bull. Soc. Sea Water Sci. Jpn. 2002, 56, 166–173. [Google Scholar]
- Valiela, I.; Bartholomew, M.; Giblin, A.; Tucker, J.; Harris, C.; Martinetto, P.; Otter, M.; Camilli, L.; Stone, T. Watershed deforestation and down-estuary transformations alter sources, transport, and export of suspended particles in Panamanian mangrove estuaries. Ecosystems 2014, 17, 96–111. [Google Scholar] [CrossRef]
- Elser, J.J.; Bracken, M.E.S.; Cleland, E.E.; Gruner, D.S.; Harpole, W.S.; Hillebrand, H.; Ngai, J.T.; Seabloom, E.W.; Shurin, J.B.; Smith, J.E. Global analysis of nitrogen and phosphorus limitation of primary producers in freshwater, marine and terrestrial ecosystems. Ecol. Lett. 2007, 10, 1135–1142. [Google Scholar] [CrossRef] [PubMed]
- Lebauer, D.S.; Treseder, K.K. Nitrogen limitation of net primary productivity in terrestrial ecosystems is globally distributed. Ecology 2008, 89, 371–379. [Google Scholar] [CrossRef] [PubMed]
- Chapin, F.S., III; Matson, P.A.; Vitousek, P.M. Principles of Terrestrial Ecosystem Ecology; Springer: New York, NY, USA, 2011. [Google Scholar]
- Erisman, J.W.; Sutton, M.A.; Galloway, J.; Klimont, Z.; Winiwarter, W. How a century of ammonium synthesis changed the world. Nat. Geosci. 2008, 1, 636–639. [Google Scholar] [CrossRef]
- Bleeker, A.; Hicks, W.K.; Dentener, F.; Galloway, J.; Erisman, J.W. N depposition as a threat to the world’s protected areas under the convention on biological diversity. Environ. Pollut. 2011, 159, 2280–2288. [Google Scholar] [CrossRef]
- Valiela, I.; Cole, M.L. Comparative evidence that salt marshes and mangroves may protect seagrass meadows from land-derived nitrogen loads. Ecosystems 2002, 5, 92–102. [Google Scholar] [CrossRef]
- Alongi, D.M. Present state and future of the world’s mangrove forests. Environ. Conserv. 2002, 29, 331–349. [Google Scholar] [CrossRef]
- Cloern, J.E. Our evolving conceptual model of the coastal eutrophication problem. Mar. Ecol. Prog. Ser. 2001, 210, 223–253. Available online: https://www.int-res.com/articles/meps/210/m210p223.pdf (accessed on 26 January 2001). [CrossRef]
- Wolters, J.W.; Gillis, L.G.; Bouma, T.J.; van Katwijk, M.M.; Ziegler, A.D. Land use effects on mangrove nutrient status in Phang Nga Bay, Thailand. L. Degrad. Dev. 2015, 27, 68–76. [Google Scholar] [CrossRef]
- Costanzo, S.D.; Donohue, M.J.O.Õ.; Dennison, W.C.; Loneragan, N.R.; Thomas, M. A new approach for detecting and mapping sewage impacts. Mar. Pollut. Bull. 2001, 42, 149–156. [Google Scholar] [CrossRef]
- Ansari, A.A.; Gill, S.S. Eutrophication, Causes, Consequences and Control; Springer Science and Business Media: Townsville, Australia, 2014; Available online: https://link.springer.com/book/10.1007/978-94-007-7814-6 (accessed on 17 October 2010).
- Gritcan, I.; Duxbury, M.; Leuzinger, S.; Alfaro, A.C. Leaf sable isotope and nutrient status of temperate mangroves as ecological indicators to assess anthropogenic activity and recovery from eutrophication. Front. Plant Sci. 2016, 7, 1–11. [Google Scholar] [CrossRef]
- Handley, L.L.; Scrimgeour, C.M. Terrestrial plant ecology and 15N natural abundance: The present limits to interpretation for uncultivated systems with original data from a Scottish old field. Adv. Ecol. Res. 1997, 27, 133–212. [Google Scholar] [CrossRef]
- McClelland, J.W.; Valiela, I. Linking nitrogen in estuarine producers to land-derived sources. Limnol. Oceanogr. 1998, 43, 577–585. [Google Scholar] [CrossRef]
- Fry, B.; Gace, A.; McClelland, J.W. Chemical indicators of anthropogenic nitrogen loading in four Pacific estuaries. Pac. Sci. 2003, 57, 77–101. [Google Scholar] [CrossRef]
- Rogers, K. Stable carbon and nitrogen isotope signatures indicate recovery of marine biota from sewage pollution at Moa Point, New Zealand. Mar. Pollut. Bull. 2003, 46, 821–827. [Google Scholar] [CrossRef]
- Fry, B. Stable Isotope Ecology; Science and Business Media, Springer: New York, NY, USA, 2006. [Google Scholar]
- McClelland, J.W.; Valiela, I.; Michener, R.H. Nitrogen-stable isotope signatures in estuarine food webs: A record of increasing urbanization in coastal watersheds. Limnol. Oceanogr. 1997, 42, 930–937. [Google Scholar] [CrossRef]
- Fry, B.; Bern, A.L.; Ross, M.S.; Meeder, J.F. δ15N studies of nitrogen use by the red mangrove, Rhizophora mangle L. in south Florida. Estuar. Coast. Shelf Sci. 2000, 50, 291–296. [Google Scholar] [CrossRef]
- Cole, M.L.; Valiela, I.; Kroeger, K.D.; Tomasky, G.L.; Cebrian, J.; Wigand, C.; McKinney, R.A.; Grady, S.P.; Carvalho da Silva, M.H. Assessment of a ẟ15N isotopic method to indicate anthropogenic eutrophication in aquatic ecosystems. J. Environ. Qual. 2004, 33, 124–132. Available online: https://www.ncbi.nlm.nih.gov/pubmed/14964366 (accessed on 1 January 2004). [CrossRef] [PubMed]
- Teichberg, M.; Fox, S.E.; Olsen, Y.S.; Valiela, I.; Martinetto, P.; Iribarne, O.; Muto, E.Y.; Petti, M.A.V.; Corbisier, T.N.; Soto-Jimenez, M.; et al. Eutrophication and macroalgal blooms in temperate and tropical coastal waters: Nutrient enrichment experiments with Ulva spp. Glob. Change Biol. 2010, 16, 2624–2637. [Google Scholar] [CrossRef]
- Hall, S.J.; Hale, R.L.; Baker, M.A.; Bowling, D.R.; Ehleringer, J.R.; Peters, D.P.C. Riparian plant isotopes reflect anthropogenic nitrogen perturbations: Robust patterns across land-use gradients. Ecosphere 2015, 6, 200. [Google Scholar] [CrossRef]
- Mazumder, D.; Saintilan, N.; Alderson, B.; Hollins, S. Inputs of anthropogenic nitrogen influence isotopic composition and trophic structure in SE Australian estuaries. Mar. Pollut. Bull. 2015, 100, 217–223. [Google Scholar] [CrossRef]
- Garten, C.T., Jr. Variation in foliar 15N abundance and the availability of soil nitrogen on Walker Branch watershed. Ecology 1993, 74, 2098–2113. [Google Scholar] [CrossRef]
- Hogberg, P. 15N natural abundance in soil-plant systems; Tansley review No 95. New Phytol. 1997, 137, 179–203. [Google Scholar] [CrossRef]
- Elmore, A.J.; Craine, J.M. Spectroscopic analysis of canopy nitrogen and nitrogen isotopes in managed pastures and hay land. IEEE T. Geosci. Remote 2011, 49, 2491–2498. [Google Scholar] [CrossRef]
- Letolle, R. Nitrogen-15 in the natural environment. In Handbook of Environmental Isotope Geochemistry; Fritz, P., Fontes, J.C., Eds.; Elsevier: Amsterdam, The Netherlands, 1980; Volume 1.4, pp. 407–433. ISBN 978-3-642-10637-8. [Google Scholar]
- Hoffman, J.C.; Kelly, J.R.; Peterson, G.S.; Cotter, A.M.; Starry, M.A.; Sierszen, M.E. Using δ15N in fish larvae as an indicator of watershed sources of anthropogenic nitrogen: Response at multiple spatial scales. Estuar. Coasts 2012, 35, 1453–1467. [Google Scholar] [CrossRef]
- Rowell, P.; James, W.; Smith, W.L.; Handley, L.L.; Scrimgeour, C.M. 15N discrimination in molybdenum- and vanadium-growth N2-fixing Anabaena variabilis and Azotobacter vinelandii. Soil Biol. Biochem. 1998, 30, 2177–2180. [Google Scholar] [CrossRef]
- Cifuentes, L.; Coffin, R.; Solorzano, L.; Cardenas, W.; Espinoza, J.; Twilley, R. Isotopic and elemental variations of carbon and nitrogen in a mangrove estuary. Estuar. Coast. Shelf Sci. 1996, 43, 781–800. [Google Scholar] [CrossRef]
- White, D.L.; Porter, D.E.; Lewitus, A.J. Spatial and temporal analyses of water quality and phytoplankton biomass in an urbanized versus a relatively pristine salt marsh estuary. J. Exp. Mar. Biol. Ecol. 2004, 298, 255–273. [Google Scholar] [CrossRef]
- Boëchat, I.G.; Paiva, A.B.M.; Hille, S.; Gücker, B. Land-use effects on river habitat quality and sediment granulometry along a 4th order tropical river. Rev. Ambient. Água 2013, 8, 54–64. [Google Scholar] [CrossRef]
- Dvorak, M.; Mora, G.; Graniero, L.; Surge, D. Carbon and nitrogen tracers of land use effects on net ecosystem metabolism in mangrove estuaries, southwest Florida. Estuar. Coast. Shelf Sci. 2016, 181, 14–26. [Google Scholar] [CrossRef]
- FAO (Food and Agriculture Organization of the United Nations). The World’s Mangroves 1980–2005; FAO Forestry Paper 153; FAO: Rome, Italy, 2007. [Google Scholar]
- Miyawaki, A. Phytosociological studies of mangroves in Japan and Thailand, with special reference to human impact. In Proceedings of the MAB/COMAR Regional Seminar, Tokyo, Japan, 13–16 November 1984; pp. 107–110. [Google Scholar]
- Onaga, K.; Komesu, R.; Arakaki, A. The outline of red soil loss and erosion control measure in Okinawa. Sci. Bull. College Agri. Univ. Ryukyus 1999, 46, 71–82. [Google Scholar]
- Ishiga, H.; Diallo, I.M.B. Geochemical evaluation of present mangrove soil in Okinawa Island, Japan. Earth Sci. (Chikyu Kagaku) 2016, 70, 119–128. Available online: https://www.jstage.jst.go.jp/article/agcjchikyukagaku/70/4/70_119/_pdf (accessed on 1 December 2019).
- Higashi, T.; Katayama, T.C.; Shinagawa, A. Land development works and soil erosion in Okinawa Prefecture. Mem. Kagoshima Univ. Res. Center S. Pac. 1985, 6, 26–36. [Google Scholar]
- Banzai, K.; Nakamura, K. Red Soil Runoff From The Miyara River, And An Environmental Problem on Ishigaki Island; Japan International Research Center for Agricultural Sciences: Tsukuba, Japan, 2005; pp. 97–102. Available online: https://www.jircas.go.jp/en/publication/intlsymp/13/97 (accessed on 11 March 2005).
- Ishiga, H.; Diallo, I.M. Geochemical evaluation of present mangrove soil in Okinawa Island, Japan. Earth Sci. (Chikyu Kagaku) 2016, 70, 119–128. [Google Scholar]
- Miyawaki, A.; Suzuki, K.; Suzuki, S.; Nakamura, Y.; Murakami, Y.; Tsukagoshi, Y.; Nakata, E. Phytosociological survey of the mangrove vegetation in Japan:1. Mangrove forests of Iriomote Island. Bull. Institute Environ. Sci. Tech. Yokohama Natl Univ. 1982, 9, 77–89, (In Japanese with English abstract). [Google Scholar]
- Fujimura, N.; Fukamachi, K.; Shibata, S. The history of land use in Iriomote Island from the 1960s and its sociocultural background. J. Jpn. Ins. Landsc. Arch. 2017, 80, 713–718. (In Japanese) [Google Scholar] [CrossRef][Green Version]
- Hasegawa, H. The decline of coral reef conditions caused by the extensive land modification: A case study of the Shiraho Area on Ishigaki Island, Okinawa Prefecture, Japan. J. Remote Sens. Soc. Jpn. 2011, 31, 73–86, (In Japanese with English abstract). [Google Scholar]
- Cheeseman, J. Depressions of photosynthesis in mangrove canopies. In Photoinhibition of Photosynthesis: From Molecular Mechanisms to the Field; Baker, N.R., Bowyer, J.R., Eds.; Bios: Oxford, UK, 1994; pp. 377–389. [Google Scholar]
- García-Sanz, T.; Ruiz, J.M.; Pérez, M.; Ruiz, M. Assessment of dissolved nutrients dispersal derived from offshore fish-farm using nitrogen stable isotope ratios (δ15N) in macroalgal bioassays. Estuar. Coast. Shelf Sci. 2011, 91, 361–370. [Google Scholar] [CrossRef]
- Clough, B.F.; Boto, K.G.; Attiwill, P.M. Mangroves and sewage: A re-evaluation. In Biology and Ecology of Mangroves, Tasks for Vegetation Science Series; Teas, H.J., Ed.; Dr. W. Junk Publishers: Lancaster, UK, 1983; Volume 8, pp. 151–162. [Google Scholar]
- Bloom, A.J.; Sukrapanna, S.S.; Warner, R.L. Root respiration associated with ammonium and nitrate absorption and assimilation by barley. Plant Physiol. 1992, 99, 1294–1301. [Google Scholar] [CrossRef] [PubMed]
- Chapin, F.S. The mineral nutrition of wild plants. Annu. Rev. Ecol. Syst. 1980, 11, 233–260. Available online: https://www.jstor.org/stable/2096908 (accessed on 28 November 2003). [CrossRef]
- Alongi, D.M.; Clough, B.F.; Robertson, A.I. Nutrient-use efficiency in arid-zone forests of the mangroves Rhizophora stylosa and Avicennia marina. Aquat. Bot. 2005, 82, 121–131. [Google Scholar] [CrossRef]
- Alongi, D.M. The Energetics of Mangrove Forests; Springer: Dordrechr, The Netherlands, 2009; pp. 1–216. [Google Scholar]
- Reis, C.R.G.; Nardoto, G.B.; Rochelle, A.L.C.; Vieira, S.A.; Oliveira, R.S. Nitrogen dynamics in subtropical fringe and basin mangrove forests inferred from stable isotopes. Oecologia 2017, 183, 841–848. [Google Scholar] [CrossRef]
- Feller, I.C.; Lovelock, C.E.; Piou, C. Growth and nutrient conservation in Rhizophora mangle in response to fertilization along latitudinal and tidal gradients. Smithson. Contrib. Mar. Sci. 2009, 38, 345–358. [Google Scholar]
- Peterson, B.J.; Fry, B. Stable Isotopes in Ecosystem Studies. Ann. Rev. Ecol. Sys. 1987, 18, 293–320. Available online: http://www.jstor.org/stable/2097134 (accessed on 1 December 2019). [CrossRef]
- Nadelhoffer, K.; Shaver, G.; Fry, B.; Giblin, A.; Johnson, L.; McKane, R. 15N natural abundances and N use by tundra plants. Oecologia 1996, 107, 386–394. [Google Scholar] [CrossRef]
- Mariotti, A.; Germon, J.C.; Leclerc, A.; Catroux, G.; Letoile, R. Experimental determination of kinetic isotope fractionation of nitrogen isotopes during denitrification. In Stable Isotopes; Schmidt, H.L., Forstel, H., Keinoingen, H., Eds.; Elsevier: Amsterdam, The Netherlands, 1982; pp. 459–464. [Google Scholar]
- Evans, R.D.; Bloom, A.J.; Sukrapanna, S.S.; Ehleringer, J.R. Nitrogen isotope composition of tomato (Lycopersicon esculentum Mill. cv. T-5) grown under ammonium or nitrate nutrition. Plant Cell Environ. 1996, 19, 1317–1323. [Google Scholar] [CrossRef]
- Yoneyama, T.; Omata, T.; Nakata, S.; Yazaki, J. Fractionation of nitrogen isotopes during the uptake and assimilation of ammonia by plants. Plant Cell Physiol. 1991, 32, 1211–1217. [Google Scholar] [CrossRef]
- Nadelhoffer, K.J.; Fry, B. Nitrogen isotope studies in forest ecosystems. In Stable Isotopes in Ecology and Environmental Science; Lajtha, K., Mitchener, R.H., Eds.; Blackwell Scientific Publications: Oxford, UK, 1994; pp. 22–44. [Google Scholar]
- Gartner, A.; Lavery, P.; Smit, A. Use of δ15N signatures of different functional forms of macroalgae and filter-feeders to reveal temporal and spatial patterns in sewage dispersal. Mar. Ecol. Prog. Ser. 2002, 235, 63–73. [Google Scholar] [CrossRef]
- Deutsch, B.; Voss, M. Anthropogenic nitrogen input traced by means of ẟ15N values in macroalgae: Results from in-situ incubation experiments. Sci. Total Env. 2006, 366, 799–808. [Google Scholar] [CrossRef] [PubMed]
- Kendall, C.; Elliott, E.M.; Wankel, S.D. Tracing anthropogenic inputs of nitrogen to ecosystems. In Stable Isotopes in Ecology And Environmental Science; Michener, R., Lajtha, K., Eds.; Blackwell publishing: Hoboken, NJ, USA, 2007; pp. 375–449. [Google Scholar]
- Savage, C.; Elmgren, R. Macroalgal (Fucus vesiculosus) δ15N values trace decrease in sewage influence. Ecol. Appl. 2004, 14, 517–526. [Google Scholar] [CrossRef]
- Fair, J.M.; Heikoop, J.M. Stable isotope dynamics of nitrogen sewage effluent uptake in a semi-arid wetland. Environ. Poll. 2006, 140, 500–505. [Google Scholar] [CrossRef]
- Holguin, G.; Vazquez, P.; Bashan, Y. The role of sediment microorganisms in the productivity, conservation, and rehabilitation of mangrove ecosystems: An overview. Biol. Fertil. Soils. 2001, 33, 265–278. [Google Scholar] [CrossRef]
- Handley, L.L.; Austin, A.T.; Robinson, D.; Scrimgeour, C.M.; Raven, J.A.; Heaton, T.H.E.; Schmidt, S.; Stewart, G.R. The 15N natural abundance (δ15N) of ecosystem samples reflects measures of water availability. Aust. J. Plant Phys. 1999, 26, 185–199. [Google Scholar] [CrossRef]
- Craine, J.M.; Brookshire, E.N.J.; Cramer, M.D.; Hasselquist, N.J.; Koba, K.; Marin-Spiotta, E.; Wang, L. Ecological interpretations of nitrogen isotope ratios of terrestrial plants and soils. Plant Soil 2015, 396, 1–26. [Google Scholar] [CrossRef]
- Martin, C.E.; von Willert, D.J. Leaf epidermal hydathodes and the ecophysiological consequences of foliar water uptake in species of Crassula from the Namib Desert in southern Africa. Plant Biol. 2000, 2, 229–242. [Google Scholar] [CrossRef]
- Burgess, S.S.O.; Dawson, T.E. The contribution of fog to the water relations of Sequoia sempervirens (D. Don): Foliar uptake and prevention of dehydration. Plant Cell Env. 2004, 27, 1023–1034. [Google Scholar] [CrossRef]
- Eller, A.D.; Sparks, J.P. Predicting leaf-level fluxes of O3 and NO2: The relative roles of diffusion and biochemical processes. Plant Cell Environ. 2006, 29, 1742–1750. [Google Scholar] [CrossRef] [PubMed]
- Ganguly, D.; Dey, M.; Sen, S.; Jana, T.K. Biosphere–atmosphere exchange of NOx in the tropical mangrove forest. J. Geophys. Res. 2009, 114, G04014. [Google Scholar] [CrossRef]
- Fogel, M.L.; Wooller, M.J.; Cheeseman, J.; Smallwood, B.J.; Roberts, Q.; Romero, I.; Meyers, J.M. Unusually negative nitrogen isotopic compositions (δ15N) of mangroves and lichens in an oligotrophic, microbially-influenced ecosystem. Biogeosci. Discuss. 2008, 5, 937–969. [Google Scholar] [CrossRef]
- Lambs, L.; Mangion, P.; Mougin, E.; Fromard, F. Water cycle and salinity dynamics in the mangrove forests of Europa and Juan de Nova Islands, southwest Indian Ocean. Rapid Comm. Mass Spec. 2016, 30, 311–320. Available online: https://www.ncbi.nlm.nih.gov/pubmed/27071220 (accessed on 30 January 2016). [CrossRef]
- Lovelock, C.E.; Reef, R.; Ball, M.C. Isotopic signatures of stem water reveal differences in water sources accessed by mangrove tree species. Hydrobiologia 2017, 803, 133–145. [Google Scholar] [CrossRef]
- Miller, T.W.; Omori, K.; Hamaoka, H.; Shibata, J.Y.; Hidejiro, O. Tracing anthropogenic inputs to production in the Seto Inland Sea, Japan - A stable isotope approach. Mar. Pollut. Bull. 2010, 60, 1803–1809. [Google Scholar] [CrossRef]
- Lin, D.T.; Fong, P. Macroalgal bioindicators (growth, tissue N, δ15N) detect nutrient enrichment from shrimp farm effluent entering Opunohu Bay, Moorea, French Polynesia. Mar. Pollut. Bull. 2008, 56, 245–249. [Google Scholar] [CrossRef]
- Fong, P.; Fong, J.J.; Fong, C.R. Growth, nutrient storage, and release of dissolved organic nitrogen by Enteromorpha intestinalis in response to pulses of nitrogen and phosphorus. Aquat. Bot. 2004, 78, 83–95. [Google Scholar] [CrossRef]
- Lin, Y.; Liu, X.; Zhang, H.; Fan, H.; Lin, G. Nutrient conservation strategies of a mangrove species Rhizophora stylosa under nutrient limitation. Plant Soil 2010, 326, 469–479. [Google Scholar] [CrossRef]
- Saenger, P. Mangrove Ecology, Silviculture and Conservation; Kluwer: Dordrecht, The Netherlands, 2002. [Google Scholar]


© 2020 by the authors. Licensee MDPI, Basel, Switzerland. This article is an open access article distributed under the terms and conditions of the Creative Commons Attribution (CC BY) license (http://creativecommons.org/licenses/by/4.0/).