Article

Efficient Fingerprinting of the Tetraploid Salix psammophila Using SSR Markers

1
College of Resources and Environmental Economics, Inner Mongolia University of Finance and Economics, Hohhot 010070, China
2
Water Conservancy and Civil Engineering College, Inner Mongolia Agricultural University, Hohhot 010019, China
3
College of forestry, Inner Mongolia Agricultural University, Hohhot 010019, China
*
Author to whom correspondence should be addressed.
Forests 2020, 11(2), 176; https://doi.org/10.3390/f11020176
Submission received: 20 January 2020 / Revised: 31 January 2020 / Accepted: 3 February 2020 / Published: 5 February 2020
(This article belongs to the Section Forest Ecophysiology and Biology)

Abstract

:
Salix psammophila C. Wang et Ch. Y. Yang is an important desert shrub that is mainly distributed in northwest China, including the Mu Us sandland and Kubuqi desert. It plays a crucial role in vegetation rehabilitation and as a forestation plant. The traditional identification of its accessions based on phenotypic traits is usually unreliable. SSR (Simple Sequence Repeat) has the advantages of repeatability and codominant inheritance, and most species have had specific SSR primers developed for them already. Currently, there is no simple and rapid method used for identifying the tetraploid Salix psammophila with SSR markers. In this study, we construct fingerprints among 261 accessions of S. psammophila by screening of marker combinations. We identified a nine-marker combination which could completely distinguish each of the 261 accessions to their unique fingerprinting profiles. For this marker combination (G+I+J+N+O+Q+S+T+U), identification rate of combined markers (MC2) and total Polymorphism Information Content (PIC) were the highest, at 100% and 6.05, respectively. We used fingerprinting profiles with the nine-marker combination to produce two-dimensional barcodes, which could be screened rapidly and conveniently using a barcode scanned by a computer. The results of this study can provide an efficient genetic toolkit for identification, traceability management and protection of intellectual property rights of particular accessions of tetraploid S. psammophila.

1. Introduction

Willows (Salix; Salicaceae) are mainly distributed in the northern hemisphere. There are about 330–500 species worldwide, of which 40% are polyploid species [1]. Polyploidy benefits from the generation of new and improved varieties, which are conducive to breeding improvement [2]. Salix psammophila C. Wang et Ch. Y. Yang is a tetraploid species that is mainly distributed in northwest China. S. psammophila is an important shrub that has wind-preventing and sand-fixing effect, and it can also be used as raw material for wood profiles, strengthening composite boards, and producing paper and activated carbon [3,4,5]. In addition, different accessions have their unique potential ways of application. The effective use and management of resources with different characteristics is of critical importance for the continuing success of breeding and exploitation.
The Salix Germplasm Resources Preservation Library in Inner Mongolia was built in Ordos Dalad, which currently reserves about 900 genets. Traditionally, identification of accessions in this species has been based mainly on phenotypic traits, such as morphology and colors of leaf, flower, and seed [6]. However, identification of accessions based on phenotypic traits is usually unreliable because traits occur as both phenotypically plastic and evolutionary responses to environmental stress [7,8]. Jia et al. [9] reported that S. psammophila was determined to be a tetraploid species by counting chromosome and flow cytometry. The complex ploidy and heterozygosity of S. psammophila make it even more difficult to identify different accessions with phenotypic traits. Nowadays, the lack of complete labelling and the existence of synonyms are also major challenges to overcome in order to manage a well-identified and diverse germplasm collection, and there is no simple and rapid method of using SSR (Simple Sequence Repeat) primers for identifying the tetraploid S. psammophila. Therefore, it is essential to develop a rapid and reliable toolkit for the tetraploid S. psammophila identification based on molecular markers that could be efficient and meaningful.
SSR has the advantages of repeatability and codominant inheritance, and most agricultural species have had specific SSR markers developed for identification and diversity analysis [10,11], so SSR fingerprinting has been widely used in identification [12,13,14,15]. The International Union for the Protection of New Varieties of Plants (UPOV) clearly identified SSR molecular markers as the standard method for constructing the fingerprint database of varieties [16]. SSR fingerprints are the DNA molecular map of the germplasm (accessions) with their own special identification, also called “Identity Card” [17], which is established by using SSR to amplify the difference of repeat sequence size between different individuals. Schuelke et al. [18] reported that TP-M13-SSR technology can use the fluorescent marker M13 as a universal primer, and they developed a low cost SSR amplification method based on fluorescence automatic sequencing. This TP-M13-SSR (simple sequence repeat with tailed primer M13) technique has greatly reduced the cost of fluorescent labeling and increased resolution (up to 1 bp), which makes it widely used in the construction of fingerprints [19,20]. In recent years, the approach of core combined markers has become widely used in constructing plant fingerprints because of its wide coverage of different genotypes, which can make full use of the advantages of marker specificity [21,22,23].
In the present study, we aim to (1) calculate and select efficient marker combinations for constructing fingerprints, (2) construct fingerprints of a large sample of S. psammophila accessions, (3) examine the efficiency of these tetraploid fingerprints. We hope this will provide a useful genetic toolkit for the identification and management of tetraploid S. psammophila.

2. Materials and Methods

2.1. Plant Materials

Plants were sampled from the Germplasm Resource Preservation Library of Salix psammophila. Constructing fingerprints requires clarity and accuracy of fragment amplification. We removed null-alleles (cryptic alleles of SSR loci due to failed amplifications) and duplicate accessions (genets of the same clones) among sampled plants. Altogether, 261 accessions were ultimately analyzed to construct fingerprints (Table S1).

2.2. DNA Extraction and SSR Analysis

Leaves from 261 accessions were collected in April. Genomic DNA was extracted from fresh leaves (0.2g each accession) using Plant Genomic DNA kit (TIANGEN, Beijing, China). The purified DNA was quantified by NanoDrop2000 spectrophotometer (Thermo Fisher Scientific, Waltham, MA, USA).
125 pairs from 168 EST-SSR markers from the de novo transcriptome of S. psammophila showed successful amplification [9], and 22 pairs of EST-SSR markers were selected [24]. The 22 fluorophore-labeled markers (Table S2) were used in the polymerase chain reaction (PCR). The forward primers were tailed by adding a M13 sequence labeled with FAM and HEX dye to the 5′ end. The PCR reaction of 20µl solution [24] contained 100 ng template DNA, 10×Taq buffer (Cat#ET101-02; TIANGEN, Beijing, China), 100 µM dNTP, 30 µM MgCl2, 0.5 unit Taq DNA polymerase (Lot#03330w; TIANGEN, Beijing, China), 2pmol forward primer that was added to the M13 primer sequence to the 5′terminus, 8pmol reverse primer, 8pmol M13 universal primer (5′ -TGTAAAACGACGGCCAGT-3′) that was fluorescently labeled with Cy5 at the 5′terminus, and dH2O. The reactions were carried out in a 96-well ABI 9902 PCR instrument (Applied Biosystems, Foster City, CA, USA). Conditions of the PCR was following [24]: 94 °C for 5 min; 30 cycles of 30 s at 94 °C, 30 s at 57 °C, and 30 s at 72 °C; then eight cycles of 30 s at 94 °C, 30 s at 57 °C, and 72 °C for 30 s, with a final extension step of 72 °C for 10 min. Then PCR products was performed by capillary electrophoretic separation using an ABI 3730XL DNA Analyzer (Applied Biosystems, Foster City, CA, USA), and data were analyzed using Gene Marker v.2.2.0 software (Soft Genetics, State College, PA, USA). PCR and capillary electrophoresis were repeated to ensure correctness of the results.

2.3. Data Analysis and Core Markers Selection

The tetraploid genotypes were read by Gene Marker V2.2 (Soft Genetics, State College, PA, USA) according to counting-peak ratios method. The electrophoregrams of representative two markers were shown in Figure S1. AUTOTET (P.H Thrall and A.Yang, Canberra, Australian Capital Territory, Australia) [25] was used to calculate the polymorphism and genetic metrics of the 22 SSR markers. The polymorphism information content (PIC) of accessions was counted by using PIC_CALC v.0.6 software (P. Poczai, Helsinki, Finland) [26].
Firstly, to access the fingerprinting power of markers, we calculated the probability of identifying (PI) [27]. The calculation formula for each marker used was the following: PI = 2(∑pi2)2 − ∑pi4 where pi represents the frequency of the ith allele at a locus. MatlabTM software (The MathWorks Inc., Natick, MA, USA) was used to calculate number of four allele genotypes per locus (G), number of four allele unique genotypes per locus (G1), the unique genotype ratio per marker (M1) and identification rate per marker (M2): M1 = G1/G × 100%, M2 = G1/N × 100%.
Secondly, the value of combination was calculated by the number of markers taken randomly from a set of 22 markers. The maximum value of combinations was 705,432 when the number of combined markers selected was 11 (Figure S2). Therefore, we used 2–11 markers in our subsequent calculation.
Thirdly, to access the fingerprinting power of combined markers, we calculated the index of each combination. MatlabTM software was used to calculate the unique value for each of the combined marker genotypes (GC1) and the identification rate of combined markers (MC2) by using the following formula: MC2 = GC1/N × 100%. 22 markers were grouped into combinations of 2–11 markers based on a stepwise increase in MC2 to test their identification rate among the 261 accessions.
At last, the best core marker combination was selected to construct the fingerprints of S. psammophila based on the goal of “distinguishing these 261 accessions using the smallest number of markers”.

3. Results

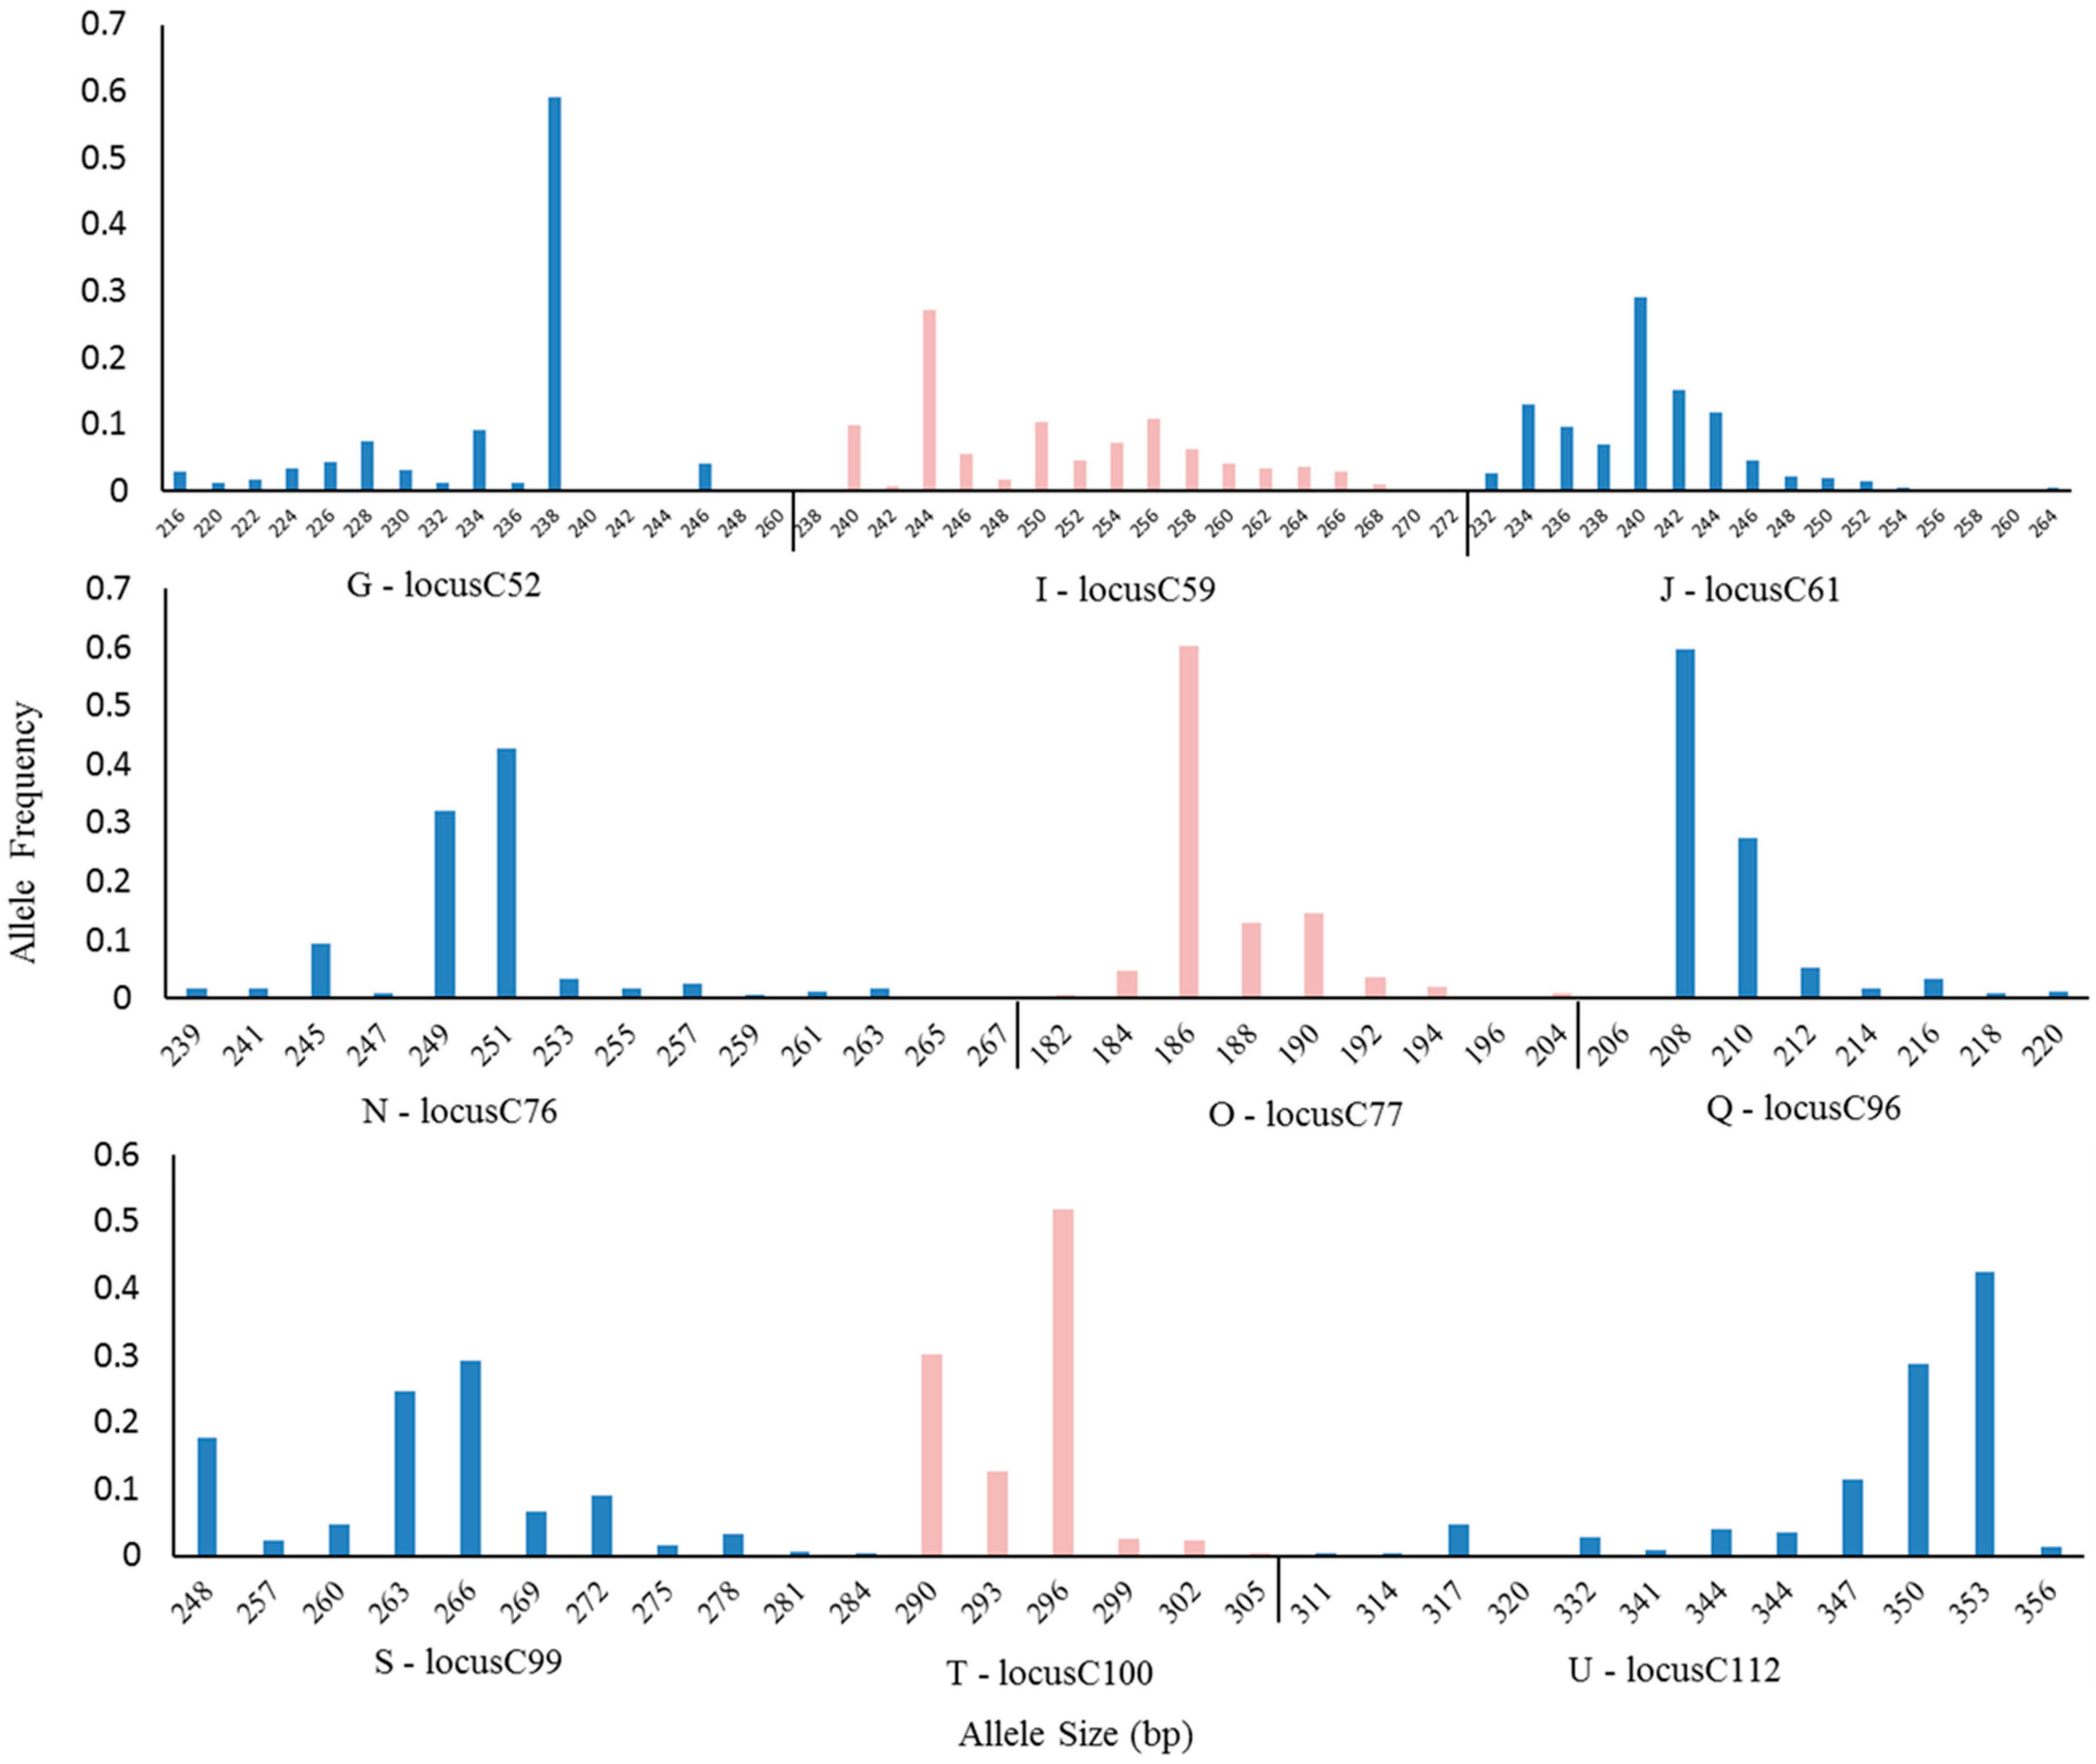
3.1. SSR Marker Polymorphism

A total of 22 SSR markers were used to analyze the 261 accessions of 17 S. psammophila populations from Northern China. The 22 pairs of SSR markers revealed high polymorphism in the sample as shown in Table 1. The mean number of alleles at a locus (A) was 10.41 with a range from 3 (c57) to 18 (c59). The mean expected heterozygosity (Ho) was 0.60 and mean observed heterozygosity (He) was 0.67.

3.2. DNA Fingerprinting Power

3.2.1. Single Marker Calculations

The total number of four allele genotypes (G) was 1504, while G ranged from 9 (c57) to 176 (c59) (Table 1). This showed that c59 had the most four allele genotypes and would play a major role in the identification of accessions. The results of single marker identification showed that the mean of unique genotype ratio per marker (M1) was 47.02%, ranging from 11.11% (c57) to 76.70% (c59). The mean of the identification rate per marker (M2) was 14.77%. M2 of C59, C69 and C61 were 51.72%, 39.08% and 34.1%, which were the most suitable markers for identification.

3.2.2. Screening of Marker Combinations

The results of the scattered point box diagram of MC2 with the different number of combined markers were reported in Figure 1. The results showed that the MC2 of nine-marker combination was 100%, indicating all of the sample plants could be completely discriminated and showed unique fingerprints.
Twenty-two loci were named from A to V in the case of constructing fingerprints (Table 1). Twenty-two markers were grouped into combinations of 2–9 markers, and the top 10 values of MC2 in combined markers were selected. Taking into account these results, the SSR marker combinations were evaluated for their ability to discriminate (Figure 2). Among two-marker combination, the value of GC1 and MC2 of I+J was the highest, at 217 and 83.14%, respectively (Figure 2A). Among three-marker combination, the value of GC1 and MC2 of I+J+U, J+N+U and J+R+U were the highest, at 236 and 90.42%, respectively (Figure 2B). Among four-marker combination, GC1 and MC2 of G+J+N+U were the highest, at 247 and 94.64%, respectively (Figure 2C). Among five-marker combination, the value of GC1 and MC2 of G+J+N+S+U, G+J+N+T+U and G+J+N+U+V were the highest, at 251 and 96.17%, respectively (Figure 2D). Among six-marker combination, the value of GC1 and MC2 of G+J+N+S+T+U and G+J+N+T+U+V were the largest, at 255 and 97.7%, respectively (Figure 2E). Among seven-marker and eight-marker combination, the value of MC2 was 98.46% and 99.23%, respectively (Figure 2F,G). Among nine-marker combination, the value of GC1 and MC2 were the largest, at 261 and 100%, respectively (Figure 2H).
The differential index of the nine-marker combination was shown in Table 2. Although these nine-marker combinations showed the consistent identification rate, there were differences between their genotypes and PIC. G+I+J+N+O+Q+S+T+U combined markers of GC1, MC2 and total PIC were the highest, at 261, 100% and 6.05, respectively. The frequency of each genotype ranged from 0.00096 to 0.60249 at nine SSR markers, and allele sizes and frequencies for this combination were further summarized based on the genotypes of 261 accessions (Figure 3).

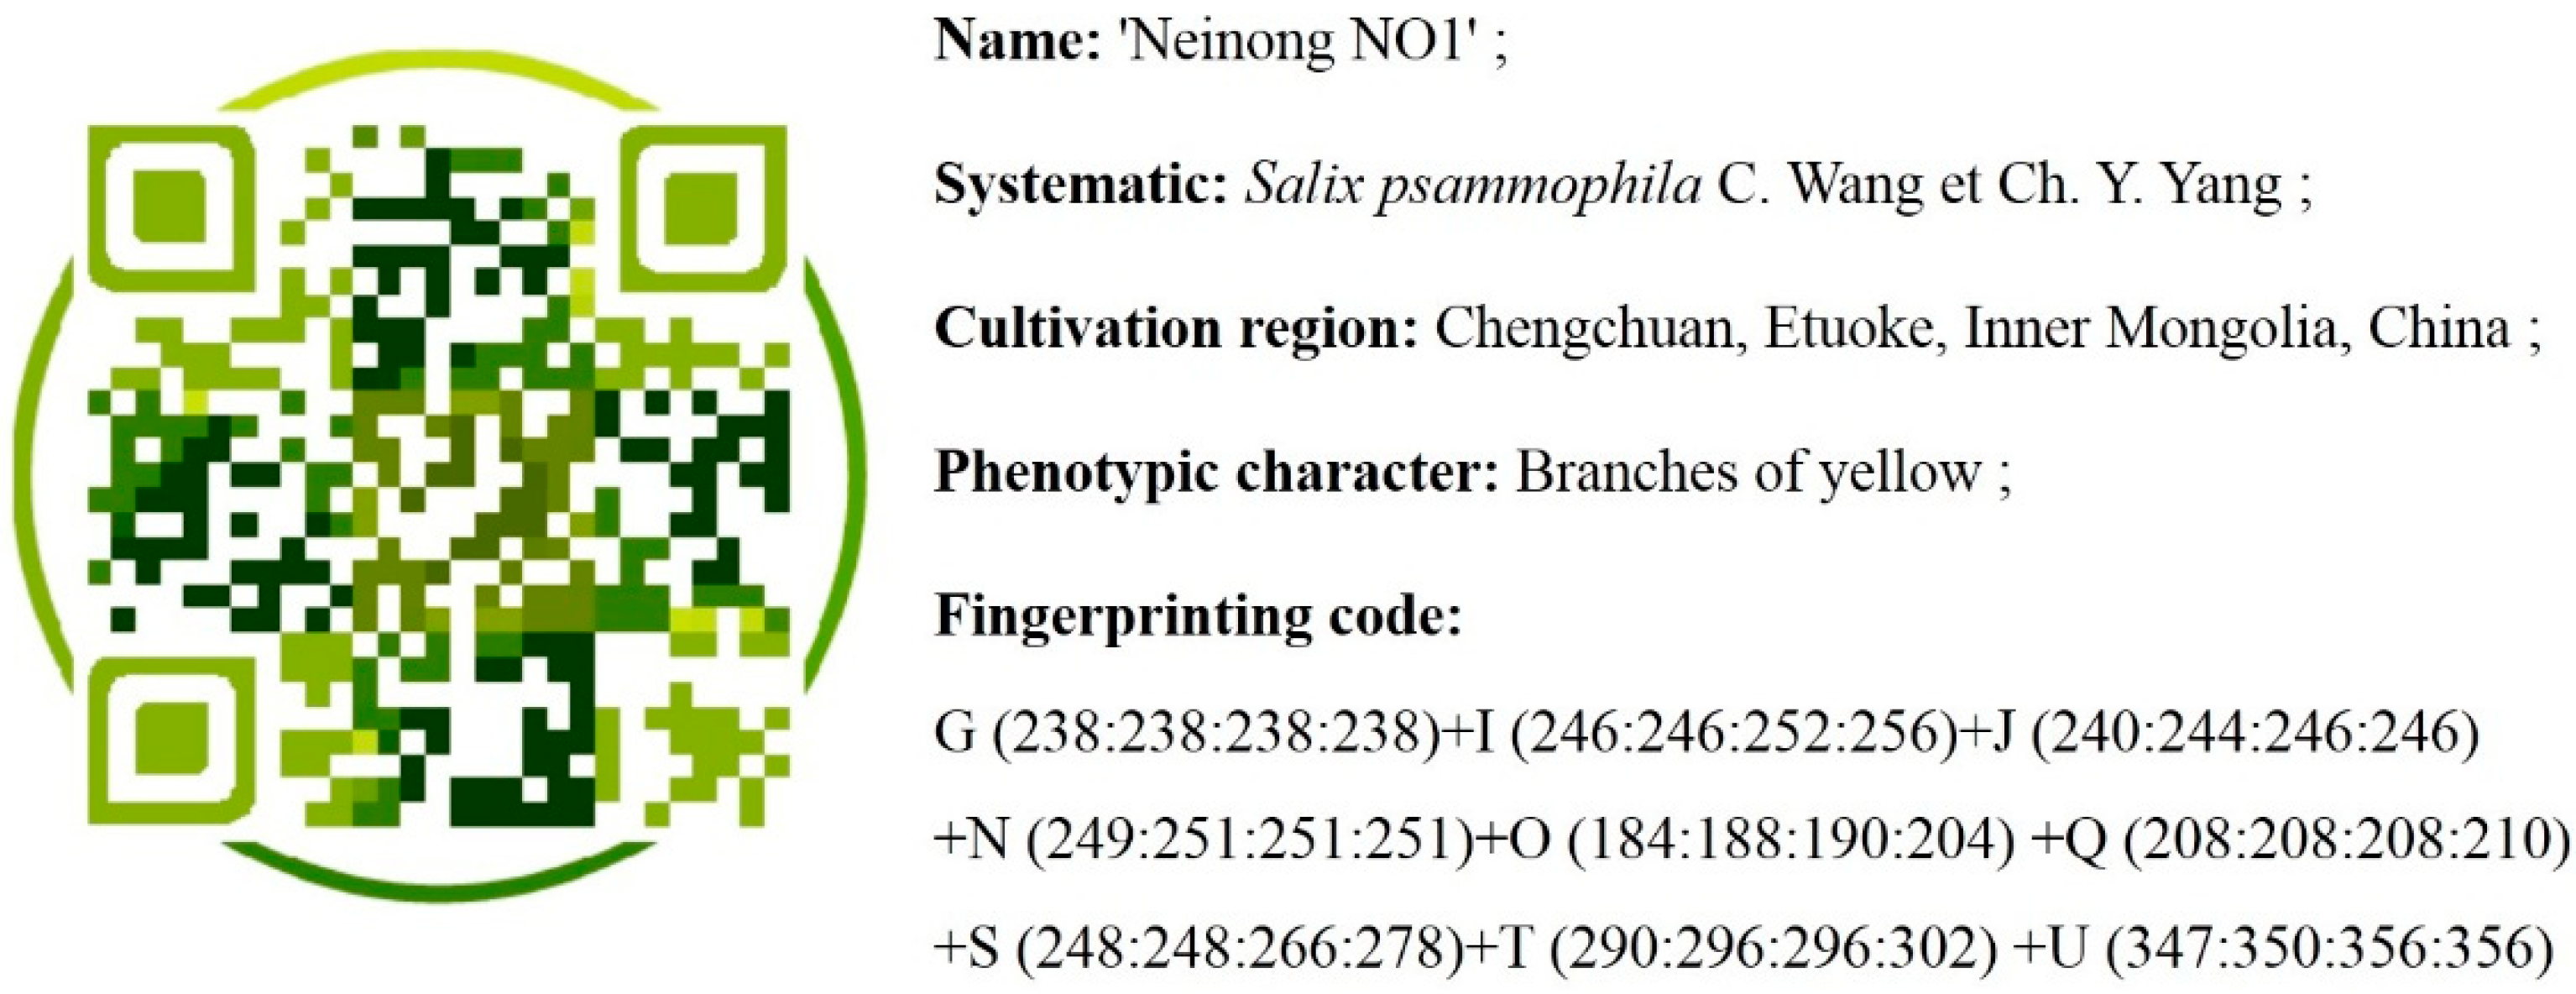
3.3. Construct Fingerprinting of S. psammophila

To distinguish the 261 accessions from one another, we analyzed the DNA fragments amplified by a nine-marker combination. Ultimately, G+I+J+N+O+Q+S+T+U was used to efficiently reconstruct the SSR fingerprints of 261 accessions of S. psammophila in this study as reported in Table S3.
All accessions can be identified at any of the possible sets of eight core nine-marker combinations with MC2 = 100% (Table 2) from the total set of 22 markers we used in these analyses. Each S. psammophila accession was given an identifying fingerprinting profile based on name, province, phenotypic traits and unique fingerprint data of combined markers. The fingerprinting codes were converted into a two-dimensional barcode using a website (http://cli.im/). For example, S. psammophila ’Neinong NO.1’ is a new variety which is under application. It can be identified based on a set of nine-marker combinations of unique amplified fragments. The two-dimensional barcode of S. psammophila ’Neinong NO.1’ was established, and the information including accession name, region, phenotypic traits and the barcode can be scanned by computer (Figure 4). All accessions in the collection of Ordos Dalad can be linked to such two-dimensional barcodes. These barcodes can be linked to specific descriptions of accessions, stored in the library of the collection. This will help for the conservation and management of germplasm resources.

4. Discussion

The identification rate of fingerprints is closely related not only to the polymorphism of markers but also to the number of analyzed accessions. Normally, a single pair of markers cannot differentiate each of the sampled individuals [28]. In this study, 22 SSR markers were highly polymorphic in 261 accessions of S. psammophila with an average number of alleles (A) of 10.41 and average number of four allele genotypes (G) for each locus of 68.36, which was much greater than the values shown in a few former studies of diploid plants (Robinia pseudoacacia L. [29] and Vigna radiata L. [30].), implying that the abundance of genotypes in tetraploids is helpful to efficiently reconstruct the fingerprints. PIC plays a crucial role in the assessment of availability of SSR markers which reflect polymorphism of markers. The average value of PIC was 0.63, which was higher than related estimates in other plant samples [29,30,31]. The higher polymorphism for tetraploid plants utilized to score alleles benefits from the clear resolution of the capillary DNA fragments [32], and the TP-M13-SSR not only avoided amplicons overlapping but also provided an economic and effort saving method for microsatellite genotyping [18]. PI is the opposite of the other parameters: the lower its value, the higher its discrimination power [33]. In this study, we counted the unique genotype ratio of per marker (M1) and identification rate of combined markers (MC2) to reflect the identified rate of markers for tetraploid species. The results show that M2 is consistent with other discrimination rates in single marker identification (Figure S3), so it can be used as an index of discrimination, which provides quantitative information to construct the fingerprints. To this end, the present study found that the total number of four allele genotypes (G) was 1504, while c59 had the most four allele genotypes and would play an important role in the identification of accessions. C59 had the largest M2, of 51.72%. The results showed that when the sample size was enlarged, the specific fragments of the single marker would lose their specificity. The application of single marker analysis to identify specific accessions from large samples would be thus restricted [34].
In order to solve the problems of low identification rates of the single marker, some researchers tried to use the method of combined markers [35,36]. The number of markers have a big impact on the ability of the marker combinations identification, and some markers with sufficient informativeness remarkably enhance the identification rates of the marker combinations [30]. In our study, a genetic toolkit for S. psammophila identification consisting of nine-marker combination (G+I+J+N+O+Q+S+T+U) was selected, which could thoroughly separate each of the 261 accessions based on their special fingerprinting profiles. Moreover, these accessions could be identified with very high precision. However, it was interesting that these nine markers (G I J N O Q S T U) used to construct the fingerprints were not all among the top nine markers (A C G I J K N R S) of identification rate (M2) calculated by single marker (Table 1). This is possibly because there had been some overlap between DNA fragments in the markers of the higher identification rates. When those markers were used in combinations, the identification rate actually decreased. The combined markers method could make good use of the unique “complementarity” among different markers to construct fingerprint profiles for germplasm collections, and it is not simply a combination of single markers with higher discrimination. Therefore, the selection of suitable combined markers is crucial for constructing fingerprinting.
Identification rate of combined markers (MC2) was used to select the best set of combined markers, which can directly and quantitatively reflect the identification rate of combined markers for the tetraploid S. psammophila. Due to tetraploid plants having four distinct alleles at each marker, SSR molecular markers are more effectively used to construct fingerprints for these plants. In this study, nine-marker combination (G+I+J+N+O+Q+S+T+U) could distinguish the 261 accessions from one another, which was much less than the number of markers shown in a few earlier studies of diploid plants. For example, Zhao et al. [30] constructed the fingerprints based on eight SSR markers, which could identify 151 mung bean varieties; a total of 110 cultivars of Chinese black locust were distinguished by eight pairs of EST-SSR and SSR primers [29].
When managing the Germplasm Resource Preservation Library of Salix psammophila, the primary difficulties are lack of genetic information and discrimination between synonyms. It is necessary to construct a rigorous labelling system in germplasm collection, which could efficiently eliminate synonyms with the same fingerprints or the same name assigned to different genotypes [37,38]. However, this system has not been put into use on S. psammophila. Nine unique markers we identified in this study were arranged and used to produce DNA barcodes, which also included the name, province, phenotypic traits and pictures of accessions. These DNA barcodes can be identified rapidly and conveniently when scanned by computer. This system took the place of recording the size of alleles by electrophoregrams and helped to avoid mistakes by eye and the influence of the surrounding environment [30]. Therefore, this study outlines a potentially efficient approach for germplasm resource management and intellectual property right protection of S. psammophila.

5. Conclusions

A genetic toolkit for S. psammophila identification consisting of a nine-marker combination (G+I+J+N+O+Q+S+T+U) was developed and could completely distinguish each of 261 accessions to their unique fingerprinting profiles. We proposed new indexes (M2 and MC2) which provided quantitative information for measuring the power of fingerprinting for these plants. Fingerprinting profiles with the nine-marker combination were arranged and used to produce two-dimensional barcodes, which could be identified rapidly and conveniently.

Supplementary Materials

The following are available online at https://www.mdpi.com/1999-4907/11/2/176/s1, Table S1: The origins and locations of the 261 accessions from 17 population. Table S2: The information of 22 SSR primers in S. psammophila. Table S3: SSR fingerprints of 261 S. psammophila. Figure S1: Markers c-100 (green) and c-74 (blue) in electrophoregrams of five clones. Figure S2. Calculation the number of combined markers taken randomly from a set of 22 markers. Figure S3. The value of identification rates in each marker.

Author Contributions

G.Z. and Y.Z. designed the experiments. D.L. and H.H. were contributed to the collection of materials. L.H. and Y.Z. performed the experiments and analyzed the data. L.H. and D.L. wrote the manuscript. All authors reviewed the manuscript. All authors have read and agreed to the published version of the manuscript.

Funding

This study was supported by Collaborative Innovation Center on research of China-Mongolia-Russia Economic Corridor Foundation (ZMEY201910), the National Natural Science Foundation of China (31160167).

Conflicts of Interest

The author(s) declare no competing interests.

References

  1. Karp, A.; Hanley, S.J.; Trybush, S.O.; Macalpine, W.; Pei, M.; Sheild, L. Genetic improvement of willow for bioenergy and biofuels free access. J. Integr. Plant Biol. 2011, 53, 151–165. [Google Scholar] [CrossRef] [PubMed] [Green Version]
  2. Madlung, A. Polyploidy and its effect on evolutionary success: Old questions revisited with new tools. Heredity 2013, 110, 99. [Google Scholar] [CrossRef] [PubMed] [Green Version]
  3. Bao, Y.; Zhang, G. Study of adsorption characteristics of methylene blue onto activated carbon made by salix psammophila. Energy Procedia 2012, 16, 1141–1146. [Google Scholar] [CrossRef] [Green Version]
  4. Li, Y.B.; Yang, G.H.; Chen, J.C. Effects of pretreatment by xylanase on properties of salix psammophila kraft pulp. Adv. Mater. Res. 2012, 610–613, 3505–3510. [Google Scholar] [CrossRef]
  5. Qu, L.; Chen, J.C.; Yang, G.H.; Xue, Y. Effect of different process on the pulping properties of salix psammophila p-rc APMP. Adv. Mater. Res. 2012, 610–613, 581–585. [Google Scholar] [CrossRef]
  6. Baraket, G.; Abdallah, D.; Mustapha, S.B.; Tamarzizt, H.B.; Salhi-Hannachi, A. Combination of simple sequence repeat, s-locus polymorphism and phenotypic data for identification of tunisian plum species (prunus spp.). Biochem. Genet. 2019, 673–694. [Google Scholar] [CrossRef]
  7. Funk, J.L. Differences in plasticity between invasive and native plants from a low resource environment. J. Ecol. 2008, 96, 1162–1173. [Google Scholar] [CrossRef]
  8. Chapin, F.S.; Autumn, K.; Pugnaire, F. Evolution of suites of traits in response to environmental stress. Am. Nat. 1993, 142, S78–S92. [Google Scholar] [CrossRef]
  9. Jia, H.; Yang, H.; Sun, P.; Li, J.; Zhang, J.; Guo, Y.; Han, X.; Zhang, G.; Lu, M.; Hu, J. De novo transcriptome assembly, development of EST-SSR markers and population genetic analyses for the desert biomass willow, Salix psammophila. Sci. Rep. 2016, 6. [Google Scholar] [CrossRef] [Green Version]
  10. Wu, J.; Wang, Q.; Xie, J.; Pan, Y.-B.; Zhou, F.; Guo, Y.; Chang, H.; Xu, H.; Zhang, W.; Zhang, C.; et al. SSR marker-assisted management of parental germplasm in sugarcane (saccharum sphybrids) breeding programs. Agronomy 2019, 9, 449. [Google Scholar] [CrossRef] [Green Version]
  11. Chakraborty, S.; Patel, D.A.; Parmar, H.; Dhaduk, H.L.; Sasidharan, N. Genetic diversity analysis in soybean (Glycine max (L.) Merrill.) using SSR markers. J. Pharmacogn. Phytochem. 2018, 7, 2380–2384. [Google Scholar]
  12. Fu, N.; Wang, P.-Y.; Liu, X.-D.; Shen, H.-L. Use of EST-SSR markers for evaluating genetic diversity and fingerprinting celery (apium graveolens l.) cultivars. Molecules 2014, 19, 1939–1955. [Google Scholar] [CrossRef] [PubMed] [Green Version]
  13. Huang, G.H.; Liang, K.N.; Zhou, Z.Z.; Ma, H.M. SSR genotyping-genetic diversity and fingerprinting of Teak (Tectona grandis) clones. J. Trop. For. Sci. 2016, 28, 48–58. [Google Scholar]
  14. Njung’e, V.; Deshpande, S.; Siambi, M.; Jones, R.; Silim, S.; De Villiers, S. SSR genetic diversity assessment of popular pigeonpea varieties in Malawi reveals unique fingerprints. Electron. J. Biotechnol. 2016, 21, 65–71. [Google Scholar] [CrossRef] [Green Version]
  15. Tan, L.; Peng, M.; Xu, L.-Y.; Wang, L.-Y.; Chen, S.-X.; Zou, Y.; Qi, G.-N.; Cheng, H. Fingerprinting 128 Chinese clonal tea cultivars using SSR markers provides new insights into their pedigree relationships. Tree Genet. Genomes 2015, 11, 90. [Google Scholar] [CrossRef]
  16. Jordens, R. Progress of plant variety protection based on the International Convention for the Protection of New Varieties of Plants (UPOV Convention). World Pat. Inf. 2005, 27, 232–243. [Google Scholar] [CrossRef]
  17. Agrimonti, C.; Vietina, M.; Pafundo, S.; Marmirolim, N. The use of food genomics to ensure the traceability of olive oil. Trends Food Sci. Technol. 2011, 22, 237–244. [Google Scholar] [CrossRef]
  18. Schuelke, M. An economic method for the fluorescent labeling of PCR fragments. Nat. Biotechnol. 2000, 18, 233–234. [Google Scholar] [CrossRef]
  19. Zhu, Y.; Hu, J.; Han, R.; Wang, Y.; Zhu, S. Fingerprinting and identification of closely related wheat (‘triticum aestivum’l.) cultivars using issr and fluorescence-labeled tp-m13-ssr markers. Aust. J. Crop. Sci. 2011, 5, 846. [Google Scholar]
  20. Zhang, Z.; Huang, K.; Yue, J.; Liu, M.; Qi, M.; Dong, J. DNA fingerprinting of malt varieties using tailed primer M13 microsatellite (TP-M13-SSR) markers. Shipin Kexue/Food Sci. 2018, 39, 183–188. [Google Scholar]
  21. Girichev, V.; Hanke, M.-V.; Peil, A.; Flachowsky, H. SSR fingerprinting of a German Rubus collection and pedigree based evaluation on trueness-to-type. Genet. Resour. Crop Evol. 2017, 64, 189–203. [Google Scholar] [CrossRef]
  22. Schlautman, B.; Bolivar-Medina, J.; Hodapp, S.; Zalapa, J. Cranberry SSR multiplexing panels for DNA horticultural fingerprinting and genetic studies. Sci. Hortic. 2017, 219, 280–286. [Google Scholar] [CrossRef] [Green Version]
  23. Chakravarthi, B.K.; Naravaneni, R. SSR marker based DNA fingerprinting and diversity study in rice (Oryza sativa. L). Afr. J. Biotechnol. 2006, 5, 684–688. [Google Scholar]
  24. Hao, L.; Zhang, G.; Lu, D.; Hu, J.; Jia, H. Analysis of the genetic diversity and population structure of Salix psammophila based on phenotypic traits and simple sequence repeat markers. PeerJ 2019, 7, e6419. [Google Scholar] [CrossRef] [PubMed] [Green Version]
  25. Thrall, P.H.; Young, A. AUTOTET: A program for analysis of autotetraploid genotypic data. J. Hered. 2000, 348–349. [Google Scholar] [CrossRef] [PubMed] [Green Version]
  26. Nagy, S.; Cernák, I.; Mousapour Gorji, A.; Géza Hegedűs, G.; Taller, J. PICcalc: An Online Program to Calculate Polymorphic Information Content for Molecular Genetic Studies. Biochem. Genet. 2012, 50, 670–672. [Google Scholar] [CrossRef] [Green Version]
  27. Liu, S.; Liu, H.; Wu, A.; Hou, Y.; An, Y.; Wei, C. Construction of fingerprinting for tea plant ( Camellia sinensis ) accessions using new genomic SSR markers. Mol. Breed. 2017, 37, 93. [Google Scholar] [CrossRef]
  28. Li, L.; Xu, X.; Zhang, G.; Zhang, X. Establishment of molecular identity cards for cucumis melo cultivars using ssr markers. HortScience 2018, 53, 138–143. [Google Scholar] [CrossRef] [Green Version]
  29. Dong, L.; Sun, Y.; Zhao, K.; Zhang, J.; Zhang, Y.; Li, X.; Xun, S.; Zhang, J.; Wang, S.; Li, Y. Development and application of EST-SSR markers for DNA fingerprinting and genetic diversity analysis of the main cultivars of black locust (robinia pseudoacacia L.) in China. Forests 2019, 10, 644. [Google Scholar] [CrossRef] [Green Version]
  30. Zhao, Y.; Wangle, Y.; Wangle, L.; Zhang, D. Molecular identification of mung bean accessions (Vigna radiata L.) from Northeast China using capillary electrophoresis with fluorescence-labeled SSR markers. Food Energy Secur. 2019, e182. [Google Scholar] [CrossRef] [Green Version]
  31. Freixas-Coutin, J.A.; An, S.; Postman, J.; Bassil, N.V.; Yates, B.; Shukla, M.; Saxena, P.K. Development of a reliable Corylus sreference database through the implementation of a DNA fingerprinting test. Planta 2019, 249, 1863–1874. [Google Scholar] [CrossRef] [PubMed]
  32. Pan, Y.B.; Cordeiro, G.M.; Henry, R.J. Molecular genotyping of sugarcane clones with microsatellite markers. Maydica 2003, 48, 319–329. [Google Scholar]
  33. Tan, L.-Q.; Wang, L.-Y.; Xu, L.-Y.; Wu, L.-Y.; Peng, M.; Zhang, C.-C.; Wei, K.; Bai, P.-X.; Li, H.-L.; Cheng, H.; et al. SSR-based genetic mapping and QTL analysis for timing of spring bud flush, young shoot color, and mature leaf size in tea plant (Camellia sinensis). Tree Genet. Genomes 2016, 12, 1–13. [Google Scholar] [CrossRef]
  34. Siew, G.Y.; Wei Lun Ng, W.L.; Tan, S.W.; Alitheen, N.B.; Tan, S.G.; Yeap, S.K. Genetic variation and DNA fingerprinting of durian types in Malaysia using simple sequence repeat (SSR) markers. PeerJ 2018, 6. [Google Scholar] [CrossRef] [Green Version]
  35. Zhou, H.; Penghang Zhang, P.; Luo, J.; Liu, X.; Fan, S.; Liu, C.; Han, Y. The establishment of a DNA fingerprinting database for 73 varieties of Lactuca sativa capitate L. using SSR molecular markers. Hortic. Environ. Biotechnol. 2019, 60, 95–103. [Google Scholar] [CrossRef]
  36. Galli, Z.; Halász, G.; Kiss, E.; Heszky, L.; Dobránszki, J. Molecular identification of commercial apple cultivars with microsatellite markers. HortScience 2005, 40, 1974–1977. [Google Scholar] [CrossRef] [Green Version]
  37. Gökirmak, T.; Mehlenbacher, S.A.; Bassil, N.V. Characterization of European hazelnut (Corylus avellana) cultivars using SSR markers. Genet. Resour. Crop. Evol. 2009, 56, 147–172. [Google Scholar] [CrossRef]
  38. Gürcan, K.; Mehlenbacher, S.; Erdoğan, V. Genetic diversity in hazelnut (Corylus avellana L.) cultivars from Black Sea countries assessed using SSR markers. Plant Breed. 2010, 129, 422–434. [Google Scholar]
Figure 1. MC2 of different number of combined markers.
Forests 11 00176 g001
Figure 2. Estimates of the GC1 and MC2 of combined markers of SSR markers, calculated for a sample of 261 accessions of Salix psammophila, (A) two-marker combination; (B) three-marker combination; (C) four-marker combination; (D) five-marker combination; (E) six-marker combination; (F) seven-marker combination; (G) eight-marker combination; (H) nine-marker combination.
Forests 11 00176 g002
Figure 3. Allele sizes and frequencies for nine-marker combination in 261 accessions of Salix psammophila.
Forests 11 00176 g003
Figure 4. Two-dimensional barcode of S. psammophila ’Neinong NO.1’.
Forests 11 00176 g004
Table 1. Polymorphism and genetic metrics of the 22 pairs of SSR (Simple Sequence Repeat) markers.
Locus CodeAAiGG1HoHeM1/% M2/% PICPI
c4A112.4178410.60.6652.5615.710.640.14
c16B82.232680.560.5530.773.070.510.25
c24C142.8497560.760.7657.7321.460.740.08
c25D51.84820.470.4525.000.770.350.40
c46E82.5351190.680.6737.257.280.620.16
c49F82.0327100.480.5137.043.830.470.28
c52G172.2091540.550.6359.3420.690.610.15
c57H31.74910.400.4111.110.380.330.42
c59I183.331761350.880.8776.7051.720.860.02
c61J162.81130890.770.8468.4634.100.830.04
c69K162.681541020.730.8866.2339.080.870.02
c73L92.2773410.570.7356.1615.710.700.11
c74M52.3534110.620.6532.354.210.580.19
c76N142.6187520.700.7059.7719.920.660.13
c77O92.2349220.570.6044.908.430.560.20
c90P71.6535140.350.7140.005.360.650.14
c96Q82.0736130.530.5636.114.980.510.25
c97R162.0792600.490.6565.2222.990.630.13
c99S112.2997510.600.8152.5819.540.780.06
c100T62.3131130.630.6241.944.980.560.20
c112U122.576390.660.7251.3214.940.680.12
c115V82.2347150.570.6831.915.750.620.16
Mean-10.412.3368.3638.550.600.6747.0214.770.630.17
Total-229-1504848------
A, number of alleles per locus; Ai, number of different alleles per individual and locus; G, number of four allele genotypes per locus; G1, number of four allele specific genotypes per locus; Ho, observed heterozygosity; He, expected heterozygosity; M1, the unique genotype ratio of per marker; M2, identification rate of per marker.
Table 2. The differential index of nine-marker combination.
Nine-Marker Combination GC1MC2/%In Total of PIC
G+H+I+J+N+O+S+T+U2611005.88
G+H+J+L+N+O+S+T+U2611005.72
G+H+J+N+O+R+S+T+U2611005.65
G+H+J+N+O+S+T+U+V2611005.64
G+I+J+N+O+Q+S+T+U2611006.05
G+J+L+N+O+Q+S+T+U2611005.89
G+J+N+O+Q+R+S+T+U2611005.82
G+J+N+O+Q+S+T+U+V2611005.81
A+G+H+I+J+N+S+T+U25999.235.96
A+G+H+J+L+N+S+T+U25999.235.79
GC1, each of combined marker genotypes; MC2, identification rate of combined markers.

