Article

Development and Characterization of Simple Sequence Repeat Markers for, and Genetic Diversity Analysis of Liquidambar formosana

1
Beijing Advanced Innovation Center for Tree Breeding by Molecular Design, National Engineering Laboratory for Tree Breeding, Key Laboratory of Genetics and Breeding in Forest Trees and Ornamental Plants of Ministry of Education, Key Laboratory of Forest Trees and Ornamental Plants Biological Engineering of State Forestry Administration, College of Biological Sciences and Biotechnology, Beijing Forestry University, Beijing 100083, China
2
College of Landscape Architecture, Beijing University of Agriculture, Beijing 102206, China
3
Henan Longyuan Flowers & Trees Co., Ltd., Yanling 461200, China
*
Authors to whom correspondence should be addressed.
Forests 2020, 11(2), 203; https://doi.org/10.3390/f11020203
Submission received: 29 November 2019 / Revised: 2 January 2020 / Accepted: 24 January 2020 / Published: 12 February 2020
(This article belongs to the Section Forest Ecophysiology and Biology)

Abstract

:
Liquidambar formosana (Hamamelidaceae) is a relatively fast-growing deciduous tree of high ornamental value that is indigenous to China. However, few molecular markers are available for the species or its close relatives; this has hindered genomic and genetic studies. Here, we develop a series of transferable expressed sequence tag-simple sequence repeats (EST-SSRs) for genomic analysis of L. formosana. We downloaded the sequence of the L. formosana transcriptome from the National Center of Biotechnology Information Database and identified SSR loci in the Unigene library. We found 3284 EST-SSRs by mining 34,491 assembled unigenes. We synthesized 100 random primer pairs for validation of eight L. formosana individuals; of the 100 pairs, 32 were polymorphic. We successfully transferred 12 EST-SSR markers across three related Liquidambar species; the markers exhibited excellent cross-species transferability and will facilitate genetic studies and breeding of Liquidambar. A total of 72 clones of three Liquidambar species were uniquely divided into three main clusters; principal coordinate analysis (PCoA) supported this division. Additionally, a set of 20 SSR markers that did not exhibit nonspecific amplification were used to genotype more than 53 L. formosana trees. The mean number of alleles (Na) was 5.75 and the average polymorphism information content (PIC) was 0.578, which was higher than that of the natural L. formosana population (0.390). In other words, the genetic diversity of the plus L. formosana population increased, but excellent phenotypic features were maintained. The primers will be valuable for genomic mapping, germplasm characterization, gene tagging, and further genetic studies. Analyses of genetic diversity in L. formosana will provide a basis for efficient application of genetic materials and rational management of L. formosana breeding programs.

1. Introduction

Liquidambar formosana is a large deciduous tree in the genus Liquidambar. There are four principal species in the genus: L. formosana, L. styraciflua, L. acalycina, and L. orientalis. L. formosana is distributed principally in East Asia, including China, Laos, Vietnam, Japan, and the Korean Peninsula, from 18° to 38° north latitude [1]. The tree is generally found on plains and hills at 1000–1500 m above sea level, and requires abundant sunshine and moisture for growth. Given the increasing demand for wood, fast-growing trees yielding high-quality wood that are amenable to afforestation are urgently needed [2]. Liquidambar, especially L. styraciflua and L. formosana, generally meet these requirements [3,4]. L. formosana is of high economic, ornamental, and ecological value, and is attracting increasing attention in terms of wood production, landscaping, and medicinal use. The wood is compact, soft, and easy to process and handle; the roots, leaves, bark, and inflorescence resin can be used in medicines [5]. The resin (in particular) is used for detoxification, pain relief, to establish haemostasis, and to encourage muscle growth, and also serves as a perfume fixative [6]. The trunk is thick, straight, and imposing in appearance; the crown is wide and the leaves have an attractive red colour in the late autumn. L. formosana exhibits marked adaptability in the wild and is highly resistant to toxic gases, especially SO2 and chlorine, and is thus often used to green factories and mines [7]. This fast-growing species is recognized as a “pioneer tree” for afforestation.
The cultivation, asexual propagation, afforestation, and genetic breeding of Liquidambar (especially L. styraciflua) have been extensively studied; however, breeding research is less advanced. Winstead (1971) reported that various seed sources differed in the amount of time required for germination; the germination rates differed significantly [8]. Suhaendi (1989) explored 12 provenances of L. styraciflua and found that the Honduran provenance (LosAkoes-46/83) exhibited the highest germination rate [9]. Kariuki (1989) reported significant differences in seed germination rate among trees from different provenances [10]. He (2005) tested 20 provenances of L. formosana from eight provinces in China, and reported highly significant differences in tree height and ground-level diameter [11]. These studies provided valuable materials and allowed researchers to gain experience useful for breeding improved formosana varieties. Shi et al. (1997) selected 90 superior L. formosana trees from Anhui Province, China [12]. Zhao et al. (2009) optimized the secondary forests of L. formosana in 10 counties of Guizhou Province, China. Compared to the control group, the average tree height, diameter at breast height, and volume increased by 12.7, 24.4, and 61.2%, respectively [13]. Individual trees, or groups, exhibiting valuable traits were selected for breeding; the useful traits were shown to be stably inheritable. However, the vast majority of tree species remain in a wild or semi-wild state. Genetic variation is thus large, such that there is great potential for the selection of valuable traits [14]. However, marker-assisted selection (MAS) of L. formosana and related species is difficult, given the lack of molecular markers. MAS enhances breeding efficiency; target genotypes are directly selected [15]. Little is known about species-specific diagnostic genetic relationships among, or the genetic diversity of populations of, L. formosana. Vendrame et al. (2001) used RAPD markers to show that the somatic embryo seedlings of hybrid sweetgum were heterozygous [16]. Bi et al. (2010) analyzed genetic diversity in the natural populations of Liquidambar fornosana revealed by ISSR molecular markers [17] Sun et al. (2016) developed and screened 14 pairs of simple sequence repeat (SSR) primers based on transcriptome data, and analyzed the genetic diversity of 25 populations and 691 individual plants over the entire distributional range of L. formosana [18]. Genetic diversity is the principal form of biodiversity, providing excellent evidence of species formation, molecular evolution, and geographical variation. The extent and distributional pattern of intraspecific genetic variation determine whether a species can cope with environmental mutations. The genetic diversity of plus trees allows us to understand the genetics of superiority, and guides rational selection of the second generation of such trees [19,20]. However, compared to other economically important tree species, few genetic studies on L. formosana have appeared.
SSRs, also termed microsatellites, are tandem repeat sequences in which at least one nucleotide serves as the basic unit; they are widely dispersed in the genomes of eukaryotes, being present in non-coding, coding, and other chromosomal regions. SSRs are currently divided into genomic SSRs and expressed sequence tagged-SSRs (EST-SSRs), and are universally accepted as powerful molecular tools facilitating MAS, genetic linkage mapping, analysis of genetic diversity, and cultivar identification [21,22]. EST-SSRs are found in coding regions, affording the advantages of co-dominance, wide coverage, simple detection, convenient operation, rapid action, and high-level polymorphism. EST-SSR markers exhibit excellent cross-species transferability because they are designed using highly conserved transcriptome data [23,24]. For estimation of genetic advantage, EST-SSRs have been developed for many trees and crops (including Gossypium, Populus, and the Leguminosae) [25,26,27]; these have been used to create high-quality genetic maps, to perform comparative genomic studies, and to facilitate MAS. For L. formosana, the 14 currently available EST-SSRs pairs are inadequate for detailed genetic research [18]. Consequently, a set of polymorphic EST-SSR markers for L. formosana based on transcriptome data is urgently needed.
Here, we obtained transcriptome data from the National Center of Biotechnology Information, generated unigenes, and identified many useful EST-SSRs for L. formosana. We created a new series of EST-SSR markers and tested their cross-species transferability among Liquidambar species. We used the original EST-SSR markers to investigate the genetic diversity of plus L. formosana trees in Henan Province. The new EST-SSR markers will serve as valuable molecular tools for further genetic and breeding research on L. formosana and related species. Analysis of genetic diversity will provide significant information on the plus L. formosana population. Evaluation of genetic variation after selection could underpin efficient management and selection of hybrid parents among Liquidambar species.

2. Materials and Methods

2.1. Plant Materials

On Jigong Mountain (Xinyang, Henan Province, China, 31°52′ N, 114°05′ E), we selected branches from 60 plus L. formosana trees and hydroponically cultured them in the greenhouse of Beijing Forestry University (Haidian District, Beijing, P.R. China; 39°95′ N, 116°30′ E). In the selection process, the candidate plus tree are selected as the center, and within the radius of 10-25m, three plus trees rank only second to the candidate plus tree are selected. The height, diameter at breast height (DBH) and under branch height of the candidate plus tree should be greater than 105%, 120% and 110% of the average values of the three plus trees. In addition, the candidate plus trees should reach the mature stage, with large amount of flowering and fruit bearing, which is also required the trunk is straight, with obvious apical dominance. No plant diseases or insect pests. Finally, tender leaves of 53 individuals were collected and stored at −80 °C prior to DNA extraction due to some samples died during hydroponics. During primer screening, two individuals of L. formosana were randomly selected to detect amplification, and eight were used to detect EST-SSR polymorphisms. To test cross-species transferability, six L. styraciflua were collected from Shanghai Chenshan Botanical Garden (Songjiang District, Shanghai, China, 31°03′ N, 121°22′ E); 13 hybrid sweetgum (L. styraciflua × L. formosana) obtained via hybridization [28] were used to test SSR transferability. The L. formosana and L. styraciflua were native population while hybrid sweetgum was from cultivated population. In total, 72 sampled Liquidambar trees were used and details for the 72 individuals can be obtained from supplementary Table S1.

2.2. Transcriptome Assembly, SSR Mining, and Primer Design

The sequence of the L. formosana transcriptome was downloaded from https://www.ncbi.nlm.nih.gov/ (accession numbers SRR1514949 and SRR1514913) [29]; the sequences were assembled and SSR loci were identified in the Unigene library using MISA (MIcroSAtellite identification tool, http://pgrc.ipk-gatersleben.de/misa/). The search criteria were as follows: minimum repetitions of di-, tri-, tetra-, penta-, and hexa-nucleotides of nine, six, five, five, and four respectively (the SSR search criteria did not include single-nucleotide repetitions). Primer3 software [30] was used to design the EST-SSR primers after excluding fragments with inappropriate or excessively short flanking sequences. To avoid hairpin formation and mispairing, the primers with the highest scores were selected and stored in a primer library. The specific primer design parameters were as follows: (1) length, 18 to 22 bp; (2) annealing temperature, 58 to 61 °C (optimum, 60 °C); (3) GC content, 40 to 60%; and (4) expected PCR product length, 150 to 300 bp.

2.3. DNA Extraction, PCR Amplification, and Detection of Polymorphisms

Total genomic DNA was extracted using a modified cetyltrimethylammonium bromide method [31], and yields were determined with the aid of a NanoDrop 2000 spectrophotometer (Thermo Scientific, Wilmington, DE, USA). DNA was diluted to 50–100 ng/μL and DNA quality was evaluated via 0.8% (w/v) agarose gel electrophoresis prior to subsequent analysis. The PCR amplifications afforded by 100 synthetic primers in eight randomly selected L. formosana were evaluated prior to further genetic research. Each reaction mixture (20 μL) contained 2 μL template DNA (50–100 ng/μL), 10 μL 2× TaqMaster Mix (Biomed-Tech, Beijing, China), and 4 μL of primer solution (volume ratio of forward:reverse primers 1:4). We ensured that the fragments created using mixed primers were long, to guarantee that detection via fluorescent capillary electrophoresis (the next step) was not compromised by unwanted fluorescent signals. The PCR conditions were as follows: 95 °C for 5 min, followed by 30 cycles at 94 °C for 30 s, 56 °C for 30 s, and 72 °C for 30 s, 8 cycles at 94 °C for 30 s, 54 °C for 30 s, 72 °C for 30 s, and a final extension at 72 °C for 10 min. The amplified products were subjected to 2% (w/v) agarose gel electrophoresis. EST-SSR primers that yielded clear bands were employed for wholesale genotyping, and for analysis of genetic diversity and cross-species transferability, using M13 technology [32] with fluorescent labels (FAM, HEX, TAMRA, and ROX), and same dye always used with each locus. The sequence of m13 was TGTAAAACGACGGCCAGT. The PCR products were analyzed using a capillary-based ABI 3730XL DNA Analyzer, and amplicon sizes were measured by a Gene Mapper (Applied Biosystems, Foster City, CA, USA).

2.4. Genetic Diversity of Plus Trees of L. formosana, and Statistical Analysis

Of the 32 pairs of polymorphic primers developed, 16 pairs that did not show non-specific amplification were selected. Additionally, the four SSR pairs developed by Sun et al. [18] were employed; these exhibited high-level capacity to detect polymorphisms and were well-amplified. A total of 20 SSRs were thus used for PCR amplification of 53 plus L. formosana individuals. All fluorescent capillary electrophoresis data were recorded in Microsoft Excel 2007 (Microsoft Corp., Redmond, WA, USA). Convert software (ver. 1.3) [33] was used to transform the data into formats that could be analyzed by other biological software. POPGENE (ver. 1.3.2) [34] was employed to estimate genetic parameters, such as the number of alleles (Na), effective allele number (Ne), Shannon information index (I), observed heterozygosity (Ho), and expected heterozygosity (He). Each locus was subjected to Hardy–Weinberg equilibrium (HWE) testing using POPGENE (ver. 1.32) and the chi-squared test. The polymorphism information content (PIC) of each locus was calculated using Pic_Calc (ver. 0.6) [35]. The population genetic structures of three Liquidambar species were analyzed by Structure software (ver. 2.3.3) and the true value of clusters (K) were harvested using log probability of data according to the method of G. Evanno (2005), when delta K is maximum, the k value is suitable for numbers of groups [36] running a mixed model. PowerMarker (ver. 3.25) [37] was employed to calculate the relationship between any two clones based on the Nei genetic distance, and principal component analysis (PCA) was performed using GenALEx software (ver. 6.2) [38].

3. Results

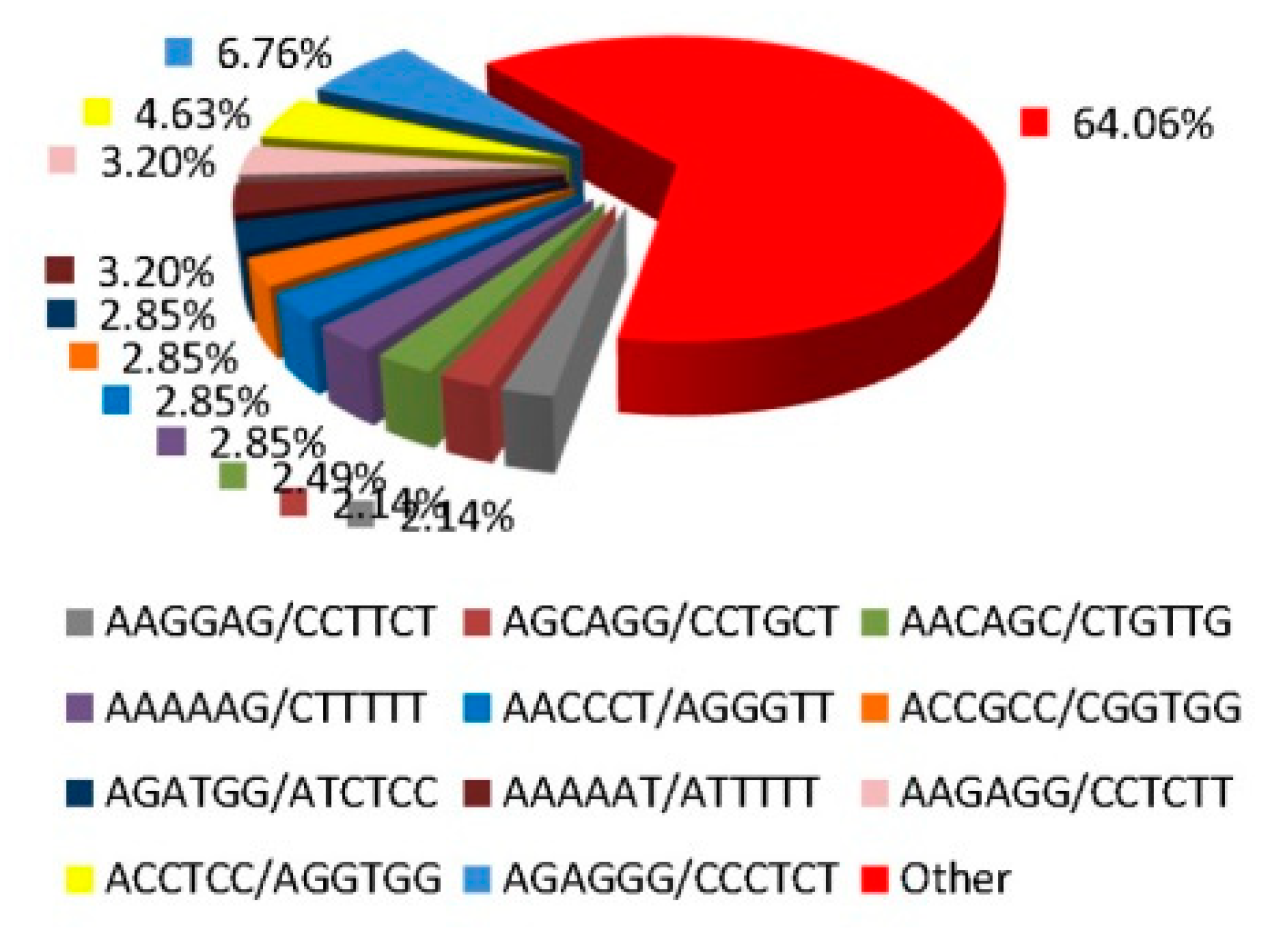
3.1. The Frequency and Distribution of SSR Loci

Unprocessed data obtained via high-throughput sequencing were pre-processed and redundant low-quality sequences were removed. Finally, a total of 34,491 unigenes were defined in the L. formosana transcriptome, with an average length 699 bp. SSR loci were then searched for in MISA. Table 1 showed that the total sequence length was 24,122,122 bp; 3284 SSR loci were found (frequency, 9%). On average, one SSR locus was seen every 7.3 kb. Of these, 298 unigene loci containing more than one SSR locus accounted for 10% of the total, and 109 complex SSR loci constituted 3% of the total.
As high-throughput transcriptome sequences sometimes contain errors, we did not consider single-nucleotide SSR sites. Table 2 shows that the remaining 2742 SSR loci included five SSR repeat motifs (di-, tri-, tetra-, penta-. and hexa-nucleotide repeats), of which the principal type was the dinucleotide (52.56%), followed by the trinucleotide (33.80%). The most abundant SSR loci contained six serial repeats (16.67% of all SSR loci), followed by loci with nine repeats (15.50%). Of the dinucleotide repeats, AG/CT exhibited the highest frequency (Figure 1) (92.51%), followed by AC/GT (5.27%) and AT/AT (2.22%). Of the trinucleotide repeats, AAG/CTT was the most abundant (31.18%), followed by ACC/GGT (20.50%) and AGC/CTG (13.48%). Of the tetranucleotide repeats, AAAT/ATTT exhibited the highest frequency (29.69%), followed by AAAG/CTTT (25.00%) and ACAT/ATGT (9.38%). Of the pentanucleotide repeats, AAAAG/CTTTT was the most common (17.24%), followed by AAGAG/CTCTTand AAAGG/CCTTT (each, 10.34%). The frequency of the hexanucleotide repeat AGAGGG/CCCTCT was 6.76%.

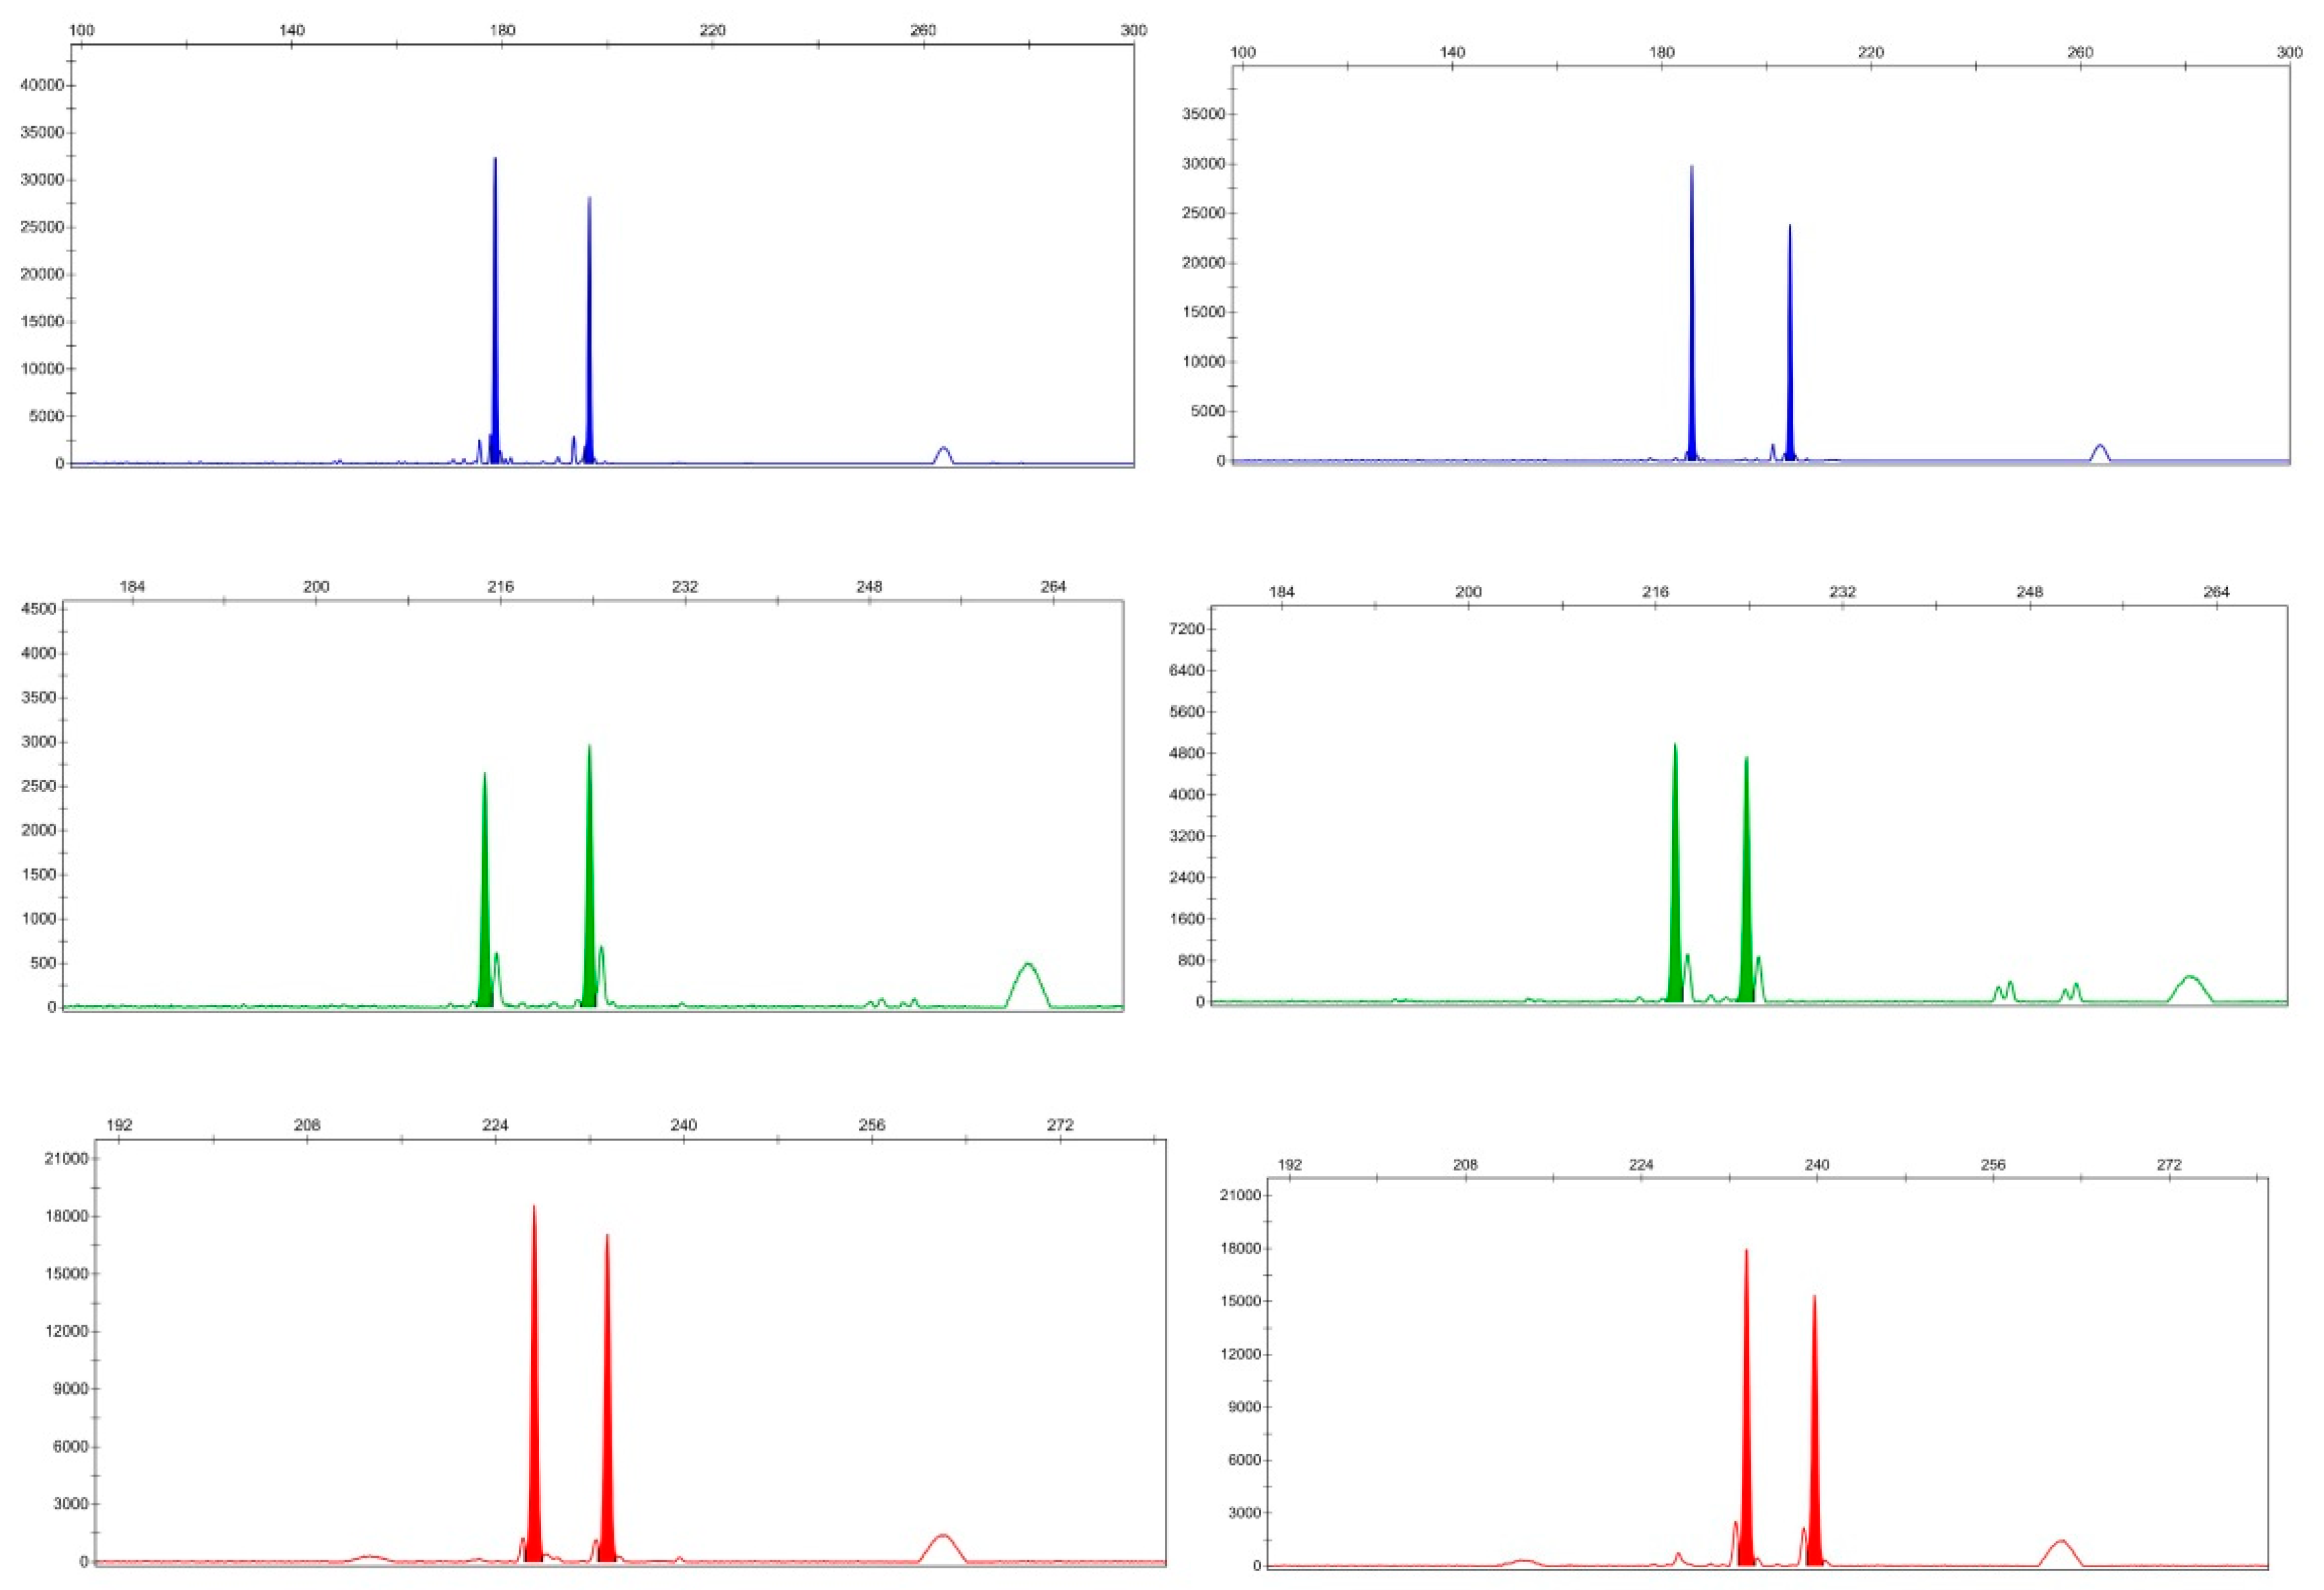
3.2. Synthesis, Screening, and Polymorphisms of EST-SSR Primers

Primer software (ver. 3.0) was used to design 2742 SSR loci; some loci were unusable because the flanking sequences were inadequate or they did not meet primer design standards. We finally selected 100 pairs of synthetic primers. The amplifications obtained were preliminarily screened using two randomly selected individual DNAs of L. formosana. Seventy-two pairs of primers yielding amplified bands were selected (effective amplification rate, 72%). Eight randomly selected DNA samples of L. formosana were amplified by PCR and products were detected via fluorescence capillary electrophoresis; 32 pairs of polymorphic primers (32%) were found. The information afforded by each pair is shown in Table 3. The polymorphisms amplified by primer pair Liq_eSSR10, Liq_eSSR17 and Liq_eSSR59 in L. formosana samples are selected randomly to discuss here (Figure 2).

3.3. Genetic Diversity of Plus Trees of L. Formosana

A total of 115 alleles (Na) from 20 SSR loci were amplified from 53 individuals of L. formosana. The number of Liq_eSSR35 alleles was highest (13), while the numbers of Liq_eSSR17 and Liq_eSSR34 alleles were lowest (3). An average of 5.75 alleles were amplified from each locus; 3.16 effective alleles (Ne) were amplified from 20 SSR loci; the maximum number (Liq_eSSR35) was 8.87 and the minimum number (Liq_eSSR34) 1.28. The average number of effective alleles/locus was 3.17 (Table 4). The Shannon diversity index (I) was highest at Liq_eSSR35 (2.317); the average value was 1.250. The observed heterozygosity (Ho) and expected heterozygosity (He) were highest for Liq_eSSR35 (0.978 and 0.887, respectively). The average Ho was 0.653 and the average He was 0.621. PIC is useful for measuring SSR locus polymorphisms, reflecting whether a locus can distinguish among populations. If the PIC is >0.5, the locus is highly polymorphic; if it is between 0.25 and 0.5, it is moderately polymorphic; and if it is <0.25, it is poorly polymorphic; the average PIC was 0.578. We analyzed plus L. formosana trees; the PIC of each locus reflected the genetic diversity. The average PIC was 0.578, significantly higher than the average PIC (0.309) of a natural population of L. formosana. Thus, the genetic diversity of the dominant population did not decrease; in fact, it increased, although phenotypic dominance was maintained. In the HWE test, five SSR loci (Liq_eSSR33, Liq_eSSR35, Liq_eSSR7, Liq_eSSR90, and Liq_eSSR25) deviated significantly from equilibrium (P<0.05); all exhibited heterozygote overabundance (Table 4).

3.4. Cross-Transferability of EST-SSR Primers

Twenty EST-SSR primers were further tested in two related Liquidambar species; L. styraciflua (N = 6) and hybrid sweetgum (N = 13). Na and PIC were evaluated to measure the cross-transferability of the 20 primer pairs (Table 5.). Nineteen of the 20 primer pairs showed amplification in hybrid sweetgum (95%), as did 20 pairs in L. styraciflua (100%); five pairs showed monomorphic amplification. 12 primer pairs of the newly developed EST-SSRs in this study presented highly polymorphism among the two related species, with average PIC values 0.502 in hybrid sweetgum and 0.452 in L. styraciflua; average Na 3.89 in hybrid sweetgum and 0.452 in L. styraciflua. Thus, these primers could be used to analyze other species of Liquidambar.

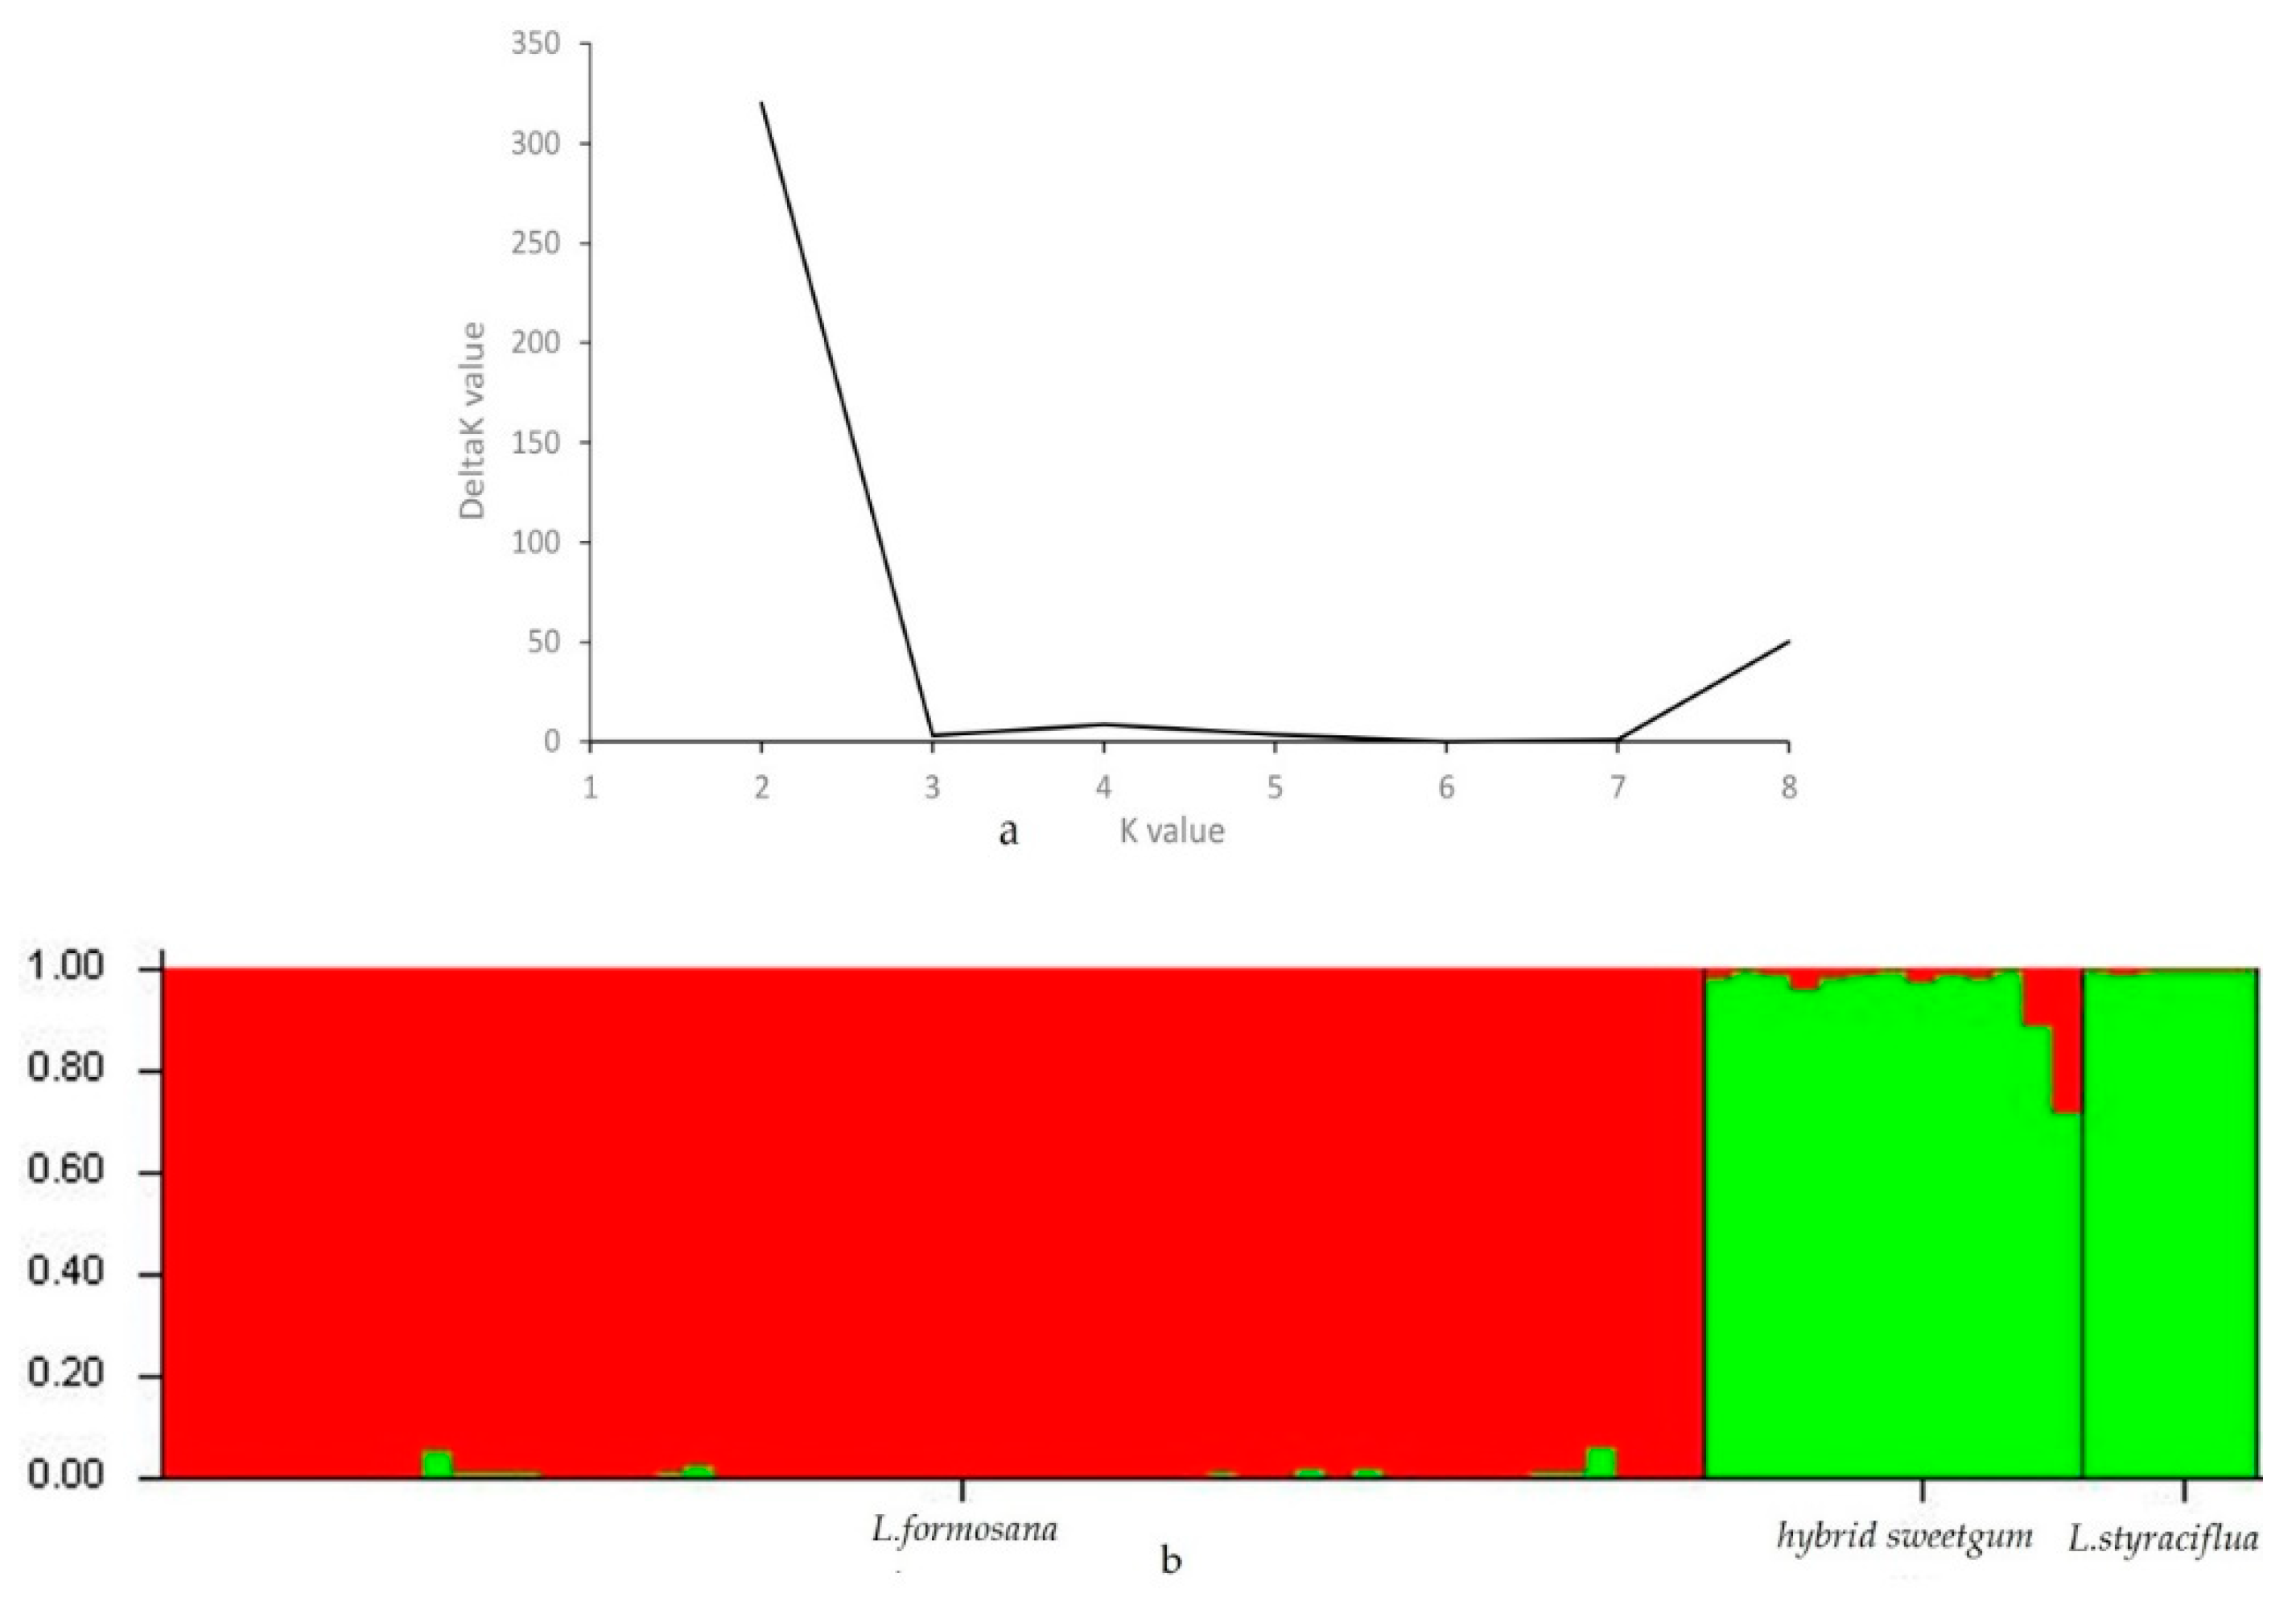
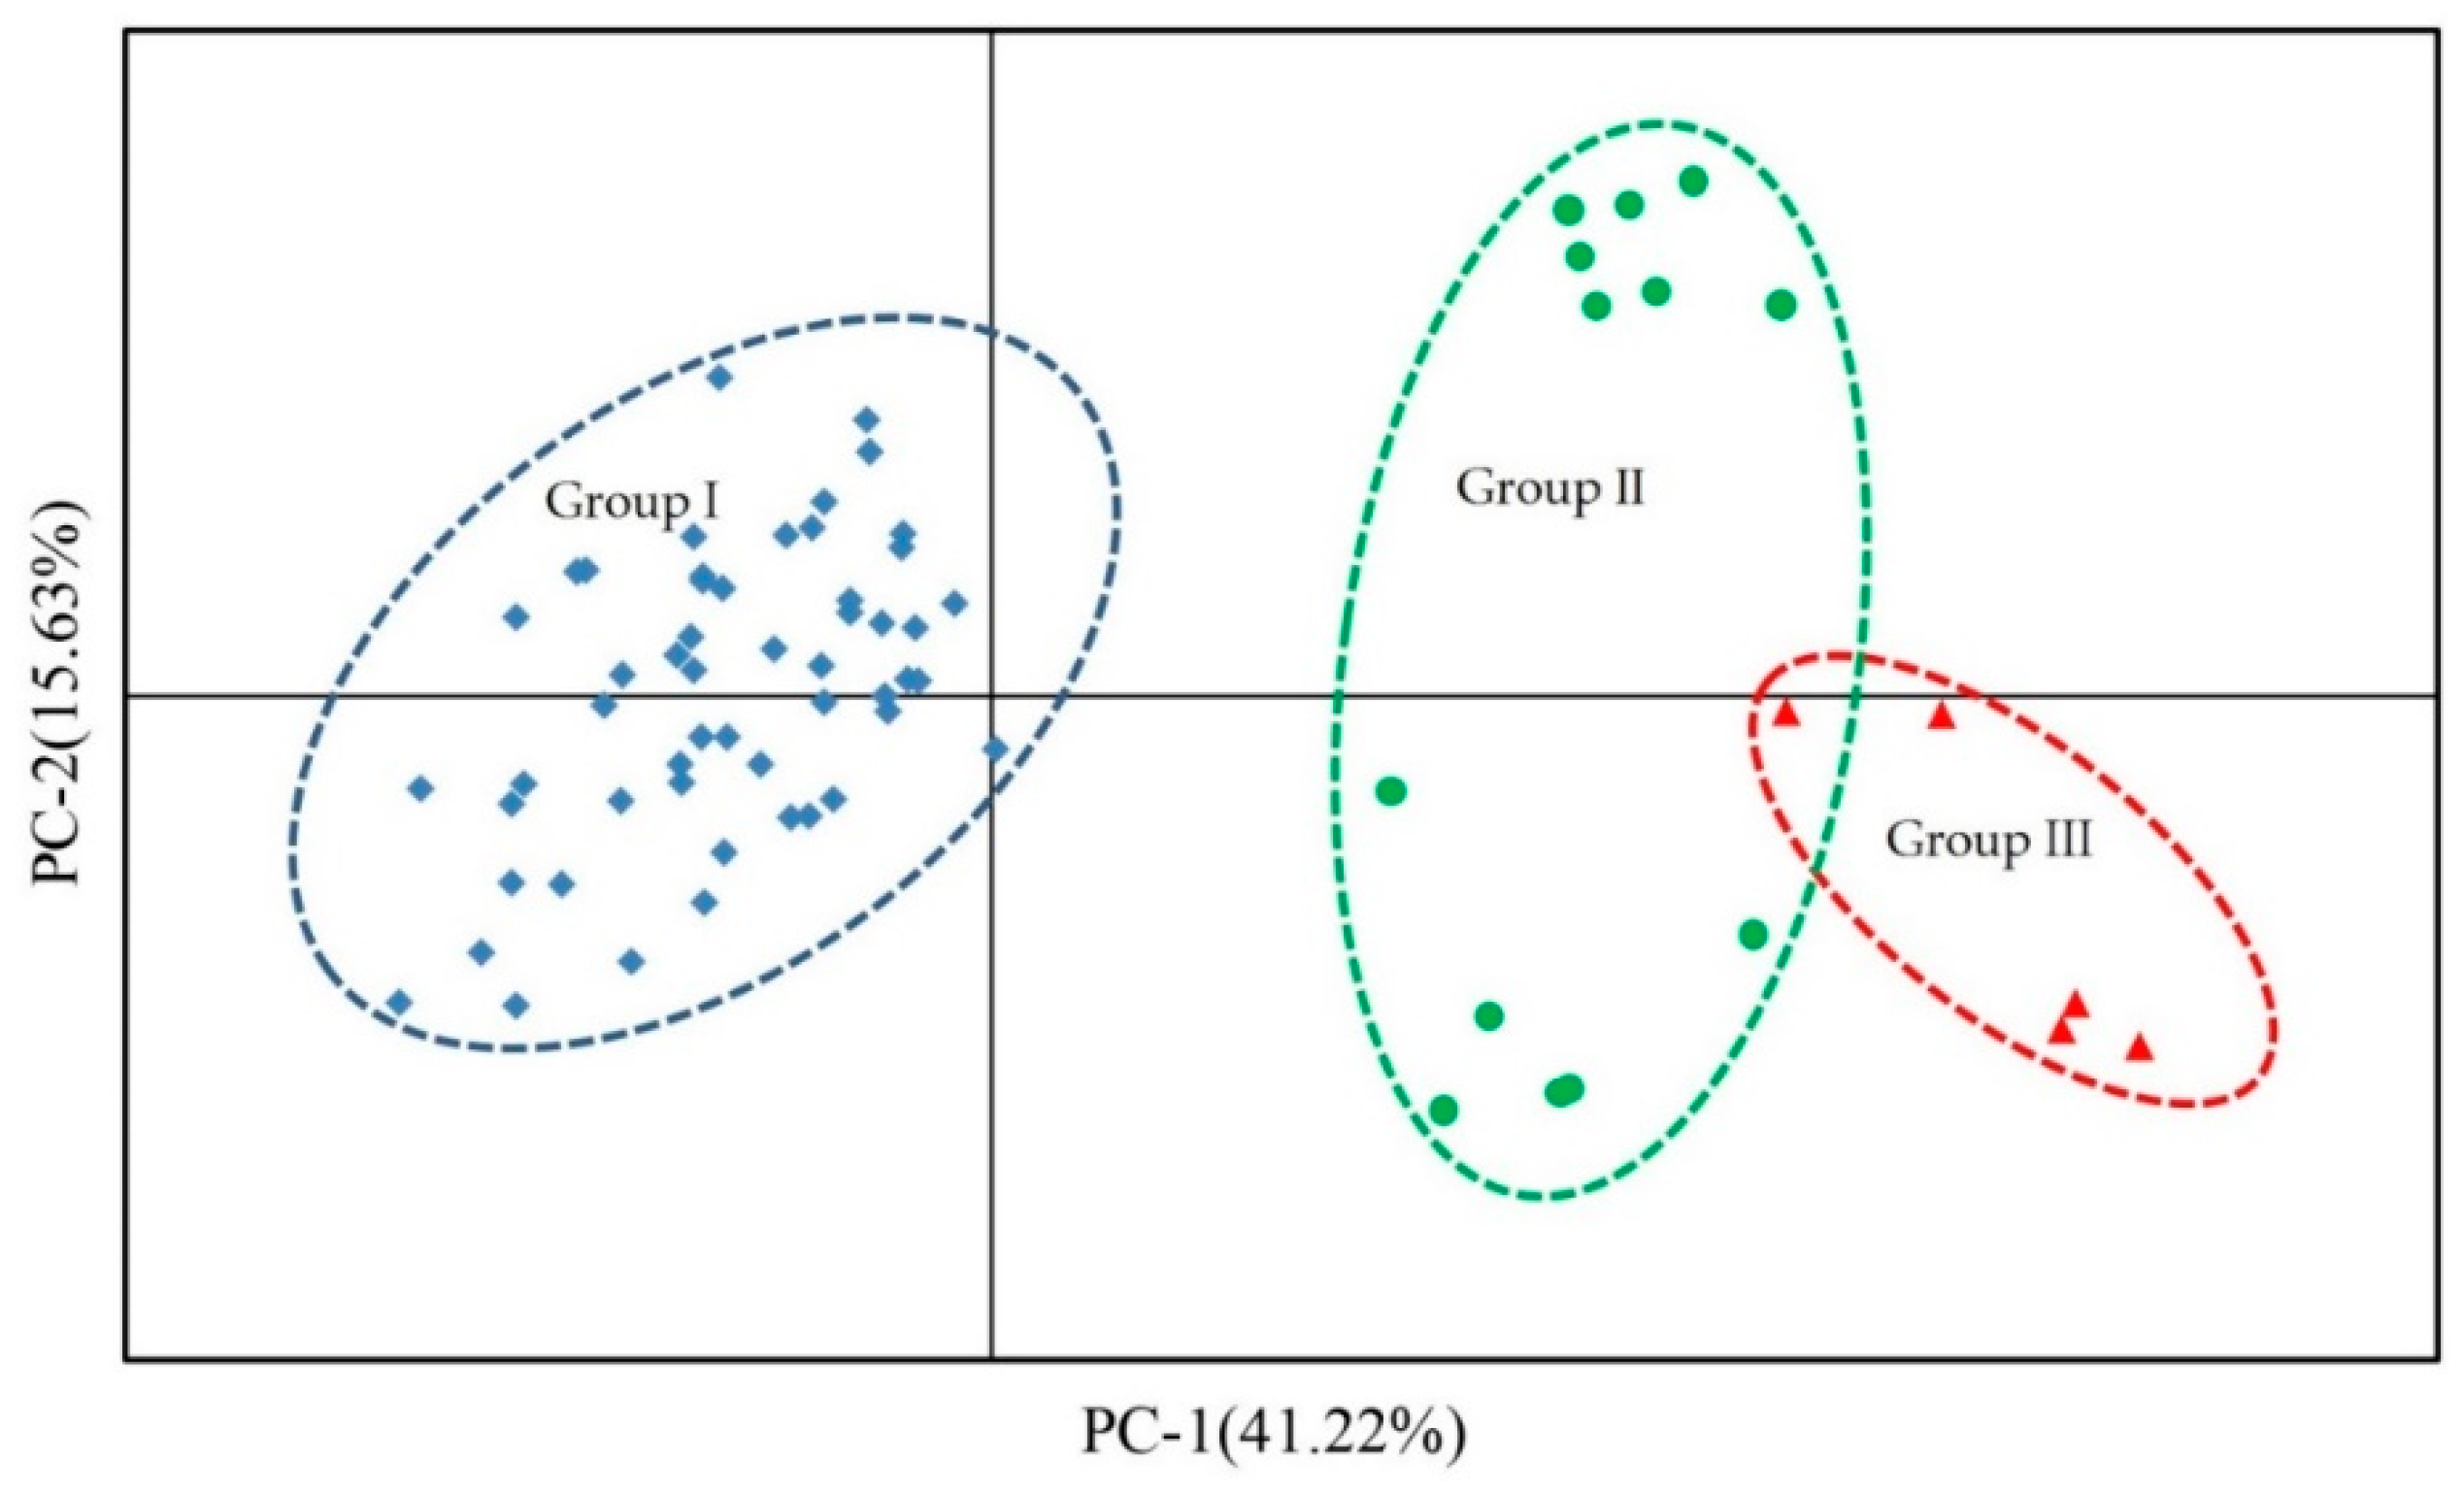
3.5. Population Genetic Structure Analysis, Cluster Analysis, and PCA of Three Species of Liquidambar

STRUCTURE software (ver. 2.3.3) was used to analyze genetic structure of 72 individuals of three species of Liquidambar. According to Evanno, the maximum K represents the optimal number of clusters and K = 2 was the largest value; the Liquidambar individuals should thus be divided into two groups (Figure 3). 72 individuals were divided into two main gene pools. Here, the male parent of the hybrid sweetgum was L. formosana (more red) and the female parent was L. styraciflua (more green). As the proportion of green in the hybrid sweetgum was much higher than that of red, the hybrid was grouped with L. styraciflua. Cluster analysis based on the neighbour-joining (NJ) method was established to demonstrate the relationships between 72 individuals of three species of Liquidambar; L. formosana was clearly clustered apart from hybrid sweetgum and L. styraciflua, when we focused on hybrid sweetgum and L. styraciflua, cluster analysis can clearly separate L. styraciflua from hybrid sweetgum. (Figure 4). L. styraciflua and hybrid sweetgum were closely related, confirming the results of the genetic structure analysis. PCoA analysis demonstrated the dispersion of the three Liquidambar species through a two-dimensional scatter plot, which divided the 72 individuals into three groups, In particular, L. formosana was well-grouped and the closer relationship between hybrid sweetgum and L. styraciflua was proved as well. The results (Figure 5) showed that coordinates 1 differentiate Group I from Group II and Group III and explained for 41.22% of the total variation. Coordinates 2 differentiate Group II from Group III and accounted 15.63% of the total variation. The results were in agreement with those of cluster analysis and population genetic structure analysis.

4. Discussion

L. formosana is highly adaptable, grows rapidly in forests, exhibits a straight trunk and wide crown, and is economically, ecologically, and medically valuable; thus, it is a genuine “multi-purpose tree” [1,2]. However, molecular genetic data are lacking for L. formosana because the molecular tools required are not available. SSRs are efficient genetic markers widely used for MAS, distinguishing among tree varieties, constructing genetic atlases, and researching genetic diversity [21]. The development of SSR markers based on transcriptome sequencing is one of the currently recognized efficient methods [24,39], which provides an effective way to alleviate the shortage of SSR markers available in Liquidambar. In previous study, however, only 14 EST-SSR markers [18] were developed for this economic tree species and thus the identification of more co-dominant polymorphic EST-SSR markers with transferable ability from transcriptome would aid genetic improvement of the tree and knowledge transfer to other Liquidambar species. Here, we identified 3284 putative SSRs from 2949 unigenes of the transcriptome. The SSR locus frequency was 1/7.3 kb, lower than that of Camellia sinensis (1/4.99 kb) [40] but much higher than those of Pinus dabeshanensis (1/23.08 kb) [41] and Larix principis-rupprechtii (1/26.8 kb) [42]. The predominant repeat type was the dinucleotide (52.56%), as was true for Robinia pseudoacacia L. [43], Populus tomentosa [44], and Hevea brasiliensis [45], but not Persea americana Mill [46] and Dalbergia odorifera T. Chen. [47]. The numbers and SSR motif types vary among species. Of the dinucleotide repeats, AG/CT units predominated; of the trinucleotide repeats, AAG/CTT was dominant. Differences among studies may be attributable to disparities in genomal structure, the methods used, the parameters selected, and dataset size.
We used 100 primer pairs, selected randomly from a multitude of primer pairs identified via transcriptome analysis, to evaluate the quality and effectiveness of the new EST-SSR markers. Seventy-two primer pairs (72%) generated clear bands from L. formosana genomic DNA; the amplification rate was significantly higher than that of the SSR markers of the transcriptomes of Robinia (25%) [48] and Taxodium ‘zhongshansa’ (51.1%) [49]. Eighteen primer pairs did not yield amplicons, despite adjustment for annealing temperature. Sequencing errors may have been a factor, and primers for protein binding sites may have been unable to bind to their templates [50]. Of the 100 primer pairs tested, 32 (32%) amplified EST-SSR markers exhibiting high-level polymorphism; this proportion is much higher than that of Neolitsea sericea (9.9%) [51], perhaps reflecting the complexity of genome structure and the level of species diversity [52]. We estimated the genetic diversity parameters of 53 L. formosana specimens at 20 loci. The PICs of the 16 new EST-SSR markers ranged from 0.21 to 0.87; 12 markers were highly polymorphic (PIC > 0.5). The PICs reflecting moderate polymorphism (0.2 < PIC < 0.5) were in the order Liq_eSSR35, Liq_eSSR86, Liq_eSSR67, Liq_eSSR90, Liq_eSSR98, Liq_eSSR25, Liq_eSSR10, Liq_eSSR30, Liq_eSSR33, Liq_eSSR62, Liq_eSSR60, Liq_eSSR59; Liq_eSSR17, Liq_eSSR55, and Liq_eSSR7; Liq_eSSR33 was minimally polymorphic (PIC < 0.25) [53]. The average PIC (0.585) was higher than that of a previous study on L. formosana [18]. The PIC is affected by all of SSR numbers, the test method used, and SSR motif repeats [54]. As high-level polymorphism is not the only determinant of primer quality, the stability and cross-species transferability of SSR markers were also important resources for genetic analysis. Therefore, we also evaluated the genetic relationships among 72 trees of three Liquidambar species; the new EST-SSR markers clearly divided Liquidambar into three major clusters. Thus, the markers effectively identified Liquidambar species, as confirmed by PCA and genetic structural analysis. The 16 original EST-SSR markers were transferable to L. styraciflua and hybrid sweetgum; 15 primer pairs yielded clear bands in the two related species and the transferability rate was 93.75%. This is because EST-SSR markers exhibit high transferability between genetically related species, generally. [55]. Thus, our innovative EST-SSR markers showed high-level polymorphism and can be used in genetic studies of L. formosana and related species for interspecific hybrids, comparative mapping analysis, and phylogenetic relationships among species.
Evaluation of genetic diversity is a core issue in forestry. Knowledge of such diversity allows us to better understand adaptation to environmental changes and the evolution of specific species, thus facilitating species protection. Genetic diversity is reflected both phenotypically and at the molecular level. Analysis of such diversity using molecular markers provides insight into the genetic background [56]. We evaluated the genetic diversity of a plus L. formosana population of Henan Province using 20 polymorphic EST-SSR markers. The mean Ho was 0.653, the mean He was 0.621, and the mean PIC was 0.578. Compared to the diversity of a natural L. formosana population [18], we found, surprisingly, that the plus population exhibited greater genetic diversity even after selection. The potential reason may be due to different primers or the influence of selection. The study of superior trees allows us to understand production potential, determine selection criteria, and plan breeding strategies [14]. Heterosis was clearly a factor during interspecific hybridization of Liquidambar species [57]. Therefore, the plus L. formosana population exhibiting abundant genetic variation and a superior phenotype is an ideal hybridization parent, thereby providing valuable materials for further genetic improvement of Liquidambar species.
Cluster analysis and principal component analysis (PCA) clearly divided the three species of Liquidambar into three categories according to the species classification standard, although previous studies showed that the genetic relationship between L. formosana and L. styraciflua was relatively close. The results also showed the high efficiency of our original primer. The results of genetic structure analysis showed that the three Liquidambar species were divided into two main gene pools, the first gene pool (red) was mainly composed of L. formosana, the second gene pool (green) was mainly composed of L. styraciflua, while the hybrid sweetgum contained two gene pools, which indicated that the genetic composition of hybrid sweetgum was affected by both male and female parent, and hybrid sweetgum had a closer relationship with L. styraciflua. [36].

5. Conclusions

We used transcriptome data to develop novel EST-SSR markers exhibiting high-level cross-species transferability. These markers will serve as powerful molecular tools for evaluation of genetic diversity, MAS, and gene map construction, and for use in genetic studies. The genetic diversity of the plus L. formosana population will guide the creation of second-generation plus L. formosana trees, and improve L. formosana breeding programs.

Supplementary Materials

The following are available online at https://www.mdpi.com/1999-4907/11/2/203/s1, Table S1: Details for the 72 individuals of Liquidambar.

Author Contributions

Experiment designed, S.C., J.Z. (Jinfeng Zhang) and M.D.; experiment performed, S.C. and M.D.; data analyzed, S.C., M.D. and Y.Z.; materials collected, Y.Z., S.Q. and X.L.; writing—original draft preparation, S.C.; writing—review and editing, J.Z. (Jian Zhao), Y.Z., M.D. All authors have read and agreed to the published version of the manuscript.

Funding

This paper was supported by Medium and Long Scientific Research Project for Young Teachers in Beijing Forestry University (2015ZCQ-SW-02), “948” Project of China (2014-4-59), and major science and technology special project of Xuchang, Henan province, China (20170112006).

Conflicts of Interest

The authors declare that they have no conflicts of interest.

References

  1. Zhou, G.Y. Chinese sweetgum. J. Ningbo Univ. 1995, 2, 34–41. [Google Scholar]
  2. Zheng, Y.Q.; Pan, B.; Itohl, T. Chemical induction of traumatic gum ducts in Chinese sweetgum, Liquidambar formosana. IAWA J. 2015, 36, 58–68. [Google Scholar] [CrossRef]
  3. Merkle, S.A.; Neu, K.A.; Battle, P.J.; Bailey, R.L. Somatic embryogenesis and plantlet regeneration from immature and mature tissues of sweetgum (Liquidambar styraciflua). Plant Sci. 1998, 132, 169–178. [Google Scholar] [CrossRef]
  4. Kathleen, B.P.; Ickert-Bond, S.M.; Wen, J. Anatomically preserved Liquidambar (Altingiaceae) from the middle Miocene of Yakima Canyon, Washington state, USA, and its biogeographic implications. Am. J. Bot. 2004, 91, 499–509. [Google Scholar]
  5. Jiang, P.C. A survey of studies on Liquidambar formosana. Guangxi Med. J. 1998, 20, 241–242. [Google Scholar]
  6. Zeng, T.; Song, X. Study on the Methods of the Tapping from Chinese SweetGum. China For. Sci. Technol. 2010, 24, 84–87. [Google Scholar]
  7. Weng, L.L.; Jiang, J.D. The research progresses and prospects of local species Liquidamba formosana. J. Fujian For. Sci. Technol. 2007, 34, 184–189. [Google Scholar]
  8. Winstead, J.E. Populational Differences in Seed Germination and Stratification Requirements of Sweetgum. For. Sci. 1971, 17, 34–36. [Google Scholar]
  9. Suhaendi, H. Seed germination and seedling characteristics of twelve greenhouse grown provenances of L. Styraciflua. Buletin Penelitian Hutan 1989, 520, 1–18. [Google Scholar]
  10. Kariuki, J.G. Interim results of a provenancetrial of liquidambar styraciflua in Kenya. Kenya For. Res. Inst. 1989, 5, 1–17. [Google Scholar]
  11. He, G.P.; Chen, Y.T.; Tang, X.Y.; Shen, G.P.; Gao, S.M. A Study on Variations of Young Forest Growing Traits in Liquidambar formosana Geographic Provenances. Acta Agric. Univ. Jiangxiensis 2005, 27, 585–589. [Google Scholar]
  12. Shi, J.L.; Zhu, S.L.; Ma, K.X.; Zhu, J.P. Study on multi-objective breeding of Liquidambar formosana. For. Sci. Technol. 1997, 10, 13–14. [Google Scholar]
  13. Zhao, Y.; Wang, X.R.; Tang, R.H. The elite tree selection of Liquidambar formosana in Guizhou Province. J. Mt. Agric. Biol. 2009, 28, 530–534. [Google Scholar]
  14. Cornelius, J. The effectiveness of plus-tree selection for yield. For. Ecol. Manag. 1994, 67, 23–34. [Google Scholar] [CrossRef]
  15. Xu, Y.B.; Crouch, J.H. Marker-assisted selection in plant breeding: From publications to practice. Crop. Sci 2008, 48, 391–407. [Google Scholar] [CrossRef] [Green Version]
  16. Vendrame, W.A.; Holliday, C.P.; Merkle, S.A. Clonal propagation of hybrid sweetgum (Liquidambar styraciflua × L. formosana) by somatic embryogenesis. Plant Cell Rep. 2001, 20, 691–695. [Google Scholar] [CrossRef]
  17. Bi, X.Q.; Jin, X.Z.; Li, H.J. Genetic diversity in the natural populations of Liquidambar fornosana revealed by ISSR molecular markers. Bull. Bot. Res. 2010, 30, 120–125. [Google Scholar]
  18. Sun, R.; Lin, F.; Huang, P.; Zheng, Y. Moderate Genetic Diversity and Genetic Differentiation in the Relict Tree Liquidambar formosana Hance Revealed by Genic Simple Sequence Repeat Markers. Front. Plant Sci. 2016, 7, 1411. [Google Scholar] [CrossRef] [Green Version]
  19. Yin-Gang, L.I.; Zhou, X.P.; Liu, X.H.; Hua, Z.H.; Liu, W.; Liu, J.L.; Xie, J.Q. Preliminary Study on Growth of Styrax tonkinensis Plantation and Plus Tree Seletion. J. Zhejiang For. Sci. Technol. 2010, 30, 24–28. [Google Scholar]
  20. Kuang, H.; Richardson, T.; Carson, S.; Wilcox, P.; Bongarten, B. Genetic analysis of inbreeding depression in plus tree 850.55 of Pinus radiata D. Don. I. Genetic map with distorted markers. Theor. Appl. Genet. 1999, 98, 697–703. [Google Scholar] [CrossRef]
  21. Li, D.; Deng, Z.; Qin, B.; Liu, X.; Men, Z. De novoassembly and characterization of bark transcriptome using Illumina sequencing and development of EST-SSR markers in rubber tree (Hevea brasiliensis Muell. Arg.). BMC Genom. 2012, 13, 192. [Google Scholar] [CrossRef] [PubMed] [Green Version]
  22. Colburn, B.C.; Mehlenbacher, S.A.; Sathuvalli, V.R. Development and mapping of microsatellite markers from transcriptome sequences of European hazelnut (Corylus avellana L.) and use for germplasm characterization. Mol. Breed. 2017, 37, 16. [Google Scholar] [CrossRef]
  23. Aggarwal, R.K.; Hendre, P.S.; Varshney, R.K.; Bhat, P.R.; Krishnakumar, V.; Singh, L. Identification, characterization and utilization of EST-derived genic microsatellite markers for genome analyses of coffee and related species. Theor. Appl. Genet. 2007, 114, 359–372. [Google Scholar] [CrossRef] [PubMed] [Green Version]
  24. Zalapa, J.E.; Cuevas, H.; Zhu, H.; Steffan, S.; Senalik, D.; Zeldin, E.; McCown, B.; Harbut, R.; Simon, P. Using next-generation sequencing approaches to isolate simple sequence repeat (SSR) loci in the plant sciences. Am. J. Bot. 2012, 99, 193–208. [Google Scholar] [CrossRef] [Green Version]
  25. Wei, W.; Wang, C.B.; Fang, L.; Chen, H.D.; Lin, W.; Wang, C.Y.; Zhang, X.D.; Wang, Y.H.; Kun-Bo, A.W. Development and Evaluation of New Non-Redundant EST-SSR Markers from Gossypium. Acta Agron. Sin. 2012, 38, 1443–1451. [Google Scholar]
  26. Xu, S.C.; Gong, Y.-M.; Mao, W.-H.; Hu, Q.-Z.; Zhang, G.-W.; Fu, W.; Xian, Q.-Q. Development and characterization of 41 novel EST-SSR markers for Pisum sativum (Leguminosae). Am. J. Bot. 2012, 99, e149–e153. [Google Scholar] [CrossRef]
  27. Yadong, Z.; Hu, X.; Zhang, Y.D.; Song, C.; Hu, Y.X.; Song, C.W. Identification of Populus Varieties from Hubei Province by EST-SSR Marker. Mol. Plant. Breed. 2009, 7, 105–109. [Google Scholar]
  28. Zhang, Y.; Wang, Z.W.; Qi, S.Z.; Wang, X.Q.; Zhao, J.; Zhang, J.F.; Li, B.l.; Zhang, Y.D.; Liu, X.Z.; Yuan, W. In vitro tetraploid induction from leaf and petiole explants of hybrid sweetgum (Liquidambar styraciflua × Liquidambar formosana). Forests 2017, 8, 264. [Google Scholar] [CrossRef] [Green Version]
  29. Grabherr, M.G.; Haas, B.J.; Yassour, M.; Levin, J.Z.; Thompson, D.A.; Amit, I.; Adiconis, X.; Fan, L.; Raychowdhury, R.; Zeng, Q. Full-length transcriptome assembly from RNA-Seq data without a reference genome. Nat. Biotechnol. 2011, 29, 644–652. Available online: https://www.ncbi.nlm.nih.gov/ (accessed on 27 April 2017). [CrossRef] [Green Version]
  30. Rozen, S.; Skaletsky, H. Primer3 on the WWW for general users and for biologist programmers. Methods Mol. Biol. 2000, 132, 365–386. [Google Scholar]
  31. Doyle, J.J.; Doyle, J.L. A rapid DNA isolation procedure for small quantities of fresh leaf tissue. Phytochem. Bull. 1987, 19, 11–15. [Google Scholar]
  32. Schuelke, M. An economic method for the fluorescent labeling of PCR fragments. Nat. Biotechnol. 2000, 18, 233–234. [Google Scholar] [CrossRef] [PubMed]
  33. Jeffrey, C. Glaubitz convert: A user-friendly program to reformat diploid genotypic data for commonly used population genetic software packages. Mol. Ecol. Resour. 2004, 4, 309–310. [Google Scholar]
  34. Popgene. Version 1.32. The User-Friendly Shareware for Population Genetic Analysismolecular Biology and Biotechnology Center, University of AlbertaEdmonton. Available online: http://www.ualberta.ca/~{}fyeh (accessed on 23 November 2017).
  35. Nagy, S.; Poczai, P.; Cernák, I.; Taller, J. PICcalc: An Online Program to Calculate Polymorphic Information Content for Molecular Genetic Studies. Biochem. Genet. 2012, 50, 670–672. [Google Scholar] [CrossRef] [PubMed] [Green Version]
  36. Evanno, G.; Regnaut, S.; Goudet, J. Detecting the number of clusters of individuals using the software structure: A simulation study. Mol. Ecol. 2005, 14, 2611–2620. [Google Scholar] [CrossRef] [PubMed] [Green Version]
  37. Liu, K.; Muse, S.V. PowerMarker: an integrated analysis environment for genetic marker analysis. Bioinformatics 2005, 21, 2128–2129. [Google Scholar] [CrossRef] [Green Version]
  38. Peakall, R.; Smouse, P.E. genalex 6: genetic analysis in Excel. Population genetic software for teaching and research. Mol. Ecol. Notes 2005, 6, 288–295. [Google Scholar] [CrossRef]
  39. Xu, W.; Yang, Q.; Huai, H.; Liu, A. Development of EST-SSR markers and investigation of genetic relatedness in tung tree. Tree Genet. Genomes 2012, 8, 933–940. [Google Scholar] [CrossRef]
  40. Wu, H.; Chen, D.; Li, J.; Yu, B.; Qiao, X. De Novo Characterization of Leaf Transcriptome Using 454 Sequencing and Development of EST-SSR Markers in Tea (Camellia sinensis). Plant. Mol. Biol. Rep. 2013, 31, 524–538. [Google Scholar] [CrossRef]
  41. Xiang, X.; Zhang, Z.; Wang, Z.; Zhang, X.; Wu, G. Transcriptome sequencing and development of EST-SSR markers in Pinus dabeshanensis, an endangered conifer endemic to China. Mol. Breed. 2015, 35, 158. [Google Scholar] [CrossRef]
  42. Dong, M.; Wang, Z.; He, Q.; Zhao, J.; Fan, Z.; Zhang, J. Development of EST-SSR markers in Larix principis-rupprechtii Mayr and evaluation of their polymorphism and cross-species amplification. Trees 2018, 32, 1559–1571. [Google Scholar] [CrossRef]
  43. Dong, L.; Sun, Y.H.; Zhao, J.; Zhang, Y.W.; Li, X.Y. Development and Application of EST-SSR Markers for DNA Fingerprinting and Genetic Diversity Analysis of the Main Cultivars of Black Locust (Robinia pseudoacacia L.) in China. Forests 2019, 10, 644. [Google Scholar] [CrossRef] [Green Version]
  44. Du, Q.; Wang, B.; Wei, Z.; Zhang, D.; Li, B. Genetic Diversity and Population Structure of Chinese White Poplar (Populus tomentosa) Revealed by SSR Markers. J. Hered. 2012, 103, 853–862. [Google Scholar] [CrossRef] [PubMed] [Green Version]
  45. Nirapathpongporn, K.; Kongsawadworakul, P.; Viboonjun, U.; Teerawattanasuk, K.; Chrestin, H.; Segiun, M.; Clément-Dement, A.; Narangajavana, J. Development and mapping of functional expressed sequence tag-derived simple sequence repeat markers in a rubber tree RRIM600 × PB217 population. Mol. Breed. 2016, 36, 39. [Google Scholar] [CrossRef]
  46. Ge, Y.; Tan, L.; Wu, B.; Wang, T. Transcriptome Sequencing of Different Avocado Ecotypes: de novo Transcriptome Assembly, Annotation, Identification and Validation of EST-SSR Markers. Forests 2019, 10, 411. [Google Scholar] [CrossRef] [Green Version]
  47. Liu, F.M.; Hong, Z.; Yang, Z.J.; Zhang, N.N. De Novo Transcriptome Analysis of Dalbergia odorifera T. Chen (Fabaceae) and Transferability of SSR Markers Developed from the Transcriptome. Forests 2019, 10, 99. [Google Scholar]
  48. Guo, Q.; Wang, J.-X.; Su, L.-Z.; Lv, W.; Sun, Y.-H.; Li, Y. Development and evaluation of a novel set of EST-SSR markers based on transcriptome sequences of Black Locust (Robinia pseudoacacia L.). Genes 2017, 8, 177. [Google Scholar] [CrossRef] [Green Version]
  49. Cheng, Y.L.; Yang, Y.; Wang, Z.Y.; Qi, B.Y.; Yin, Y.L.; Li, H.G. Development and Characterization of EST-SSR Markers in Taxodium ‘zhongshansa’. Plant. Mol. Biol. Rep. 2015, 33, 1–11. [Google Scholar] [CrossRef]
  50. Jia, X.; Deng, Y.; Sun, X.; Liang, L.; Su, J. De novo assembly of the transcriptome of Neottopteris nidus using Illumina paired-end sequencing and development of EST-SSR markers. Mol. Breed. 2016, 36, 94. [Google Scholar] [CrossRef]
  51. Chen, L.Y.; Cao, Y.N.; Yuan, N.; Koh, N.; Wang, G.M.; Qiu, Y.X. Characterization of transcriptome and development of novel EST-SSR makers based on next-generation sequencing technology in Neolitsea sericea (Lauraceae) endemic to East Asian land-bridge islands. Mol. Breed. 2015, 35, 187. [Google Scholar] [CrossRef]
  52. Postolache, D.; Leonarduzzi, C.; Piotti, A.; Spanu, I.; Vendramin, G.G. Transcriptome versus Genomic Microsatellite Markers: Highly Informative Multiplexes for Genotyping Abies alba Mill. and Congeneric Species. Plant. Mol. Biol. Rep. 2013, 32. [Google Scholar] [CrossRef]
  53. Botstein, D.; White, R.L.; Skolnick, M.; Davis, R.W. Construction of a genetic linkage map in man using restriction fragment length polymorphisms. Am. J. Hum. Genet. 1980, 32, 314–331. [Google Scholar] [PubMed]
  54. Liu, S.; Liu, H.; Wu, A.; Hou, Y.; An, Y.; Wei, C. Construction of fingerprinting for tea plant (Camellia sinensis) accessions using new genomic SSR markers. Mol. Breed. 2017, 37, 93. [Google Scholar] [CrossRef]
  55. Durand, J.; Bodénès, C.; Chancerel, E.; Frigerio, J.-M.; Vendramin, G.; Sebastiani, F.; Buonamici, A.; Gailing, O.; Koelewijn, H.-P.; Villani, F.; et al. A fast and cost-effective approach to develop and map EST-SSR markers: oak as a case study. BMC Genom. 2010, 11, 570. [Google Scholar] [CrossRef] [PubMed] [Green Version]
  56. Wen, M.; Wang, H.; Xia, Z.; Zou, M.; Lu, C.; Wang, W. Developmenrt of EST-SSR and genomic-SSR markers to assess genetic diversity in Jatropha Curcas L. BMC Res. Notes 2010, 3, 42. [Google Scholar] [CrossRef] [PubMed] [Green Version]
  57. Merkle, S.; Montello, P.; Kormanik, T.; Le, H. Propagation of novel hybrid sweetgum phenotypes for ornamental use via somatic embryogenesis. Propag. Ornam. Plant. 2010, 10, 220–226. [Google Scholar]
Figure 1. Frequency distribution of different SSR (simple sequence repeat) motifs of the specific SSR repeat motifs in the transcriptome of L. formosana.
Forests 11 00203 g001aForests 11 00203 g001b
Figure 2. The polymorphisms amplified by primer pair Liq_eSSR10 (blue), Liq_eSSR17 (green) and Liq_eSSR59 (red) in L. formosana samples.
Forests 11 00203 g002
Figure 3. Results of STRUCTURE analysis for 72 Liquidambar individuals based on 20 EST-SSR markers. (a) Estimation of population using log probability of data-derived delta K with cluster number (K) ranged from one to eight. (b) The 72 individuals are separated into two main gene pools (K = 2), Proportion of green (L. styraciflua) in the hybrid sweetgum was much higher than that of red (L. formosana), the hybrid was grouped with L. styraciflua.
Forests 11 00203 g003
Figure 4. Genetic relationship among 72 individuals of three species Liquidambar based on 20 EST-SSR markers using neighbour-joining clustering. The 72 individuals were divided into three clusters, which are depicted with green (L. formosana), blue (hybrid sweetgum), and red (L. styraciflua) solid, respectively. The details for 72 individuals can be obtained from Table S1.
Forests 11 00203 g004
Figure 5. Principal coordinate analysis (PCoA) of 72 individuals of three species Liquidambar based on 20 EST-SSR markers. The blue squares represent L. formosana, the green filled circles represent hybrid sweetgum and the red triangles represent L. styraciflua. The first two coordinates explain percentages of total variation for 41.22% and 15.63%, respectively.
Forests 11 00203 g005
Table 1. Character of Unigenes in L. formosana.
Sequence TypeTotal
Co-detected Unigenes Length (kbp)24,122
Average Length of Unigenes (bp)699
Number of SSR loci detected3284
Number of Unigenes Containing SSR Loci2949
Number of Unigenes with more than one locus298
Number of complex SSR loci109
Frequency of SSR loci1/7.3 kbp
Table 2. Frequency of different repeat motifs of SSRs in the transcriptome of L. formosana.
Repeat MotifRepeat NumberPercentage (%)
4567891011>11Total
Dinucleotide 344298209590144152.56
Trinucleotide 427234104804373292733.8
Tetranucleotide 471043 642.33
Pentanucleotid-e 209 290.88
Hexonucleotid-e2055711611 28110.58
Total2051244572441084253412166222742100
Percentage (%)7.484.5216.678.93.9415.512.447.8822.6810052.56
Table 3. Information on the 32 polymorphic SSR (simlpe sequence repeat) markers developed for L. formosana.
CodeLocusPrimer SequenceRepeat MotifTm (°C)Product Size (bp)Dye
1Liq_eSSR1F: TGTAAAACGACGGCCAGTCATCATCAGACACGGTTTGG(TTAGGG)460217HEX
R:GTCCAGCTCCGTACATCCAT
2Liq_eSSR2F: TGTAAAACGACGGCCAGTATGGGGACGATGACTGTGTT(ACGGCA)460200ROX
R: CGTTGCAAATCTCATTGACG
3Liq_eSSR4F: TGTAAAACGACGGCCAGTAGTGGTTGTTGCTGCTGTTG(CTGGTG)760206FAM
R: CTTATGCAGCCCCAAATGTT
4Liq_eSSR7 1F: TGTAAAACGACGGCCAGTCAAGTAGTCCAGGGCGTCTC(CTCTTC)460192ROX
R: CCTAACGAGAAGGGAGGCTT
5Liq_eSSR10 1F: TGTAAAACGACGGCCAGTAGACCACATGCTCGTTACCC(CTAGCA)560142FAM
R: TGCTGGAACTGGTGCTAGTG
6Liq_eSSR13F: TGTAAAACGACGGCCAGTTCTGGGTCAGGTTCAGGTTC(GGTTCA)46024TAMRA
R: GCCATATCCCTCACCATGTC
7Liq_eSSR16F: TGTAAAACGACGGCCAGTTGGCAGATCTAGGGGATTTG(GAGGTG)460203FAM
R: AACCTCCATCTCCACGATTG
8Liq_eSSR17 1F: TGTAAAACGACGGCCAGTAGAGGTGAATGGGACACCAG(GGATGA)460206HEX
R: CTGCCAACCTGGGAATAGAA
9Liq_eSSR25 1F: TGTAAAACGACGGCCAGTTCAACTTGATGGGGTCAGTG(TATG)660194ROX
R: GACTGCCCGTACCCAGAATA
10Liq_eSSR28F: TGTAAAACGACGGCCAGTACATCAGAAGGAGCCGAAGA(GGT)660175HEX
R: CGGATTGGCAAGAGAAGAAG
11Liq_eSSR30 1F: TGTAAAACGACGGCCAGTAGGCAGGGTTAGTCCCTTGT(CTG)660224ROX
R: GCTTGCGGACTTGTTTTCTC
12Liq_eSSR33 1F: TGTAAAACGACGGCCAGTGAGGGAGATTCACCACAGGA(GCA)860212HEX
R: TCATCATCAAGTCCGCCATA
13Liq_eSSR34 1F: TGTAAAACGACGGCCAGTGCTGCCTCCAAAGAAGTGTC(GCT)760199ROX
R: AGGGCTCCTCAGCTAGTTCC
14Liq_eSSR35 1F: TGTAAAACGACGGCCAGTTTACCACCGTCGTCGTCAT(TCC)860165FAM
R: GAACCAAGAGAAGCACCAGC
15Liq_eSSR42F: TGTAAAACGACGGCCAGTCACATCGGAAGCTCCTTCTC(TC)1060201HEX
R: GCGACCCACAATACTAGGGA
16Liq_eSSR43F: TGTAAAACGACGGCCAGTCCAAAGCTTCCTCCTCCTCT(CT)126024ROX
R: ACATTTCTTCCGCATTGACC
17Liq_eSSR44F: TGTAAAACGACGGCCAGTCTTGGAATCACCTTCGCATT(CA)960198FAM
R: CGATCGAATTGTAAAGCGGT
18Liq_eSSR46F: TGTAAAACGACGGCCAGTTCTCCATGGTCCTTTCTTGG(AGAGA)660162ROX
R: CCAAACAGGGTGGAGAGAAA
19Liq_eSSR48F: TGTAAAACGACGGCCAGTTCGATGATGAGAACACTGGAA(GATTT)660163FAM
R: ATCCGATAATAACGTCCCCC
20Liq_eSSR51F: TGTAAAACGACGGCCAGTGAGAATGGCAGAGGAAGCAC(TGT)960197ROX
R: AAGCCATGAAGAGAAGGCAA
21Liq_eSSR55 1F: TGTAAAACGACGGCCAGTCCTTCTTTGGATCTCCACCA(CTC)860194ROX
R: TTGCACTTTGACTGAGACCG
22Liq_eSSR59 1F: TGTAAAACGACGGCCAGTCAAACGAAAGATGAGCGACA(CAA)660201ROX
R: CCGTTTTCATGGACCACTCT
23Liq_eSSR60 1F: TGTAAAACGACGGCCAGTGAGACCTGGTTGGACTTGGA(GGA)660216HEX
R: CGGAGAATGACCGGTCTAAA
24Liq_eSSR62 1F: TGTAAAACGACGGCCAGTCCTCGAACTGTTTCTCCAGC(AGG)660202FAM
R: CGCTCCTTAAACCCTAACCC
25Liq_eSSR64F: TGTAAAACGACGGCCAGTCGGTACATGTGATCAGCCAC(GAA)760169ROX
R: CTTCTGCTTCTCCAAATGGC
26Liq_eSSR67 1F: TGTAAAACGACGGCCAGTCCAAGGAGAGAGTGACGAGG(CCT)860273ROX
R: ATTGATTTTTGCGGACTTGG
27Liq_eSSR70F: TGTAAAACGACGGCCAGTTGGGGGAATGAGAGTTTGAC(GTG)760174HEX
R: ATCTCAGTGGGCTCTCCTCA
28Liq_eSSR86 1F: TGTAAAACGACGGCCAGTCTGAAAATAAGGCGGGTGAA(TC)960172HEX
R: GTCTGGGTCATCTTCGTCGT
29Liq_eSSR89F: TGTAAAACGACGGCCAGTATCGTCCAGGCTTATCATCG(GTT)7gatc(GGCTGT)560201FAM
R: GCCTCTGCTGACACTGACAA
30Liq_eSSR90 1F: TGTAAAACGACGGCCAGTCCATTGTTCCCCCTACCTCT(ACC)6acttctcctatcagcaaagccaccgcg(ACC)760196ROX
R: TGCAAGAACGAGAGCAGAGA
31Liq_eSSR92F: TGTAAAACGACGGCCAGTAGAGGACACCCAAGGGAACT(CCCTTG)4gagagagaaagcgatag(GT)11atagcgagagagaa(AG)960181HEX
R: CCATTGTTCCCCCTACCTCT(ACC)6acttctcctatcagcaaagccaccgcg(ACC)760
32Liq_eSSR98 1F: TGTAAAACGACGGCCAGTTCCCAATCTCAATCTCGACC(CCTCAA)460220ROX
R: CCTCCGTAATCCGAAGAACA
1 EST-SSR markers were selected for the analysis of genetic diversity and cross-species transferability.
Table 4. Diversity information parameters for 20 SSR loci in 53 individuals of L. formosana.
Locus Na 1Ne 2Ho 3He 4I5PIC 6HW 7
Liq_eSSR35138.8720.9780.8872.3170.877*
Liq_eSSR86105.250.9250.811.8820.785ns
Liq_eSSR6774.860.9060.7941.7120.765ns
Liq_eSSR9073.9590.6980.7471.5650.71*
Liq_eSSR9863.8220.7360.7381.4690.694ns
Liq_eSSR2563.4510.4910.711.4590.671*
Liq_eSSR1053.2160.7360.6891.30.632ns
Liq_eSSR3072.8140.7110.6451.3390.608ns
LF39 862.6810.5770.6271.3370.599ns
LF17 842.8250.7740.6461.0970.572ns
Liq_eSSR3342.6880.9620.6281.1330.568***
Liq_eSSR6252.6360.6420.6211.1370.558ns
LF37 862.4520.6040.5921.1490.545ns
Liq_eSSR6042.4650.5470.5941.0940.543ns
Liq_eSSR5932.4850.640.5980.9980.528ns
LF15 852.0160.5660.50410.47ns
Liq_eSSR1732.1580.6790.5370.8830.458ns
Liq_eSSR5571.6830.4570.4060.9110.388ns
Liq_eSSR741.7510.1880.4290.7550.372*
Liq_eSSR3431.2860.2450.2220.4540.211ns
Mean5.753.1690.6530.6211.250.578ns
1 Observed number of alleles, 2 effective number of alleles, 3 observed heterozygosity, 4 expected heterozygosity, 5 Shannon’s information index, 6 PIC polymorphism information content, 7 Chi-squared tests for Hardy–Weinberg equilibrium, ns not significant, * p < 0.05, ** p < 0.01, *** p < 0.001, 8 EST-SSR markers were selected from previous study [6].
Table 5. Cross-species amplification of 20 SSR loci in other Liquidambar species as demonstrated by two genetic diversity indices (Na and PIC).
Locushybrid SweetgumL. styraciflua
PIC 1Na 2Transferab-ility 3PIC 1Na 2Transferab-ility 3
LF150.5774++0.0001+
LF170.4924++0.4763++
LF190.5524++0.3462++
LF370.4193++0.2402++
Liq_eSSR 7-00.0001+
Liq_eSSR 10 40.5194++0.2402++
Liq_eSSR 170.3352++0.0001+
Liq_eSSR 25 40.6404++0.5363++
Liq_eSSR 30 40.5803++0.3462++
Liq_eSSR 330.4964++0.0001+
Liq_eSSR 34 40.6664++0.4763++
Liq_eSSR 35 40.4454++0.6204++
Liq_eSSR 55 40.5584++0.4603++
Liq_eSSR 590.2054++0.0001+
Liq_eSSR 60 40.6866++0.6435++
Liq_eSSR 62 40.5754++0.3462++
Liq_eSSR 67 40.5553++0.2402++
Liq_eSSR 86 40.6455++0.3934++
Liq_eSSR 90 40.7466++0.6435++
Liq_eSSR 98 40.4173++0.4764++
Mean0.5053.72 0.3242.55
1 Observed numbers of alleles, 2 polymorphsim information content, 3 polymorphism was expressed as ++, monomorphism as +, and absence of primer amplification as −, 4 12 pairs of original EST-SSR markers with high level of polymorphism in two Liquidambar species.

