Article

Soil Element Stoichiometry Drives Bacterial Community Composition Following Thinning in A Larix Plantation in the Subalpine Regions of Northern China

Department of Forestry, Forestry College, Beijing Forestry University, Beijing 100083, China
*
Author to whom correspondence should be addressed.
Forests 2020, 11(3), 261; https://doi.org/10.3390/f11030261
Submission received: 10 January 2020 / Revised: 13 February 2020 / Accepted: 25 February 2020 / Published: 27 February 2020
(This article belongs to the Section Forest Ecology and Management)

Abstract

:
It is well established that forest thinning alters aboveground plant community composition and soil resource availability. However, how it regulates the composition and diversity of belowground microbial communities remains unclear. To quantify the effects of thinning on soil bacterial groups and the underlying mechanisms of these effects, this research was conducted in a Larix principis-rupprechtii Mayr. plantation with various thinning intensities, including a control (0% tree removal), a low-intensity treatment (15% tree removal), a medium-intensity treatment (35% tree removal), and a high-intensity treatment (50% tree removal). Compared to the control, the medium and high intensity thinning treatments significantly improved soil moisture, nutrient concentrations (including soil total carbon, nitrogen, phosphorus, and ammonium nitrogen), microbial biomass, and elemental stoichiometry ratios. The abundance and diversity of bacterial communities peaked in the medium-intensity treatment. Thinning also had strong effects on dominant bacterial groups at the phylum level. For instance, Bacteroidetes and Nitrospirae were significantly increased in the medium-intensity treatment (MIT), while the Gemmatimonadetes were significantly decreased in the low-intensity treatment (LIT). Combining Spearman correlation analysis and redundancy analysis demonstrated that thinning could facilitate the assembly of unique bacterial communities, and these shifts in microorganisms could probably be attributed to corresponding changes in soil resource stoichiometry. In conclusion, this study provides novel evidence that rational thinning could promote belowground bacterial community diversity and that elemental stoichiometry is an important indicator in shaping forest soil bacterial communities.

1. Introduction

Thinning, altering the density of trees in a forest, is a widely employed technique to increase plantation productivity and improve ecosystem functions [1,2]. It is well known that the aboveground vegetation community and tree production responds to thinning intensity [3,4]. For example, while the forest density is appropriately adjusted, gap size will be increased to alter the soil moisture, soil temperature, and light conditions, which can improve understory plant diversity and tree biomass [5,6,7]. However, there is currently no knowledge regarding the impacts of various thinning intensities on belowground microbe communities.
Owing to the intimate links between above- and belowground biological communities, there may be a coupled induction between them when responding to forest thinning practice [8]. Forest thinning directly affects light transmittance and soil hydrothermal conditions [9,10,11], and further alters microbial group diversity through effects on soil chemical element concentrations, moisture, temperature, and other soil microenvironmental factors [12,13,14]. Meanwhile, the regulation in forest density can greatly affect plant biodiversity and biomass [3,9]. The variation in vegetation community characteristics has been found to be closely interrelated to microbial biomass and diversity [15,16]. The adjustment of forest density may shape microbial community by regulating the resources available from aboveground (e.g., litter-fall, branches) and belowground (e.g., enzyme activity, root exudates, or substrate quantity) [17,18,19]. Overall, such forest management strategies can indirectly affect soil microorganism groups by altering ecological factors.
Elemental stoichiometry (this mainly refers to C:N:P), an indispensable tool to explore the nutrient balance and coupling relationships in ecosystems, is frequently used to connect vegetation characteristics and soil nutrient contents in forest ecosystems [20,21]. Previous studies have proved that the soil chemical element ratio is a powerful indicator that reflects the ecological dynamics and soil nutrient levels in forest ecosystems [22,23,24]. Therefore, evaluating the correlation between soil elemental stoichiometry and bacterial communities has received increased research attention.
L. principis-rupprechtii, a primary species used for afforestation in Northern China, is grown for wood production, soil water conservation, and ecological functional regulation [25,26]. However, due to the unsuitable plantation densities and the lack of management, soil fertility becomes seriously degraded, leading to an unhealthy forest with low efficiency and poor soil conditions. These ecological problems associated with degraded plantations have attracted the attention of the Chinese government and forestry researchers. Previous research on plantation thinning activities has concentrated on improving the soil physicochemical properties and the structure of the vegetation, as well as enhancing the quality of forest products [25,27,28]. Recent research is still limited on whether thinning could shape the microbial community via regulating soil element stoichiometry characteristics. Therefore, we hypothesized that the belowground bacterial community would significantly respond to thinning intensities as does the aboveground community due to the close links between them. Furthermore, the microbial biomass and diversity would not scale with thinning intensities but peak in an appropriate intensity because the intensity of thinning is effectually altering soil conditions and increases aboveground production. Moreover, we also expected that thinning induced variation in microbial abundance and community composition can be predicted by corresponding shifts in soil stoichiometry, since the direct effects of thinning on the spatial variation in litter and root exudates are the primary drivers of resource availability. Taken together, we expect that the current study can demonstrate that the soil bacterial community can be affected by thinning and has strong links to soil elemental stoichiometry. This research is expected to provide practical advice for the management of plantations.

2. Materials and Methods

2.1. Sampling Area

Our study was conducted on Taiyue Mountain, Shanxi Province, Northern China (111°59’–112°05’E, 36°40’–36°47’N). This region is located in the continental monsoon climate zone with a mean annual rainfall of 800 mm and an average annual temperature of 6.2 °C. The frost-free and sunshine periods range from 110–130 days and 2600–2800 h each year over Taiyue Mountain, respectively. The soil type within the study area is brown forest soil. Native plant species typical of the area include L. principis-rupprechtii Mayr, Pinus tabulaeformis Carrière, Betula platyphylla Sukaczev, Quercus wutaishanica Mayr, Rosa xanthine Lindl, Lespedeza bicolor Bunge, Spiraea salicifolia L, and Dendranthema chanetii Stapf.

2.2. Experimental Design and Soil Sampling

In 1982, three-year-old L. principis-rupprechtii seedlings were planted at a density of 3000 trees hm−2. Seedlings were planted along contour lines in the mountainous areas of the bush vegetation. In 2010, the L. principis-rupprechtii plantation was thinned and maintained at 2160 trees hm−2. In April 2012, twelve plots (25 × 25 m) were established for the application of second thinning management treatments. There were four specified thinning densities: a control with approximately 2096 trees ha−1 (CK (the control), no tree removal); a low intensity thinning treatment with approximately 1850 trees per hectare (LIT (low-intensity thinning), 15% tree removal); a medium intensity thinning treatment with approximately 1415 trees ha−1 (MIT (medium-intensity thinning), 35% tree removal); and a high intensity thinning treatment approximately 1087 trees ha−1 (HIT (high-intensity thinning treatments), 50% tree removal). Each treatment was replicated three times. To avoid potential edge effects, 12 plots were separated by several buffer zones (more than 10 m). In July 2016, the characteristics of the twelve plots were reassessed, including the elevation, slope, plantation density, etc. Detailed information on the different thinning treatments is provided in Table 1.
For each plot, ten topsoil samples (0–10 cm) were collected in an “S” shape using a soil auger (5 cm in diameter) after the removal of the surface litter layer. Samples from the same plot were combined into a plastic bag and were mixed well. Overall, twelve mixed samples (four thinning treatments × three plots) were collected. All the samples were immediately transported to the laboratory on ice and sieved with a 2 mm mesh to remove visible root material and debris. After determining the soil moisture content (SMC), a portion of the soil sample was stored at −80 °C for DNA extraction. Another portion of the soil sample was stored at 0 °C for the determination of the microbial biomass, ammonium nitrogen (NH4+–N) concentration, and nitrate nitrogen (NO3–N) concentration. The remaining soil samples were air-dried and stored at room temperature in preparation for the analysis of their physicochemical properties.

2.3. Analysis of Soil Physicochemical Properties

The soil bulk density was measured using the metal ring method [29]. The soil pH was obtained using a pH meter (Five Easy, Mettler - Toledo, Switzerland) after shaking the soil in suspension with water (1:5 w/v) for 30 minutes [29]. The soil water content was calculated as gravimetric loss after oven drying at 105 °C [12]. Soil total carbon (STC) and total nitrogen (STN) were measured using an elemental analyzer (FLASH2000 CHNS/O, Thermo, Third Avenue Waltham, MA, America). Soil microbial biomass (C, N, P) was estimated from fresh soil samples using a previously described chloroform fumigation-extraction method [29,30,31]. Soil total phosphorus (STP), nitrate nitrogen (NO3-N), ammonium nitrogen (NH4+-N), and soil available phosphorus (SAP) were measured on an AA3 continuous flow analytical system (AA3, SEAL Analytical GmbH, Germany) after the pretreatment of the samples [29].

2.4. DNA Extraction and PCR Amplification

Bacterial DNA was extracted from the soil samples using a method described by Caporaso et al. (2012) [32]. The V4 hypervariable region of the 16S rRNA gene was amplified with the primers 515F: 5′-GTGCCAGCMGCCGCGGTAA-3′ and 806R: 5′-GGACTACHVGGGTWTCTAAT-3′ to ensure experimental efficiency and accuracy. The PCR conditions and other experimental procedures were described in detail in Li et al. (2016) [33].

2.5. Sequence Data Processing

High-throughput sequencing of the 16S rRNA tag-encoded gene was performed on the Illumina MiSeq platform at Novogene (Beijing, China). The Quantitative Insights Into Microbial Ecology (QIIME) Pipeline was used to filter the raw reads. A Uchime algorithm was used to obtain the effective tags [34]. Operational taxonomic units (OTUs) were classified at the threshold of 97% identity [35]. Alpha diversity refers to the average species diversity of the microbial community in a specific area. The Shannon index and Simpson index were calculated to compare bacterial OTU diversity among samples.

2.6. Statistical Analysis

The QIIME was used to calculate the Shannon and Simpson diversity indexes [33]. The influence of short-term thinning on soil pH, water content, soil, microbial biomass C, N, and P concentrations, and bacterial abundance were assessed through a least significant difference multiple comparison test [9]. The variation trend of soil stoichiometry and bacterial diversity characteristics were graphed by Sigmaplot (version 12.5, Systat Software Inc., California, USA). The top ten most abundant bacterial phyla were identified in each plot, while unassigned and less abundant OTUs were placed in the “other” category; a column plot was then created to illustrate the relative abundance of the OTUs. Non-metric multidimensional scaling (NMDS) was applied to explore bacterial community similarities among soil samples. The correlation between soil bacterial phyla and element concentrations and stoichiometry were quantified with a redundancy analysis (RDA), which was conducted in CANOCO 4.5 software (Wageningen University and Research Centre, Wageningen, the Netherlands). In addition, the correlation between soil bacterial abundance and diversity characteristics was shown through the Spearman correlation coefficient.

3. Results

3.1. The Response of Soil Properties to Thinning

Soil nutrient properties at the depth of 0-10 cm varied four years after thinning treatments (Table 1). Soil pH was higher in CK than in the thinning treatments, and SAP peaked in the medium thinning treatment, however, differences among treatments were not significant. Compared to the control treatment, the SWC was also 40% higher in MIT and the NO3-N content was 21%–52% higher in all the thinning treatments (LIT, MIT, HIT). A significant increase in NH4+-N content and SWC were observed following thinning. The observed number of bacterial OTUs (Sobs) raised in the order of CK, LIT, HIT, and MIT (Table 1).

3.2. Variation of Soil and Microbial Biomass Element Contents and Stoichiometry to Thinning

As demonstrated in Table 2, compared to the CK treatment, STC, STN, and STP concentrations were higher in the thinning treatments (LIT, MIT, HIT). Thinning activities significantly increased the element content in the soil microbial biomass, with the highest value recorded in MIT. The C:N, C:P, and N:P, ratios of soil and microbial biomass samples in surface soil changed after thinning treatments as well (Figure 1). Similarly, thinning significantly increased the soil C:N ratio (Figure 1). A similar difference was found in the soil microbial biomass C:N, which was 0.15 ± 0.08 higher in the thinning treatment than CK. The soil C:P ratio was 14.44 ± 1.06, 24.20±4.67, and 9.52 ± 2.69 significantly higher in LIT, MIT, and HIT, respectively, versus the control. However, the microbial biomass C:P ratio only significantly differed between MIT and CK. Moreover, the soil N:P ratio was 0.72 ± 0.39, 1.06 ± 0.28, and 0.54 ± 0.31 higher in LIT, MIT, and HIT, respectively, versus the control. However, no differences in the microbial biomass N:P ratio were found among the thinning treatments.

3.3. Bacterial Diversity and Composition Characteristics

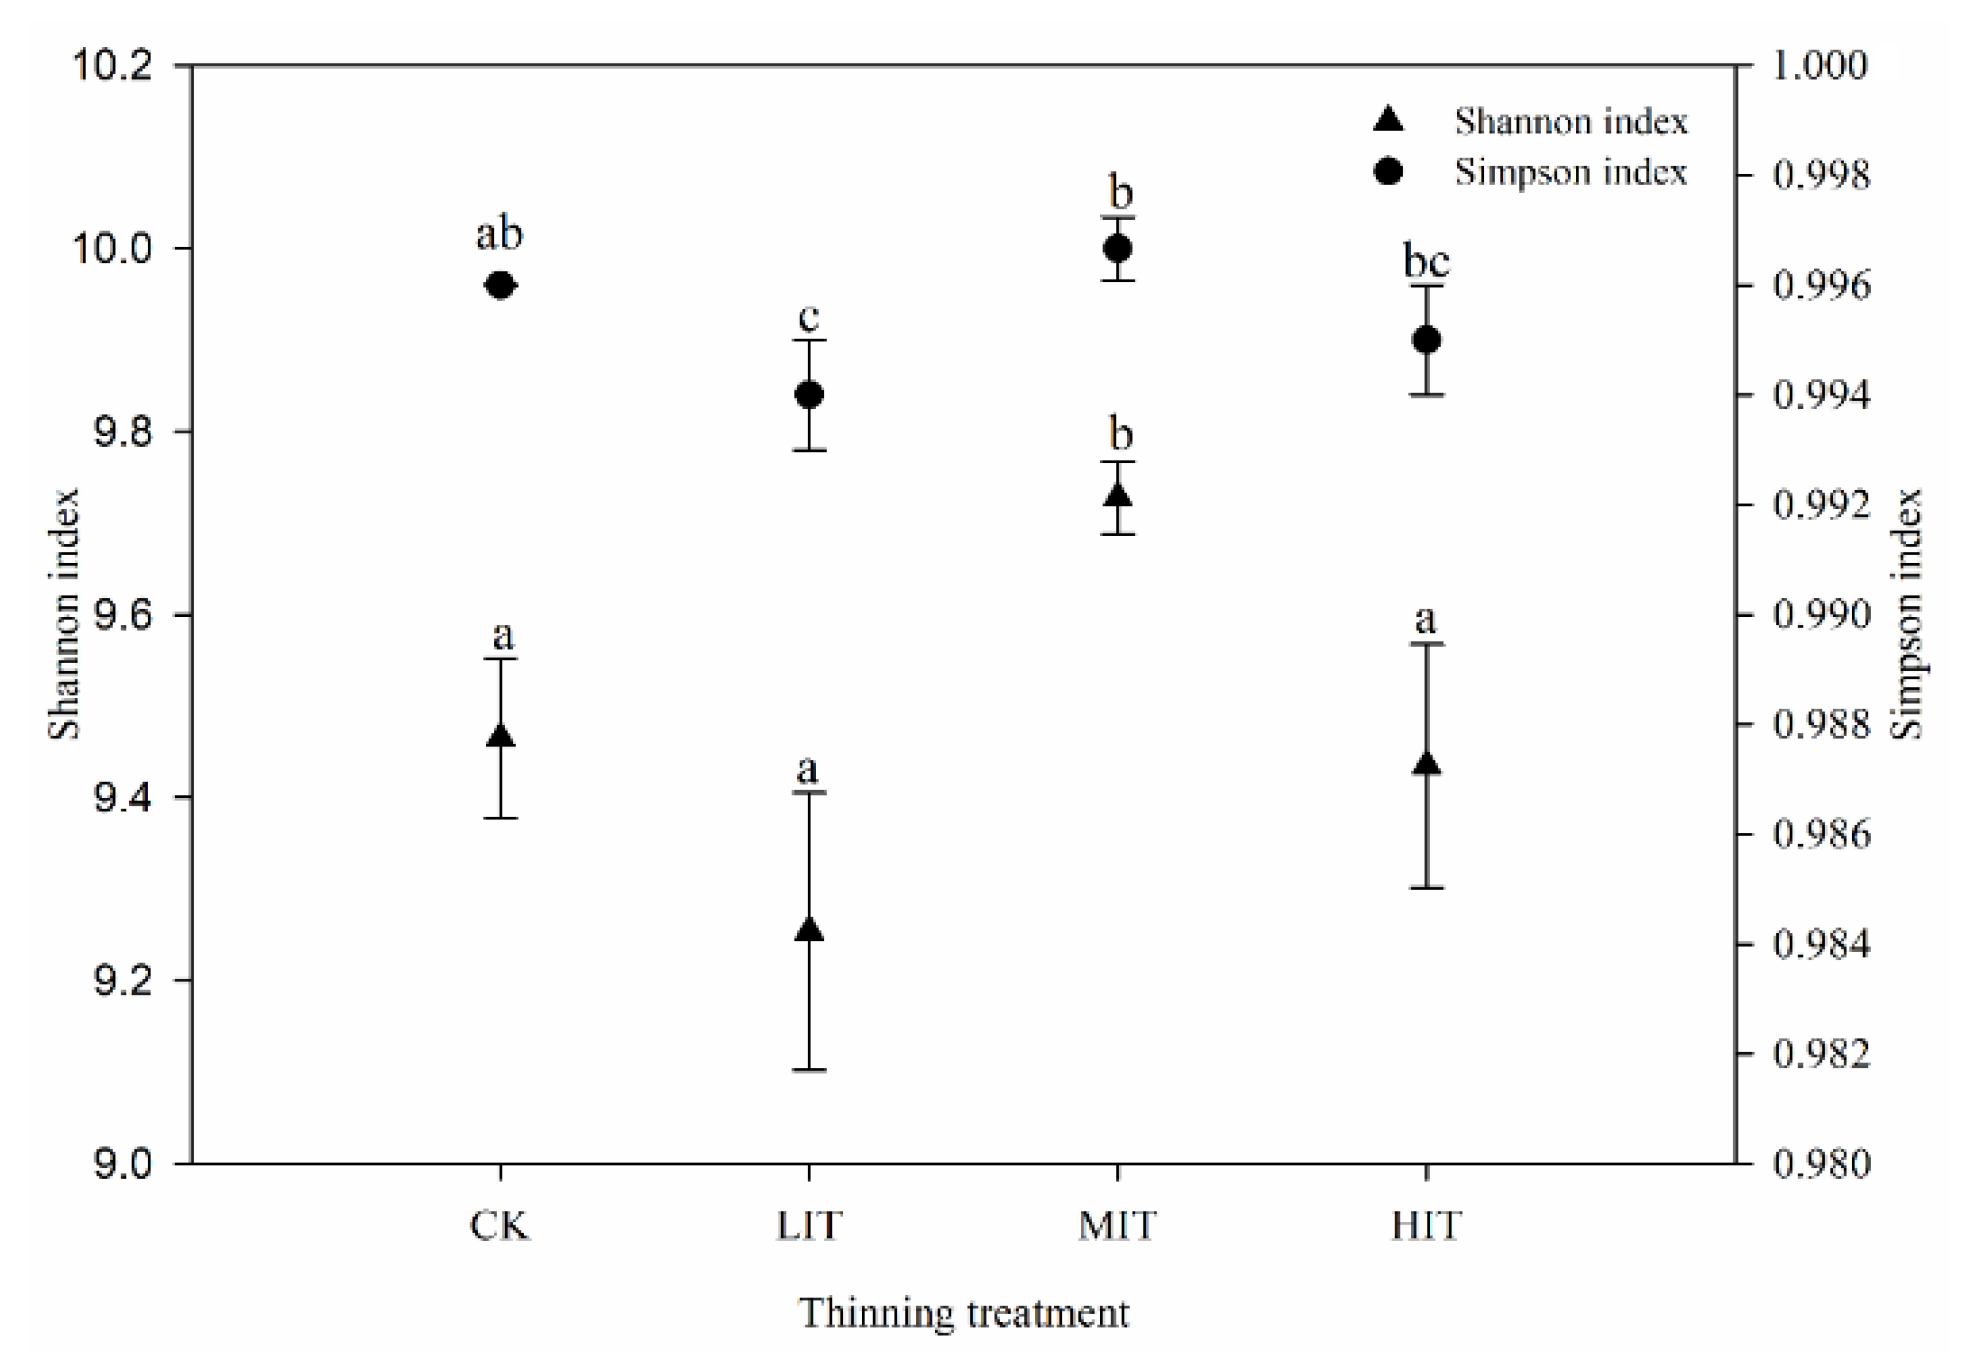
The bacterial alpha diversity (Shannon and Simpson indexes) was calculated at the OTU-level. The Shannon index averaged 9.25, 9.73, and 9.44 for LIT, MIT, and HIT, respectively, and only MIT was significantly higher than CK (9.47 ± 0.09) (Figure 2). A similar trend was found for the Simpson index, which averaged 9.94 × 10⁻³ in LIT and 9.95 × 10⁻³ in HIT lower than CK (9.96 × 10⁻³), while MIT (9.97 × 10⁻³) was significantly higher than CK.
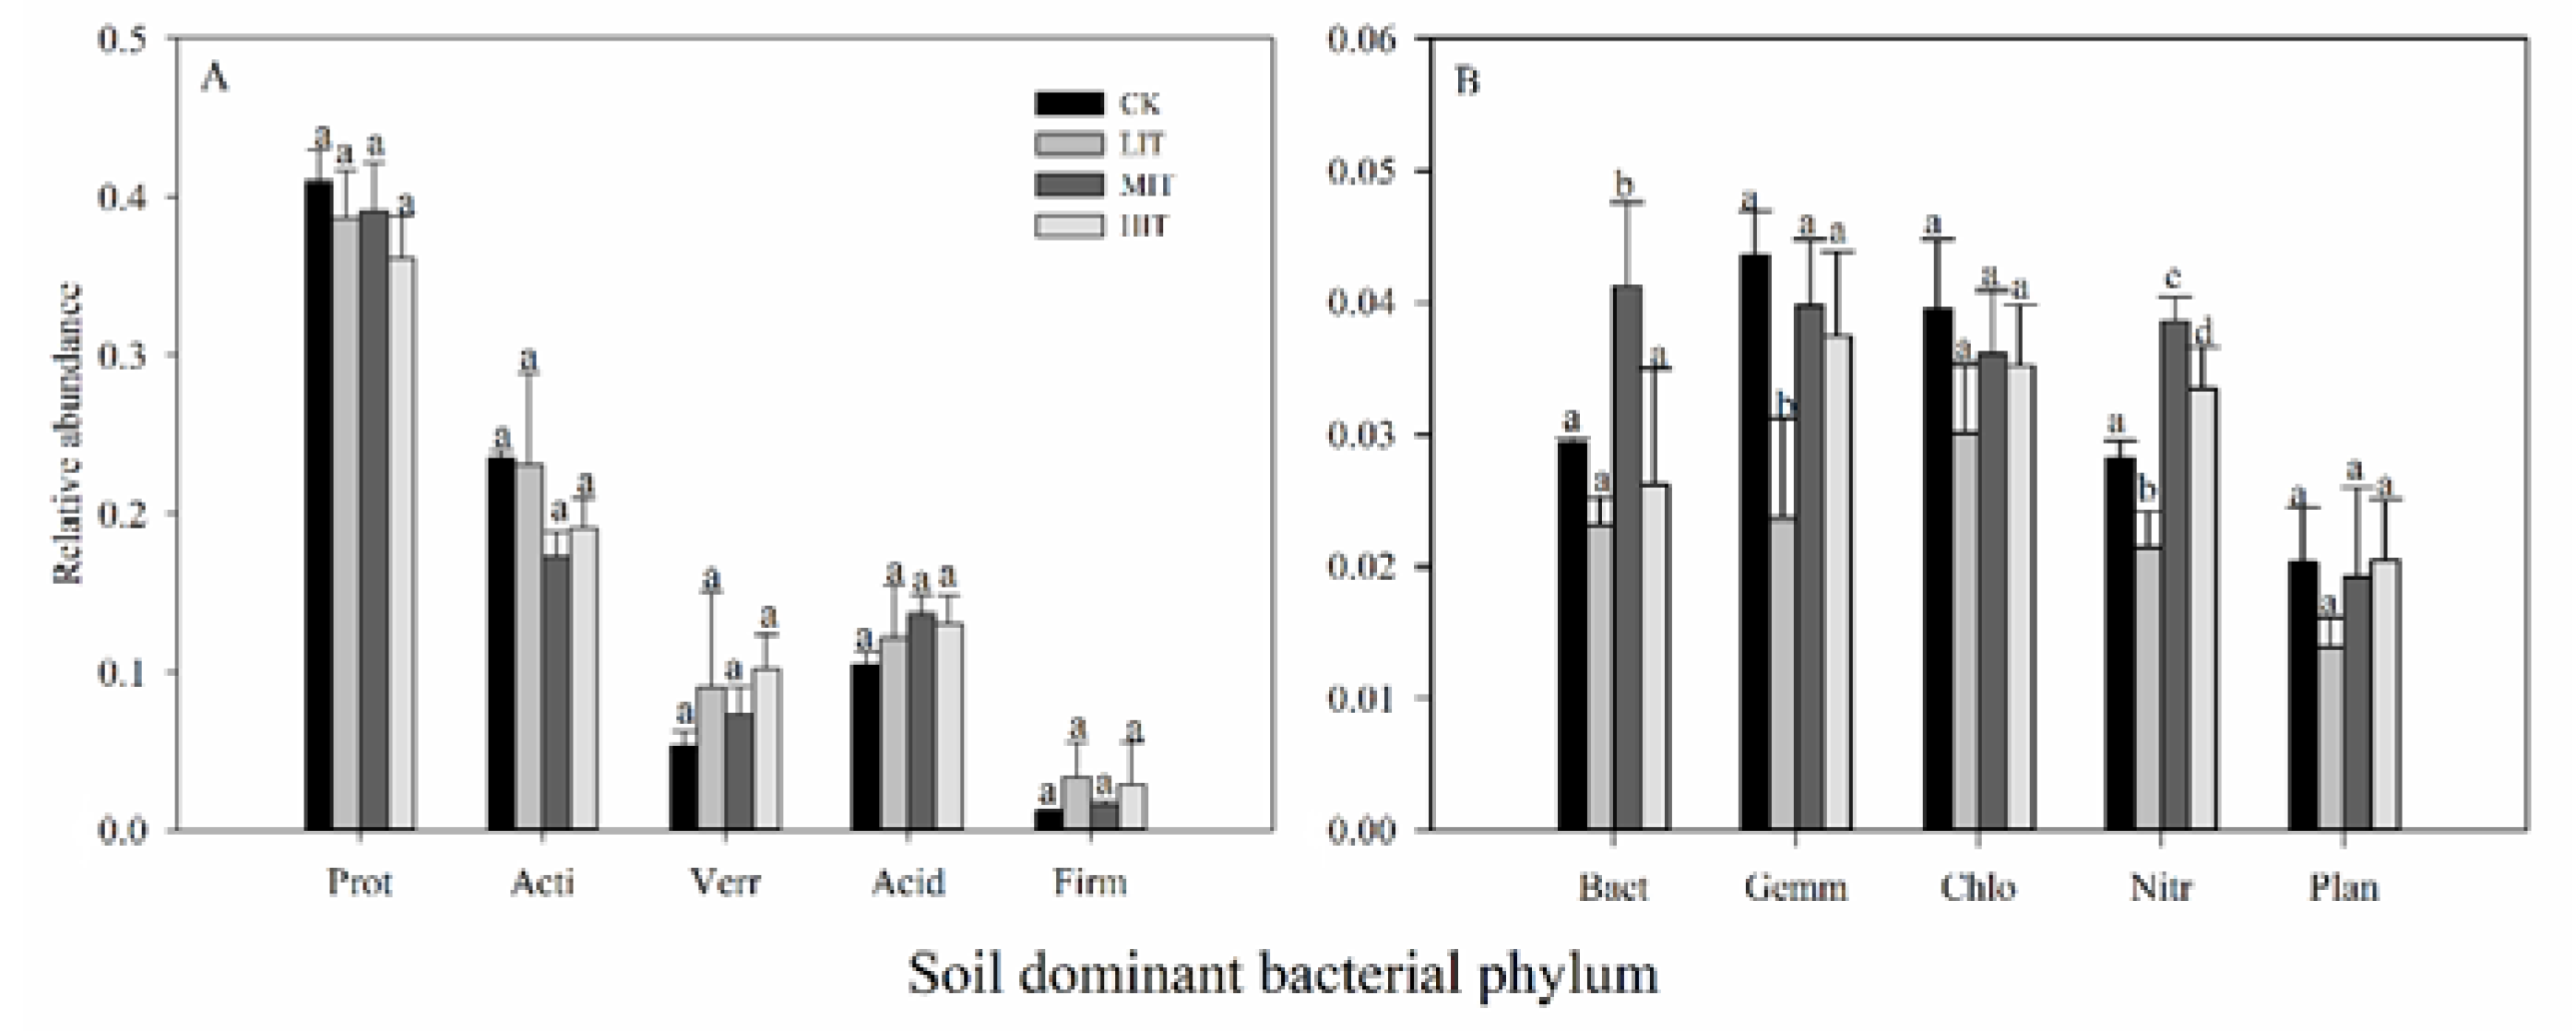
The dominant bacterial groups examined at the phyla level included the Proteobacteria (38.8 %), Actinobacteria (20.8 %), Acidobacteria (12.4 %), Verrucomicrobia (8.0 %), Gemmatimonadetes (3.6 %), Chloroflexi (3.5 %), Nitrospirae (3.1 %), Bacteroidetes (3.0 %), Firmicutes (2.3 %), and Planctomycetes (1.9 %) (Figure 3). The thinning treatment plots (LIT, MIT, and HIT) had more Verrucomicrobia, Acidobacteria, and Firmicutes than the control, while the control had a greater abundance of Proteobacteria, Actinobacteria, Gemmatimonadetes, and Chloroflexi. In addition, the relative abundance of the Nitrospirae differed significantly among the four thinning treatments (P < 0.01), as did the Bacteroidetes and Gemmatimonadetes (P < 0.05). The other dominant phyla did not significantly differ among treatments.
Bray–Curtis dissimilarities were calculated to assess differences among plots (i.e., the three replicates of each of the four thinning treatments) in bacterial community composition, the results of which were visualized in a two-dimensional NMDS plot. The bacterial communities in the MIT and HIT samples tended to group together, clearly separating from the CK and LIT samples. CK and LIT were clearly separated from each other as well (Figure 4).

3.4. The Relations Between Soil Stoichiometric Ratios and Bacterial Community

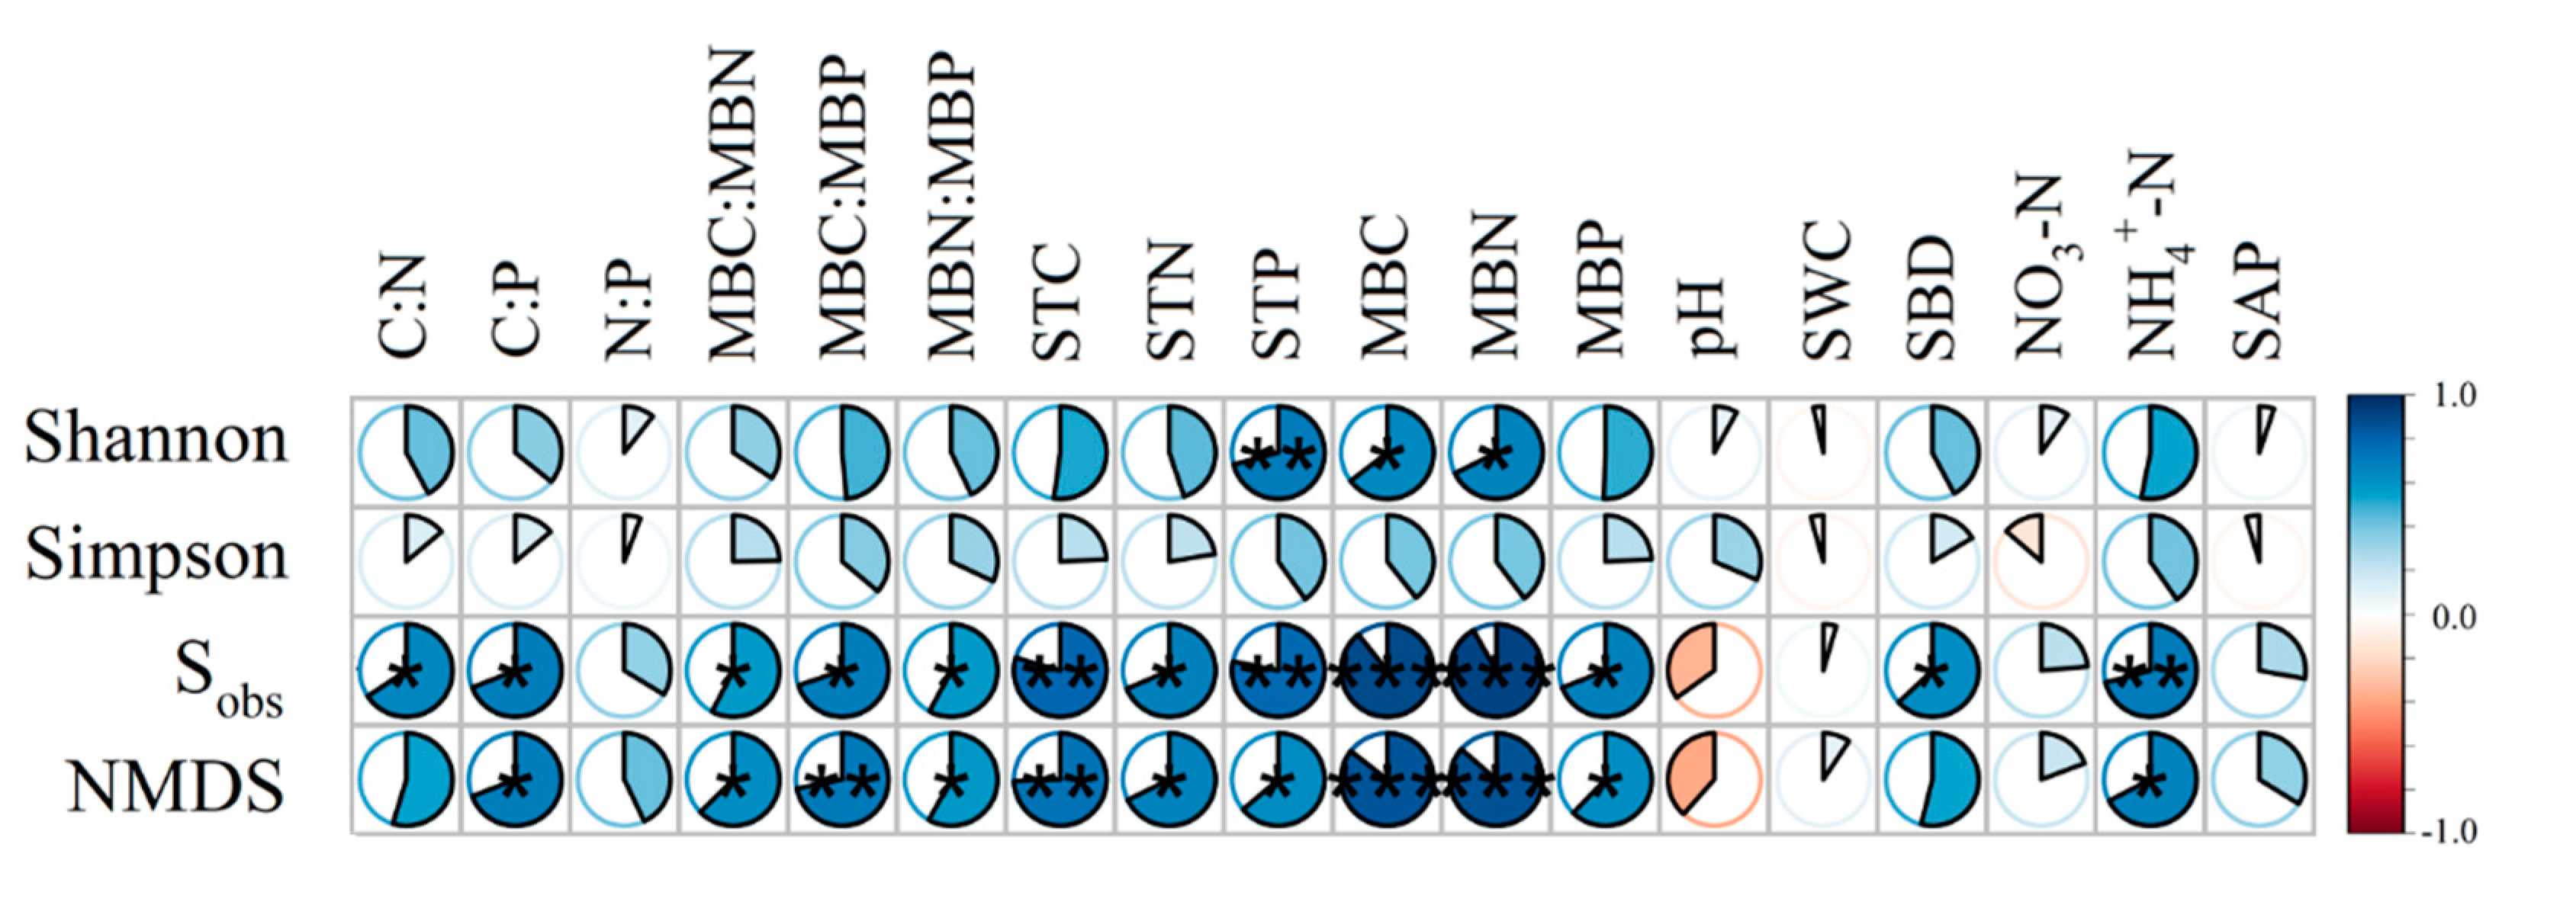
According to the results shown in Figure 5, the Spearman’s correlation analysis was chosen to calculate the relationships among the following variables (Figure 5): the alpha and beta diversity indices of bacterial, the observed number of OTUs (Sobs), soil physicochemical indicators, the element stoichiometry of the soil, and microbial biomass samples. The element ratios, in both the soil and microbial biomass, were not correlated with alpha diversity. However, these ratios were closely connected with the number of OTUs (Sobs) and NMDS1, especially the STC:STP, MBC:MBN, MBC:MBP, and MBN:MBP ratios. Additionally, the Shannon index was closely related to STP (R2 = 0.709, P < 0.01), MBC (R2 = 0.646, P < 0.05), and MBN (R2 = 0.676, P < 0.05). STC, TN, TP, MBC, MBN, and MBP were highly correlated with the number of OTUs (Sobs) (R2 = 0.795, P < 0.01, R2 = 0.686, P < 0.05, R2 = 0.782, P < 0.01, R2 = 0.893, P < 0.001, R2 = 0.918, P < 0.001, R2 = 0.690, P < 0.05, respectively) and beta diversity (NMDS1) (R2 = 0.745, P < 0.01, R2 = 0.677, P < 0.05, R2 = 0.638, P < 0.05, R2 = 0.855, P < 0.001, R2 = 0.864, P < 0.001, R2 = 0.622, P < 0.05, respectively). The influence of the alteration of soil element concentrations and its ratios on the dominant bacterial phylum was examined with redundancy analysis. Most tested factors influenced the abundance of the dominant phyla in the bacterial groups. For example, Bacteroidetes and Nitrospirae were positively correlated with MBC:MBP (R2 = 0.607, P < 0.05) and STP (R2 = 0.685, P < 0.05), while the STC:STP and MBC:MBN were negatively correlated with the abundance of Actinobacteria (R2 = -589, P < 0.05) and Chloroflexi (R2 = -587, P < 0.05) (Figure 6). The soil properties and stoichiometry ratios explained 68.8 % of the variance in soil microbial community.

4. Discussion

4.1. Variation of Soil Properties and Stoichiometry Following Thinning

Short-term thinning had positive alterations on STC, TN, TP, MBC, MBN, and MBP contents (Table 2), particularly in the medium intensity thinning treatment. Similar patterns were observed in previous explorations of the alteration of forests following human disturbance [9,36]. The contents of soil microbial biomass and nutrient elements were simultaneously altered after thinning management, which suggested that there was a close connection between soil elemental stoichiometry and microorganisms [37,38]. Selectively reducing the forest density could increase the stand gap size, thereby enhancing light transmittance, soil hydrothermal condition, and enzymatic activity [39,40,41]. As a consequence, the forest understory micro-environment factors changed, increasing the rate of decomposition of surface litter and roots [11,42]. These variations contribute to improve the soil nutrient storage. As the availability of water and nutrients increases, more nutrient elements are accumulated in soil microbial biomass [4,10,37]. For example, Shen et al. (2018) [14] observed increases in SOC, STN, and STP after thinning. Yang et al. (2017) [11] and Kim et al. (2018) [43] suggested a positive influence of thinning on the soil microbial biomass. We found the availability of soil nutrient contents also increased via the variation of understory environmental factors after thinning, as evidenced by higher SBD, SMC, ammonium nitrogen, nitrate nitrogen, and available phosphorus (Table 1). However, the variation of pH among four treatments did not indicate a significant difference. Similarly, a series of studies also found that thinning management might have a strong influence on elemental concentrations via the improvements in forest structure [44,45]. A lower forest density would moderate competition among trees and understory plants. Lower competition might in turn facilitate the growth of understory plants, resulting in a higher nutrient level as the quantity of decomposable leaf and root litter increases [9,46,47].
Our findings indicate that the soil C, N, and P concentration ratios respond to thinning, although the range of change is unpredictable according to other studies [28,48]. Specifically, the STC:STN, STC:STP, and STN:STP ratios were significantly influenced by MIT, and light and high intensity thinning treatments significantly affected the STC:STP ratio. The variation of these ratios suggested that thinning can create larger canopy gaps, potentially allowing more intense light to reach the soil surface [49,50], providing a more suitable environment for soil carbon and nitrogen mineralization, and improving the accumulation of soil C, N, and P elements [51,52,53,54]. However, the variation of soil P concentration may be primarily derived from the bedrock weathering and erosion [55], resulting in only minor sensitivity to human management, which was proved by the slightly increased C:N and N:P, but significantly increased C:P, following thinning. Moreover, according to the results, only the MBN:MBP ratio did not vary with the thinning intensities, and the MBC:MBN and MBC:MBP ratios were highest in MIT. These trends demonstrated that the response of various microbial biomass ratios to thinning might inconsistently change with the increasing of thinning intensity [36], which was consistent with previous studies. Furthermore, our results may also suggest that the inconsistent changes in microbial stoichiometry characteristics after thinning practice could be attributed to changes in water content, nutrient concentration, and microenvironment [56,57,58]. Moreover, forest thinning has a significant impact on MBC: MBN and MBC: MBP, which might indicate that the accumulation of MBC content in soil is more sensitive to thinning practice than the concentration of MBN and MBP in soil.

4.2. Variation of Bacterial Composition and Diversity Following Thinning

The results of this study demonstrated that the soil bacterial diversity and Sobs differed among thinning treatments (Table 2 and Figure 2). In particular, medium intensity thinning significantly increased bacterial Shannon and Simpson indexes and Sobs. The alterations in bacterial diversity and abundance caused by thinning were probably driven by differences in the sensitivity of dominant bacterial groups to environmental change. However, previous studies suggested that the long-term thinning might have little influence on the diversity of bacterial composition [9], which was inconsistent with this research. One rational explanation for the variation is that the differences in restoration time after thinning might contribute to the inconsistent effects of thinning on bacterial communities, as tree and understory plants growth might promote more litter-fall after thinning [49,57]. Soil microbial community activity increases when more decomposable organic matter is available, especially on the soil surface [49,58]. Therefore, taking thinning intensity, stand type, and restoration time into consideration is necessary to interpret the response mechanism of bacterial diversity to thinning activity [43].
Considering the bacterial composition, the variation of bacterial phyla abundance probably could be attributed to the alterations of soil C, N, and P concentrations and ratios that were altered by the understory microclimate as well as the production and decomposition of organic matters (roots and leaf litter) following thinning [10,11,18]. However, previous studies suggested that soil microbial communities had different adaptability to soil environment alteration [9,37,38], so did the effects of thinning intensity on soil nutrients. Therefore, only some bacterial phyla might respond to the changes of forest density. The increasing of soil nutrient element level was closely related to forest density alteration, and could promote the abundance of several particular microbial groups that were well-adapted to changing conditions [59,60]. In this study, Proteobacteria and Actinobacteria were less abundant in LIT, MIT, and HIT than in CK (Figure 3), while the Acidobacteria and Bacteroidetes were the most abundant in MIT. Because of the high nutritional requirements of Acidobacteria and Bacteroidetes, both species tend to decompose the labile organic matter and increase in proportion with ample resource availability after thinning [16,61]. However, the abundance of Proteobacteria and Actinobacteria was not promoted by the increases of thinning intensity (Table 1 and Table 2), suggesting that these two phyla have opposite life strategies in soils of L. principis-rupprechtii plantations [16,59,62]. Furthermore, the changes in soil nutrient levels and aboveground bacterial communities following management was found to affect the abundance of certain fungi [63,64], thereby reducing competition between fungi and bacterials species [27,65]. In this study, the variations of other microbe groups (e.g., fungi, AMF, and etc.) following thinning probably also affected soil bacterial composition, although this study did not analyze how the thinning practices affected others microbe groups via the alteration of ecological factors.

4.3. Bacterial Community Composition Was Predicted by Soil Nutrient Stoichiometry

This study observed that the bacterial diversity peaked in MIT, which had higher nutrient concentrations and C:N, C:P, and N:P ratios. A Spearman correlation analysis also revealed that C:N, and C:P ratios significantly affected the OUT richness and microbial community composition, while it had little effect on the Shannon and Simpson alpha-diversity indexes. These results demonstrate that soil C, N, and P concentrations and C:N and C:P ratios were closely related to the changes of bacterial diversity following thinning. Based on previous research, thinning might affect soil element concentrations and their ratios in a series of regulatory processes, including adjustments to the understory microclimate, the production and decomposition of organic matter (roots and leaf litter), as well as the exudation from trees and understory plant roots [9,13,66]. Appropriate nutrient element concentrations and ratios can theoretically lead to a greater resource availability for bacterial communities and enhance the diversity by promoting greater niche differentiation [15,23,41]. The same patterns of increases in soil nutrient availability after thinning could be derived from our results. Therefore, thinning could shift soil bacterial diversity and community composition indirectly by altering soil element concentrations and stoichiometry characteristics [59,67].
Furthermore, this study suggests that the change in bacterial phylum abundance was tightly correlated with the variation of soil element concentrations and stoichiometric ratios following thinning management. For instance, Bacteroidetes was positively correlated with MBC:MBP (R2 = 0.607, P < 0.05), while the STC:STP and MBC:MBN were negatively correlated with the abundance of Actinobacteria (R2 = −589, P < 0.05) and Chloroflexi (R2 = −587, P < 0.05) (Figure 6). One potential reason is that some bacterial phyla (e.g., Proteobacteria, Acidobacteria, and Bacteroidetes) are effective indicators to predict the net rate of C or N mineralization [30,68,69]. Additionally, the dynamic process of synthesis in ribosomal RNA is commonly accomplished with a P-rich environment, increasing the abundance of other bacterial phylum (e.g., Proteobacteria, Bacteroidetes, and Planctomycetes) [24,59,70]. Hence, the bacterial phylum abundance could be sensitive to the changes in soil elemental concentrations ratios. At present, our work lacks a system-level perspective on how the key environmental drivers, such as soil C:N:P ratio, affect soil bacterial abundance and structure [69], although the human management of forest ecosystems is already known to be able to influence soil microbial communities and nutrient stoichiometry. Overall, this study aimed to promote the conservation of forest ecosystems by exploring the alteration of soil element stoichiometry after thinning and the regulatory mechanism of the alteration on soil bacterial communities. Additionally, the results from this study could provide practical information for future management and utilization of plantations.

5. Conclusions

This study proved that thinning treatments applied to Larix plantations in Northern China had positive effects on underground bacterial community diversity, abundance, and soil nutrient status. In particular, the MIT had higher soil C, N, P, NO3–N, NH4+–N and SAP, and contributes to regulate the abundance of bacterial phyla (e.g., Bacteroidetes and Nitrospirae). Notably, the unpredictable changes in soil and microbe elemental stoichiometry ratios had a close relationship with the soil bacterial community diversity and composition, as well as the abundance of bacteria at the phylum level. These results offer an unconventional view of the factors that drive the bacterial community structure under different thinning treatments in forest plantation ecosystems. This study, as well, can help to guide forest resource management in the future by elucidating the links between soil and microorganism stoichiometry characteristics and soil bacterial abundance and composition in plantations managed by thinning practice.

Author Contributions

M.C. analyzed the data and wrote the manuscript. M.C., L.L., X.P. and S.X., T.S., J.Y. collected the data. X.C. revised the manuscript. H.H. designed the study. All authors have read and agreed to the published version of the manuscript.

Funding

This study was supported by the National Key Research and Development Program of China (2019YFA0607304) and the National Natural Science Foundation of China (No. 31700372).

Acknowledgments

We sincerely appreciate Zhiyong Zhou and his students (Beijing Forestry University) for their support in our analyzing soil samples. We would also like to thank Emily Drummond at the University of British Columbia for her editing of the manuscript.

Conflicts of Interest

The authors declare no conflict of interest.

References

  1. Liu, J.; Li, S.; Ouyang, Z.; Tam, C.; Chen, X. Ecological and socioeconomic effects of China’s policies for ecosystem services. Proc. Natl. Acad. Sci. USA 2008, 105, 9477–9482. [Google Scholar] [CrossRef] [PubMed] [Green Version]
  2. Verschuyl, J.; Riffell, S.; Miller, D.; Wigley, T.B. Biodiversity response to intensive biomass production from forest thinning in North American forests-a meta-analysis. For. Ecol. Manag. 2011, 261, 221–232. [Google Scholar] [CrossRef]
  3. Cañellas, I.; Del Río, M.; Roig, S.; Montero, G. Growth response to thinning in Quercus pyrenaica Willd. Coppice stands in Spanish central mountain. Ann. For. Sci. 2004, 61, 243–250. [Google Scholar] [CrossRef] [Green Version]
  4. Zhou, L.; Cai, L.; He, Z.; Wang, R.; Wu, P.; Ma, X. Thinning increases understory diversity and biomass, and improves soil properties without decreasing growth of Chinese fir in southern China. Environ. Sci. Pollut. Res. 2016, 23, 24135–24150. [Google Scholar] [CrossRef]
  5. Cheng, C.; Wang, Y.; Fu, X.; Xu, M.; Dai, X.; Wang, H. Thinning effect on understory community and photosynthetic characteristics in a subtropical Pinus Massoniana plantation. Can. J. For. Res. 2017, 47, 1104–1115. [Google Scholar] [CrossRef] [Green Version]
  6. He, F.; Barclay, H.J. Long-term response of understory plant species to thinning and fertilization in a Douglas-fir plantation on southern Vancouver Island, British Columbia. Can. J. For. Res. 2000, 30, 566–572. [Google Scholar] [CrossRef]
  7. Wang, Q.; Wang, Y.; Wang, S.; He, T.; Liu, L. Fresh carbon and nitrogen inputs alter organic carbon mineralization and microbial community in forest deep soil layers. Soil Biol. Biochem. 2014, 72, 145–151. [Google Scholar] [CrossRef]
  8. Deng, Q.; Cheng, X.; Hui, D.; Zhang, Q.; Li, M.; Zhang, Q. Soil microbial community and its interaction with soil carbon and nitrogen dynamics following afforestation in central China. Sci. Total Environ. 2016, 541, 230–237. [Google Scholar] [CrossRef]
  9. Dang, P.; Gao, Y.; Liu, J.; Yu, S.; Zhao, Z. Effects of thinning intensity on understory vegetation and soil microbial communities of a mature Chinese pine plantation in the Loess Plateau. Sci. Total Environ. 2018, 630, 171–180. [Google Scholar] [CrossRef]
  10. Wolk, B.; Rocca, M.E. Thinning and chipping small-diameter ponderosa pine changes understory plant communities on the Colorado front range. For. Ecol. Manag. 2009, 257, 85–95. [Google Scholar] [CrossRef]
  11. Yang, Y.; Geng, Y.; Zhou, H.; Zhao, G.; Wang, L. Effects of gaps inthe forest canopy on soil microbial communities and enzyme activity in a Chinese pine forest. Pedobiologia 2017, 61, 51–60. [Google Scholar] [CrossRef]
  12. Chen, X.-L.; Wang, D.; Chen, X.; Wang, J.; Diao, J.-J.; Zhang, J.-Y.; Guan, Q.-W. Soil microbial functional diversity and biomass as affected by different thinning intensities in a Chinese fir plantation. Appl. Soil Ecol. 2015, 92, 35–44. [Google Scholar] [CrossRef]
  13. Chen, X.; Han, Y.H.; Chen, X.; Wang, J.; Chen, B.; Wang, D.; Guan, Q. Soil labile organic carbon and carbon-cycle enzyme activities under different thinning intensities in Chinese fir plantations. Appl. Soil Ecol. 2016, 107, 162–169. [Google Scholar] [CrossRef]
  14. Shen, Y.; Cheng, R.; Xiao, W.; Yang, S.; Guo, Y.; Wang, N.; Zeng, L.; Wang, X. Labile organic carbon pools and enzyme activities of Pinus massoniana plantation soil as affected by understory vegetation removal and thinning. Sci. Rep. 2018, 8, 573. [Google Scholar] [CrossRef] [Green Version]
  15. Jing, X.; Sanders, N.J.; Shi, Y.; Chu, H.; Classen, A.T.; Zhao, K.; Chen, L.; Shi, Y.; Jiang, Y.; He, J. The links between ecosystem multi-functionality and above- and belowground biodiversity are mediated by climate. Nat. Commun. 2015, 6, 8159. [Google Scholar] [CrossRef]
  16. Zhang, C.; Liu, G.; Xue, S.; Wang, G. Soil bacterial community dynamics reflect changes in plant community and soil properties during the secondary succession of abandoned farmland in the Loess Plateau. Soil Biol. Biochem. 2016, 97, 40–49. [Google Scholar] [CrossRef]
  17. Hartmann, M.; Howes, C.G.; VanInsberghe, D.; Yu, H.; Bachar, D.; Christen, R.; Nilsson, R.H.; Hallam, S.J.; Mohn, W.W. Significant and persistent impact of timber harvesting on soil microbial communities in northern coniferous forests. ISME J. 2012, 6, 2199. [Google Scholar] [CrossRef] [Green Version]
  18. Xiao, W.; Fei, F.; Diao, J.; Chen, B.J.W.; Guan, Q. Thinning intensity affects microbial functional diversity and enzymatic activities associated with litter decomposition in a Chinese fir plantation. J. For. Res. 2018, 29, 1337–1350. [Google Scholar] [CrossRef]
  19. Maassen, S.; Wirth, S. Soil microbiological monitoring of a pine forest after partial thinning for stand regeneration with beech seedlings. Soil Sci. Plant. Nutr. 2004, 50, 815–819. [Google Scholar] [CrossRef]
  20. Liu, X.; Ma, J.; Ma, Z.; Li, L. Soil nutrient contents and stoichiometry as affected by land-use in an agro-pastoral region of northwest China. Catena 2017, 150, 146–153. [Google Scholar] [CrossRef]
  21. Fanin, N.; Fromin, N.; Buatois, B.; Hättenschwiler, S. An experimental test of the hypothesis of non-homeostatic consumer stoichiometry in a plant litter-microbe system. Ecol. Lett. 2013, 16, 764–772. [Google Scholar] [CrossRef] [PubMed]
  22. Peñuelas, J.; Sardans, J. Elementary factors. Nature 2009, 460, 803–804. [Google Scholar] [CrossRef] [PubMed]
  23. Hooper, D.U.; Bignell, D.E.; Brown, V.K.; Brussaard, L.; Dangerfield, J.M.; Wall, D.H.; Wardle, D.A.; Coleman, D.C.; Giller, K.E.; Lavelle, P.; et al. Interactions between aboveground and belowground biodiversity in terrestrial ecosystems: Patterns, mechanisms, and feedbacks. Bioscience 2000, 50, 1049–1061. [Google Scholar] [CrossRef]
  24. Sterner, R.W.; Elser, J.J. Ecological Stoichiometry: The Biology of Elements from Molecules to the Biosphere; Princeton University Press: Princeton, NY, USA, 2002. [Google Scholar]
  25. Zhao, K.J.; Dong, B.Q.; Jia, Z.K.; Ma, L.Y. Effect of climatic factors on the temporal variation of stem respiration in Larix principis-rupprechtii Mayr. Agric. For. Meteorol. 2018, 248, 441–448. [Google Scholar] [CrossRef]
  26. Yuan, J.; Jose, S.; Hu, Z.; Pang, J.; Hou, L.; Zhang, S. Biometric and eddy covariance methods for examining the carbon balance of a Larix principis-rupprechtii forest in the Qinling Mountains, China. Forests 2018, 9, 67. [Google Scholar] [CrossRef] [Green Version]
  27. Van der Heijden, M.G.A.; Bardgett, R.D.; van Straalen, N.M. The unseen majority: Soil microbes as drivers of plant diversity and productivity in terrestrial ecosystems. Ecol. Lett. 2008, 11, 296–310. [Google Scholar] [CrossRef]
  28. Li, H.L.; Crabbe, M.J.C.; Xu, F.L.; Wang, W.L.; Niu, R.L.; Gao, X.; Zhang, P.; Chen, H.K. Seasonal variations in carbon, nitrogen and phosphorus concentrations and C:N:P stoichiometry in the leaves of differently aged Larix principis-rupprechtii Mayr. Plantations. Forests 2017, 8, 373. [Google Scholar] [CrossRef] [Green Version]
  29. Bao, S. Soil and Agricultural Chemistry Analysis; China Agriculture Press: Beijing, China, 2000. [Google Scholar]
  30. Brookes, P.C.; Landman, A.; Pruden, G.; Jenkinson, D.S. Chloroform fumigation and the release of soil nitrogen: A rapid direct extraction method to measure microbial biomass nitrogen in soil. Soil Biol. Biochem. 1985, 17, 837–842. [Google Scholar] [CrossRef]
  31. Vance, E.D.; Brookes, P.C.; Jenkinson, D.S. An extraction method for measuring soil microbial biomass C. Soil Biol. Biochem. 1987, 19, 703–707. [Google Scholar] [CrossRef]
  32. Caporaso, J.G.; Lauber, C.L.; Walters, W.A.; Berg-Lyons, D.; Huntley, J.; Fierer, N.; Owens, S.M.; Betley, J.; Fraser, L.; Bauer, M.; et al. Ultra-high-throughput microbial community analysis on the Illumina HiSeq and MiSeq platforms. ISME 2012, 6, 1621–1624. [Google Scholar] [CrossRef] [Green Version]
  33. Li, Q.; Song, X.; Gu, H.; Gao, F. Nitrogen deposition and management practices increase soil microbial biomass carbon but decrease diversity in Moso bamboo plantations. Sci. Rep. 2016, 6, 28235. [Google Scholar] [CrossRef] [PubMed] [Green Version]
  34. Edgar, R.C.; Haas, B.J.; Clemente, J.C.; Quince, C.; Knight, R. UCHIME improves sensitivity and speed of chimera detection. Bioinformatics 2011, 27, 2194–2200. [Google Scholar] [CrossRef] [PubMed] [Green Version]
  35. Wang, Q.; Garrity, G.M.; Tiedje, J.M.; Cole, J.R. Naïve Bayesian classifier for rapid assignment of rRNA sequences into the new bacterial taxonomy. Appl. Environ. Microbiol. 2007, 73, 5261–5267. [Google Scholar] [CrossRef] [PubMed] [Green Version]
  36. Kim, S.; Li, G.; Han, S.; Kim, C.; Lee, S.; Son, Y. Microbial biomass and enzymatic responses to temperate oak and larch forest thinning: Influential factors for the site-specific changes. Sci. Total Environ. 2019, 651, 2068–2079. [Google Scholar] [CrossRef]
  37. Ren, C.; Zhao, F.; Kang, D.; Yang, G.; Han, X.; Tong, X.; Feng, Y.; Ren, G. Linkages of C:N:P stoichiometry and bacterial community in soil following afforestation of former farmland. For. Ecol. Manag. 2016, 376, 59–66. [Google Scholar] [CrossRef]
  38. Zhang, C.; Liu, G.; Xue, S.; Wang, G. Changes in rhizospheric microbial community structure and function during the natural recovery of abandoned cropland on the Loess Plateau, China. Ecol. Eng. 2015, 75, 161–171. [Google Scholar] [CrossRef]
  39. Li, G.; Kim, S.; Han, S.H.; Chang, H.; Du, D.; Son, Y. Precipitation affects soil microbial and extracellular enzymatic responses to warming. Soil Biol. Biochem. 2018, 120, 212–221. [Google Scholar] [CrossRef]
  40. Baena, C.W.; Andrés-Abellán, M.; Lucas-Borja, M.E.; Martínez-García, E.; García-Morote, F.A.; Rubio, E.; Lópes-Serraano, F.R. Thinning and recovery effects on soil properties in two sites of a Mediterranean forest, in Cuenca Mountain (south-eastern of Spain). For. Ecol. Manag. 2013, 308, 223–230. [Google Scholar] [CrossRef]
  41. Juodvalkis, A.; Kairiukstis, L.; Vasiliauskas, R. Effects of thinning on growth of six tree species in north-temperate forests of Lithuania. Eur. J. For. Res. [CrossRef]
  42. Deng, J.; Sun, P.; Zhao, F.; Han, X.; Yang, G.; Feng, Y.; Ren, G. Soil C, N, P and its stratification ratio affected by artificial vegetation in subsoil, Loess Plateau China. PLoS ONE 2016, 11, e0151446. [Google Scholar] [CrossRef]
  43. Kim, S.; Li, G.; Han, S.H.; Kim, H.-J.; Kim, C.; Lee, S.-T.; Son, Y. Thinning affects microbial biomass without changing enzyme activity in the soil of Pinus densiflora Sieb. et Zucc. forests after 7 years. Ann. For. Sci. 2018, 75, 13. [Google Scholar] [CrossRef] [Green Version]
  44. Asaye, Z.; Zewdie, S. Fine root dynamics and soil carbon accretion under thinned and un-thinned Cupressus lusitanica stands in Southern Ethiopia. Plant. Soil 2013, 366, 261–271. [Google Scholar] [CrossRef]
  45. Moorhead, D.L.; Rinkes, Z.L.; Sinsabaugh, R.L.; Weintraub, M.N. Dynamic relationship between microbial biomass, respiration, inorganic nutrients and enzyme activities: Informing enzyme-based decomposition models. Front. Microbiol. 2013, 4, 223. [Google Scholar] [CrossRef] [PubMed] [Green Version]
  46. Settineri, G.; Mallamaci, C.; Mitrović, M.; Sidari, M.; Muscolo, A. Effects of different thinning intensities on soil carbon storage in Pinus laricio forest of Apenneine South Italy. Eur. J. For. Res. 2018, 137, 131–141. [Google Scholar] [CrossRef] [Green Version]
  47. Trentini, C.P.; Gampanello, P.I.; Villagra, M.; Ritter, L.; Ares, A.; Goldstein, G. Thinning of loblolly pine plantations in subtropical Argentina: Impact on microclimate and understory vegetation. For. Ecol. Manag. 2017, 384, 236–247. [Google Scholar] [CrossRef]
  48. Griffiths, B.S.; Spilles, A.; Bonkowski, M. C:N:P stoichiometry and nutrient limitation of the soil microbial biomass in a grazed grassland site under experimental P limitation or excess. Ecol. Process. 2012, 1, 1–11. [Google Scholar] [CrossRef] [Green Version]
  49. Bravo-Oviedo, A.; Ruiz-Peinado, R.; Modrego, P.; Alonso, R.; Montero, G. Forest thinning impact on carbon stock and soil condition in Southern European populations of P. sylvestris L. For. Ecol. Manag. 2015, 357, 259–267. [Google Scholar] [CrossRef]
  50. Dannenmann, M.; Gasche, R.; Ledebuhr, A.; Papen, H. Effects of forest management on soil N cycling in beech forests stocking on calcareous soils. Plant. Soil 2006, 287, 279–300. [Google Scholar] [CrossRef]
  51. Geng, Y.; Dighton, J.; Gray, D. The effects of thinning and soil disturbance on enzyme activities under pitch pine soil in New Jersey Pinelands. Appl. Soil Ecol. 2012, 62, 1–7. [Google Scholar] [CrossRef]
  52. Pang, X.; Hu, B.; Bao, W.; Vargas, T.O.; Tian, G. Effect of thinning-induced gap size on soil CO 2 efflux in a reforested spruce forest in the eastern Tibetan Plateau. Agric. For. Meteorol. 2016, 220, 1–9. [Google Scholar] [CrossRef]
  53. Zechmeister-Boltenstern, S.; Keiblinger, K.M.; Mooshammer, M.; Peñuelas, J.; Richter, A.; Sardans, J.; Wanek, W. The application of ecological stoichiometry to plant-microbial-soil organic matter transformations. Ecol. Monogr. 2015, 85, 133–155. [Google Scholar] [CrossRef] [Green Version]
  54. Zhang, X.; Guan, D.; Li, W.; Sun, D.; Jin, C.; Yuan, F.; Wang, A.; Wu, J. The effects of forest thinning on soil carbon stocks and dynamics: A meta-analysis. For. Ecol. Manag. 2018, 429, 36–43. [Google Scholar] [CrossRef]
  55. Walker, T.W.; Syers, J.K. The fate of phosphorus during pedogenesis. Geoderma 1976, 15, 1–19. [Google Scholar] [CrossRef]
  56. Kim, S.; Li, G.; Han, S.H.; Chang, H.; Kim, H.-J.; Son, Y. Differential effects of coarse woody debris on microbial and soil properties in Pinus densiflora Sieb. et. Zucc. forests. Forests 2017, 8, 292. [Google Scholar] [CrossRef] [Green Version]
  57. Lado-Monserrat, L.; Lidón, A.; Bautista, I. Litterfall, litter decomposition and associated nutrient fluxes in Pinus halepensis: Influence of tree removal intensity in a Mediterranean forest. Eur. J. For. Res. 2015, 5, 833–844. [Google Scholar] [CrossRef]
  58. Thibodeau, L.; Raymond, P.; Camiré, C.; Munson, A.D. Impact of precommercial thinning in balsam fir stands on soil nitrogen dynamics, microbial biomass, decomposition, and foliar nutrition. Can. J. For. Res. 2000, 30, 229–238. [Google Scholar] [CrossRef]
  59. Fierer, N.; Bradford, M.A.; Jackson, R.B. Toward an ecological classification of soil bacteria. Ecology 2007, 88, 1354–1364. [Google Scholar] [CrossRef]
  60. Fazi, S.; Amalfitano, S.; Pernthaler, J.; Puddu, A. Bacterial communities associated with benthic organic matter in headwater stream microhabitats. Environ. Microbiol. 2005, 7, 1633–1640. [Google Scholar] [CrossRef]
  61. Kirchman, D.L. The ecology of Cytophaga–Flavobacteria in aquatic environments. FEMS Microbiol. Ecol. 2002, 39, 91–100. [Google Scholar] [CrossRef]
  62. Liu, J.; Sui, Y.; Yu, Z.; Yao, Q.; Shi, Y.; Chu, H.; Jian, J.; Liu, X.; Wang, G. Diversity and distribution patterns of acidobacterial communities in the black soil zone of northeast China. Soil Biol. Biochem. 2016, 95, 212–222. [Google Scholar] [CrossRef]
  63. Bardgett, R.; McAlister, E. The measurement of soil fungal: Bacterial biomass ratios as an indicator of ecosystem self-regulation in temperate meadow grasslands. Biol. Fert. Soils 1999, 29, 282–290. [Google Scholar] [CrossRef]
  64. De Vries, F.T.; Manning, P.; Tallowin, J.R.; Mortimer, S.R.; Pilgrim, E.S.; Harrison, K.A.; Hobbs, P.J.; Quirk, H.; Shipley, B.; Cornelissen, J.H.C.; et al. Abiotic drivers and plant traits explain landscape-scale patterns in soil microbial communities. Ecol. Lett. 2012, 15, 1230–1239. [Google Scholar] [CrossRef] [PubMed]
  65. Waldrop, M.P.; Zak, D.R.; Blackwood, C.B.; Curtis, C.D.; Tilman, D. Resource availability controls fungal diversity across a plant diversity gradient. Ecol. Lett. 2006, 9, 1127–1135. [Google Scholar] [CrossRef] [PubMed] [Green Version]
  66. Prescott, C.E.; Grayston, S.J. Tree species influence on microbial communities in litter and soil: Current knowledge and research needs. For. Ecol. Manag. 2013, 309, 19–27. [Google Scholar] [CrossRef]
  67. Lauber, C.L.; Hamady, M.; Knight, R.; Fierer, N. Pyrosequencing-based assessment of soil pH as a predictor of soil bacterial community structure at the continental scale. Appl. Environ. Microbiol. 2009, 75, 5111–5120. [Google Scholar] [CrossRef] [Green Version]
  68. Delgado-Baquerizo, M.; Maestre, F.T.; Reich, P.B.; Jeffries, T.C.; Gaitan, J.J.; Encinar, D.; Berdugo, M.; Campbell, C.D.; Singh, B.K. Microbial diversity drives multifunctionality in terrestrial ecosystems. Nat. Commun. 2016, 7, 10541. [Google Scholar] [CrossRef] [Green Version]
  69. Delgado-Baquerizo, M.; Reich, P.; Khachane, A.; Campbell, C.; Thomas, N.; Freitag, T.; Al-Soud, W.A.; Sørensen, S.; Bardgett, R.D.; Singh, B.K. It is elemental: Soil nutrient stoichiometry drives bacterial diversity. Environ. Microbiol. 2017, 19, 1176–1188. [Google Scholar] [CrossRef]
  70. Elser, J.J.; Dobberfuhl, D.R.; MacKay, N.A.; Schampel, J.H. Organism size, life history, and N:P stoichiometry toward a unified view of cellular and ecosystem processes. Bioscience 1996, 46, 674–684. [Google Scholar] [CrossRef] [Green Version]
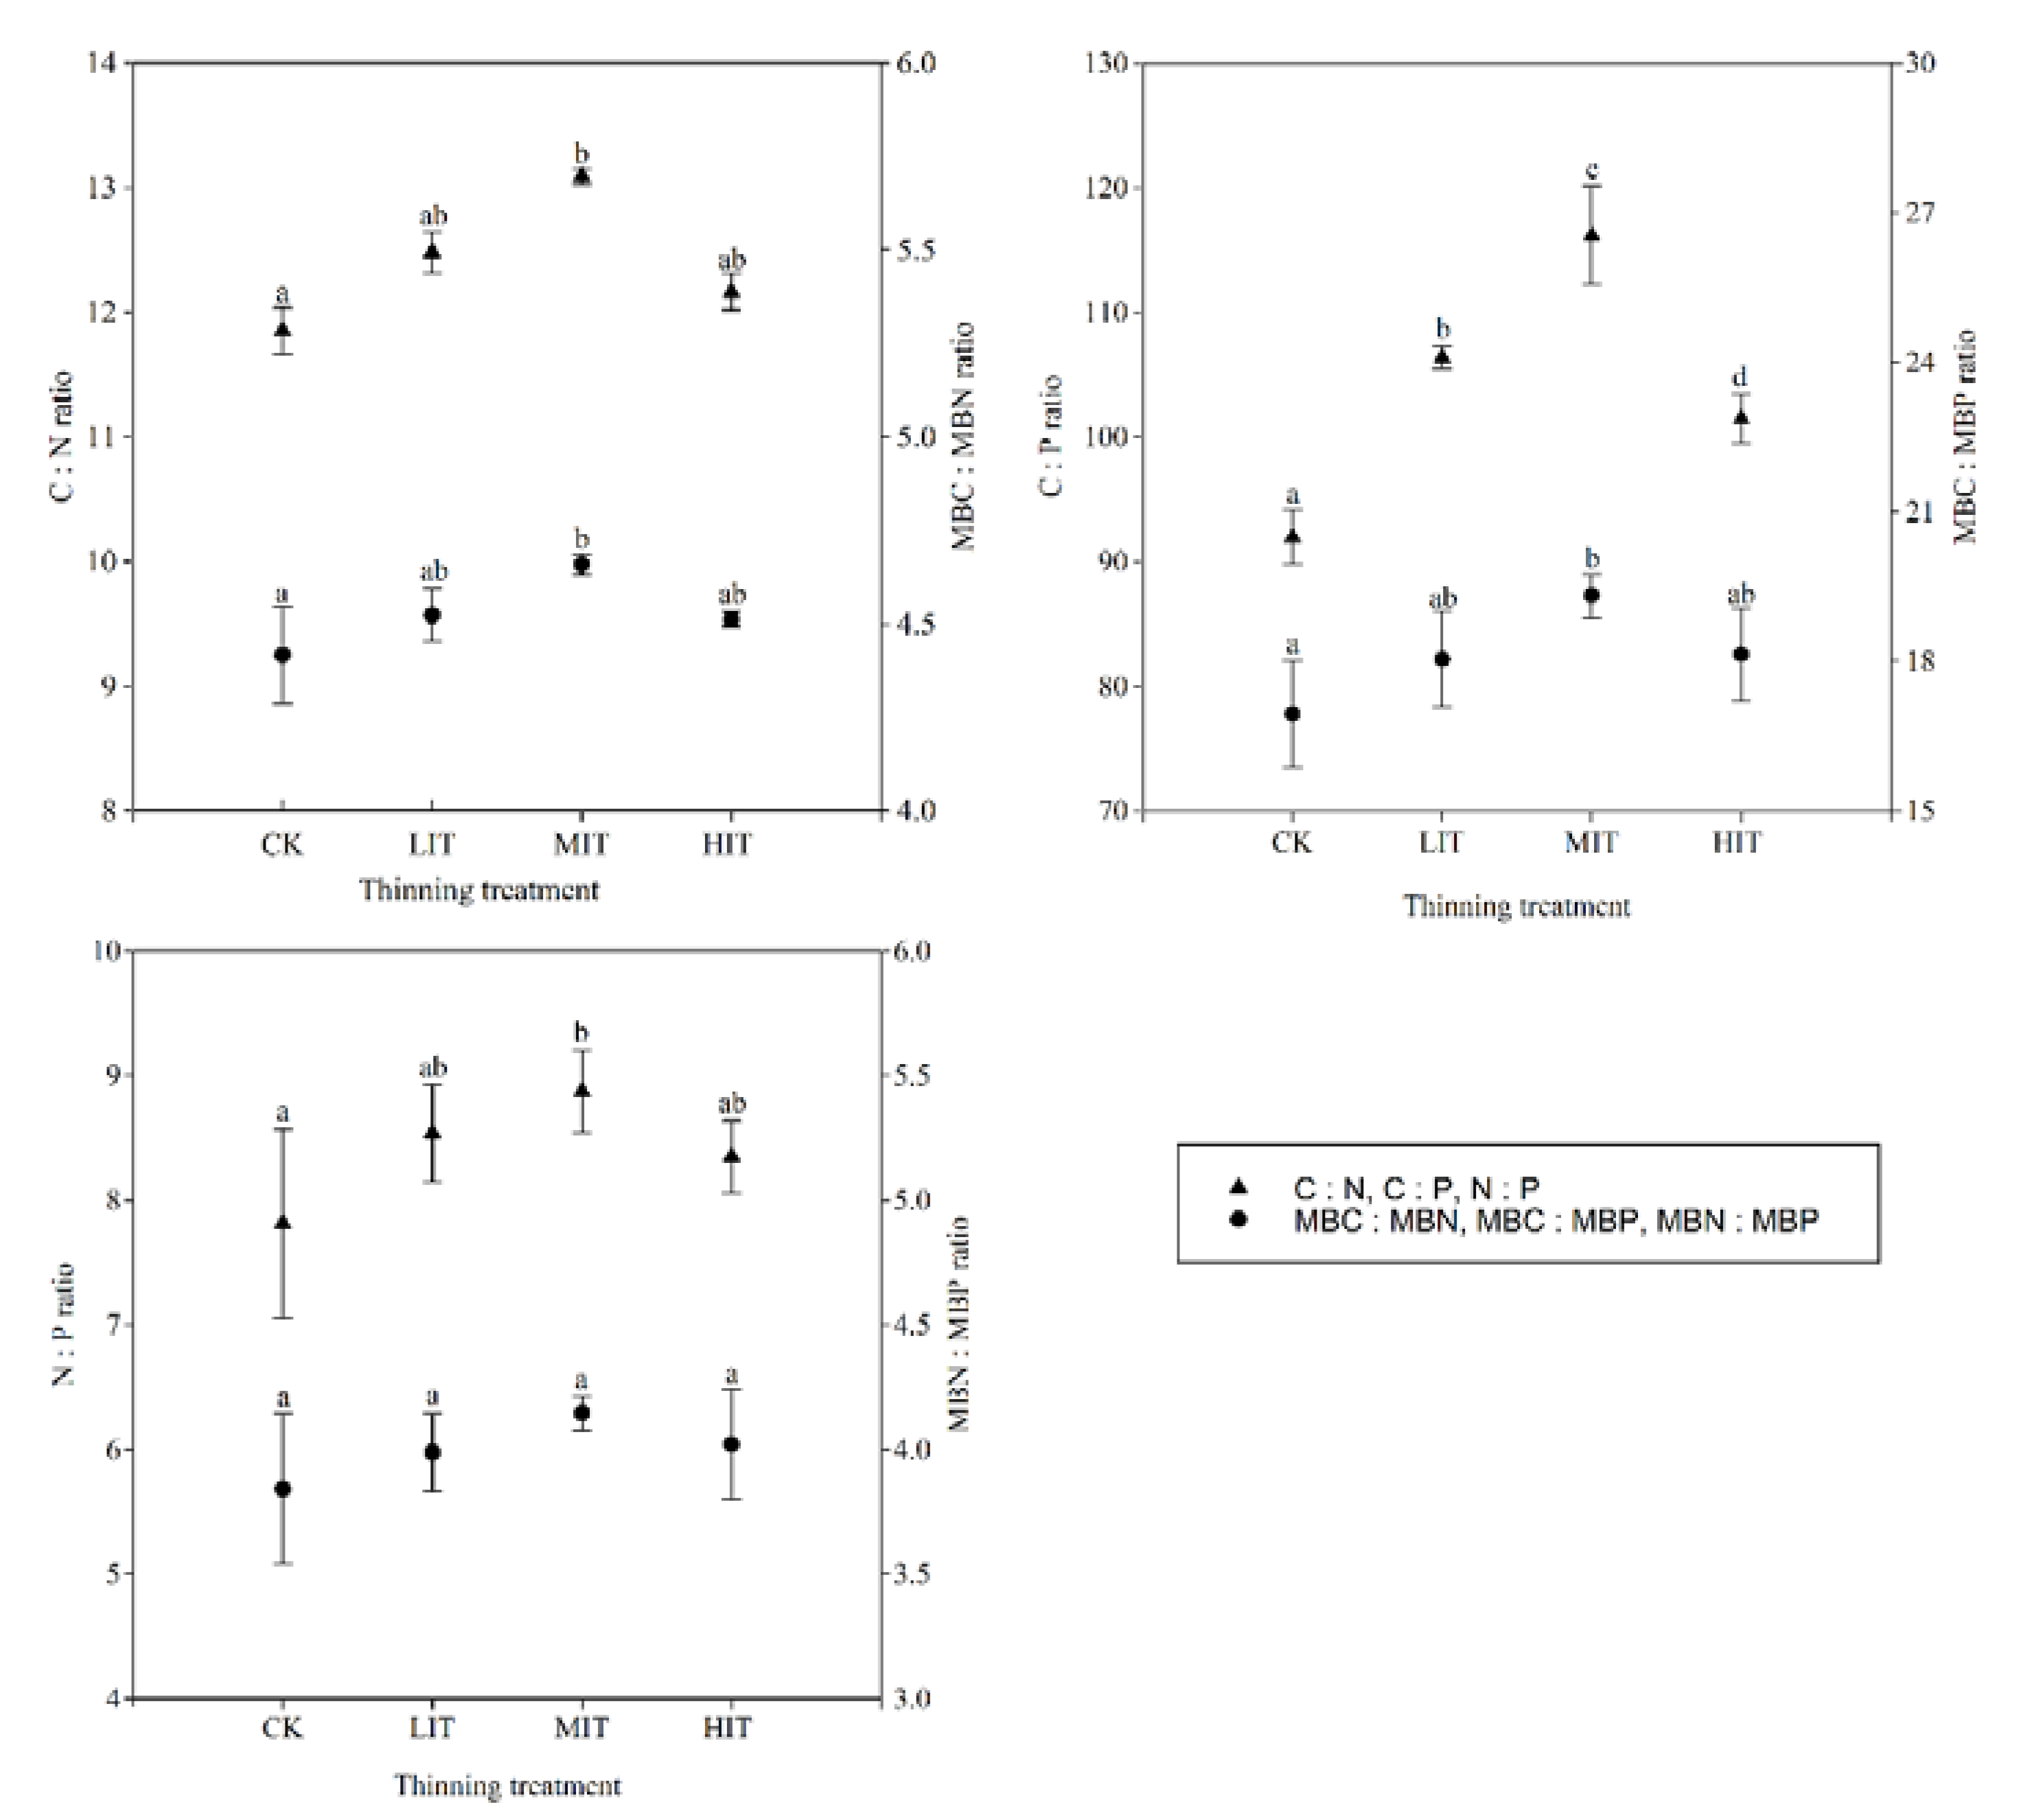
Figure 1. Impact of short-term thinning treatments on the C:N (soil total carbon:soil total nitrogen), C:P (soil total carbon:soil total phosphorus), N:P (soil total nitrogen:soil total phosphorus), MBC:MBN(microbial biomass carbon:microbial biomass nitrogen), MBC:MBP (microbial biomass carbon:microbial biomass phosphorus), and MBN:MBP (microbial biomass nitrogen:microbial biomass phosphorus) ratios. Different letters indicate significant differences among the thinning treatments (P < 0.05).
Forests 11 00261 g001
Figure 2. Impact of thinning on the Shannon index and Simpson index, two alpha-diversity metrics. Different letters indicate significant differences among thinning treatments (P < 0.05).
Forests 11 00261 g002
Figure 3. (A) Impact of thinning treatments on the relative abundance of the Proteobacteria (Prot), Actinobacteria (Acti), Verrucomicrobia (Verr), Acidobacteria (Acid), Firmicutes (Firm), respectively. (B) Impact of thinning treatments on the relative abundance of the Bacteroidetes (Bact), Gemmatimonadetes (Gemm), Chloroflexi (Chlo), Nitrospirae (Nitr), and Planctomycetes (Plan), respectively. Different small letters indicate significant differences among thinning treatments (P < 0.05). CK, LIT, MIT, and HIT are abbreviations for the control, low-intensity thinning, medium-intensity thinning, and high-intensity thinning treatments, respectively.
Forests 11 00261 g003
Figure 4. A non-metric multidimensional scaling (NMDS) plot based on Bray–Curtis dissimilarities calculated for soil bacterial communities in different thinning treatments.
Forests 11 00261 g004
Figure 5. Spearman correlations among the alpha diversity (Shannon and Simpson indexes), beta diversity (NMDS1: based on Bray–Curtis dissimilarities), the observed number of bacterial OTUs (Sobs), soil physicochemical properties, and soil and microbial biomass C:N:P stoichiometry. *** p < 0.001, ** p < 0.01, * p < 0.05.
Forests 11 00261 g005
Figure 6. Redundancy analysis of the most abundant soil bacterial phyla and measured soil properties and C:N:P stoichiometry for four thinning treatments in a L. principis-rupprechtii plantation. STC: soil total carbon; STN: soil total nitrogen; STP: soil total phosphorus; NO3-N: nitrate nitrogen; NH4+-N: ammonia nitrogen; SAP: soil available phosphorous; SBD: soil bulk density; MBC: microbial biomass carbon; MBN: microbial biomass nitrogen; MBP: microbial biomass phosphorous; C:N: STC:STN; C:P: STC:STP; N:P: STN:STP.
Forests 11 00261 g006
Table 1. Main characteristics and soil nutrient properties of the four thinning treatments sites in a L. principis-rupprechtii plantation.
Thinning TreatmentCKLITMITHIT
Stand density (stem ha−1)2096 ± 371850 ± 81415 ± 71087 ± 5
Mean slope gradient (°)25252525
Mean height (m)14.69 ± 2.3014.36 ± 2.0216.26 ± 0.9615.71 ± 2.22
Mean DBH (cm)15.07 ± 0.5114.95 ± 0.6916.06 ± 0.3816.88 ± 0.46
SBD (g cm−3)0.82 ± 0.02a0.84 ± 0.01ab0.86 ± 0.01b0.84 ± 0.02ab
pH6.29 ± 0.10a6.11 ± 0.14a6.07 ± 0.09a6.16 ± 0.15a
SWC (%)32.48 ± 0.86a45.56 ± 1.15ab52.42 ± 1.01b40.58 ± 0.58ab
NO3-N (mg kg−1)8.93 ± 1.21a11.74 ± 1.87a13.00 ± 1.42a10.32 ± 0.61a
NH4+-N (mg kg−1)5.17 ± 0.20a5.41 ± 0.20a6.26 ± 0.39b5.60 ± 0.29a
SAP (mg kg−1)3.27 ± 0.12a3.62 ± 0.15a4.06 ± 0.11a3.77 ± 0.17a
Sobs3166 ± 86a3209 ± 57a3637 ± 162b3417 ± 116c
DBH, diameter at breast height. SBD, soil bulk density. SWC, soil water content. NH4+–N, ammonium nitrogen. NO3–N, nitrate nitrogen. SAP, soil available phosphorus. Sobs, the number of observed soil bacterial operational taxonomic units (OTUs). Different letters indicate significant differences among the thinning treatments (P < 0.05). Values are presented as the mean ± standard error. CK, LIT, MIT, and HIT are abbreviations for the control, low-intensity thinning, medium-intensity thinning, and high-intensity thinning treatments, respectively.
Table 2. The C, N, and P content in soils and the microbial biomass as affected by thinning treatments of L. principis-rupprechtii plantation.
Thinning TreatmentSTC
(g kg−1)
STN
(g kg−1)
STP
(g kg−1)
MBC
(mg kg−1)
MBN
(mg kg−1)
MBP
(mg kg−1)
CK34.74 ± 0.99a2.95 ± 0.15a0.39 ± 0.02a476.04 ± 4.93a107.82 ± 2.15a28.17 ± 2.03a
LIT42.37 ± 0.53b3.40 ± 0.16b0.40 ± 0.01a515.28 ± 6.18b113.93 ± 0.65b28.61 ± 1.27a
MIT50.98 ± 0.65b3.89 ± 0.07b0.44 ± 0.01b624.00 ± 3.45c133.94 ± 1.49c32.32 ± 0.90b
HIT41.71 ± 0.43c3.43 ± 0.16c0.41 ± 0.01a551.37 ± 9.44d122.19 ± 2.23d30.44 ± 1.12ab
STC, soil total carbon. STN, soil total nitrogen. STP, soil total phosphorus. MBC, MBN, and MBP are abbreviations for soil microbial biomass carbon, microbial biomass nitrogen, and microbial biomass phosphorus, respectively. Different letters indicate significant differences among the thinning treatments (P < 0.05). Values are given as the mean value ± standard error.