Ecosystem Service Benefits and Trade-Offs—Selecting Tree Species in Denmark for Bioenergy Production

Abstract
:1. Introduction
2. Materials and Methods
2.1. Selected Species by Management Type
2.2. Data
2.2.1. Provisioning Services
2.2.2. Regulating Services
2.2.3. Biodiversity
2.3. Cultural Services
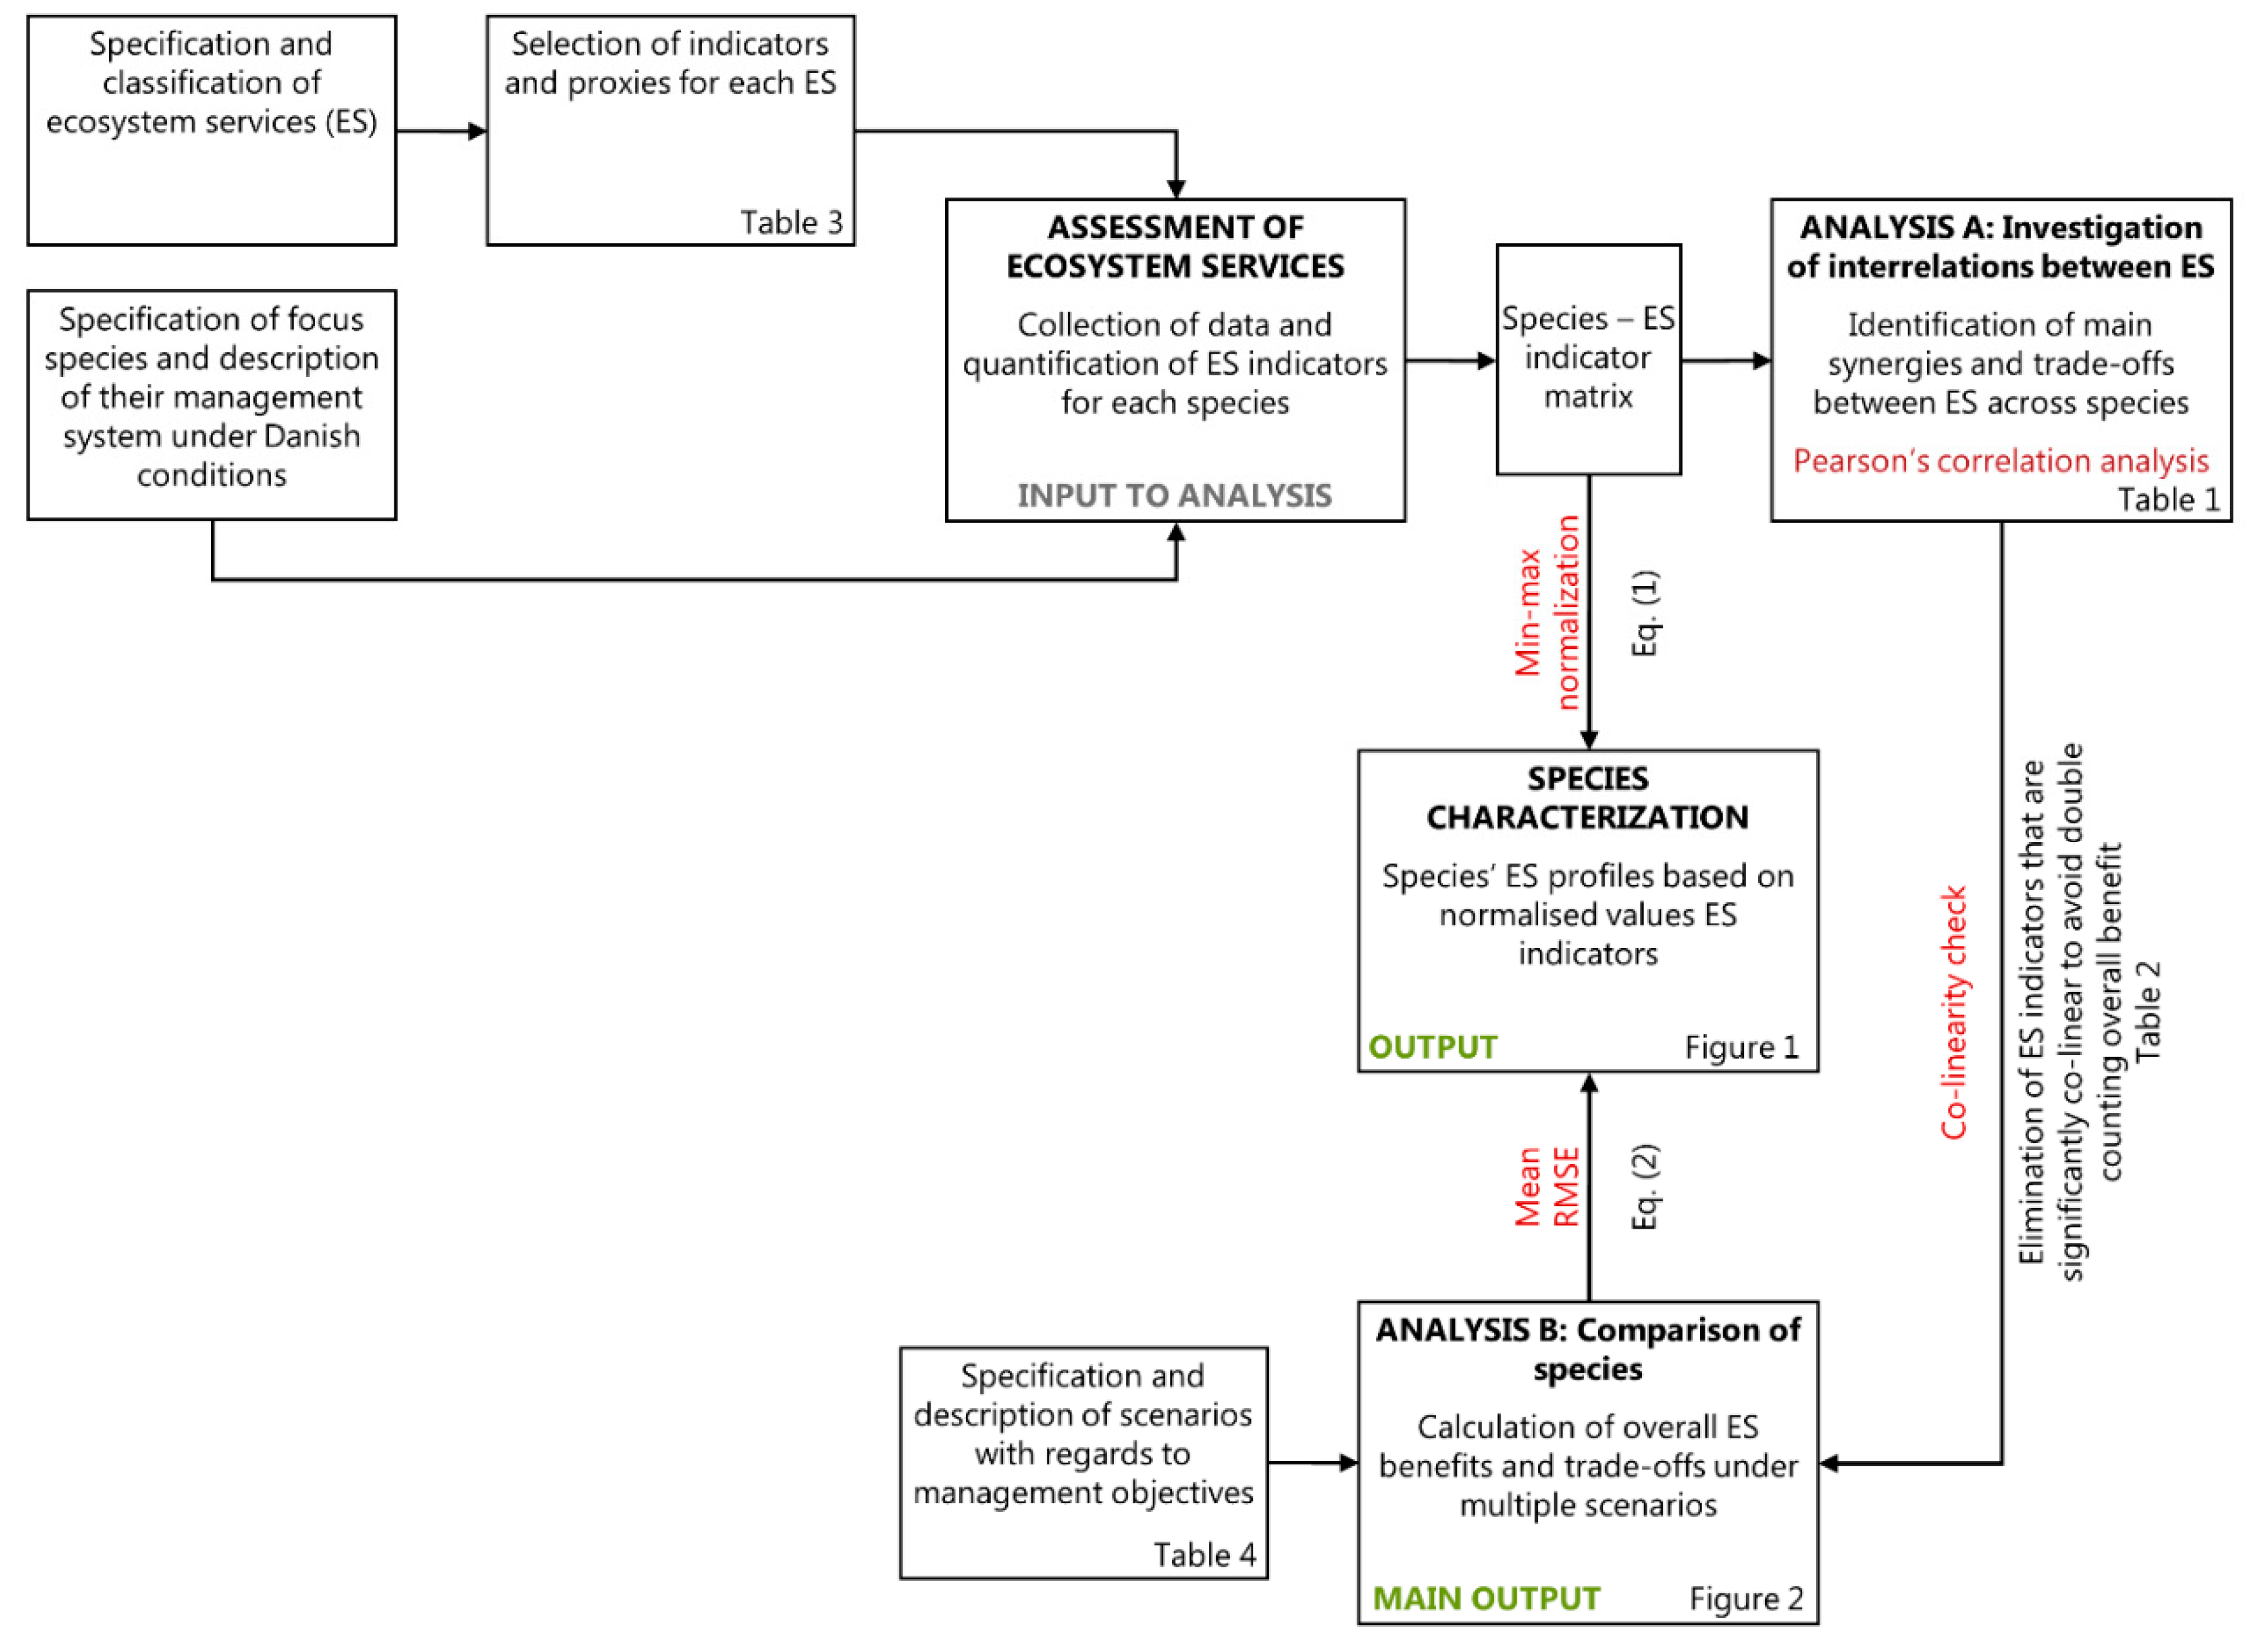
2.4. Analysis
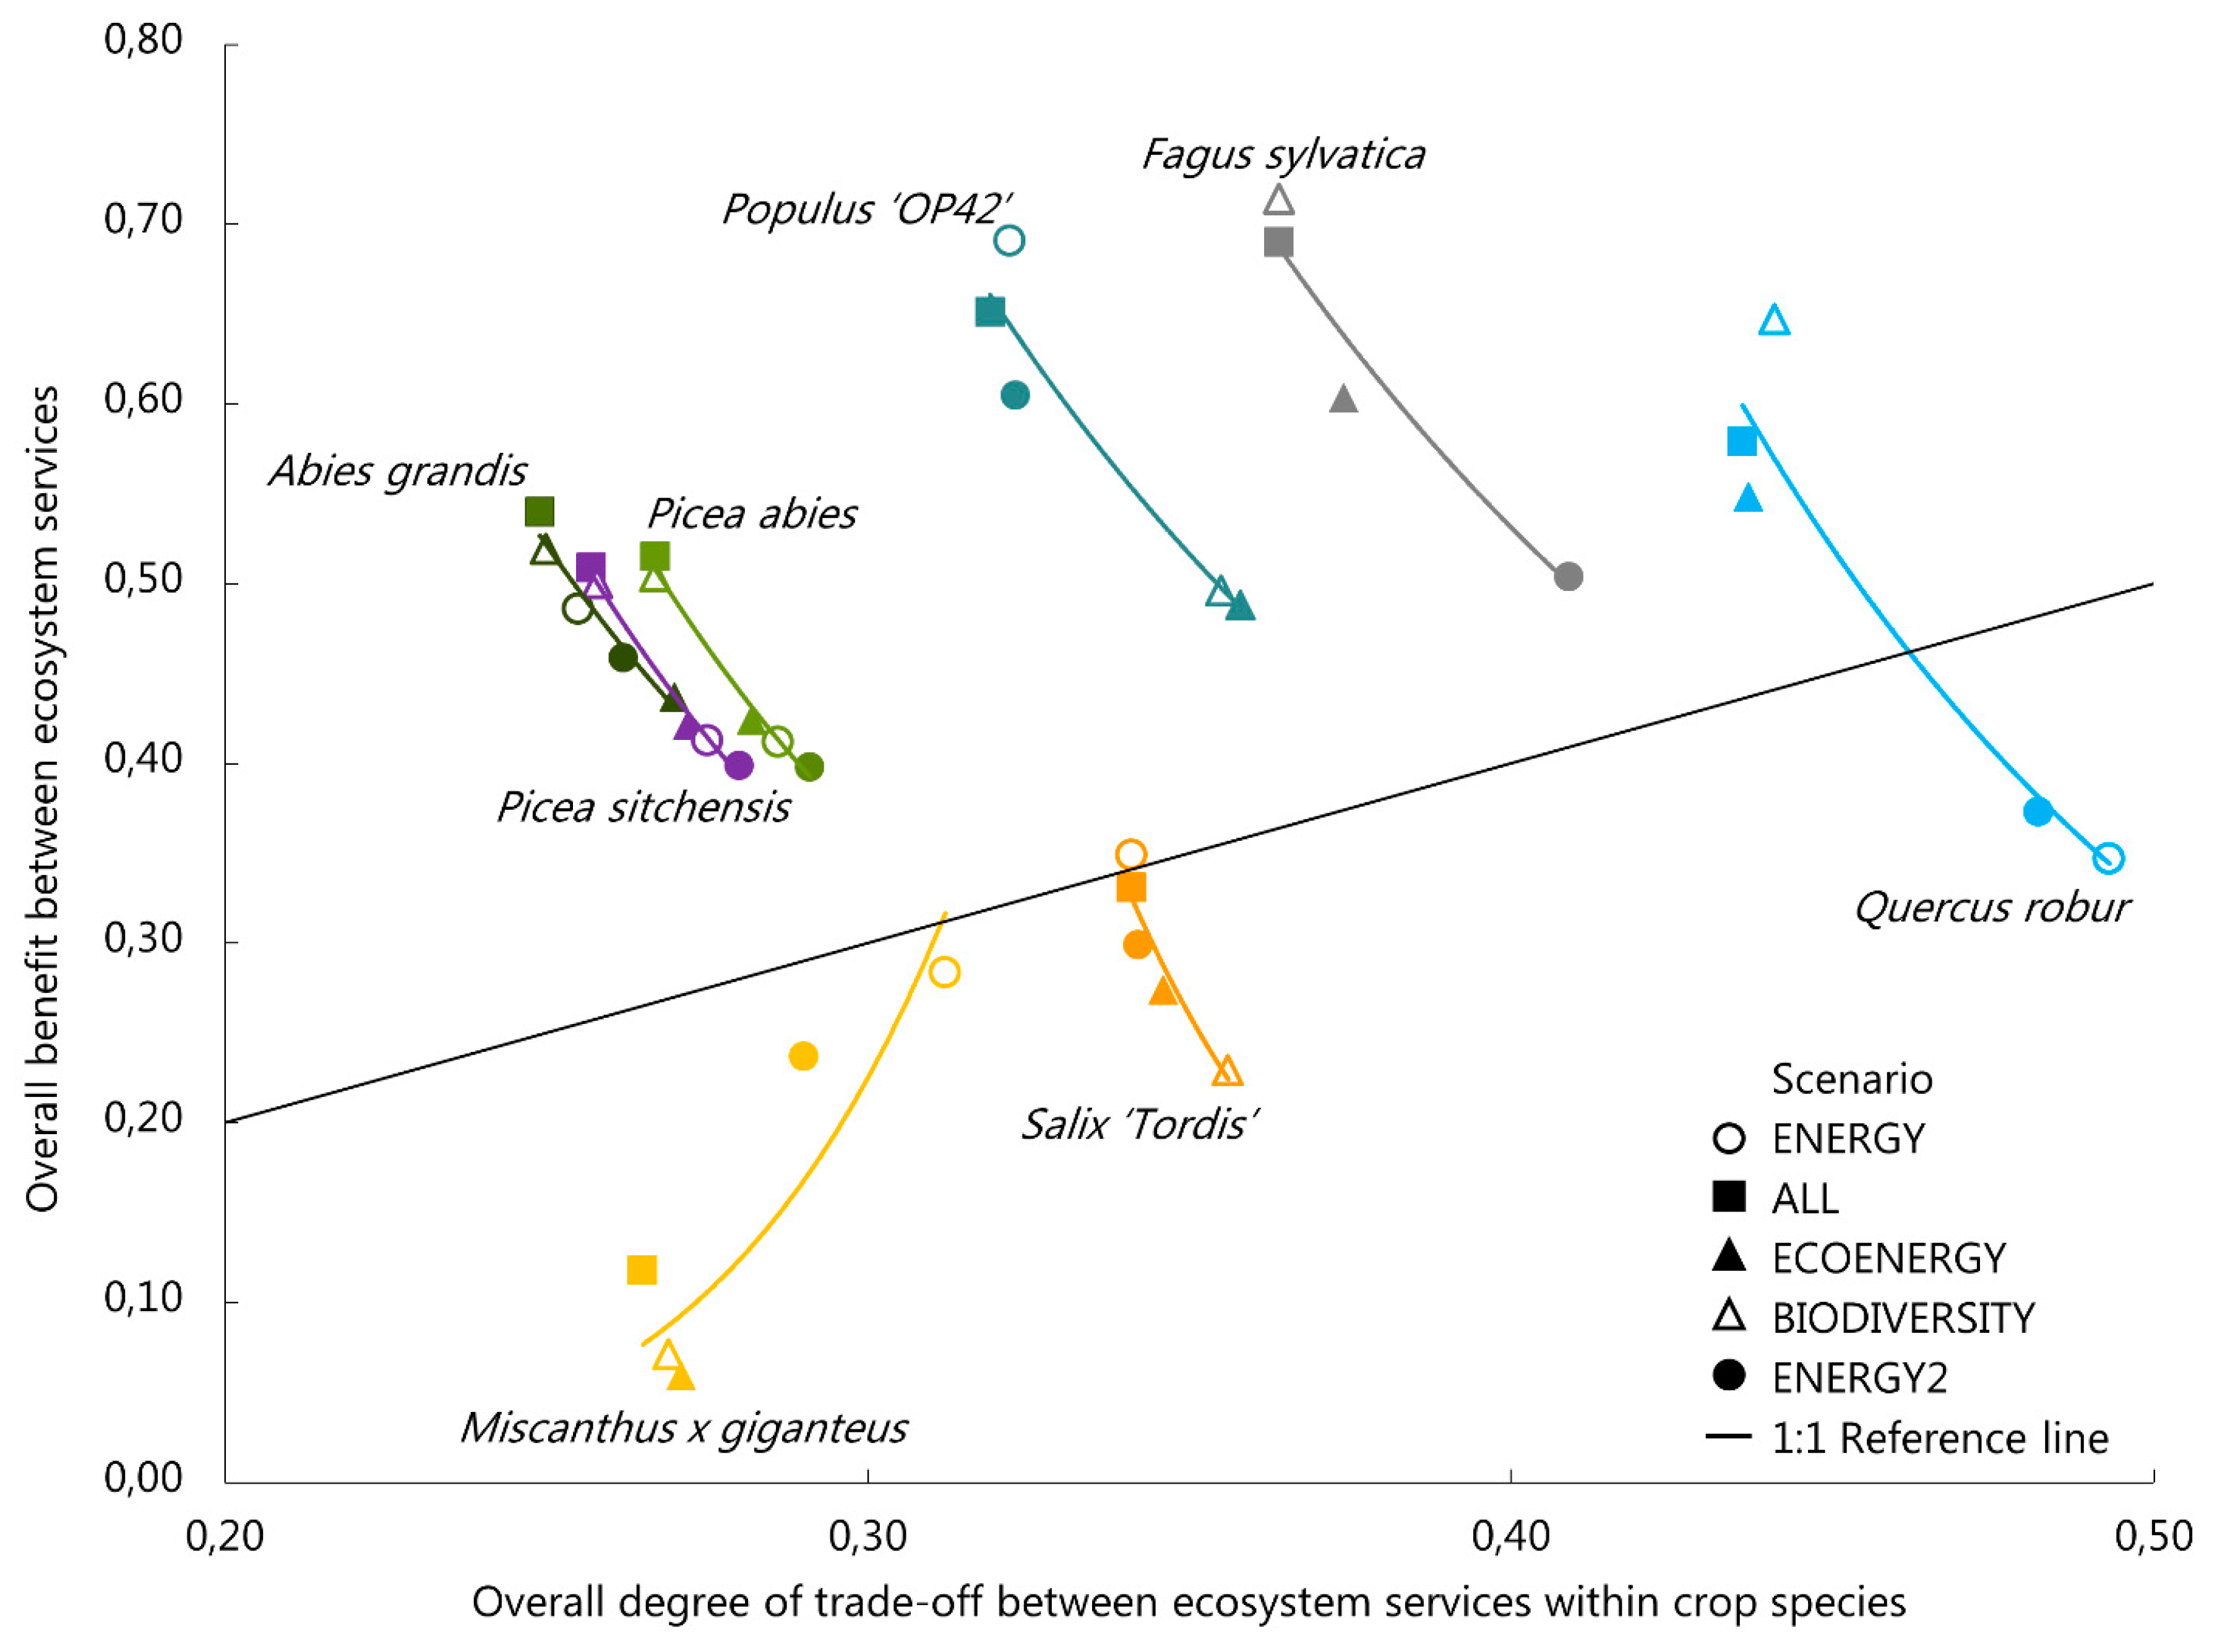
3. Results
4. Discussion
5. Conclusions
Supplementary Materials
Author Contributions
Funding
Conflicts of Interest
References
- Eurostat. Greenhouse Gas Emission Statistics—Emission Inventories; European Commission: Luxemburg, 2017. [Google Scholar]
- European Parliament and the Council. Directive 2009/28/EC of the European Parliament and of the Council of 23 April 2009 on the Promotion of the Use of Energy from Renewable Sources and Amending and Subsequently Repealing Directives 2001/77/EC and 2003/30/EC. In 2009/28/EC; European Parliament and the Council, Ed.; European Parliament and the Council: Brussels, Belgium, 2009; Volume 2009/28/EC. [Google Scholar]
- IPCC. Climate Change 2014: Mitigation of Climate Change. Contribution of Working Group III to the Fifth Assessment Report of the Intergovernmental Panel on Climate Change; Cambridge University Press: Cambridge, UK; New York, NY, USA, 2014. [Google Scholar]
- Beringer, T.; Lucht, W.; Scharphoff, S. Bioenergy production potential of global biomass plantations under environmental and agricultural constraints. GCB Bioenergy 2011, 3, 299–312. [Google Scholar] [CrossRef]
- REN21. Renewables 2018 Global Status Report; REN21 Secretariat: Paris, France, 2018. [Google Scholar]
- Bentsen, N.; Felby, C. Biomass for energy in the European Union—A review of bioenergy resource assessments. Biotechnol. Biofuels 2012, 5, 25. [Google Scholar] [CrossRef] [PubMed] [Green Version]
- Larsen, S.; Jaiswal, D.; Bentsen, N.S.; Wang, D.; Long, S.P. Comparing predicted yield and yield stability of willow and Miscanthus across Denmark. GCB Bioenergy 2016, 8, 1061–1070. [Google Scholar] [CrossRef]
- Danish Energy Agency. Energy Statistics 2016 [in Danish: Energistatistik 2016]; Danish Energy Agency: Copenhagen, Denmark, 2017. [Google Scholar]
- Ericsson, K.; Nilsson, L. Assessment of the potential biomass supply in Europe using a resource-focused approach. Biomass Bioenergy 2006, 30, 1–15. [Google Scholar] [CrossRef] [Green Version]
- Larsen, S.U.; Jørgensen, U.; Kjeldsen, J.B.; Lærke, P.E. Long-term yield effects of establishment method and weed control in willow for short rotation coppice (SRC). Biomass Bioenergy 2014, 71, 266–274. [Google Scholar] [CrossRef]
- Larsen, S.U.; Jørgensen, U.; Lærke, P.E. Willow Yield Is Highly Dependent on Clone and Site. Bioenergy Res. 2014, 7, 1280–1292. [Google Scholar] [CrossRef]
- Larsen, S.U.; Jørgensen, U.; Kjeldsen, J.B.; Lærke, P.E. Effect of fertilisation on biomass yield, ash and element uptake in SRC willow. Biomass Bioenergy 2016, 86, 120–128. [Google Scholar] [CrossRef]
- Sevel, L.; Nord-Larsen, T.; Raulund-Rasmussen, K. Biomass production of four willow clones grown as short rotation coppice on two soil types in Denmark. Biomass Bioenergy 2012, 46, 664–672. [Google Scholar] [CrossRef]
- Sevel, L.; Nord-Larsen, T.; Ingerslev, M.; Jørgensen, U.; Raulund-Rasmussen, K. Fertilization of SRC Willow, I: Biomass Production Response. Bioenergy Res. 2014, 7, 319–328. [Google Scholar] [CrossRef]
- Nord-Larsen, T.; Sevel, L.; Raulund-Rasmussen, K. Commercially Grown Short Rotation Coppice Willow in Denmark: Biomass Production and Factors Affecting Production. Bioenergy Res. 2015, 8, 325–339. [Google Scholar] [CrossRef]
- Georgiadis, P.; Sevel, L.; Raulund-Rasmussen, K.; Stupak, I. Fertilization of Willow Coppice Over Three Consecutive 2-Year Rotations—Effects on Biomass Production, Soil Nutrients and Water. Bioenergy Res. 2017, 10, 728–739. [Google Scholar] [CrossRef]
- Georgiadis, P.; Taeroe, A.; Stupak, I.; Kepfer-Rojas, S.; Zhang, W.; Pinheiro Bastos, R.; Raulund-Rasmussen, K. Fertilization effects on biomass production, nutrient leaching and budgets in four stand development stages of short rotation forest poplar. For. Ecol. Manag. 2017, 397, 18–26. [Google Scholar] [CrossRef]
- Manevski, K.; Lærke, P.E.; Jiao, X.; Santhome, S.; Jørgensen, U. Biomass productivity and radiation utilisation of innovative cropping systems for biorefinery. Agric. For. Meteorol 2017, 233, 250–264. [Google Scholar] [CrossRef]
- Jørgensen, U.; Mortensen, J.; Kjeldsen, J.B.; Schwarz, K.-U. Establishment, Development and Yield Quality of Fifteen Miscanthus Genotypes over Three Years in Denmark. Acta Agric. Scand. Sect. B 2003, 53, 190–199. [Google Scholar] [CrossRef]
- Larsen, S.U.; Jørgensen, U.; Kjeldsen, J.B.; Lærke, P.E. Long-Term Miscanthus Yields Influenced by Location, Genotype, Row Distance, Fertilization and Harvest Season. Bioenergy Res. 2014, 7, 620–635. [Google Scholar] [CrossRef]
- Taeroe, A.; Nord-Larsen, T.; Stupak, I.; Raulund-Rasmussen, K. Allometric Biomass, Biomass Expansion Factor and Wood Density Models for the OP42 Hybrid Poplar in Southern Scandinavia. Bioenergy Res. 2015, 8, 1332–1343. [Google Scholar] [CrossRef]
- Nielsen, U.B.; Madsen, P.; Hansen, J.K.; Nord-Larsen, T.; Nielsen, A.T. Production potential of 36 poplar clones grown at medium length rotation in Denmark. Biomass Bioenergy 2014, 64, 99–109. [Google Scholar] [CrossRef]
- Manning, P.; Taylor, G.; Hanley, M. Bioenergy, Food Production and Biodiversity—An Unlikely Alliance? GCB Bioenergy 2015, 7, 570–576. [Google Scholar] [CrossRef]
- Crutzen, P.J.; Mosier, A.R.; Smith, K.A.; Winiwarter, W. N2O release from agro-biofuel production negates global warming reduction by replacing fossil fuels. Atmos. Chem. Phys. Discuss. 2007, 7, 11191–11205. [Google Scholar] [CrossRef] [Green Version]
- Lupp, G.; Steinhäußer, R.; Bastian, O.; Syearbe, R.-U. Impacts of increasing bioenergy use on ecosystem services on nature and society exemplified in the German district of Görlitz. Biomass Bioenergy 2015, 83, 131–140. [Google Scholar] [CrossRef]
- Koschke, L.; Fürst, C.; Frank, S.; Makeschin, F. A multi-criteria approach for an integrated land-cover-based assessment of ecosystem services provision to support landscape planning. Ecol. Indic. 2012, 21, 54–66. [Google Scholar] [CrossRef]
- Bressler, A.; Vidon, P.; Hirsch, P.; Volk, T. Valuation of ecosystem services of commercial shrub willow (Salix spp.) woody biomass crops. Environ. Monit. Assess. 2017, 189, 137. [Google Scholar] [CrossRef] [PubMed]
- Daily, G.C.; Matson, P.A. Ecosystem services: From theory to implementation. Proc. Natl. Acad. Sci. USA 2008, 105, 9455–9456. [Google Scholar] [CrossRef] [PubMed] [Green Version]
- Turner, K.G.; Odgaard, M.V.; Bøcher, P.K.; Dalgaard, T.; Svenning, J.-C. Bundling ecosystem services in Denmark: Trade-offs and synergies in a cultural landscape. Landsc. Urban Plan. 2014, 125, 89–104. [Google Scholar] [CrossRef]
- Rodriguez, J.P.; Beard, T.D.; Bennett, E.M.; Cumming, G.S.; Cork, S.J.; Agard, J.; Dobson, A.P.; Peterson, G.D. Trade-offs across Space, Time, and Ecosystem Services. Ecol. Soc. 2006, 11, 28. [Google Scholar] [CrossRef] [Green Version]
- Dai, E.-F.; Wang, X.-l.; Zhu, J.-J.; Xi, W.-M. Quantifying ecosystem service trade-offs for plantation forest management to benefit provisioning and regulating services. Ecol. Evol. 2017, 7, 7807–7821. [Google Scholar] [CrossRef]
- Holland, R.A.; Eigenbrod, F.; Muggeridge, A.; Brown, G.; Clarke, D.; Taylor, G. A synthesis of the ecosystem services impact of second generation bioenergy crop production. Renew. Sustain. Energy Rev. 2015, 46, 30–40. [Google Scholar] [CrossRef]
- Tóth, S.F.; McDill, M.E. Finding Efficient Harvest Schedules under Three Conflicting Objectives. For. Sci. 2009, 55, 117–131. [Google Scholar] [CrossRef]
- Borges, J.G.; Marques, S.; Garcia-Gonzalo, J.; Rahman, A.U.; Bushenkov, V.; Sottomayor, M.; Carvalho, P.O.; Nordström, E.-M. A Multiple Criteria Approach for Negotiating Ecosystem Services Supply Targets and Forest Owners’ Programs. For. Sci. 2016, 63, 49–61. [Google Scholar] [CrossRef]
- Turkelboom, F.; Thoonen, M.; Jacobs, S.; García-Llorente, M.; Martín-López, B.; Berry, P. Ecosystem service trade-offs and synergies. In OpenNESS Ecosystem Services Reference Book. EC FP7 Grant Agreement; European Centre for Nature Conservation: Tilburg, The Netherlands, 2016. [Google Scholar]
- Duncker, P.S.; Raulund-Rasmussen, K.; Gundersen, P.; Katzensteiner, K.; De Jong, J.; Ravn, H.P.; Smith, M.; Eckmüllner, O.; Spiecker, H. How Forest Management affects Ecosystem Services, including Timber Production and Economic Return: Synergies and Trade-Offs. Ecol. Soc. 2012, 17, 50. [Google Scholar] [CrossRef] [Green Version]
- Millennium Ecosystem Assessment. Ecosystems and Human Well-Being: Synthesis; Island Press: Washington, DC, USA, 2005. [Google Scholar]
- Dale, B.E.; Anderson, J.E.; Brown, R.C.; Csonka, S.; Dale, V.H.; Herwick, G.; Jackson, R.D.; Jordan, N.; Kaffka, S.; Kline, K.L.; et al. Take a Closer Look: Biofuels Can Support Environmental, Economic and Social Goals. Environ. Sci. Technol. 2014, 48, 7200–7203. [Google Scholar] [CrossRef] [PubMed]
- Jørgensen, U. Benefits versus risks of growing biofuel crops: The case of Miscanthus. Curr. Opin. Environ. Sustain. 2011, 3, 24–30. [Google Scholar] [CrossRef]
- Heaton, E.A.; Dohleman, F.G.; Miguez, A.F.; Juvik, J.A.; Lozovaya, V.; Widholm, J.; Zabotina, O.A.; McIsaac, G.F.; David, M.B.; Voigt, T.B.; et al. Chapter 3—Miscanthus: A Promising Biomass Crop. In Advances in Botanical Research; Kader, J.-C., Delseny, M., Eds.; Academic Press: Cambridge, MA, USA, 2010; Volume 56, pp. 75–137. [Google Scholar]
- Voigt, T.B. Are the environmental benefits of Miscanthus × giganteus suggested by early studies of this crop supported by the broader and longer-term contemporary studies? GCB Bioenergy 2015, 7, 567–569. [Google Scholar] [CrossRef] [Green Version]
- Haughton, A.J.; Bond, A.J.; Lovett, A.A.; Dockerty, T.; Sünnenberg, G.; Clark, S.J.; Bohan, D.A.; Sage, R.B.; Mallott, M.D.; Mallott, V.E.; et al. A novel, integrated approach to assessing social, economic and environmental implications of changing rural land-use: A case study of perennial biomass crops. J. Appl. Ecol. 2009, 46, 315–322. [Google Scholar] [CrossRef]
- Boehmel, C.; Lewandowski, I.; Claupein, W. Comparing annual and perennial energy cropping systems with different management intensities. Agric. Syst. 2008, 96, 224–236. [Google Scholar] [CrossRef]
- Hillier, J.; Whittaker, C.; Dailey, G.; Aylott, M.; Casella, E.; Richter, G.M.; Riche, A.; Murphy, R.; Taylor, G.; Smith, P. Greenhouse gas emissions from four bioenergy crops in England and Wales: Integrating spatial estimates of yield and soil carbon balance in life cycle analyses. GCB Bioenergy 2009, 1, 267–281. [Google Scholar] [CrossRef]
- Semere, T.; Slater, F.M. Ground flora, small mammal and bird species diversity in miscanthus (Miscanthus×giganteus) and reed canary-grass (Phalaris arundinacea) fields. Biomass Bioenergy 2007, 31, 20–29. [Google Scholar] [CrossRef]
- Venendaal, R.; Jørgensen, U.; Foster, C.A. European energy crops: A synthesis. Biomass Bioenergy 1997, 13, 147–185. [Google Scholar] [CrossRef]
- Tullus, H.; Tullus, A.; Rytter, L. Short-rotation Forestry for Supplying Biomass for Energy Production. In Forest BioEnergy Production: Management, Carbon Sequestration and Adaptation; Kellomäki, S., Kilpeläinen, A., Alam, A., Eds.; Springer: New York, NY, USA, 2013. [Google Scholar]
- Rytter, L.; Johansson, K.; Karlsson, B.; Stener, L.-G. Tree Species, Genetics and Regeneration for Bioenergy Feedstock in Northern Europe. In Forest BioEnergy Production: Management, Carbon Sequestration and Adaptation; Kellomäki, S., Kilpeläinen, A., Alam, A., Eds.; Springer: New York, NY, USA, 2013. [Google Scholar]
- Routa, J.; Pyörälä, P.; Alam, A.; Kilpeläinen, A.; Peltola, H.; Kellomäki, S. Integrated Production of Timber and Energy Biomass in Forestry. In Forest BioEnergy Production: Management, Carbon Sequestration and Adaptation; Kellomäki, S., Kilpeläinen, A., Alam, A., Eds.; Springer: New York, NY, USA, 2013. [Google Scholar]
- Larsen, J.B.; Raulund-Rasmussen, K.; Callesen, I. Ecology of tree species and species selection [In Danish: Træartsvalget—De enkelte træarters økologi]. In Naturnær Skovdrift; Larsen, J.B., Ed.; Dansk Skovforening: Frederiksberg, Denmark, 2005; pp. 139–169. [Google Scholar]
- Nord-Larsen, T.; Pretzsch, H. Biomass production dynamics for common forest tree species in Denmark—Evaluation of a common garden experiment after 50years of measurements. For. Ecol. Manag. 2017, 400, 645–654. [Google Scholar] [CrossRef]
- Taeroe, A.; Mustapha, W.F.; Stupak, I.; Raulund-Rasmussen, K. Do forests best mitigate CO2 emissions to the atmosphere by setting them aside for maximization of carbon storage or by management for fossil fuel substitution? J. Environ. Manag. 2017, 197, 117–129. [Google Scholar] [CrossRef]
- Mackey, B.; Prentice, I.C.; Steffen, W.; House, J.I.; Lindenmayer, D.; Keith, H.; Berry, S. Untangling the confusion around land carbon science and climate change mitigation policy. Nat. Clim. Chang. 2013, 3, 552–557. [Google Scholar] [CrossRef]
- Lindner, M.; Böttcher, H. Managing forest plantations for carbon sequestration today and in the future. In Ecosystem Goods and Services from Plantation Forests; Routledge: London, UK, 2010; pp. 59–92. [Google Scholar]
- Wäldchen, J.; Schulze, E.-D.; Schöning, I.; Schrumpf, M.; Sierra, C. The influence of changes in forest management over the past 200years on present soil organic carbon stocks. For. Ecol. Manag. 2013, 289, 243–254. [Google Scholar] [CrossRef]
- Lippke, B.; Gustafson, R.; Venditti, R.; Steele, P.; Volk, T.A.; Oneil, E.; Johnson, L.; Puettmann, M.E.; Skog, K. Comparing Life-Cycle Carbon and Energy Impacts for Biofuel, Wood Product, and Forest Management Alternatives. For. Prod. J. 2012, 62, 247–257. [Google Scholar] [CrossRef]
- IPCC. 2006 IPCC Guidelines for National Greenhouse Gas Inventories, Prepared by the National Greenhouse Gas Inventories Programme; IGES: Kanagawa, Japan, 2006. [Google Scholar]
- Sathre, R.; O’Connor, J. Meta-analysis of greenhouse gas displacement factors of wood product substitution. Environ. Sci. Policy 2010, 13, 104–114. [Google Scholar] [CrossRef]
- Baxter, X.C.; Darvell, L.I.; Jones, J.M.; Barraclough, T.; Yates, N.E.; Shield, I. Miscanthus combustion properties and variations with Miscanthus agronomy. Fuel 2014, 117, 851–869. [Google Scholar] [CrossRef] [Green Version]
- Raulund-Rasmussen, K.; Stupak, I.; Clarke, N.; Callesen, I.; Helmisaari, H.-S.; Karltun, E.; Varnagiryte-Kabasinskiene, I. Effects of Very Intensive Forest Biomass Harvesting on Short and Long Term Site Productivity. In Sustainable Use of Forest Biomass for Energy; Röser, D., Asikainen, A., Raulund-Rasmussen, K., Stupak, I., Eds.; Springer: Dordrecht, The Netherlands, 2008; Volume 12, pp. 29–78. [Google Scholar]
- Miller, S.A. Minimizing Land Use and Nitrogen Intensity of Bioenergy. Environ. Sci. Technol. 2010, 44, 3932–3939. [Google Scholar] [CrossRef]
- TEEB. The Economics of Ecosystems and Biodiversity: Mainstreaming the Economics of Nature: A Synthesis of the Approach, Conclusions and Recommendations of TEEB; UNEP: Ginebra, Switzerland, 2010. [Google Scholar]
- Filyushkina, A.; Strange, N.; Löf, M.; Ezebilo, E.E.; Boman, M. Applying the Delphi method to assess impacts of forest management on biodiversity and habitat preservation. For. Ecol. Manag. 2018, 409, 179–189. [Google Scholar] [CrossRef]
- Lindborg, R.; Stenseke, M.; Cousins, S.A.O.; Bengtsson, J.; Berg, Å.; Gustafsson, T.; Sjödin, N.E.; Eriksson, O. Investigating biodiversity trajectories using scenarios—Lessons from two contrasting agricultural landscapes. J. Environ. Manag. 2009, 91, 499–508. [Google Scholar] [CrossRef]
- Edwards, D.M.; Jay, M.; Jensen, F.S.; Lucas, B.; Marzano, M.; Montagné, C.; Peace, A.; Weiss, G. Public Preferences Across Europe for Different Forest Stand Types as Sites for Recreation. Ecol. Soc. 2012, 17, 27. [Google Scholar] [CrossRef]
- Boll, T.; von Haaren, C.; Rode, M. The effects of short rotation coppice on the visual landscape. In Bioenergy from Dendromass for the Sustainable Development of Rural Areas; Manning, D.B., Bemmann, A., Bredemeier, M., Lamersdorf, N., Ammer, C., Eds.; John Wiley & Sons: Hoboken, NJ, USA, 2015. [Google Scholar]
- Filyushkina, A.; Agimass, F.; Lundhede, T.; Strange, N.; Jacobsen, J.B. Preferences for variation in forest characteristics: Does diversity between stands matter? Ecol. Econ. 2017, 140, 22–29. [Google Scholar] [CrossRef]
- Nielsen, A.B.; Olsen, S.B.; Lundhede, T. An economic valuation of the recreational benefits associated with nature-based forest management practices. Landsc. Urban Plan. 2007, 80, 63–71. [Google Scholar] [CrossRef]
- Bradford, J.B.; D’Amato, A.W. Recognizing trade-offs in multi-objective land management. Front. Ecol. Environ. 2012, 10, 210–216. [Google Scholar] [CrossRef] [Green Version]
- Danish Council on Climate Change. The Role of Biomass in the Green Transition (in Danish: Biomassens Betydning for Grøn Omstilling); Klimarådet: Copenhagen, Denmark, 2018. [Google Scholar]
- Energistyearelsen. Basisfremskrivning 2019 [In Danish]; Dansih Energy Agency: Copenhagen, Denmark, 2019. [Google Scholar]
- Nordström, E.-M.; Nieuwenhuis, M.; Başkent, E.Z.; Biber, P.; Black, K.; Borges, J.G.; Bugalho, M.N.; Corradini, G.; Corrigan, E.; Eriksson, L.O.; et al. Forest decision support systems for the analysis of ecosystem services provisioning at the landscape scale under global climate and market change scenarios. Eur. J. For. Res. 2019, 138, 561–581. [Google Scholar] [CrossRef]
- Rosenbaum, K. Discussion—Forestry in the new millennium: Creating a Vision that Fits. In A Vision for the U.S. Forest Service: Goals for the Next Century; Sedjo, R.A., Ed.; Resources for the Future: Washington, DC, USA, 2000. [Google Scholar]


| Category | Ecosystem Service | Indicators and Proxies | Unit |
|---|---|---|---|
| provisioning | biomass based energy | productivity | t ha−1 yr−1 |
| biomass based energy | energy yield | GJ ha−1 yr−1 | |
| regulating | climate regulation | total carbon stock | t C ha−1 |
| climate regulation | saved emission | t C ha−1 yr−1 | |
| soil fertility | minimum nitrogen requirement | kg N ha−1 yr−1 | |
| soil fertility | nitrogen use efficiency | Gradient | |
| supporting | biodiversity | biodiversity score | 1–20 |
| biodiversity | conservation potential | % | |
| cultural | landscape | land use intensity | ha TJ−1 |
| aesthetics | aesthetic score | 0–20 | |
| recreation | recreation score | 0–10 |
| Acronym | Primary Objective(s) | Indicator(s) Weighted | Multiplier for the Indicator(s) Benefit | |
|---|---|---|---|---|
| Base scenario. | ENERGY | energy production | saved emission | 4 |
| Alternative scenario1 | ALL | - | all are equal | - |
| Alternative scenario2 | ECOENERGY | conservation with a focus on energy production | conservation potential and Saved emission | 4 and 2, respectively |
| Alternative scenario3 | BIODIVERSITY | conservation | conservation potential | 4 |
| Alternative scenario4 | ENERGY2 | energy production with a focus on conservation | saved emission and conservation potential | 4 and 2, respectively |
| Transformation | Log | Log | Log | Log | Log | Log | 4√ | Log | Log | 4√ | 4√ |
|---|---|---|---|---|---|---|---|---|---|---|---|
| Productivity | Best Energy Yield | Total Carbon Stock | Saved Emissions | MNR | NUE | Biodiversity | Conservation Potential | LUI | Recreation | Aesthetics | |
| productivity | |||||||||||
| best Energy Yield | |||||||||||
| total carbon stock | |||||||||||
| saved emission | |||||||||||
| mnr | |||||||||||
| nue | |||||||||||
| biodiversity score | |||||||||||
| conservation potential | |||||||||||
| lui | |||||||||||
| recreation score | |||||||||||
| legend | + | strong | modest | weak | none | - | strong | modest | weak | none |
| Significant Co-Linearity (>±0.7) | R2 | Ruled Out |
|---|---|---|
| Productivity - Saved emission | 0.7214 | Productivity |
| Best Energy Yield - Saved emission | 0.9703 | Best Energy Yield |
| Best Energy Yield- LUI | 0.8200 | Best Energy Yield |
| Saved emission- LUI | 0.8016 | LUI |
| MNR- NUE | 0.9937 | MNR |
| Biodiversity score - Aesthetics | 0.8710 | Biodiversity score |
© 2020 by the authors. Licensee MDPI, Basel, Switzerland. This article is an open access article distributed under the terms and conditions of the Creative Commons Attribution (CC BY) license (http://creativecommons.org/licenses/by/4.0/).
Share and Cite
Sántha, E.; Bentsen, N.S. Ecosystem Service Benefits and Trade-Offs—Selecting Tree Species in Denmark for Bioenergy Production. Forests 2020, 11, 277. https://doi.org/10.3390/f11030277
Sántha E, Bentsen NS. Ecosystem Service Benefits and Trade-Offs—Selecting Tree Species in Denmark for Bioenergy Production. Forests. 2020; 11(3):277. https://doi.org/10.3390/f11030277
Chicago/Turabian StyleSántha, Eszter, and Niclas Scott Bentsen. 2020. "Ecosystem Service Benefits and Trade-Offs—Selecting Tree Species in Denmark for Bioenergy Production" Forests 11, no. 3: 277. https://doi.org/10.3390/f11030277