Article

Causes of Decline in the Korean Fir Based on Spatial Distribution in the Mt. Halla Region in Korea: A Meta-Analysis

Research Department for Hallasan, World Heritage Office, 72 Sumokwon-gil, Jeju-si, Jeju Special Self-Governing Province, Jeju 63143, Korea
*
Author to whom correspondence should be addressed.
Forests 2020, 11(4), 391; https://doi.org/10.3390/f11040391
Submission received: 24 February 2020 / Revised: 20 March 2020 / Accepted: 28 March 2020 / Published: 1 April 2020
(This article belongs to the Section Forest Ecology and Management)

Abstract

:
Research Highlights: Technology advances have allowed for a new approach to research the decline of the Korean fir (Abies koreana E.H.Wilson). This study provides insights into the exact causes leading to this decline. Background and Objectives: Various factors could lead to the decline of fir trees around Mt. Halla, Korea, but these have not yet been verified. Here, the Korean fir across Mt. Halla were classified as dead or living and mapped using high-resolution orthorectified aerial images and three-dimensional (3D) stereoplotting. Materials and Methods: Aerial photographs were used to map spatial distribution and analyze the distribution patterns and mortality of the Korean fir. The electronic stereoplotting program (Geo3Di-PRO) enabled the creation of 3D images from aerial photographs. General, altitudinal, and topographical distribution was assessed. Results: Their accumulated percent mortality rate (APMR) showed positive correlations with altitude and tree density, a negative correlation with terrain slope, and no consistent correlation with solar radiation. The results indicate that increases in the density of Korean firs are related to decreased growth in areas at high altitude, on gentle slopes, and with high solar radiation. Consistent positive correlations between density and APMR indicate that fir mortality can be attributed to environmental deterioration and the establishment of unfavorable growth conditions. Areas with high APMR and density had gentle slopes, thus high soil moisture, or relatively high annual precipitation owing to high altitude. Conclusion: Fir mortality on Mt. Halla can be attributed to long-term persistently high rainfall and subsequent excess soil moisture.

1. Introduction

The Korean fir (Abies koreana) trees are among the key alpine plants scattered across the Korean Peninsula and are an indicator species for climate change [1]. The Korean fir trees on Mt. Halla, South Korea, have been the subject of regular research, since they were first reported in the 1920s [2]. In particular, the massive decline or death of them was of interest to many botanists and ecologists, as well as to the general public. In previous studies, several factors have been cited as the cause of their decline, including typhoons and spring droughts [3,4,5], microclimate factors related to individual trees [6], increased moisture stress owing to the dry climate during winter [7] or the subsequent moisture imbalance [8], and a combination of high wind-induced root shaking, soil erosion owing to intense precipitation, and heavy snow during the winter season [1,9]. There is a consensus among these studies that the decline of the Korean fir can be largely attributed to climate change, but a detailed account about the climate-induced factors that have affected its growth and survival is still required. Previous studies have also failed to provide coherent explanations for the decline of the Korean fir across the Mt. Halla region. For these reasons, and because the species is only found on the Korean Peninsula, clarification of the cause of decline of the Korean fir is important for the conservation of this population of Korean fir.
In general, topography has a great influence on local plant diversity and its distribution patterns [10]. The preferred areas of individual plant species may also vary depending on the variations in a number of factors, such as soil moisture, solar radiation, soil temperature, and soil salinity, resulting from topographic heterogeneity [11,12,13,14,15]. Similarly, the current decline of the Korean fir on Mt. Halla needs to be understood in the context of a change in the preferred areas of the Korean fir as a consequence of climate change [16].
Previous studies dealing with the spatial distribution of the Korean fir have been conducted selectively in specific study areas with high-density, extensive, pure stands of Korean fir [17,18,19]. As a complement to this, recent studies have utilized aerial photographs or satellite images to examine the changing patterns in the distribution of the Korean fir [20,21,22,23,24].
Given that the mortality and density of the Korean fir on Mt. Halla varies depending on the aspect of the land on which the trees are growing, as reported in previous studies [9,21,23,25], a comprehensive analysis of the entirety of the Mt. Halla region is warranted, so as to identify the overall distribution of the Korean fir on the mountain. Recently obtainable high-resolution (at least 10 cm) aerial photographs, along with the commercialization of electronic stereoplotting instruments, have enabled the identification of individual trees and the mapping of arbors, such as fir (e.g., References [25,26]).
In this study, high-resolution aerial photographs and an electronic stereoplotting program were utilized to map the locations of the individual Korean fir trees across the whole of the Mt. Halla region and to analyze the spatial distribution of the species at different aspects and altitudes. Based on the analysis, this study examined the relationship between the distribution of the Korean fir and topographic factors, such as terrain slope and solar radiation, to infer the causes of the decline. If the characteristics of the habitat suitable for Korean fir growth, as well as the causes for decline, can be determined by analyzing the spatial distribution of the Korean fir trees, then the resulting findings are expected to help in developing policies for the future management of the Korean fir and the long-term preservation of forest vegetation in the Mt. Halla region (e.g., References [12,16,27]).

2. Material and Methods
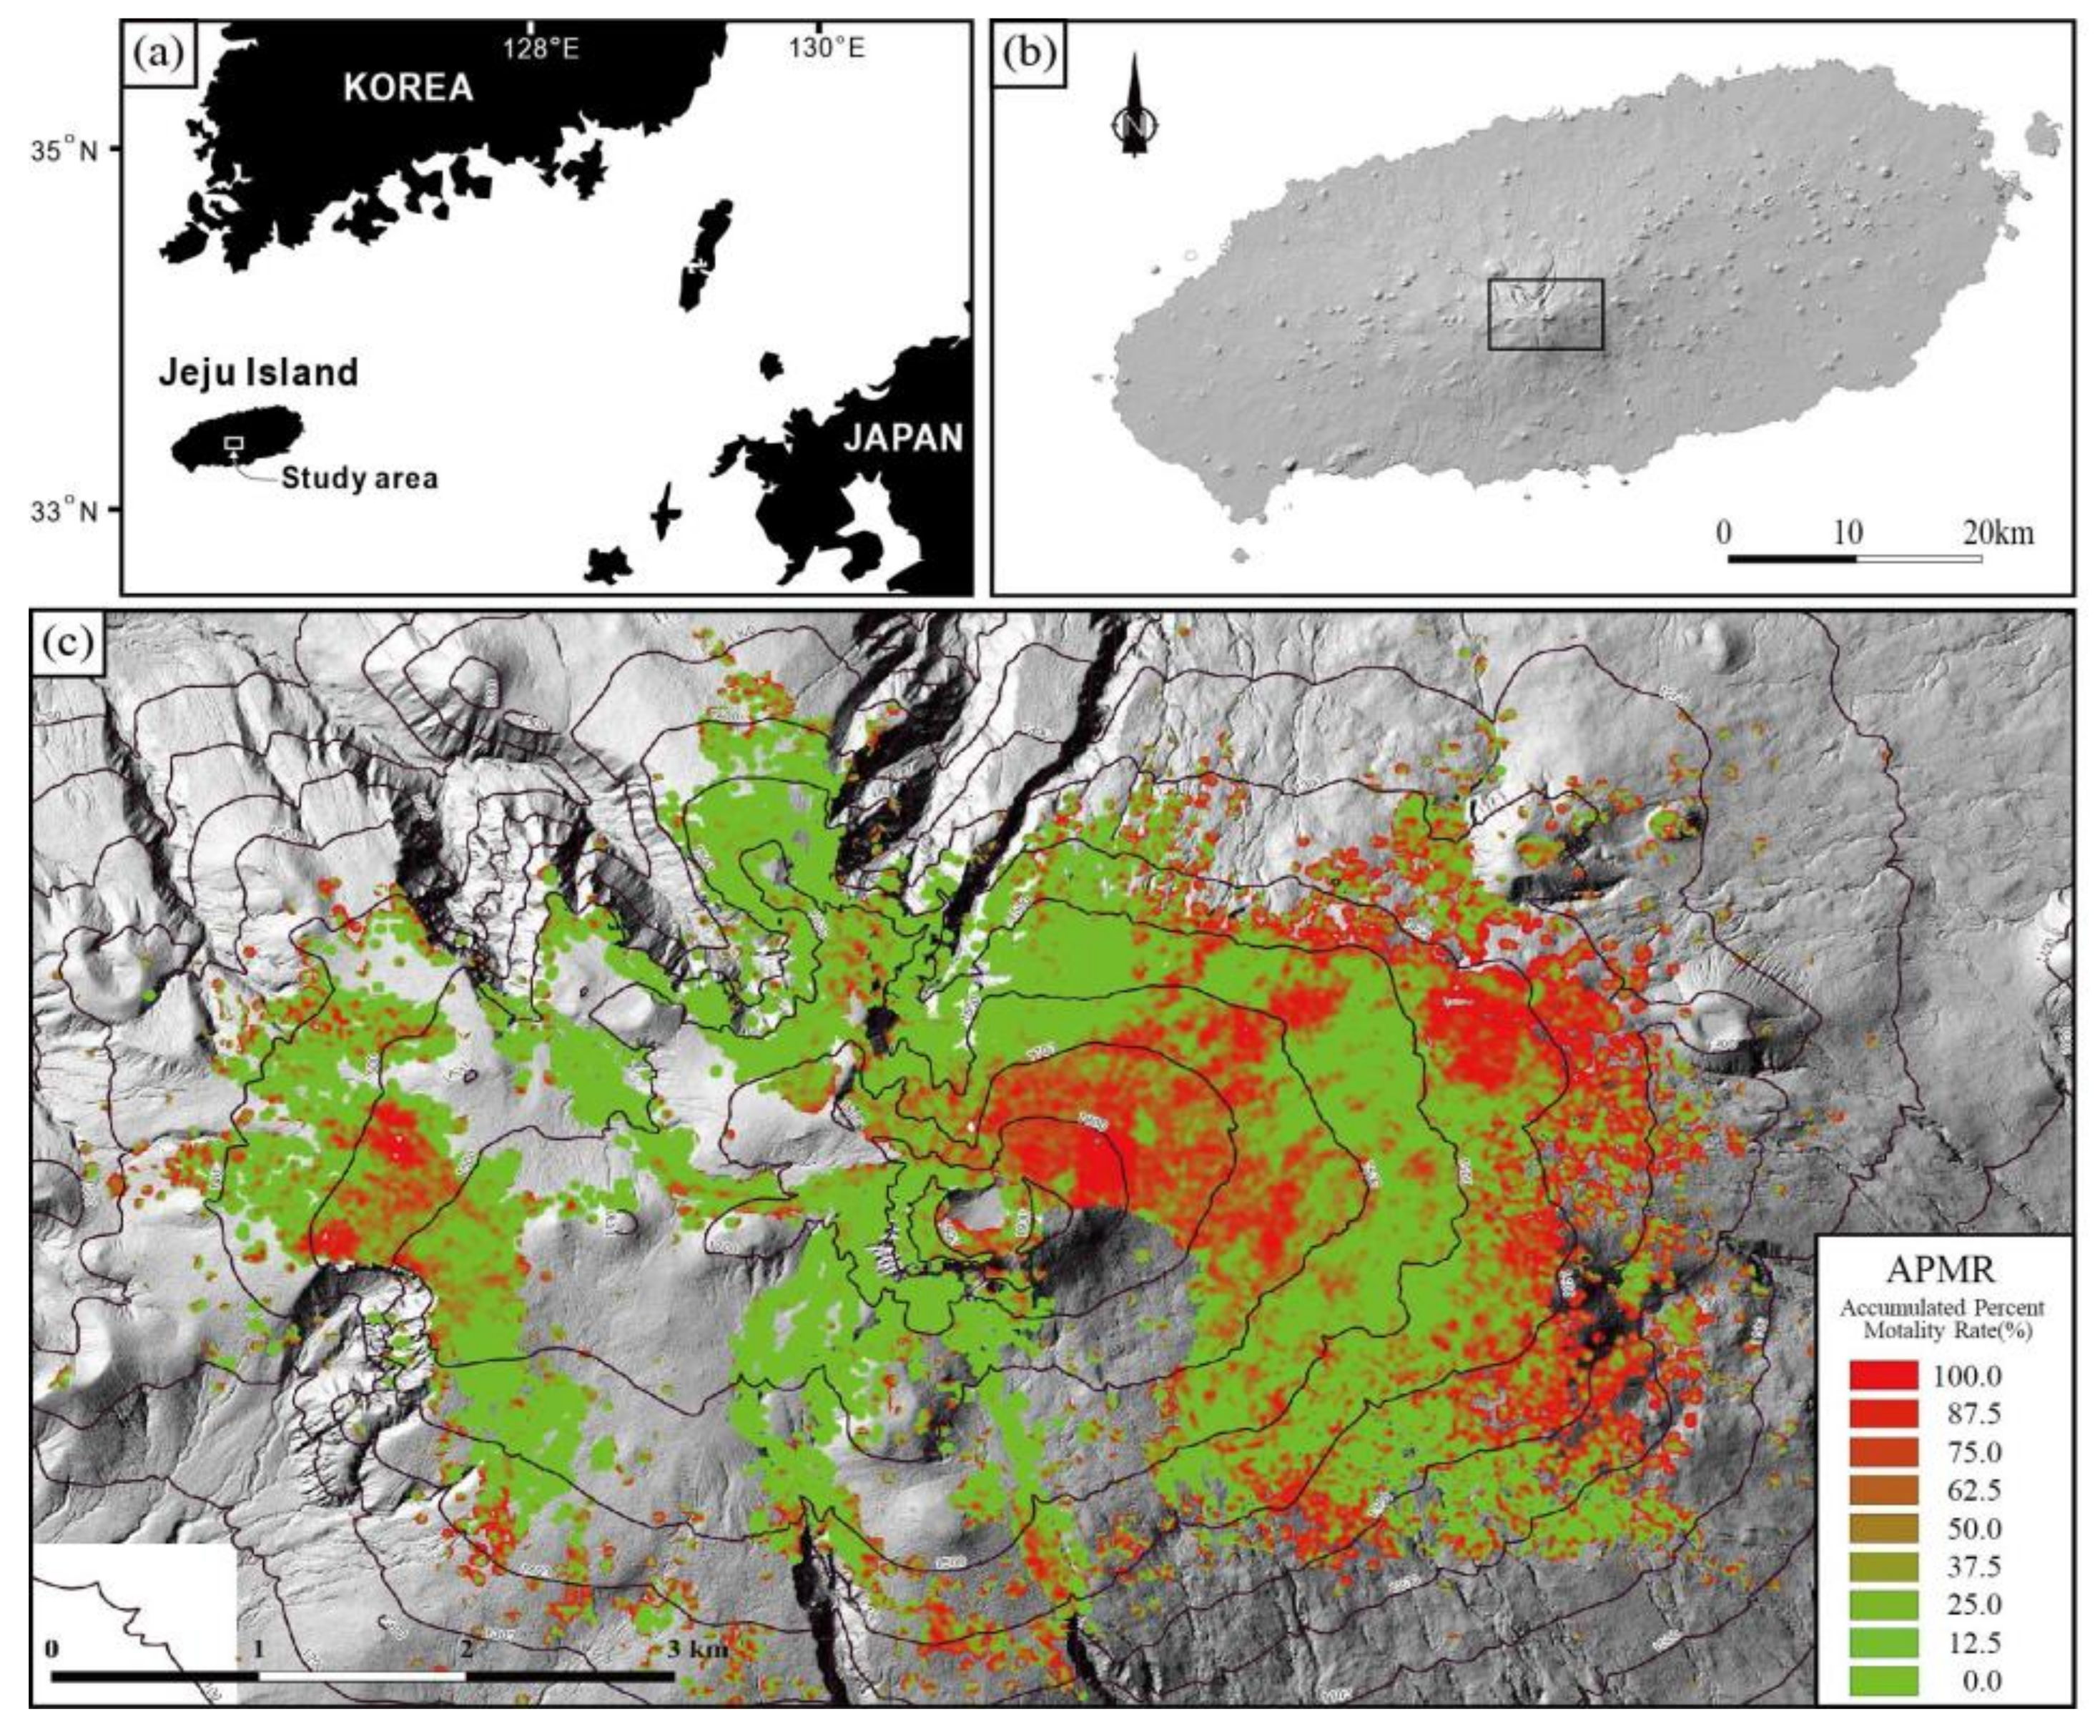
2.1. Study Area

This study was conducted in a 55.08 km2 (9 × 6.12 km) area (33°20′17″ N–33°23′25″ N; 126°28′59″ E–126°35′27″ E) within the Hallasan Natural Reserve Area, Jeju Special Self-Governing Province, Korea (Figure 1). This area is situated at an altitude higher than 1000 m above sea level. Jeju Island is located at the southern part of the Korean Peninsula. It is surrounded by sea and has a subtropical maritime climate in the coastal areas which changes into a subalpine climate with an increasing altitude towards the summit of Mt. Halla (1950 m) in the center of Jeju Island. The island lies within a belt of westerly winds that blow off the eastern shore of Eurasia. The weather and climate vary greatly depending on the aspect and altitude of Mt. Halla. For the 15 year period 2003–2017, the average annual temperatures vary approximately, from 15 to 17 °C in the coastal region (<200 m), from 13 to 14 °C in the mid-mountain region (200 to <600 m), and 12 °C in the mountain region (≥600 m above sea level). The average annual temperature lapse rates were −0.61 °C/100 m on the northern aspects, and −0.68 °C/100 m on the southern aspects of Mt. Halla. The annual rainfall ranged from 1130 to 2200 mm in the coastal region, from 1960 to 2340 mm in the mid-mountain region, and from 3190 to 5870 mm in the mountain region, showing a tendency to increase by approximately 230 mm/100 m with the increasing altitude [28]. The southeastern aspect of Mt. Halla tends to receive more rainfall than the northwestern aspect (e.g., Reference [25]). The natural vegetation types are deciduous broad-leaved forests (650–1400 m), and shrub forests (>1400 m) along the altitudinal gradient in the study area. This study focused on the area dominated by Korean fir, i.e., >1100 m altitude.

2.2. Mapping the Spatial Distribution of the Korean Fir

This study utilized aerial photographs with a resolution of 8 cm to map the locations of the individual live (live firs) and dead Korean fir (dead firs) within the study area. The aerial photographs were taken using UltraCam XP, an aerial camera system (Microsoft), in mid-April 2017, before the leaves of the broad-leaved trees in the Mt. Halla region had appeared, in order to discriminate between the evergreen coniferous trees and deciduous broad-leaved trees. The electronic stereoplotting program (Geo3Di-PRO) enabled the creation of three-dimensional (3D) images from aerial photographs, where the unique conical shape of the firs was used to distinguish the firs from other evergreen coniferous trees, such as yews or pines [25,26]. It was not possible to distinguish the species of live coniferous trees that were less than 1 m in height, and therefore, the live firs that were less than 1 m were excluded from the mapping. The dead firs were mapped using the same method. The locations of the live and dead firs were plotted using a CAD program (Autodesk AutoCAD 2018) together with an electronic stereoplotting program.

2.3. Distribution Map of the Accumulated Percent Mortality Rate for Korean Fir on Mt. Halla

A distribution map of the accumulated percent mortality rate (APMR) was created to visualize the current decline of Korean fir across the Mt. Halla region. The distribution map was prepared by calculating the ratio of live Korean fir trees to total number of Korean fir trees (live + dead) within a radius of 30 m around each mapped Korean fir tree, using the QGIS 2.18 software (Figure 1c).

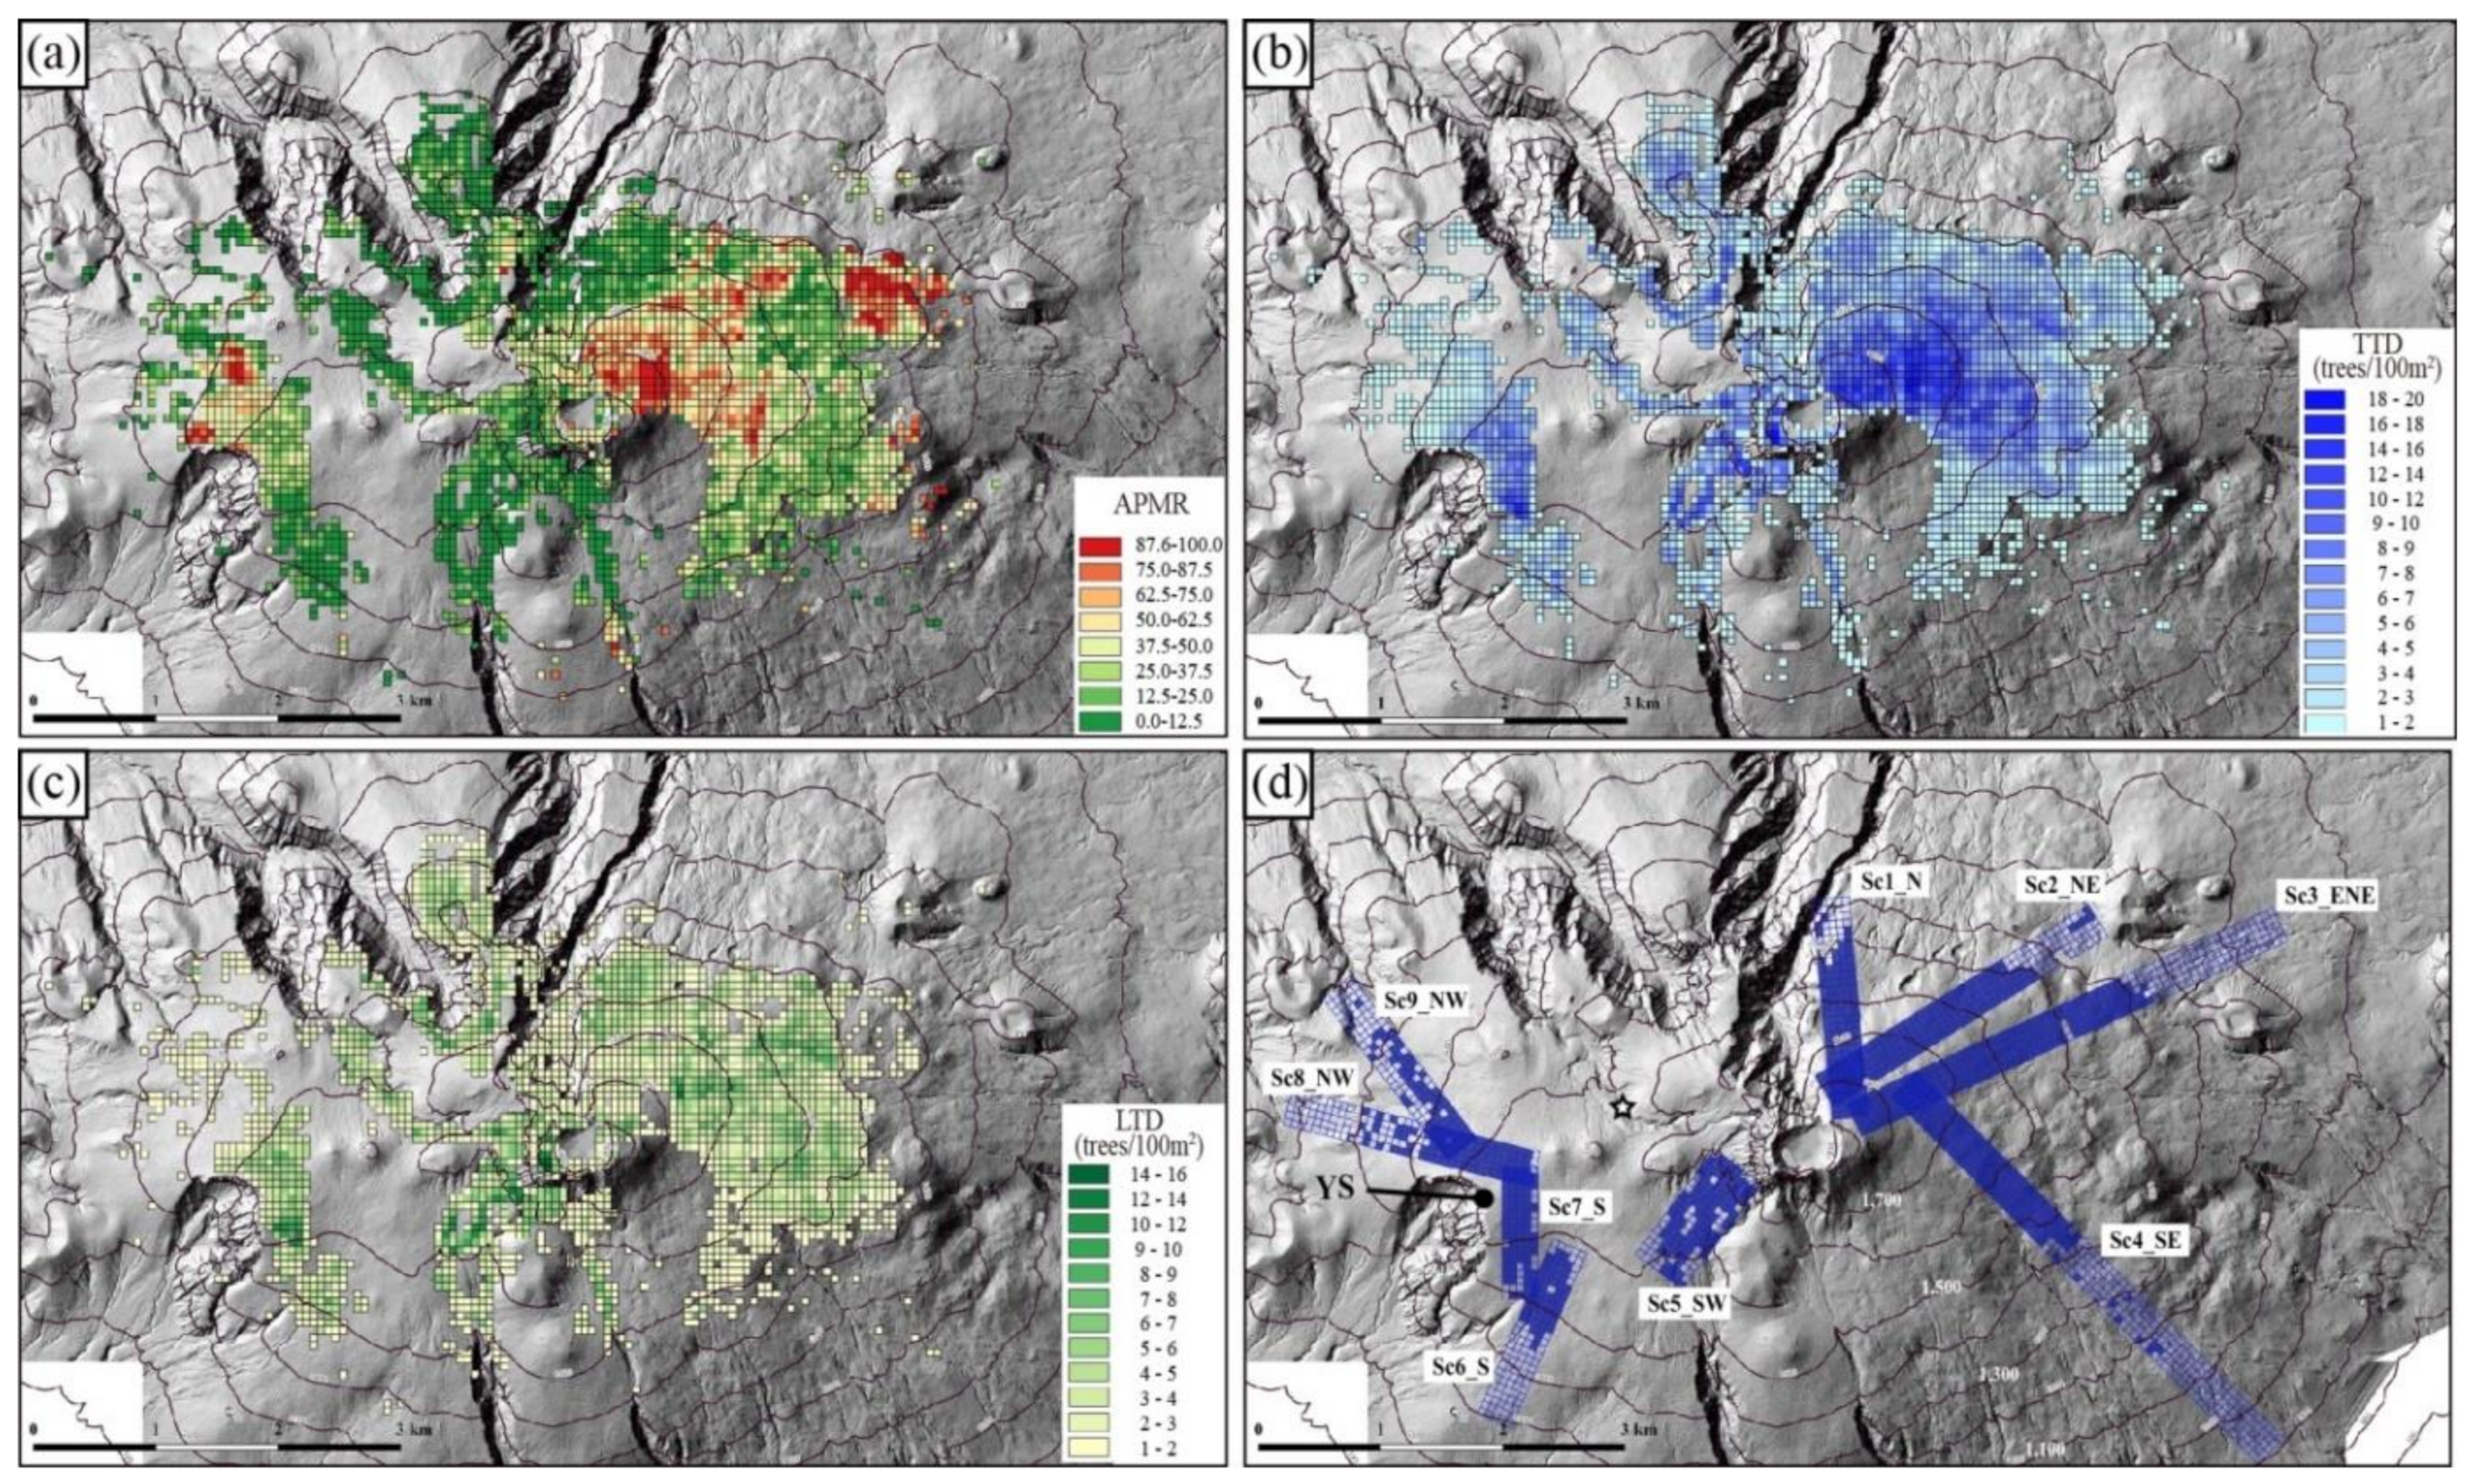
2.4. Analysis of the Distribution Patterns of the Korean Fir

2.4.1. General Distribution of the Korean Fir

To analyze the spatial distribution of the Korean fir in a quantitative manner, the entire study area was divided into analytic grid cells of 3600 m2 (60 × 60 m). In this case, larger numbers of firs within a grid cell will allow more precise analysis. However, the grid cell must be limited in size as a larger grid cell size makes it difficult to specify the topographical features, such as altitude, terrain slope, and solar radiation [25]. The entire study area of 55.08 km2 (9 × 6.12 km) was divided into a grid of 60 × 60 m cells. There was a total of 15,300 grid cells, with 12,225 grid cells containing fewer than 36 firs, and 3075 grid cells containing at least 36 firs (live and dead) (Table 1). Statistical analysis was concentrated on the cells containing at least 36 firs because these cells contain an average of at least one fir per 100 m2 (10 × 10 m). The 3075 grid cells containing at least 36 firs were classified into two groups according to their mortality rate (the 50% of cells with the highest mortality rate and the 50% of cells with the lowest mortality rate), and according to the tree density (the 50% of cells with the highest density and the 50% of cells with the lowest density). Based on this classification, a t-test was conducted for the groups, with respect to the mortality rate, density, terrain slope, and solar radiation. Furthermore, the correlation between the factors, such as the number of live firs, the number of dead firs, the density of Korean fir, mortality rate, terrain slope, solar radiation, and altitude, were examined. Statistical analysis was performed using IBM SPSS (version 25).

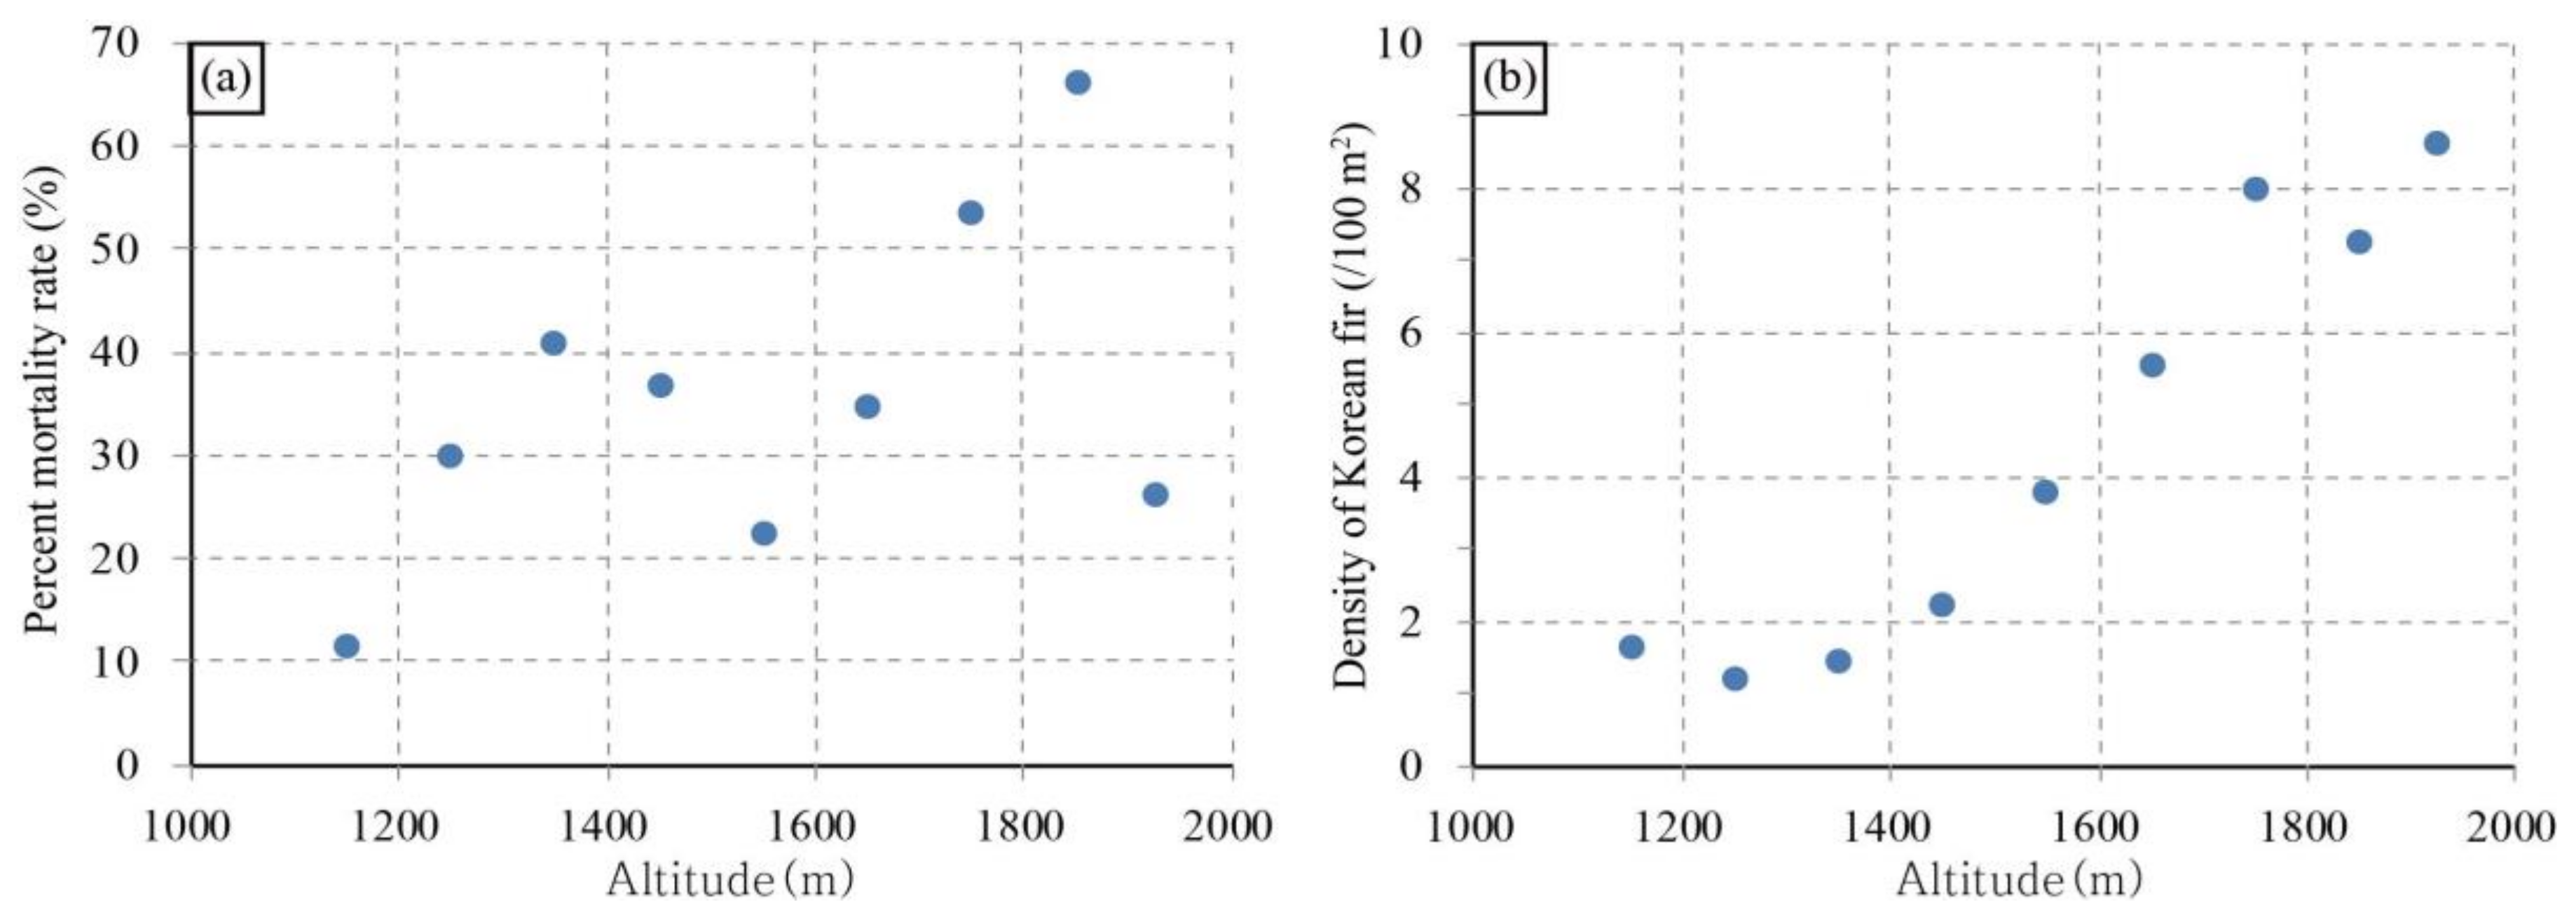
2.4.2. Analysis of the Altitudinal Distribution of the Korean Firs

The study area was divided into 100 m altitudinal intervals to identify the features of the vegetation distribution at various altitudes, as the vegetation distribution is greatly affected by altitude [10,29,30,31]. For each altitudinal interval, the cells were classified according to APMR (the 50% of the cells with the highest APMR range and the 50% with the lowest APMR range), and a t-test was conducted for the groups with respect to their mortality rate, density, terrain slope, and solar radiation. In addition, the correlation between the current distribution of the Korean fir and the topographical factors were also examined at different altitudes. Statistical analysis was performed using IBM SPSS (version 25).

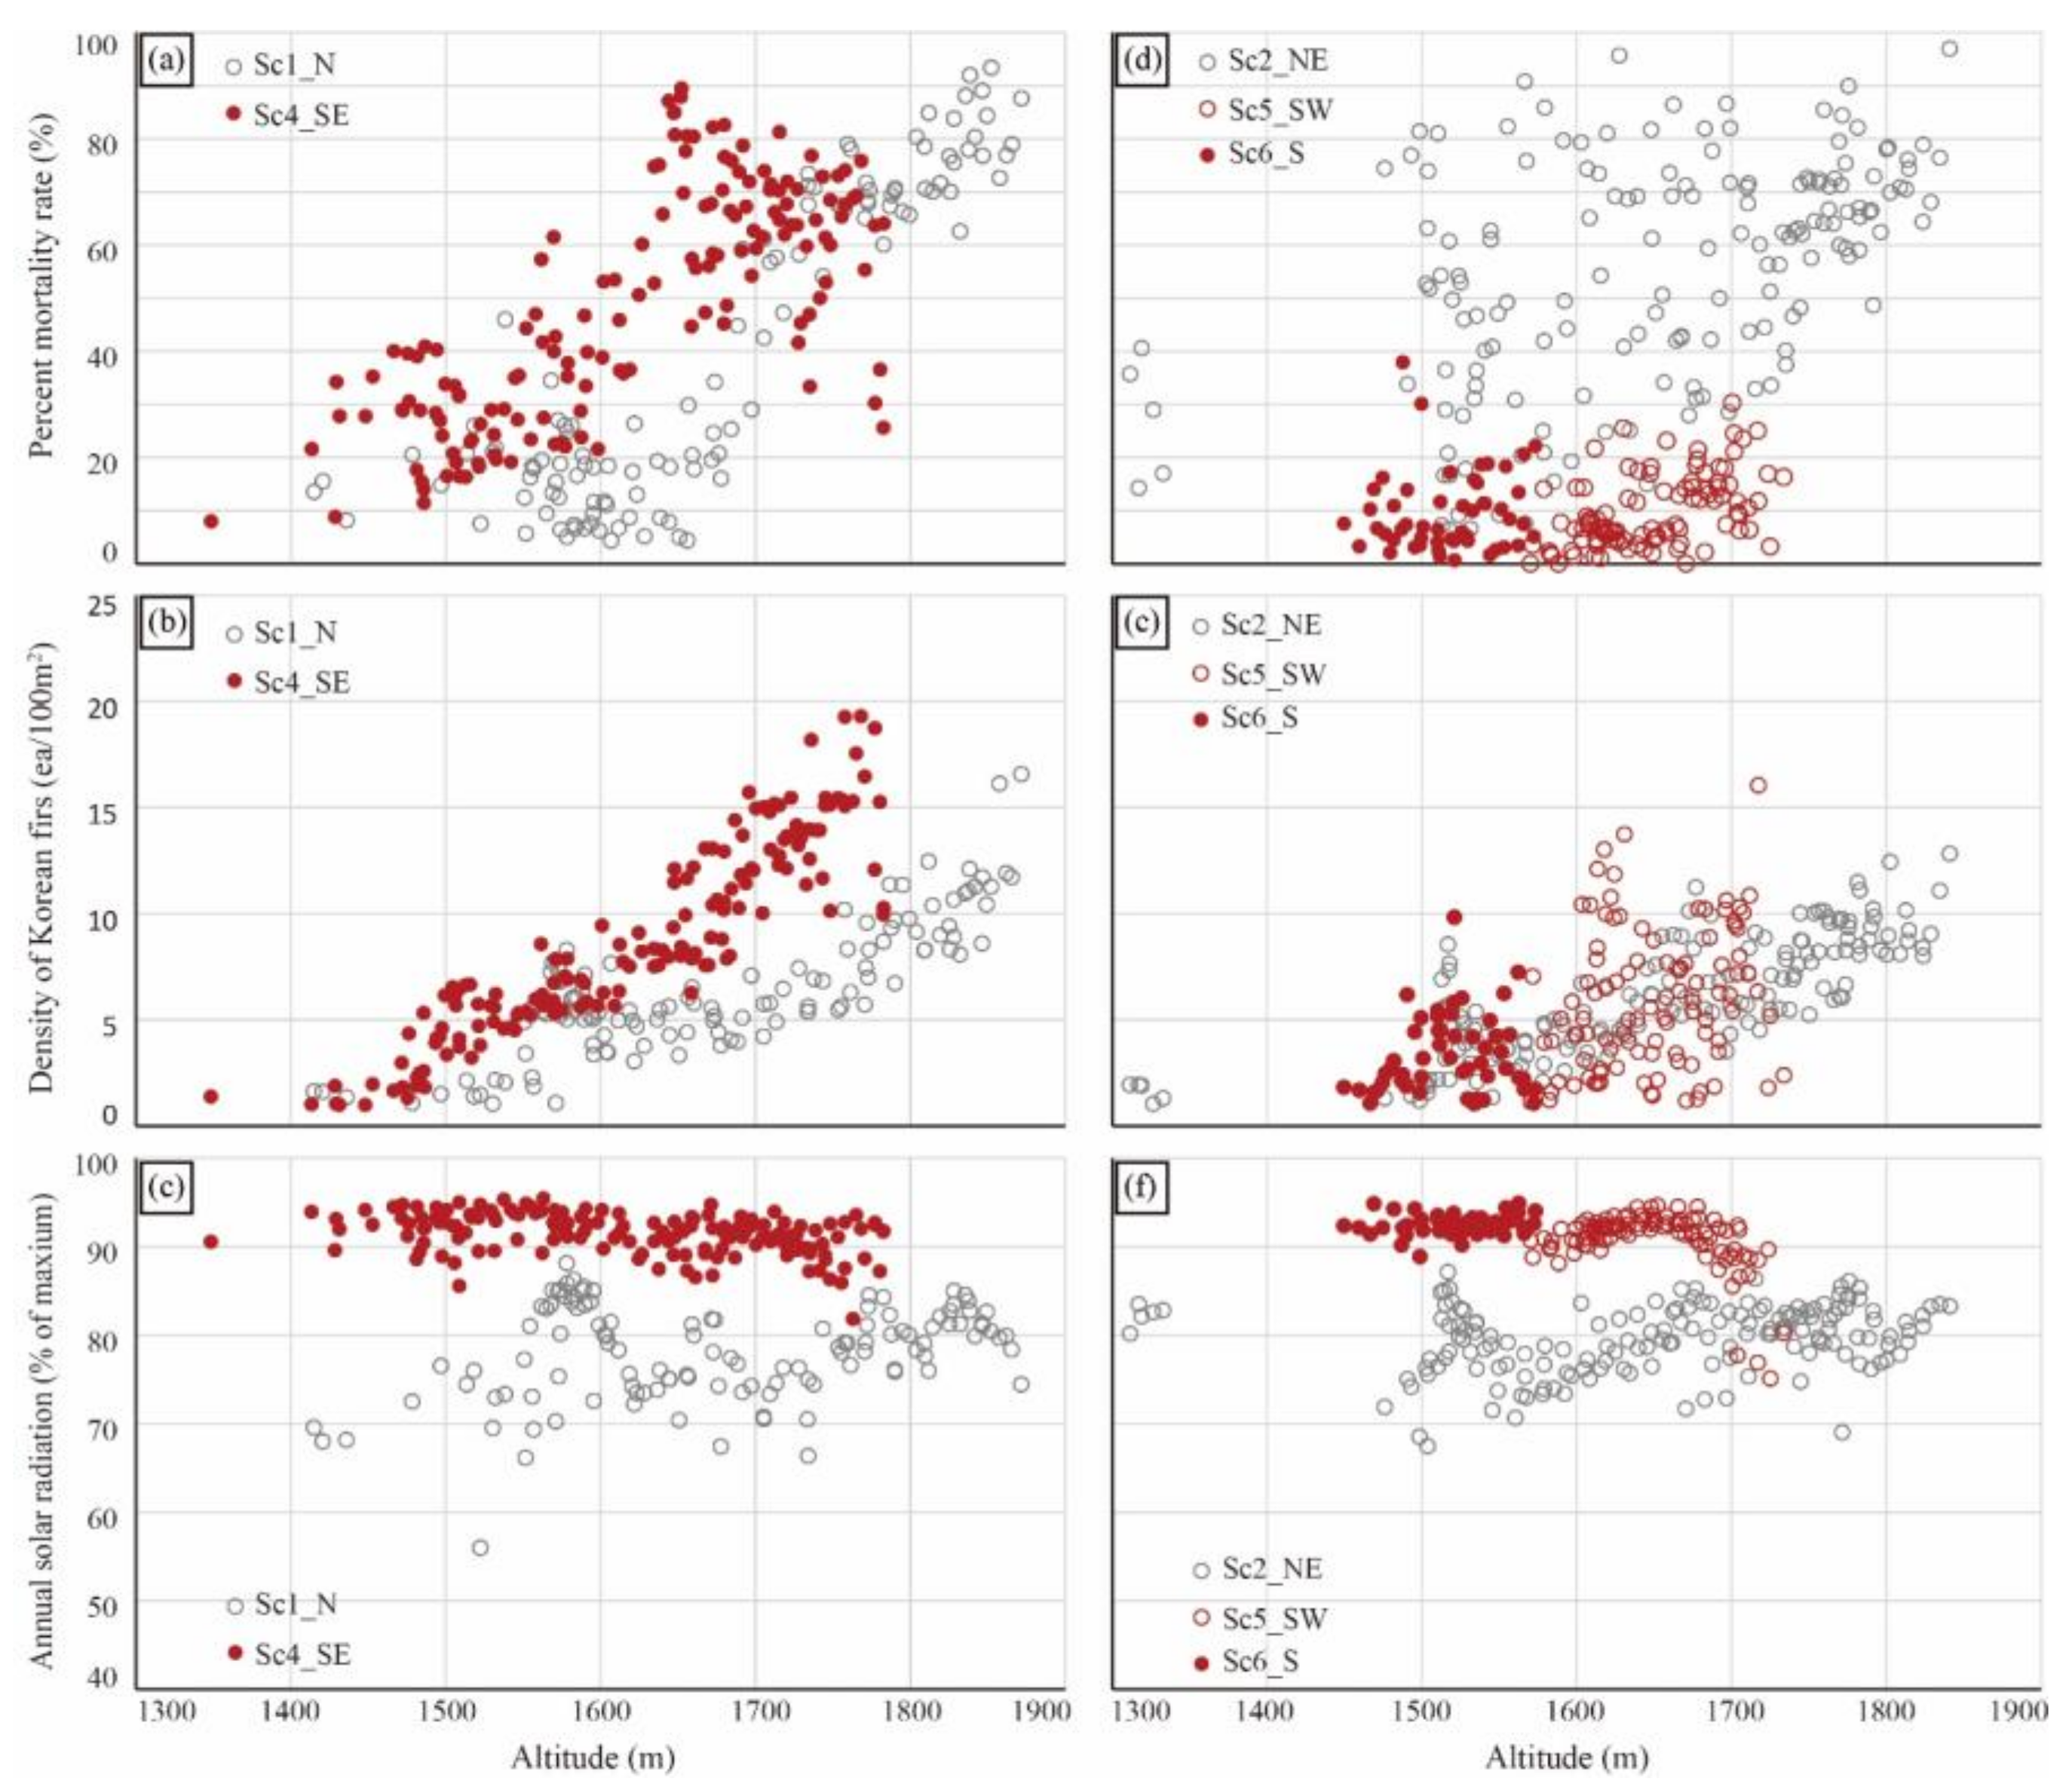
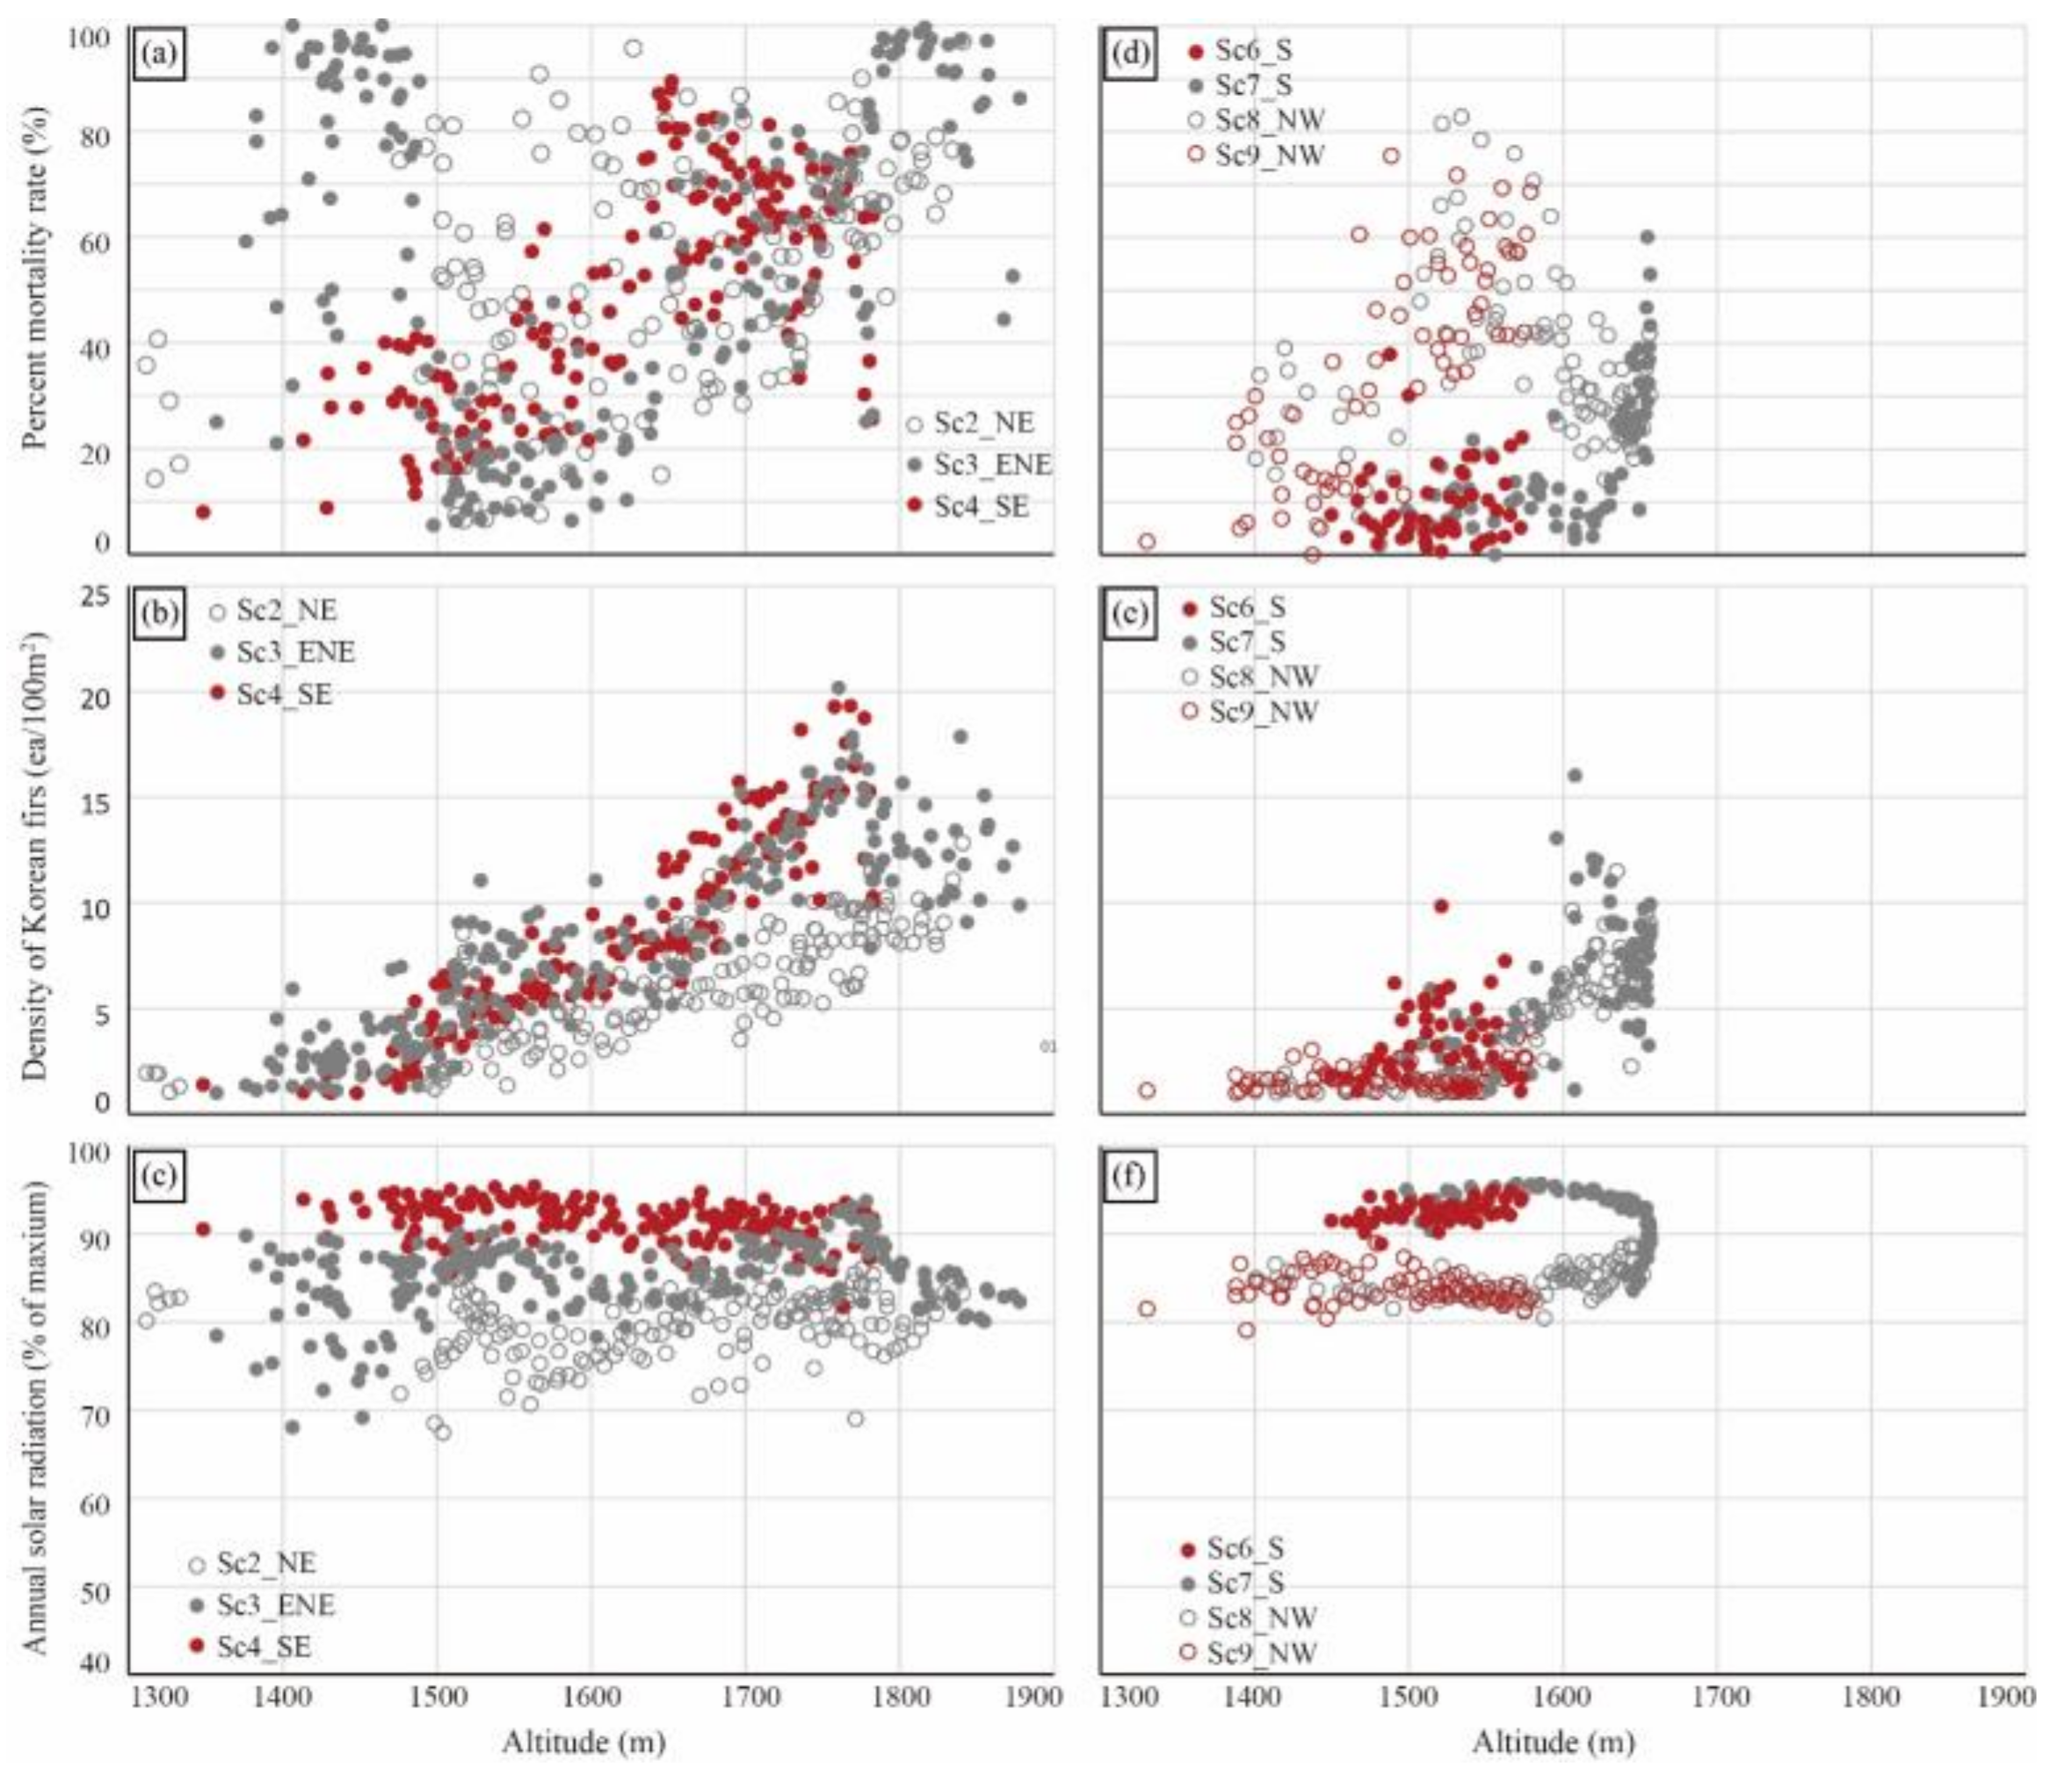
2.4.3. Distribution of the Korean Fir Based on Aspect and Altitude

Nine rectangular sections ranging from low to high altitude for different aspects of Mt. Halla were overlaid on the map. Each section was divided into 60 × 60 m square grid cells (Figure 2d). Data on the grid cells, each containing at least 36 Korean firs, were employed for analysis, considering the accuracy of the density and mortality rate of the Korean firs for each grid cell. The average altitude of each cell was calculated using QGIS 2.18 and Digital Elevation Model (DEM) data at a 1 m resolution.

2.4.4. Comprehensive Analysis Regarding Distribution of Korean Fir in Areas with Heterogeneous Topography

A small area of about 3.7 ha, approximately 33°21′45″ N–33°21′54″ N; 126°30′55″ E–126°31′03″ E, was selected as the study area (marked with a star in Figure 2d). Located at altitudes ranging between 1629 and 1647 m, this area was chosen because it was a relatively small area, but the topography varied, meaning that the effects of factors such as terrain slope and solar radiation could be analyzed. The study area was subdivided into three smaller sites based on factors such as terrain slope, aspect, and solar radiation, to compare the spatial distribution of the Korean fir among three sites with distinct topographic factors.

2.5. Analysis of the Topographic Factors in the Distribution Area of the Korean Firs

Topographic factors of Korean fir, such as terrain slope, solar radiation, and aspect, were examined with default settings of QGIS 2.18 using DEM of 1 m resolution. DEMs (1 m resolution) derived from airborne LIDAR data were obtained in the course of performing fundamental research on the Mt. Halla Natural Reserve (sponsored by Korean Cultural Heritage Administration).

3. Results

3.1. General Distribution of the Korean Fir on Mt. Halla

The mortality rates of the Korean fir were relatively high in the northeastern and southeastern regions of Mt. Halla, and relatively low in the southwestern, northern, and northwestern regions of Mt. Halla (Figure 1c and Figure 2a). The eastern regions of Mt. Halla had a high mortality rate at altitudes between 1300 and 1500 m, relatively low rates between 1500 and 1600 m, and high rates again between 1600 and 1900 m. Overall, the mortality rate was relatively high at the outer part of the Korean fir distribution area, as well as towards the top of Mt. Halla (Figure 1c).
In the whole study area, the region (11.07 km2) in which at least 36 Korean firs (live firs and dead firs) are distributed within a single grid cell was analyzed with respect to mortality rate and density. The average mortality rate was 36.43% and the average density was 4.48 trees/100 m2 (Table 1).
For each grid cell, the results of the correlation analysis between the factors showed that mortality rate was positively correlated with density and altitude, and negatively correlated with slope and aspect (Table 2). In other words, the areas with a higher mortality rate had higher tree density and less steep slopes.
The group of grid cells with the highest 50% mortality rate range had a higher average mortality rate, by 39.52%, a higher average density, by 1.26 trees/100 m2, and a smaller average slope, by 2.92°, compared to the group of cells with the lowest 50% mortality rate range (Table 3). The group of grid cells with the highest 50% density range had a higher average density, by 4.89 trees/100 m2, higher average mortality rate, by 6.52%, and a smaller average terrain slope, by 3.46°, as well as higher annual solar radiation, by 1.99%, compared to the group of cells with the lowest 50% density range (Table 4).

3.2. Distribution of the Korean Fir at Varying Altitudes

For the average mortality rate observed at each altitudinal interval of 100 m, there was an initial increase in the rate for intervals between 1100 and 1400 m, a decrease between 1400 and 1600 m, and a continuous increase from 1600 to 1900 m. The average mortality rate decreased at altitudes above 1900 m. The average density of the Korean fir increased with increasing altitude (Table 5, Figure 3).
A t-test was performed by halving the study area into cell groups with the highest 50% and the lowest 50% mortality rate range at 100 m altitudinal intervals. The cell group with the highest 50% mortality rate range had relatively high density, by 0.33–5.45 trees/100 m2, compared to the cell group with the lowest 50 % mortality rate range. Density differences between the two cell groups in each 100 m altitudinal intervals increased with the altitude, indicated by an upward trend. The cell group with the highest 50% mortality rate range had less steep slopes than the cell group with the lowest 50% mortality rate range, by 3.15–15.95°. Except for the altitudinal intervals between 1300 and 1400 m, as well as between 1600 and 1700 m, the cell group with the highest 50% mortality rate range showed higher solar radiation (Table 6).
The correlation between the mortality rate and other variables (number of live firs, number of dead firs, density, aspect, terrain slope, solar radiation, and altitude) for each 100 m altitudinal interval is presented in Table 7. The mortality rate was negatively correlated with the slope (except for the altitudinal intervals between 1300 and 1400 m) and positively correlated with the density (except for the altitudinal intervals between 1300 and 1400 m, as well as the intervals between 1500 and 1600 m). There was no correlation between the mortality rate and solar radiation. Mortality rate was also negatively correlated with altitude between 1400 and 1600 m, positively correlated with altitude between 1600 and 1800 m, and negatively correlated between 1800 and 1900 m.
The correlation between density and other variables (number of live firs, number of dead firs, mortality rate, aspect, slope, solar radiation, and altitude) for each 100 m altitudinal interval is presented in Table 8. Density was positively correlated with altitude, solar radiation, and mortality rate, but negatively correlated with terrain slope.

3.3. Distribution of the Korean Fir on Different Aspects

We compared the distribution of the Korean fir on the northern aspect of Mt. Halla (Sc1_N) with those of the southeastern aspect (Sc4_SE) (Figure 4a–c), and found that the mortality rate and density all increased with the increasing altitude in both cases (Figure 4a,b). For grid cells in the same altitudinal interval, higher mortality rates and density were observed on the southeastern aspect compared to the northern aspect. The solar radiation was also higher on the southern aspect than on the northern aspect (Figure 4). We also compared the distribution of the Korean fir on the northeastern aspect of Mt. Halla (Sc2_NE) with those on the southwestern aspect (Sc5_SW and Sc6_S) (Figure 4d–f). The northeastern aspect had an exceptionally high mortality rate compared to the southwestern aspect (Figure 4d). With respect to the density, no significant differences were observed between the two aspects. However, some areas of the southwestern aspect had a relatively high density (Figure 4e). The solar radiation was higher on the southwestern aspect than on the northeastern aspect (Figure 4f).
Eastern and western parts of Mt. Halla were further subdivided by intercardinal and secondary-intercardinal aspects to examine mortality rate and density (Figure 5). For the eastern part of Mt. Halla, the highest mortality rate was observed on the northeastern aspect (Sc2_NE), but no significant differences were found between the northeastern aspect (Sc3_ENE) and the southeastern aspect (Sc4_SE). On the northeastern aspect of Mt. Halla, the mortality rate of the Korean fir reached nearly 100% in the altitudinal intervals between 1400 and 1500 m, decreased at altitudes between 1500 and 1600 m, and eventually increased at altitudes above 1600 m (Figure 5). With increasing altitude, the density also increased on all aspects of Mt. Halla. Specifically, the Korean fir on the northeastern aspect of Mt. Halla had lower density than on the southeastern aspect (Figure 5b). The amount of solar radiation was greater on the southeastern aspect than on the east-northeastern aspect, which was greater than on the northeastern aspect (Figure 5c). There was also a positive correlation between solar radiation and density when comparing these aspects. The western part of Mt. Halla was also subdivided into four sections to examine mortality rate and density. The four sections were grouped into two groups (southeastern aspect sections and northwestern aspect sections) according to their aspect on the gently convex Yeongsil area (marked as dot in Figure 2d). The results showed that the mortality rate on the northwestern aspect (Sc8_NW, Sc9_NW) was significantly higher than the southeastern aspect (Sc6_S, Sc7_S) (Figure 5d). The density increased with altitude, but no significant differences were observed in the four sections (Figure 5e). The southeastern aspect (Sc6_S, Sc7_S) had higher solar radiation levels than the northwestern aspect (Sc8_NW, Sc9_NW) (Figure 5f).

3.4. Distribution of the Korean Fir in Areas with Heterogeneous Topography

The small area (~3.7 ha, marked with a star in Figure 2d), approximately 250 m northwest of the Witseoreum Shelter, was subdivided into three smaller sites based on the terrain slope and the solar radiation conditions associated with the slope aspect, to examine the distribution of the Korean fir. The density of the Korean fir was highest in site A, which had the highest annual solar radiation, and was lowest in site B, which had the lowest annual solar radiation. The mortality rate was highest at site A, which had a gentle slope and was lowest at site B, which had a relatively steep slope (Table 9, Figure 6).

4. Discussion

4.1. Accumulated Percent Mortality Rate

Koh et al. [9] investigated 30 spots (20 × 20 m) in a total of 10 sites across the Mt. Halla region, between October 2013 and September 2014, and reported that 20.7% of the total dead fir remained for 5 years or less after death, 37.9% for 5 to 15 years after death, and 41.4% for 15 years or more after death. Considering the status of these dead Korean firs, the APMR that was obtained in this study can be regarded as the APMR over the last 20 years.
Kim and Choo [17] reported an average mortality rate of 8.11% at 20 study sites in the northern and southern parts of the Mt. Halla region, at altitudes ranging from 1350 to 1720 m above sea level, during October and November of 1996. In this study, we observed an average APMR of 36.3% for the 3075 grid cells (each 3600 m2; total area 11.07 km2), for which there were at least 36 Korean firs per grid cell. The difference in the mortality rates reported in the Kim and Choo study and in the current study suggests that the APMR of the Korean firs across Mt. Halla has dramatically increased over the last 20 years (between November 1996 and April 2017), even allowing for the fact that the APMR reported by Kim and Choo [17] was calculated using fragmentary data measured at a particular study site. The high APMR found in this study indicates a significant increase in the number of dead firs over the last 20 years. Therefore, it can be inferred that the differences in the mortality rate per unit time in the different areas eventually led to area-specific differences in the APMR at the time of investigation.
Since 2012, the Korea National Park Research Institute has been conducting an annual survey of the current state and distribution of the Korean fir [26]. The decline and mortality rate of the Korean fir can be further investigated in future studies using the GIS data collected for the Mt. Halla region in April 2017.

4.2. Density

The density of the Korean fir across the Mt. Halla region was positively correlated with altitude and solar radiation and negatively with terrain slope. Such relationships were also observed in the correlation analysis conducted at 100 m altitudinal intervals. Similarly, in the Qinling Mountains [32], the density of the subalpine fir (Abies fargesii) in the subalpine zone increased with increasing altitude, whereas the diameter at breast height decreased. Moreover, the decrease in the maximum arboreal height and diameter with increasing altitude has been reported on a global scale [33,34,35,36,37,38,39,40,41,42]. The decline in the stem diameter and crown growth has often been attributed to unfavorable conditions for arboreal growth, such as temperature decrease with increasing altitude, and the consequent decrease in photosynthetic productivity [43,44], as well as mechanical damage caused by strong winds at high altitudes [42]. Considering the previous studies, the increase in density of the Korean firs across Mt. Halla with increasing altitude can be inferred to be related to the decrease in crown size (decrease in growth rate) with increasing altitude. If individual trees have relatively small crowns owing to low growth, this would reduce the crown-induced light blocking effect, providing space where a larger number of trees could grow within the same area, thereby increasing tree density (e.g., Reference [42]).
Based on the findings of the previous studies mentioned above, it can be inferred that the site conditions that are unfavorable for the growth of Korean firs include areas receiving large amounts of solar radiation, areas with relatively gentle slopes, and areas with high altitude, where the Korean firs are densely populated. In areas with high solar radiation, this can be explained by the fact that excessive solar radiation causes stomatal closure, which in turn may lead to reduced photosynthesis and subsequently, a decline in plant growth [45,46,47]. Further studies regarding the relationship between solar radiation and photosynthesis, along with the measurements of stem flow velocity and rate, are needed to further investigate the specific relationship between solar radiation and the growth rate of the Korean fir.
Meanwhile, the high density of Korean firs observed on the areas with gentler slopes suggests that excessive soil moisture on less steep slopes may impede soil aeration, and thus lead to a decline in the growth rate [48,49,50,51,52]. This can be interpreted to mean that the increasing number of individuals growing within a given space during the same time period resulted in a higher density. In the Mt. Halla region, rainfall increases as altitude increases (e.g., References [25,53,54]), which suggests that excessive moisture may be related to altitude-induced declines in the growth rate of the Korean fir and subsequent increases in density. For example, in the Tianshan Mountains, northwest China, it was reported that soil moisture increased with altitude [55]. The possibility of a decline in the growth rate of the Korean fir on Mt. Halla owing to increased soil moisture must also be considered.

4.3. Density and Mortality Rate

In this study, a positive correlation was found between the density and mortality rate of the Korean fir. This is consistent with Kim et al. [23], who reported changes in the distribution of the Korean fir on Mt. Halla between 2006 and 2015. Kim et al. reported that a significant decrease in the distribution area of the Korean fir was observed in a densely populated area, and a slight decrease or increase in the areas with a relatively low density.
Consistent positive correlation between the density and mortality rate of the Korean fir suggests that there might be a close link between factors that increase the density of Korean fir, and factors that increase the mortality rate of Korean fir. Above, we had discussed possible links between the density of Korean fir and the site conditions unfavorable to their growth. The results showed that the densely populated areas have relatively unfavorable growth conditions for Korean fir, and based on this, we can infer that the extensive mortality has recently occurred in areas dominated by less favorable growth conditions. For example, Bigler et al. [56] reported several cases of severe drought-induced mortality in several species (Picea engelmannii, Abies lasiocarpa, and Pinus contorta) in a subalpine forest in the Rocky Mountains. Drought-induced mortality was especially high among those trees with low growth rate prior to the drought. In addition, several studies have reported negative correlations between tree growth and mortality rates [57,58,59]. Based on the distribution patterns of the Korean fir examined in this study as well as previous studies, the mortality of the Korean fir in the Mt. Halla region can be attributed to the deterioration of a specific environment, especially for the Korean fir in unfavorable growth conditions. In other words, the mortality rate of the Korean fir has sharply increased, as particular climatic conditions exceeded the species’ physiological threshold (e.g., Reference [60]).
In this study, persistent heavy rainfall and the consequent excess soil moisture are presumed to be the main causes for the sharp increase in the mortality of the Korean fir. This conclusion is supported because the areas with high mortality rates and high density had gentle slopes and because of the above-average precipitation that occurred between 2010 and 2015 (Figure 7). Such weather phenomena would have triggered a sharp increase in soil moisture in areas with gentle slopes over extended periods of time, causing the resulting excessive soil moisture to exceed the physiological threshold of the Korean fir, and leading to a drastic increase in mortality.
This study focused on the distribution of Korean fir. Therefore, demonstrating a direct causal relationship between the mortality of the Korean fir and soil moisture was outside the scope of this study. However, some studies have addressed the effects of persistent heavy precipitation on the growth rate of the Korean fir [8,61].
According to a dendrochronological analysis by Koo et al. [8], the lowest growth rates of Korean firs on Mt. Halla were observed in 1982, 1988, and 1996, and the overall declines in the growth rates were initiated in 1978, 1982, and 1988. The precipitation data, measured at the Jeju Meteorological Office for the period 1923–2018 (from https://data.kma.go.kr/cmmn/main.do#), showed an irregular pattern of precipitation, repeating the above-average and below-average precipitation cycle every one or two years (Figure 7). The precipitation data and the data from Koo et al. [8] were compared to examine the relationship between the precipitation and growth rate of the Korean fir. The results showed that in 1982 and 1988 (the two years with the lowest growth rates for Korean fir), above-average precipitation persisted during the three years prior to 1982 (from 1979 to 1981) and during the three years prior to 1988 (from 1985 to 1987). In 1996 (another year with a low growth rate), the precipitation was below average for just one year (1993) in the preceding 5-year period but remained above average for the rest of the 5-year period. In 1982, 1988, and 1996, the years following the long-term persistence of the above-average precipitation, all precipitation levels fell below average, and the lowest growth rate of the firs also occurred.
In the Koo et al. [8] study, the low growth rate and decline of Korean fir was interpreted to be related to the winter drought-induced moisture stress and winter temperature, which has increased since the mid-1970s. However, another interpretation of the data is possible. The Korean firs dendrochronologically examined must have still been alive around the time of their research, and the investigated samples must have also been alive in a slow-growing state, after surviving the moisture stress caused by the persistent excessive soil moisture. For trees incapable of enduring the stress caused by long-term excesses of soil moisture for three or more years, it is highly likely that they had already died and were not included in the analysis. For this reason, the results must have shown that the Korean fir, which had survived the persistent high precipitation lasting three or more years, had low growth rates in the years following the long-term persistence. This may have led Koo et al. [8] to conclude that Korean fir had low growth rates during the winter drought in the following dry period, resulting in a positive correlation between growth rate and rainfall. However, it would be more reasonable to interpret the relationship between the changes in overall precipitation and the growth rate of the Korean firs as indicative of a negative association.
This interpretation is also supported by the master chronology established from tree-ring analysis of 10 living firs at Yeongsil in Mt. Halla by Seo et al. [61]. According to the master chronology (Figure 7c), in the period with above-average precipitation (A,C,E in Figure 7c), the growth rate of firs was relatively low or in decline. However, during the period with below-average precipitation or with regularly recurring above- and below-average precipitations (B,D in Figure 7c), growth rate was relatively high or increasing. These results are consistent with the findings of previous studies, which showed that excess soil moisture can cause a relatively low growth rate of coniferous species [50,51]. The extensive mortality of the Korean firs across the Mt. Halla region has occurred since 2011. During 2010 to 2015, there was below-average precipitation for only one year (2013). In 2012, the precipitation was 760 mm above the average, and the area experienced strong typhoons. For this reason, typhoon-induced root shaking has been reported to be related to mortality of Korean firs [1,9]. According to a recent study dealing with the distribution of the Korean fir across the Korean Peninsula, Korean firs die standing at a relatively high rate [24]. Furthermore, Seo et al. [61] failed to find any reliable relationship between the inter-annual growth reduction and typhoon records. Rather than reaching the conclusion that the 2012 typhoons made direct contributions to Korean fir mortality, it would be more reasonable to infer that such mortality was caused by a combination of the physiological stress owing to excessive soil moisture during persistent periods of high precipitation, accompanied by typhoons, and the additional physical pressures caused by the typhoons.
As mentioned above, the mortality rate of Korean fir, which is positively correlated with density, showed a negative correlation with the terrain slope, but a positive correlation with solar radiation. Therefore, it has been inferred that the areas of gently sloping terrain (i.e., the areas with high soil moisture) are unfavorable to growth of the Korean fir and lead to a sharp increase in fir mortality when site conditions further deteriorate. However, although the areas receiving large amounts of solar radiation had high density (Table 2 and Table 4, Figure 4e versus Figure 4f and Figure 5e versus Figure 5f), the mortality rate in these areas was not always high (Table 2 and Table 3, Figure 4d versus Figure 4e and Figure 5d versus Figure 5e). This indicates that solar radiation may not be a crucial factor related to the mortality of the Korean fir. In Ahn et al. [25], for the areas receiving large amounts of solar radiation, there were relatively low mortality rates observed at five out of the nine study sites, relatively high mortality rates at two sites, and no statistically significant relationship was observed at the other two sites.

4.4. Comprehensive Analysis Efforts Regarding the Distribution of the Korean Fir in Areas with Heterogeneous Topography

As shown in Figure 6, the study area of approximately 27,300 m2 situated northwest of Mt. Halla, at altitudes ranging from 1620 to 1650 m, can be assumed to have the same precipitation conditions. Assuming the same altitude and precipitation levels across the study area, the terrain slope is expected to have the greatest influence on soil moisture [13,62,63,64]. With respect to the distribution of the Korean fir, low mortality was observed in areas with steep slopes that are expected to contain relatively low soil moisture, and high mortality rates were observed in areas with gentle slopes. Also, high-density stands were found in areas with relatively large amounts of solar radiation and gentle slopes. In areas with higher densities of Korean fir, the mortality rate was also higher. The distribution of the Korean fir, in particular areas with highly heterogeneous topography, was consistent with the analysis dealing with the overall distribution of the Korean firs across the Mt. Halla region.

4.5. Proposal for the Distribution Area of the Korean Firs on Mt. Halla

Previous studies have employed a variety of methods to investigate the distribution of the Korean fir, e.g., by utilizing aerial photographs or satellite images to map the stands of Korean fir [20,21,22], or calculating the areas above a certain crown density [23,24] (Table 10).
In this study, it was possible to identify that the individual Korean firs and an area of 928.8 ha consisting of 60 × 60 m square grid cells, each containing at least 36 individual live trees, was identified as the distribution area of Korean fir. The proposed distribution area had an average mortality rate of 33.3% and an average density of 4.91 trees/100 m2 (Table 11).
As shown in Table 10, there are differences between the distribution area calculated from previous studies and the area calculated in this study. Methods used in previous studies involved identifying the boundaries of the Korean fir stands and calculating the total area of these stands [20,21]. Several factors may affect the calculation of the distribution area, e.g., excluding an area in which small stands or individual trees were sporadically distributed from the distribution area, or, including an area in which no Korean firs were distributed in a large-scale stand [23]. In contrast, calculating the distribution area based on crown density (>10%) (e.g., References [23,24]) is considered a more objective method. However, given that the density of the Korean firs increased with increasing altitude [17,25] and that the high-resolution aerial photographs (<10 cm) became more accessible, the method of calculating the distribution area based on population per unit area, rather than based on the crown density, is deemed more appropriate for the long-term monitoring of the Korean fir.

5. Conclusions

In this study, the spatial distribution of the Korean firs across the Mt. Halla region was examined to determine the cause of the extensive Korean fir mortality in the region. The results showed that the mortality rate of the Korean fir across the Mt. Halla region was positively correlated with altitude and tree density, and negatively correlated with terrain slope—no significant correlation was observed with solar radiation. The Korean fir density was positively correlated with altitude and solar radiation, but negatively correlated with terrain slope. The overall distribution features of the Korean firs across the Mt. Halla region mentioned above were also confirmed in the comprehensive analysis of their distribution in the areas with heterogeneous topography. From the above distribution features of the Korean firs across Mt. Halla, the following conclusions were reached. The increase in density of the Korean fir is responsible for its decreased growth rate, owing to unfavorable environmental conditions associated with high altitude, high solar radiation, and gentle terrain slope. Therefore, the consistent positive correlations between the density and APMR of the Korean fir indicate that the mortality of the Korean fir in Mt. Halla can be attributed to the deterioration of a particular environment, especially for the Korean fir, under unfavorable growth conditions. Based on the fact that the areas with high density of Korean firs as well as high APMR have relatively high soil moisture content because of the gentle slopes or relatively high precipitation according to rising altitude, it is concluded that long-term persistence of high rainfall and the subsequent excess of soil moisture are the main causes of the extensive mortality of the Korean fir observed in the Mt. Halla region. We hope that the spatial distribution features of the Korean fir can be used as variables in future modeling studies for the conservation and management of the species, and also that the individual tree plotting methods using 3D stereoplotting instruments can be widely used as quantitative monitoring techniques for long-term vegetation change. Furthermore, in an attempt to develop a more realistic long-term strategy for Korean fir conservation, quantitative and systematic studies are needed to investigate the variables that are suggested to be closely associated with the causes of Korean fir mortality, such as the soil properties, soil moisture, and the physiological changes caused by changes in soil moisture.

Author Contributions

The project was initially conceived by U.S.A. and Y.S.Y. The spatial distribution of the Korean fir used by the study was mapped by Y.S.Y. The manuscript, figures, and tables were jointly produced and subsequently revised by U.S.A. and Y.S.Y. All authors have read and agreed to the published version of the manuscript.

Funding

This research received no external funding.

Acknowledgments

This research was supported by the Cultural Heritage Administration and World Heritage Office, Jeju Special Self-Governing Provincial Government.

Conflicts of Interest

The authors declare no conflict of interest

References

  1. National Institute of Forest Science (NIFS). Korea Fir Hallasan Mountain, Why Are They Dying? NIFS: Seoul, Korea, 2016. [Google Scholar]
  2. Wilson, E.H. Four new conifers from Korea. J. Arnold Arbor 1920, 1, 186–190. [Google Scholar]
  3. Kang, S.J. Regeneration process of subalpine coniferous forest in Mt. Jiri. J. Ecol. Environ. 1984, 7, 185–193, (In Korean with English abstract). [Google Scholar]
  4. Kim, E.S. Decline of Tree Growth and the Changes of Environmental Factors on High Altitude Mountains; Report no. KOSEF921-1500-081-2; Korea Science and Engineering Foundation: Seoul, Korea, 1994; (In Korean with English abstract). [Google Scholar]
  5. Park, W.-K.; Seo, J.-W. A Dendroclimatic Analysis on Abies koreana in Cheonwang-bong Area of Mt. Chiri, Korea. Korean J. Quat. Res. 1999, 13, 25–33, (In Korean with English abstract). [Google Scholar]
  6. Lee, C.-S.; Cho, H.-J. Structure and dynamics of Abies koreana Wilson Community in Mt. Gaya. Korean J. Ecol. 1993, 16, 75–91, (In Korean with English abstract). [Google Scholar]
  7. Lim, J.-H.; Woo, S.-Y.; Kwon, M.J.; Chun, J.H.; Shin, J.H. Photosynthetic capacity and water use efficiency under different temperature regimes on healthy and declining Korean fir in Mt. Halla. J. Korean For. Soc. 2006, 95, 705–710, (In Korean with English abstract). [Google Scholar]
  8. Koo, K.A.; Park, W.K.; Kong, W.S. Dendrochronological analysis of Abies koreana W. at Mt. Halla, Korea: Effects of climate change on the growths. Korean J. Ecol. 2001, 24, 281–288. [Google Scholar]
  9. Koh, J.G.; Kim, D.S.; Kim, J.G.; Ko, Y.J. Growth Dynamics of Korean Fir in Mt. Hallasan. Hallasan Res. Rep. 2015, 14, 9–26, (In Korean with English abstract). [Google Scholar]
  10. Moeslund, J.E.; Arge, L.; Bøcher, P.K.; Dalgaard, T.; Odgaard, M.V.; Nygaard, B.; Svenning, J.C. Topographically controlled soil moisture is the primary driver of local vegetation patterns across a lowland region. Ecosphere 2013, 4, 1–26. [Google Scholar] [CrossRef]
  11. Chaneton, E.J.; Lavado, R.S. Soil nutrients and salinity after long-term grazing exclusion in a flooding Pampa grassland. J. Range Manag. 1996, 49, 182–187. [Google Scholar] [CrossRef]
  12. D’Amore, D.V.; Hennon, P.E. Evaluation of soil saturation, soil chemistry, and early spring soil and air temperatures as risk factors in yellow-cedar decline. Glob. Chang. Biol. 2006, 12, 524–545. [Google Scholar] [CrossRef]
  13. Liu, H.; He, S.; Anenkhonov, O.A.; Hu, G.; Sandanov, D.V.; Badmaeva, N.K. Topography-controlled soil water content and the coexistence of forest and steppe in northern China. Phys. Geogr. 2012, 33, 561–573. [Google Scholar] [CrossRef]
  14. Silvertown, J.; Araya, Y.; Gowing, D. Hydrological niches in terrestrial plant communities: A review. J. Ecol. 2015, 103, 93–108. [Google Scholar] [CrossRef] [Green Version]
  15. Xiang, X.; Wu, X.; Chen, X.; Song, Q.; Xue, X. Integrating topography and soil properties for spatial soil moisture storage modeling. Water 2017, 9, 647. [Google Scholar] [CrossRef]
  16. Hennon, P.E.; D’Amore, D.V.; Schaberg, P.G.; Wittwer, D.T.; Shanley, C.S. Shifting climate, altered niche, and a dynamic conservation strategy for yellow-cedar in the North Pacific coastal rainforest. BioScience 2012, 62, 147–158. [Google Scholar] [CrossRef] [Green Version]
  17. Kim, G.; Choo, G. Comparison of growth condition of Abies koreana Wilson by districts. Korean J. Environ. Ecol. 2000, 14, 80–87. [Google Scholar]
  18. Song, K.M.; Kim, C.S.; Koh, J.G.; Kang, C.H.; Kim, M.H. Vegetation structure and distributional characteristics of Abies koreana forests in Mt. Halla. J. Env. Sci. Int. 2010, 19, 415–425. [Google Scholar] [CrossRef] [Green Version]
  19. Song, K.M.; Kim, J.H. Vegetation change of long-term ecological research (LTER) site of Abies koreana forests in Hallasan mountain (Yeongsil area). J. Korea Soc. Env. Restor. Tech. 2018, 21, 1–12. [Google Scholar] [CrossRef]
  20. Kim, C.S. Characteristics of Distribution and Taxonomy of Abies Koreana; Report of Survey and Study of Hallasan Natural Reserve 2006; Research Institute for Mt. Halla: Jeju, Korea, 2006; pp. 451–471. [Google Scholar]
  21. Song, K.M. Vegetation Structure and Dynamics of Abies koreana Forests on Mt. Halla. Ph.D. Thesis, Jeju National University, Jeju, Korea, 2011; p. 97. [Google Scholar]
  22. Kim, N.S.; Lee, H.C. A study on changes and distributions of Korean fir in sub-alpine zone. J. Korea Soc. Environ. Restor. Technol. 2013, 16, 49–57. [Google Scholar] [CrossRef]
  23. Kim, J.K.; Koh, J.G.; Yim, H.T.; Kim, D.S. Changes of spatial distribution of Korean fir forest in Mt. Hallasan for the Past 10 Years (2006, 2015). Korean J. Environ. Ecol. 2017, 31, 549–556. [Google Scholar] [CrossRef]
  24. National Institute of Forest Science (NIFS). Status and Conservation of the Endangered Subalpine Coniferous Forests in Korea; NIFS: Seoul, Korea, 2019. (In Korean) [Google Scholar]
  25. Ahn, U.S.; Kim, D.S.; Yun, Y.S.; Ko, S.H.; Kim, K.S.; Cho, I.S. The inference about the cause of death of Korean Fir in Mt. Halla through the analysis of spatial dying pattern—Proposing the possibility of excess soil moisture by climate changes. Korean J. Agric. For. Meteorol. 2019, 21, 1–28. [Google Scholar] [CrossRef]
  26. Korea National Park Research Institute (KNPRI). Monitoring of Ecosystems Related to Climate Change in National Park, Korea; KNPRI: Wonju-si, Korea, 2018. (In Korean) [Google Scholar]
  27. Middleton, M.; Närhi, P.; Sutinen, R. Imaging spectroscopy in soil-water based site suitability assessment for artificial regeneration to Scots pine. ISPRS J. Photogramm. Remote Sens. 2011, 66, 287–297. [Google Scholar] [CrossRef]
  28. Jeju Special Self-Governing Province (JSS-GP). Jeju Province At A Glance; JSS-GP: Jeju-si, Korea, 2019. (In Korean) [Google Scholar]
  29. Bhattarai, K.R.; Vetaas, O.R. Variation in plant species richness of different life forms along a subtropical elevation gradient in the Himalayas, east Nepal. Glob. Ecol. Biogeogr. 2003, 12, 327–340. [Google Scholar] [CrossRef]
  30. Lomolino, M.V. Elevation gradients of species-density: Historical and prospective views. Glob. Ecol. Biogeogr. 2001, 10, 3–13. [Google Scholar] [CrossRef]
  31. Rahbek, C. The role of spatial scale and the perception of large-scale species-richness patterns. Ecol. Lett. 2005, 8, 224–239. [Google Scholar] [CrossRef]
  32. Dang, H.; Zhang, Y.; Zhang, K.; Jiang, M.; Zhang, Q. Age structure and regeneration of subalpine fir (Abies fargesii) forests across an altitudinal range in the Qinling Mountains, China. For. Ecol. Manag. 2010, 259, 547–554. [Google Scholar] [CrossRef]
  33. Ohsawa, M.; Nainggolan, P.H.J.; Tanaka, N.; Anwar, C. Altitudinal zonation of forest vegetation on Mount Kerinci, Sumatra: With comparisons to zonation in the temperate region of east Asia. J. Trop. Ecol. 1985, 1, 193–216. [Google Scholar] [CrossRef]
  34. Nakashizuka, T.; Yusop, Z.; Nik, A.R. Altitudinal zonation of forest communities in Selangor, Peninsular Malaysia. J. Trop. For. Sci. 1992, 4, 233–244. [Google Scholar]
  35. Shibata, O.; Ando, Y. Growth of Betula and Abies trees and their productivity at different altitudes in the subalpine zone. In Management of Structure and Productivity of Boreal and Subalpine Forests; Linder, S., Kellomäki, S., Eds.; Studia Forestalia Suecica: Uppsala, Sweden, 1993; Volume 191, pp. 21–24. [Google Scholar]
  36. Šrůtek, M.; Lepš, J.Š. Variation in structure of Larix olgensis stands along the altitudinal gradient on Paektu-san, Changbai-shan, North Korea. Arct. Alp. Res. 1994, 26, 166–173. [Google Scholar] [CrossRef]
  37. Lieberman, D.; Lieberman, M.; Peralta, R.; Hartshorn, G.S. Tropical forest structure and composition on a large-scale altitudinal gradient in Costa Rica. J. Ecol. 1996, 84, 137–152. [Google Scholar] [CrossRef]
  38. Pendry, C.A.; Proctor, J. Altitudinal zonation of rain forest on Bukit Belalong, Brunei: Soils, forest structure and floristics. J. Trop. Ecol. 1997, 13, 221–241. [Google Scholar] [CrossRef]
  39. Tang, C.Q.; Ohsawa, M. Zonal transition of evergreen, deciduous, and coniferous forests along the altitudinal gradient on a humid subtropical mountain, Mt. Emei, Sichuan, China. Plant Ecol. 1997, 133, 63–78. [Google Scholar] [CrossRef]
  40. Okitsu, S. Vertical distribution and structure of the tree vegetation in the montane forest of Mt. Pulog, Cordillera mountain range, the highest mountain in Luzon Is., Philippines. J. Veg. Sci. 1998, 15, 19–32. [Google Scholar]
  41. Sakai, A.; Matsui, K.; Kabeya, D.; Sakai, S. Altitudinal variation in lifetime growth trajectory and reproductive schedule of a sub-alpine conifer, Abies mariesii. Evol. Ecol. Res. 2003, 5, 671–689. [Google Scholar]
  42. Miyajima, Y.; Takahashi, K. Changes with altitude of the stand structure of temperate forests on Mount Norikura, central Japan. J. For. Res. 2007, 12, 187–192. [Google Scholar] [CrossRef] [Green Version]
  43. DeLucia, E.H.; Smith, W.K. Air and soil temperature limitations on photosynthesis in Engelmann spruce during summer. Can. J. For. Res. 1987, 17, 527–533. [Google Scholar] [CrossRef]
  44. Körner, C. Alpine Plant Life: Functional Plant Ecology of High Mountain Ecosystems; with 47 Tables; Springer-Verlag: Berlin/Heidelberg, Germany, 2003. [Google Scholar] [CrossRef]
  45. Cohen, S.; Moreshet, S.; Guillou, L.L.; Simon, J.C.; Cohen, M. Response of citrus trees to modified radiation regime in semi-arid conditions. J. Exp. Bot. 1997, 48, 35–44. [Google Scholar] [CrossRef] [Green Version]
  46. Blanke, M.M. Photoinhibition in citrus–an invited review. Proc. Int. Soc. Citric. 2002, 9, 619–622. [Google Scholar]
  47. Raveh, E.; Cohen, S.; Raz, T.; Yakir, D.; Grava, A.; Goldschmidt, E.E. Increased growth of young citrus trees under reduced radiation load in a semi-arid climate. J. Exp. Bot. 2003, 54, 365–373. [Google Scholar] [CrossRef]
  48. Patrick, W.H.; Wyatt, R. Soil nitrogen loss as a result of alternate submergence and drying. Soil Sci. Soc. Am. J. 1964, 28, 647–653. [Google Scholar] [CrossRef]
  49. Morard, P.; Silvestre, J. Plant injury due to oxygen deficiency in the root environment of soilless culture: A review. Plant Soil 1996, 184, 243–254. [Google Scholar] [CrossRef]
  50. Wang, G.G.; Klinka, K. Use of synoptic variables in predicting white spruce site index. For. Ecol. Manag. 1996, 80, 95–105. [Google Scholar] [CrossRef]
  51. Wang, G.G. Use of understory vegetation in classifying soil moisture and nutrient regimes. For. Ecol. Manag. 2000, 129, 93–100. [Google Scholar] [CrossRef]
  52. Steffens, D.; Hutsch, B.W.; Eschholz, T.; Losak, T.; Schubert, S. Water logging may inhibit plant growth primarily by nutrient deficiency rather than nutrient toxicity. Plant Soil Environ. 2005, 51, 545–552. [Google Scholar] [CrossRef] [Green Version]
  53. Um, M.J.; Cho, W.C.; Rim, H.W. Rainfall adjustment on duration and topographic elevation. J. Korea Water Resour. Assoc. 2007, 40, 511–521. [Google Scholar] [CrossRef] [Green Version]
  54. Yun, H.S.; Um, M.J.; Cho, W.C.; Heo, J.H. Orographic precipitation analysis with regional frequency analysis and multiple linear regression. J. Korea Water Resour. Assoc. 2009, 42, 465–480. [Google Scholar] [CrossRef] [Green Version]
  55. Wang, T.; Liang, Y.; Ren, H.; Yu, D.; Ni, J.; Ma, K. Age structure of Picea schrenkiana forest along an altitudinal gradient in the central Tianshan Mountains, northwestern China. For. Ecol. Manag. 2004, 196, 267–274. [Google Scholar] [CrossRef]
  56. Bigler, C.; Gavin, D.G.; Gunning, C.; Veblen, T.T. Drought induces lagged tree mortality in a subalpine forest in the Rocky Mountains. Oikos 2007, 116, 1983–1994. [Google Scholar] [CrossRef]
  57. Van Mantgem, P.J.; Stephenson, N.L.; Mutch, L.S.; Johnson, V.G.; Esperanza, A.M.; Parsons, D.J. Growth rate predicts mortality of Abies concolor in both burned and unburned stands. Can. J. For. Res. 2003, 33, 1029–1038. [Google Scholar] [CrossRef]
  58. Stephenson, N.L.; Van Mantgem, P.J.; Bunn, A.G.; Bruner, H.; Harmon, M.E.; O’Connell, K.B.; Urban, D.L.; Franklin, J.F. Causes and implications of the correlation between forest productivity and tree mortality rates. Ecol. Monogr. 2011, 81, 527–555. [Google Scholar] [CrossRef] [Green Version]
  59. Das, A.J.; Stephenson, N.L. Improving estimates of tree mortality probability using potential growth rate. Can. J. For. Res. 2015, 45, 920–928. [Google Scholar] [CrossRef]
  60. Allen, C.D. Climate-induced forest dieback: An escalating global phenomenon. Unasylva 2009, 231, 43–49. [Google Scholar]
  61. Seo, J.-W.; Kim, Y.-J.; Choi, E.-B.; Park, J.-H.; Kim, J.-H. Investigation of death years and inter-annual growth reduction of Korean firs (Abies koreana) at Yeongsil in Mt. Halla. J. Korean Environ. Res. Technol. 2019, 22, 1–14. [Google Scholar] [CrossRef]
  62. Western, A.W.; Grayson, R.B.; Blöschl, G.; Willgoose, G.R.; McMahon, T.A. Observed spatial organization of soil moisture and its relation to terrain indices. Water Resour. Res. 1999, 35, 797–810. [Google Scholar] [CrossRef] [Green Version]
  63. Wilson, J.P.; Gallant, J.C. Terrain Analysis: Principles and Applications; John Wiley & Sons: Hoboken, NJ, USA, 2000. [Google Scholar]
  64. Qiu, Y.; Fu, B.; Wang, J.; Chen, L. Soil moisture variation in relation to topography and land use in a hillslope catchment of the Loess Plateau, China. J. Hydrol. 2001, 240, 243–263. [Google Scholar] [CrossRef]
Figure 1. (a, b) Location of the study area, and (c) APMR (accumulated percent mortality rate, %) map of the Korean fir in the study area. APMR was analyzed for the area within a radius of 30 m around each mapped Korean fir tree by QGIS.
Forests 11 00391 g001
Figure 2. (a) Distribution maps of the APMR. (b) Total tree density. (c) Live tree density. (d) Location of the sections for the altitudinal variation analysis of the Korean fir, in relation to the aspect of Mt. Halla. The cells used for analysis, each containing at least 36 Korean firs, are filled in blue. The size of each cell in the figures is 60 × 60 m. The star in Figure 2d represents the location of the analysis for the distribution of Korean fir in the area with heterogeneous topography. The dot (YS) indicates the location of the Yeongsil area. APMR: accumulated percent mortality rate. TTD: total tree density. LTD: live tree density.
Forests 11 00391 g002
Figure 3. Altitudinal pattern of APMR (a) and density of Korean fir (b).
Forests 11 00391 g003
Figure 4. Altitudinal variation of the APMR, density of the Korean fir, and annual solar radiation on different aspects of Mt. Halla. (ac) show the data for the northern and southeastern sections of Mt. Halla and (df) show the data for the northeastern and southwestern sections of Mt. Halla. Locations of each section are shown in Figure 2.
Forests 11 00391 g004
Figure 5. (ac) and (df) show the altitudinal variation of APMR, density of Korean fir, and annual solar radiation in the three sections on the eastern and the western sections of Mt. Halla, respectively. Locations of each section are shown in Figure 2.
Forests 11 00391 g005
Figure 6. Distribution of the Korean fir (cf) in the small area with heterogeneous topography, where it can be assumed that the rainfall is uniform throughout the area. The location of the site is marked with a star in Figure 2d (a,b).
Forests 11 00391 g006
Figure 7. (a) Annual precipitation recorded at the Jeju Meteorological Office from 1923 to 2018 (modified from Reference [25]). (b) Annual precipitation deviation from the blue dashed regression line in panel (a). Black arrows show the time of the lowest growth rate of the Korea firs obtained from the dendrochronological analysis by Koo et al. [8]. The low growth rate of the Korean firs occurred after long-term persistence of the high rainfall. The period of above-average precipitation that persisted is shown with orange bars. (c) Master chronology established from tree-ring analysis for 10 living firs at Yeongsil in Mt. Halla (after Reference [61]).
Forests 11 00391 g007
Table 1. Distribution status of Korean fir in the study area.
No. of CellsArea
(ha)
No. of Total FirsNo. of Live FirsNo. of Dead FirsAvg.
APMR
(%)
Avg. TTD
(Trees/100 m2)
Total analyzed cells15,3005508.0541,055342,228198,82736.75
>36 trees/3600 m230751107.0495,775315,145180,63036.434.48
<36 trees/3600 m212,2254401.045,28027,08318,19740.190.10
Abbreviations: TTD, Total Tree Density (no. of live firs plus no of dead firs/100 m2); APMR, accumulated percent mortality rate; Avg., Average.
Table 2. Pearson correlation analysis for the investigated distribution features of the Korean fir and topographic factors.
No. of Live FirsNo. of
Dead Firs
No. of Total FirsAPMRAspectSlopeASRAltitude
No. of live firs10.100 **0.711 **−0.333 **−0.017 −0.114 **0.133 **0.352 **
No. of
dead firs
10.771 **0.691 **−0.286 **−0.195 **0.095 **0.478 **
No. of total firs10.275 **−0.213 **−0.211 **0.152 **0.563 **
APMR1−0.250 **−0.187 **0.0310.157 **
Aspect10.103 **−0.078 **0.027
Slope1−0.721 **0.281 **
ASR1−0.195 **
Altitude1
Abbreviations: APMR, accumulated percent mortality rate; ASR, annual solar radiation. Note: Each number in a cell is the Pearson correlation coefficient. ** Correlation is significant at the 0.01 level (2-tailed). * Correlation is significant at the 0.05 level (2-tailed.).
Table 3. t-test for APMR, tree density, ground slope, and ASR between one cell group with the highest 50% APMR range and another cell group with the lowest 50% APMR range, from 1300 m to 1900 m in altitude.
Altitude Range
(No. of Grid Cells)
t-Test for APMRt-Test for TTD
① Highest 50% APMR Range② Lowest 50% APMR RangeΔAPMR_%
(①-②)
Sig.① Highest 50% APMR Range② Lowest 50% APMR RangeΔTTD_/100m2
(①-②)
Sig.
Avg.
APMR
SDAvg.
APMR
SDAvg.
TD
SDAvg.
TD
SD
1170–1937 m(3075)51.2620.2211.746.9039.520.0005.11 3.68 3.85 2.54 1.26 0.000
Altitude range
(No. of grid cells)
t-test for ground slopet-test for ASR
① Highest 50% APMR range② Lowest 50% APMR rangeΔSlope_deg
(①-②)
sig.① Highest 50% APMR range② Lowest 50% APMR rangeΔASR_%
(①-②)
sig.
avg.
slope
SDavg.
slope
SDavg.
ASR
SDavg.
ASR
SD
1170–
1937 m
(3075)
16.787.7519.719.57−2.920.00085.979.1285.3010.020.670.053
Abbreviations: APMR, accumulated percent mortality rate; ASR, annual solar radiation; SD, standard deviation; TTD, total tree density; sig., significance level.
Table 4. t-test for APMR, tree density, ground slope and ASR between one cell group with highest 50% density range and another cell group with lowest 50% density range, from 1300 m to 1900 m in altitude.
Altitude Range (No. of Grid Cells)t-Test for APMR Slopet-Test for TTD
① Highest 50% Density Range② Lowest 50% Density RangeΔAPMR%
(①-②)
Sig.① Highest 50% Density Range② Lowest 50% Density RangeΔTTD_/100m2
(①-②)
Sig.
Avg.
APMR
SDAvg.
APMR
SDAvg.
TD
SDAvg.
TD
SD
1300–1900 m (3039)34.7725.2328.2524.096.520.0006.92 2.87 2.03 0.77 4.89 0.000
Altitude range
(No. of grid cells)
t-test for ground slopet-test for ASR
① Highest 50% Density range② Lowest 50% Density rangeΔSlope_deg
(①-②)
sig.① Highest 50% Density range② Lowest 50% Density rangeΔASR_%
(①-②)
sig.
avg.
slope
SDavg.
slope
SDavg.
ASR
SDavg.
ASR
SD
1300–1900 m (3039)16.527.4619.979.71−3.460.00086.638.0884.6410.791.990.000
Abbreviations: APMR, accumulated percent mortality rate; ASR, annual solar radiation; SD, standard deviation; TTD, total tree density.
Table 5. APMR and density of the Korean fir within each 100 m altitude interval.
Altitude (m)No. of Grid Cells
(60 × 60 m)
No. of Korean FirsMean Percent Mortality Rate (%)Mean Density of Korean Fir
(Trees/100 m2)
LiveDeadTotal
1100–120031592118011.671.67
1200–13001133314347630.041.20
1300–14008927661902466840.751.46
1400–150058729,88817,30847,19636.672.23
1500–16001123118,80734,584153,39122.553.79
1600–1700804105,19055,658160,84834.605.56
1700–180031642,32848,61090,93853.457.99
1800–190012010,63520,60631,24165.967.23
1900–19502250391798683726.308.63
Total3075315,145180,630495,77536.434.48
Table 6. t-test for APMR, tree density, ground slope, and ASR between the cell group with the highest 50% APMR range and the cell group with the lowest 50% APMR range within each 100 m altitudinal interval from 1300 m to 1900 m.
Altitude Range
(No. of Grid Cells)
t-Test for APMRt-Test for TTD
① Highest 50% APMR Range② Lowest 50% APMR RangeΔAPMR_%
(①-②)
Sig.① Highest 50% APMR Range② Lowest 50% APMR RangeΔTTD_/100m2
(①-②)
Sig.
Avg.
MR
SDAvg.
MR
SDAvg.
TD
SDAvg.
TD
SD
1300–1400 m (89)70.8717.4216.6913.5654.170.0001.28 0.31 1.64 0.83 −0.36 0.009
1400–1500 m (587)54.4422.2012.837.6541.610.0002.40 1.27 2.07 1.26 0.33 0.001
1500–1600 m (1123)38.1518.848.574.8629.580.0003.79 2.09 3.80 2.04 −0.02 0.902
1600–1700 m (804)47.7118.0812.757.0834.950.0006.34 3.12 4.78 2.73 1.56 0.000
1700–1800 m (316)68.7810.3227.1814.4141.600.0009.69 4.03 6.29 3.46 3.40 0.000
1800–1900 m (120)79.9113.3127.5615.9352.350.0009.95 3.76 4.51 3.09 5.45 0.000
Altitude range
(No. of grid cells)
t-test for ground slopet-test for ASR
① Highest 50% APMR range② Lowest 50% APMR rangeΔSlope_deg
(①-②)
sig.① Highest 50% APMR range② Lowest 50% APMR rangeΔASR
(①-②)
sig.
avg.
slope
SDavg.
slope
SDavg.
ASR
SDavg.
ASR
SD
1300–1400 m (89)15.334.4814.754.620.580.54787.674.6189.234.16−1.560.097
1400–1500 m (587)14.294.7417.437.73-3.150.00088.746.1186.108.432.640.000
1500–1600 m (1123)16.125.6519.719.46-3.600.00086.987.4984.9310.362.050.000
1600–1700 m (804)16.538.6819.558.86-3.020.00086.3110.1185.2110.341.100.128
1700–1800 m (316)16.927.7125.2111.08-8.300.00084.979.7481.8911.953.080.012
1800–1900 m (120)19.006.0434.9412.89-15.950.00081.997.1873.3614.508.620.000
Abbreviations: APMR, accumulated percent mortality rate; ASR, annual solar radiation; SD, standard deviation; TTD, total tree density.
Table 7. Pearson correlation analysis between APMR and other factors within each 100 m altitudinal interval.
Altitude Range
(No. of Grid Cells)
No. of Live FirsNo. of
Dead Firs
No. of Total FirsAspectSlopeASRAltitude
1300–1400 m (89)−0744 **0.875 **−0.242 *−0.651 **0.153−0.298 **−0.027
1400– 1500 m (587)−0.485 **0.784 **0.198 **−0.447 **−0.212 **0.08−0.190 **
1500– 1600 m (1,123)−0.428 **0.718 **−0.075 *0.130 **−0.224 **0.048−0.077 **
1600– 1700 m (804)−0.316 **0.839 **0.361 **−0.390 **−0.191 **0.0520.202 **
1700– 1800 m (316)−0.455 **0.794 **0.436 **−0.438 **−0.426 **0.0690.281 **
1800–1900 m (120)−0.440 **0.851 **0.676 **−0.544 **−0.738 **0.483 **−0.223 *
Abbreviations: APMR, accumulated percent mortality rate; ASR, annual solar radiation. Note: Each number in a cell is the calculated Pearson correlation coefficient. ** Correlation is significant at the 0.01 level (2-tailed). * Correlation is significant at the 0.05 level (2-tailed).
Table 8. Pearson correlation analysis between density of Korean fir and other factors within each 100 m altitudinal interval.
Altitude Range
(No. of Grid Cells)
No. of Live FirsNo. of
Dead Firs
APMRAspectSlopeASRAltitude
1300–1400 m (89)0.807 **0.167−0.242 *−0.054−0.048−0.0080.161
1400–1500 m (587)0.683 **0.630 **0.198 **−0.254 **−0.300 **0.204 **0.227 **
1500–1600 m (1123)0.909 **0.485 **−0.075 *−0.247 **−0.353 **0.232 **0.201 **
1600–1700 m (804)0.714 **0.699 **0.361 **−0.246 **−0.475 **0.324 **0.138 **
1700–1800 m (316)0.510 **0.840 **0.436 **−0.464 **−0.600 **0.506 **0.113 *
1800–1900 m (120)0.187 *0.916 **0.676 **−0.447 **−0.591 **0.342 **−0.114
Abbreviations: APMR, accumulated percent mortality rate; ASR, annual solar radiation. Note: Each number in a cell is the calculated Pearson correlation coefficient. ** Correlation is significant at the 0.01 level (2-tailed). * Correlation is significant at the 0.05 level (2-tailed).
Table 9. Distribution features of the Korean fir within three small sites with different topographic features.
SiteArea
(m2)
Number of TreesDensity of Korean Firs (Trees/100 m2)APMR
(%)
Mean
Aspect
Mean Slope
(deg.)
ASR
(% of Max.)
Mean Altitude
(m)
DeadLiveTotal
A71742212965177.2142.7525812.585.61647
B9622492593083.215.915925.570.11637
C 10,519604855455.1811.0126421.883.51629
Table 10. Previous studies on the distribution of the Korean fir on Mt. Halla.
Year *Area
(ha)
Method of Calculation of Distribution Area of Korean FirData Used for Determination of Distribution AreaRef.
2003603.3Combining all the areas of each Korean fir stand around Mt. Halla (identified using aerial images).non-orthorectified aerial images of 45 cm horizontal resolution20
2006738.3Sum area of grid (15 × 15 m) with crown density > 10%.orthorectified aerial images of 30 cm horizontal resolution23
2009803.6Combining all the areas of each Korean fir stand around Mt. Halla (identified using aerial images).orthorectified aerial images of 30 cm horizontal resolution21
2015626.0Sum area of grid (15 × 15 m) with crown density > 10%.orthorectified aerial images of 25 cm horizontal resolution23
20141508.0Sum area with crown density > 5%.orthorectified aerial images of 10 cm horizontal resolution24
757.0Sum area with crown density > 10%.
2017928.8Sum area of grid (60 × 60 m) with tree density > 36 trees/3600 m2 by counting individual tree under digital photogrammetric system.orthorectified aerial images of 8 cm horizontal resolutionThis study
* Year of aerial image capture used for calculation of distribution area of Korean fir.
Table 11. Distribution area of the Korean fir on Mt. Halla.
No. of Grid CellsArea
(ha)
No. of Total Firs No. of Live FirsNo. of Dead FirsAvg. APMR
(%)
Avg. TTD
(Trees/100 m2)
Total analyzed cells15,3005508.0 541,055342,228198,82736.75
LTD > 36 trees/3600 m22579928.4 456,192304,178152,01433.32 4.91
Note: Distribution area of Korean fir is shown as distribution map of live tree density in Figure 2c. Abbreviations: APMR, accumulated percent mortality rate; LTD, live tree density; TTD, total tree density.

