Article

Effect of Textural Features in Remote Sensed Data on Rubber Plantation Extraction at Different Levels of Spatial Resolution

1
State Key Laboratory of Resources and Environmental Information System, Institute of Geographic Sciences and Natural Resources Research, Chinese Academy of Sciences, Beijing 100101, China
2
University of Chinese Academy of Sciences, Beijing 100049, China
3
CAS Engineering Laboratory for Yellow River Delta Modern Agriculture, Institute of Geographic Sciences and Natural Resources Research, Chinese Academy of Sciences, Beijing 100101, China
4
Key Laboratory of Ecosystem Network Observation and Modeling, Institute of Geographical Sciences and Natural Resources Research, Chinese Academy of Sciences, Beijing 100101, China
5
Environmental Engineering and Disaster Management Program, School of Multidisciplinary, Mahidol University, Kanchanaburi Campus, Sai Yok, Kanchanaburi 71150, Thailand
*
Author to whom correspondence should be addressed.
These authors contributed equally to this work.
Forests 2020, 11(4), 399; https://doi.org/10.3390/f11040399
Submission received: 8 March 2020 / Revised: 28 March 2020 / Accepted: 31 March 2020 / Published: 2 April 2020
(This article belongs to the Section Forest Inventory, Modeling and Remote Sensing)

Abstract

:
The expansion of rubber (Hevea brasiliensis) plantations has been a critical driver for the rapid transformation of tropical forests, especially in Thailand. Rubber plantation mapping provides basic information for surveying resources, updating forest subplot information, logging, and managing the forest. However, due to the diversity of stand structure, complexity of the forest growth environment, and the similarity of spectral characteristics between rubber trees and natural forests, it is difficult to discriminate rubber plantation from natural forest using only spectral information. This study evaluated the validity of textural features for rubber plantation recognition at different spatial resolutions using GaoFen-1 (GF-1), Sentinel-2, and Landsat 8 optical data. C-band Sentinel-1 10 m imagery was first used to map forests (including both rubber plantations and natural forests) and non-forests, then the pixels identified as forests in the Sentinel-1 imagery were compared with GF-1, Sentinel-2, and Landsat 8 images to separate rubber plantations and natural forest using two different approaches: a method based on spectral information characteristics only and a method combining spectral and textural features. In addition, we extracted textural features of different window sizes (3 × 3 to 31 × 31) and analyzed the influence of window size on the separability of rubber plantations and natural forests. Our major findings include: (1) the suitable texture extraction window sizes of GF-1, Sentinel-2, and Landsat 8 are 31 × 31, 11 × 11 to 15 × 15, and 3 × 3 to 7 × 7, respectively; (2) correlation (COR) is a robust textural feature in remote sensing images with different resolutions; and (3) compared with classification by spectral information only, the producer’s accuracy of rubber plantations based on GF-1, Sentinel-2, and Landsat 8 was improved by 8.04%, 9.44%, and 8.74%, respectively, and the user’s accuracy was increased by 4.63%, 4.54%, and 6.75%, respectively, when the textural features were introduced. These results demonstrate that the method combining textural features has great potential in delineating rubber plantations.

1. Introduction

Of the 56.8 million hectares (ha) of plantations in the tropics in 2015, 29.9 million ha are in South and Southeast Asia [1]. These plantations are crucial in global climate change regulation [2] and natural resource protection [1] as they not only increase carbon dioxide fixation and carbon sink with high growth rates, but also provide large quantities of wood and other products and services [3]. Although there are so many benefits, the process of plantation expansion has also caused ecological and environmental problems including soil erosion and natural forest reduction. Natural rubber (latex) is a necessary, strategic material for national development, and the rubber tree is the only source of natural rubber products. Due to its suitable climate and growing conditions, Southeast Asia has the largest proportion of rubber plantations in the world [2]. In recent years, rubber planting areas have dramatically expanded in many Southeast Asian countries due to the increasing global demand for natural rubber products. In order to solve poverty, the Thai government launched a plan to promote rubber plantations in northeastern Thailand from 2003 to 2013. As a result, the planting area of rubber plantations in northeastern Thailand has expanded rapidly in the past decade. While large-scale rubber planting increases the income of local governments and farmers, it also causes many ecological and environmental problems, such as the dramatic reduction of tropical rainforest, soil degradation, and loss of biodiversity in rubber planting areas [4,5]. Timely, accurate maps of rubber plantations are required to manage forests effectively and document the expansion of rubber plantations.
Remote sensing is a powerful and efficient tool to extract rubber plantations from the surrounding landscape. A number of studies have used optical satellite data to detect rubber plantations, mostly relying on spectral signatures like NDVI, EVI, LSWI, and SWIR1 of optical images to delineate rubber plantations [6,7]. However, rubber plantations in Mainland Southeast Asia grow in tropical rainforest areas with complex ecosystems, characterized by high vegetation coverage and less seasonal variation. Rubber plantations have similar spectral characteristics compared to natural forests because the spectral coefficients of rubber plantations tend to be saturated, especially during peak growing seasons or after stands reach a certain age [8,9]. These problems bring considerable uncertainty to rubber plantation extraction and monitoring based on spectral and vegetation indices [9].
Textural features in satellite imagery contain spatial information that is very important for feature extraction because textures do not depend on the tone or brightness of the object surface and can reflect gray information, spatial distribution, and structural information about the image. Textural features are relatively stable compared with spectral characteristics, which are susceptible to the external environment. Some studies have employed textural features for mapping crops, monitoring built-up areas [10], detecting wetlands [11], classifying tree species [12,13], and mapping land cover [14,15]. The effectiveness of textural features on tree species identification has been confirmed by adding them to the classification procedure of high- to relatively low-resolution satellite images. In the study of mapping plantation extent based on Landsat-8 Operational Land Imager (OLI), Synthetic Aperture Radar-2 (PALSAR-2), and Sentinel-1A images, Torbick et al. [9] found textural features could capture the homogeneity of the plantation canopy, spacing, and structure relative to natural forests and were useful for distinguishing oil palm and rubber plantation from other land cover types. Dian et al. [16] confirmed that combining the spectral and spatial information derived from Airborne Hyperspectral Imagery could improve the accuracy of tree species classification. Textures derived from high spatial resolution QuickBird image [17] and the WorldView-3 satellite image [18] were also proved for their potentials in detecting species-specific differences in crown structure, thus for better tree species mapping. Despite many existing efforts, some problems relative to the application of textures to specific tree species like rubber tree mapping require further investigation. Since no single window size could adequately characterize the range of textural conditions in one image [10], what is the effect of window sizes on textures measure and which textural features are more useful and robust for specific tree species discriminating? Furthermore, the textural features strongly depend on spatial resolution of the images used [19], then what is the effect of remote sensing images at different spatial resolutions on specific tree species identification?
In this study, three satellite data including GaoFen-1 (GF-1), Sentinel-2, and Landsat 8 imagery with different resolutions were used for testing and analyzing the effect of textural features on rubber plantation extraction in tropical Thailand. The specific objectives of this study are to (1) define appropriate window sizes for each individual textural feature of different spatial resolution images; (2) quantify the importance of texture variables and identify the effective textural features; and (3) evaluate the applicability of satellite images at different spatial resolutions on the extraction of rubber plantations.

2. Materials and Methods
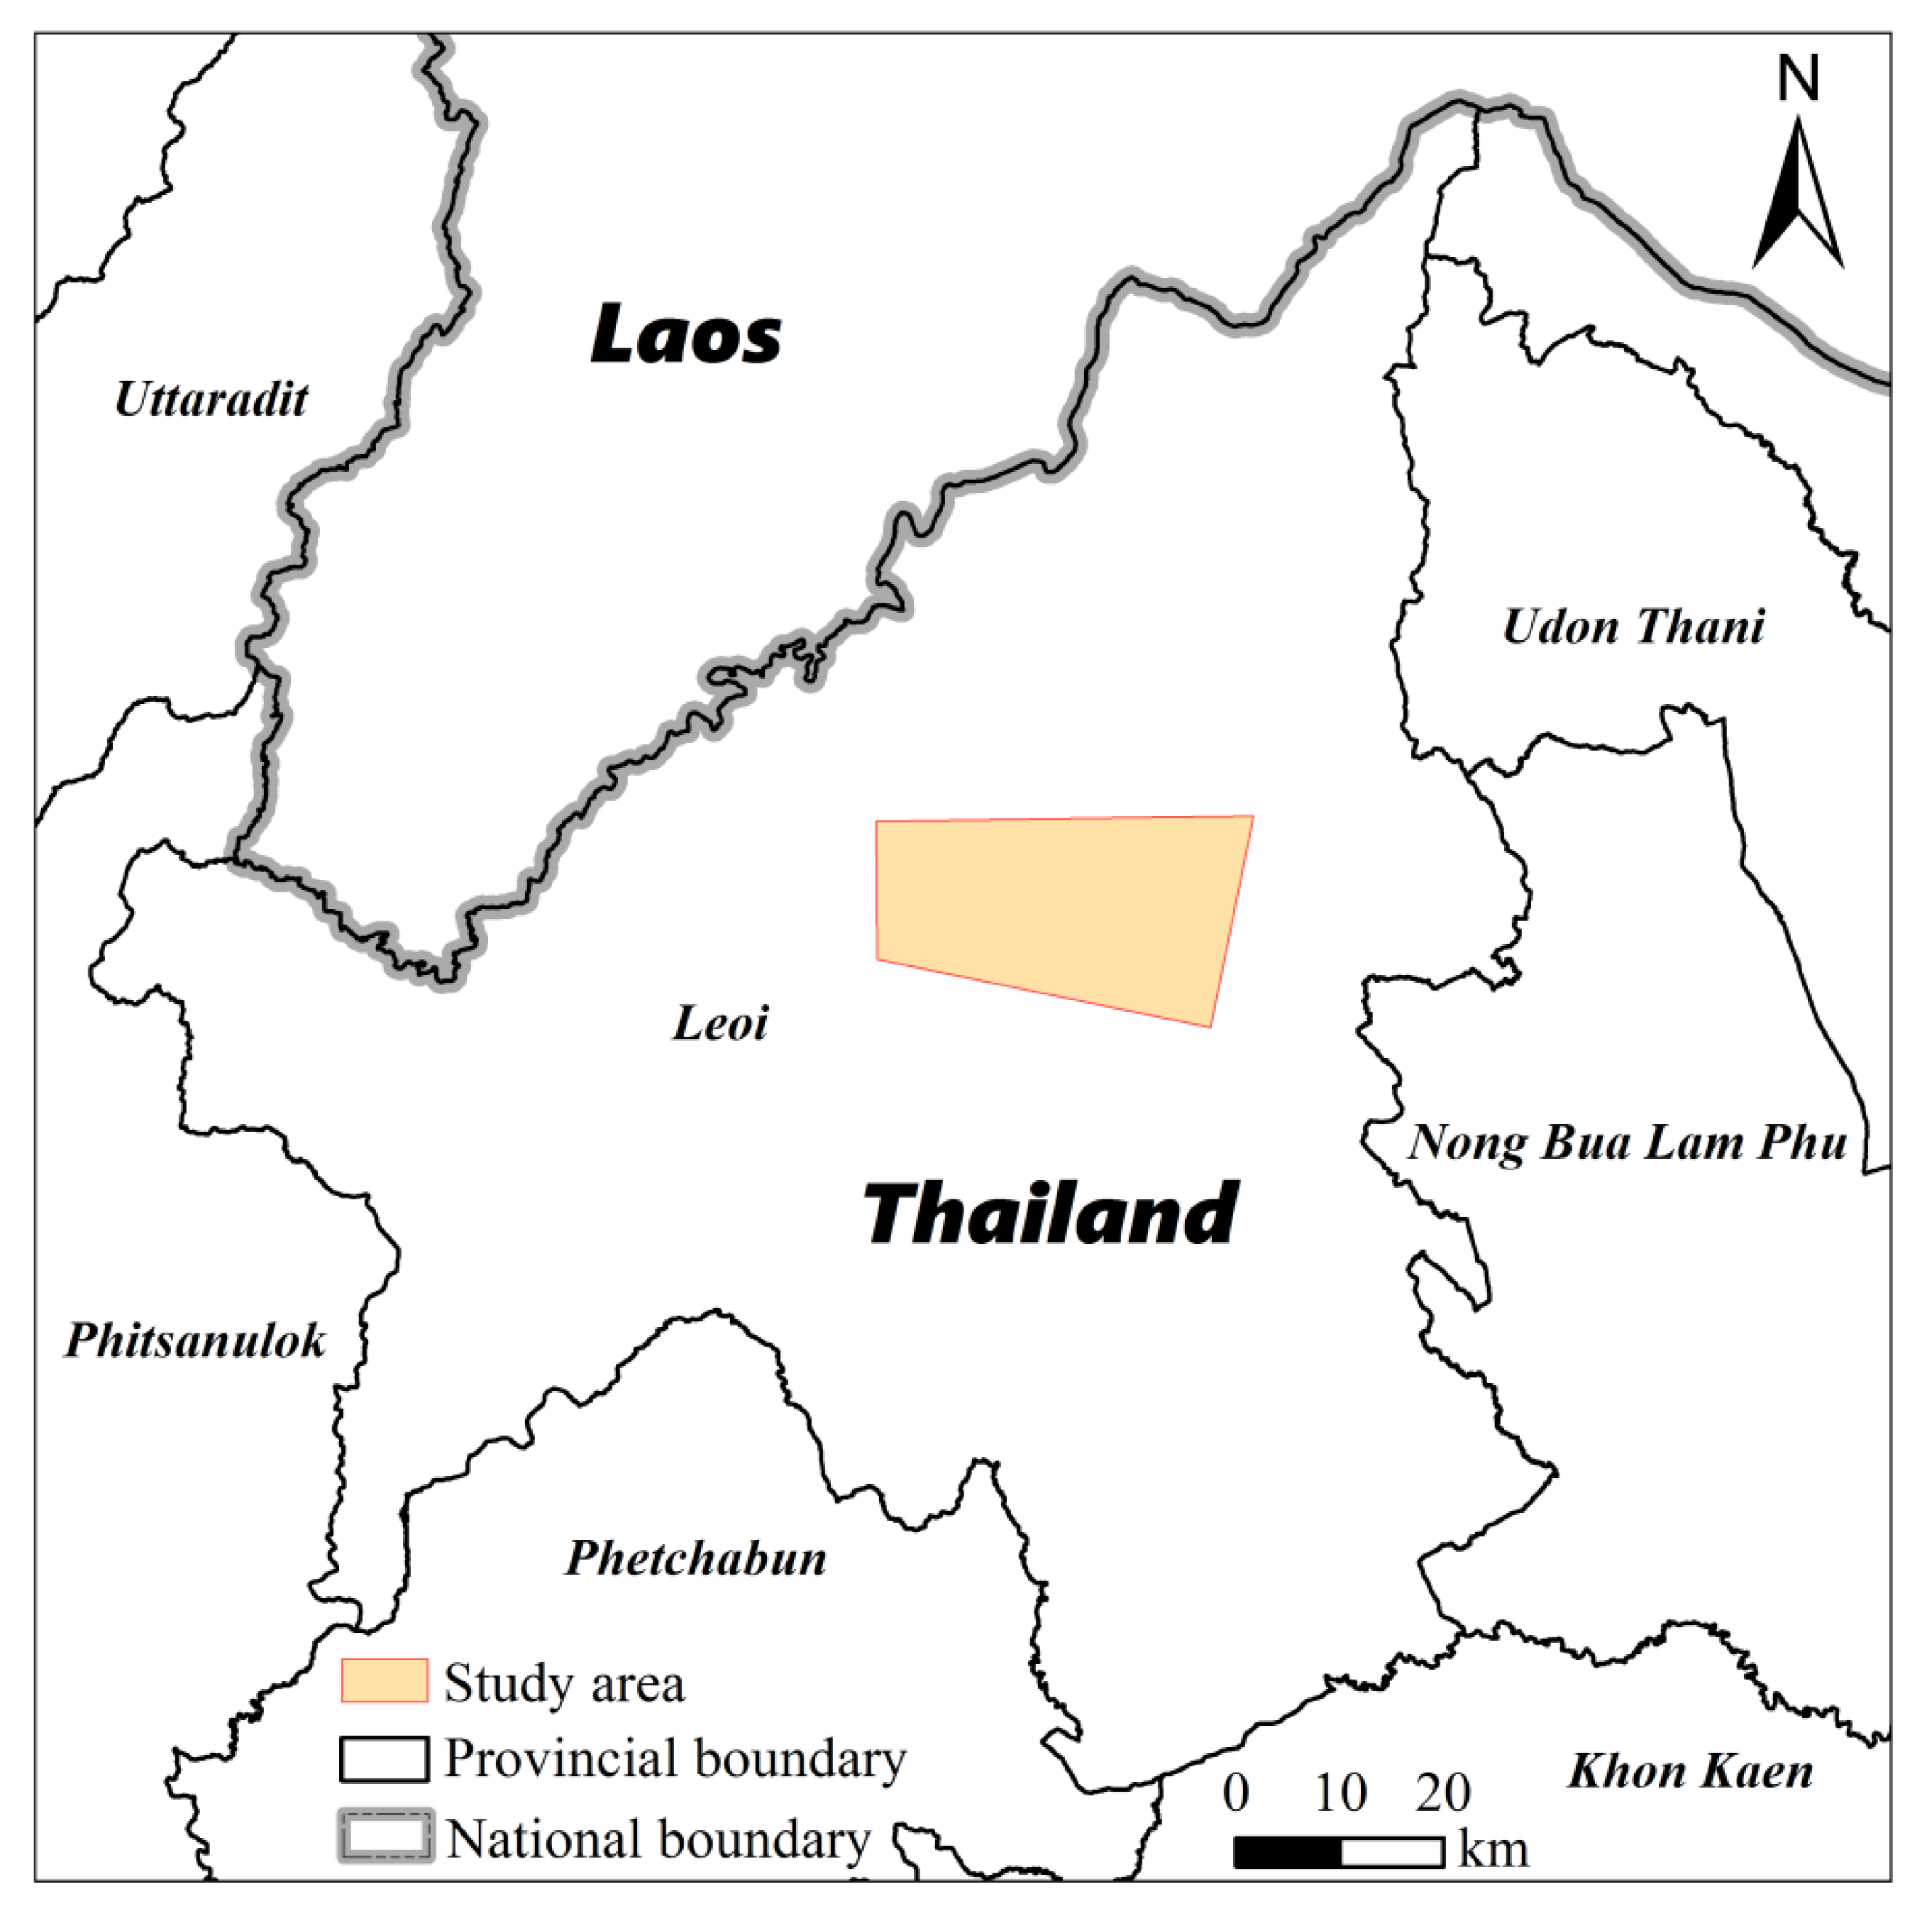
2.1. Study Area

Northeastern Thailand is located on the Khorat Plateau with an altitude between 100 m and 200 m. It belongs to a humid subtropical monsoon climate, with obvious dry and wet seasons. Heavy rainfall is concentrated in the rainy season from May to October. The highest temperature, often in April, can reach 40 °C while in December, the night temperature usually falls below 0 °C. Traditionally, northeastern Thailand has been an important cultivation area, with fewer rubber plantations [20]. Stirred by an aggressive government policy for rubber plantations since 2003, dramatic expansions have been seen in the south, the traditional rubber plantation area in Thailand. Then the plantations gradually spread to northeastern Thailand to meet the demand for large areas of land [21]. As a result, many patches of cropland and natural forest have been encroached by rubber plantations. A subset image of GF-1, Sentinel-2, and Landsat 8 image within Northeastern Thailand was derived as the experiment area (Figure 1) in this study, where massive rubber planting activity is prompting a significant encroachment to natural forest and other land cover types.

2.2. Datasets and Pre-Processing

2.2.1. Sentinel-1

A total of 92 scenes of Sentinel-1A and Sentinel-1B Interferometric Wide Swath GRD images of 2018 from the Google Earth Engine (GEE) [22] platform were used for forests mapping at the first step. The Sentinel-1 data was pre-processed with the Sentinel-1 Toolbox [23] using thermal noise removal, radiometric calibration, and terrain correction. A Refined Lee filter was applied to de-speckle each image. The final terrain-corrected values were converted to decibels via log scaling (10 × log10(x)), where x is the digital number value of pixels in vertical transmit and vertical receive (VV) or vertical transmit and horizontal receive (VH). The Ratio and Difference between VV and VH were calculated based on Equations (1) and (2).
Ratio = γ VV 0 / γ VH 0 ,
Difference = γ VV 0 γ VH 0 .
where γ VV 0 and γ VH 0 are the backscattering coefficients of VV and VH in decibels.

2.2.2. GaoFen-1

GaoFen-1 (GF-1) imagery was acquired from the China Center for Resource Satellite Data and Application (http://www.cresda.com). The GF-1 image (path/row = 16/128) was obtained on 5th March 2019. Pre-processing steps for GF-1 imagery using ENVI 5.3 software included radiometric calibration, atmospheric correction, orthorectification, projection definition, and image fusion. The FLAASH model was used for atmospheric correction. The orthorectification was done by Rational Polynomial Coefficient (RPC) files. The spatial resolution of GF-1 varies for the different bands—the panchromatic band has a resolution of 2 m and the multispectral bands are 8 m. We applied the Gram-Schmidt [24] method to fuse panchromatic and multispectral images and obtain multispectral images with a spatial resolution of 2 m.

2.2.3. Sentinel-2

Sentinel-2 data was downloaded from the European Space Agency’s Copernicus Scihub (https://scihub.copernicus.eu). The acquired Sentinel-2 data (T47QQV) was obtained on 16th February 2018. The imagery was pre-processed for atmospheric correction using the Sentinel Application Platform (SNAP) 7.0 open-source software [25]. ESA’s Sen2Cor in SNAP was used to convert the top-of-atmosphere reflectance values (TOA) to corrected surface reflectance values. The spatial resolution of Sentinel-2 data varies from 10 m to 60 m. Bands 1, 9, and 10 were excluded from the dataset due to their sensitivity to aerosol and clouds and their spatial resolution (60 m). Then, the image was resampled at 10 m using a bilinear method.

2.2.4. Landsat 8

The Landsat 8 data was downloaded from USGS (https://earthexplorer.usgs.gov/). The data with orbit number path/row = 129/48 was captured on 13th February 2018. The pre-processing for Landsat 8 using ENVI 5.3 included radiometric calibration, atmospheric correction, and geometric correction.
In order to eliminate the geographic deviation, all acquired data were georeferenced in the WGS84 coordinate system and UTM projection, zone 47. Based on a GF-1 image, relative geometric correction was carried out on Sentinel-2 and Landsat 8 data using a 2nd order polynomial. The characteristics of the datasets used in this study are shown in Table 1.

2.2.5. Field Survey Data and Sample Datasets

A set of sample points was collected from field survey information and high-resolution satellite imagery from Google Earth (http://earth.google.com/). We conducted the filed surveys in February and August 2017 and collected 284 rubber plantation sample points, 106 natural forest sample points, and 178 other typical land cover types sample points using GARMIN GPSMAP 639sc. Moreover, we obtained 1478 sample points including 679 rubber plantation sample points, 477 natural forest sample points, and 322 other typical land cover types sample points by visual interpretation from Google Earth.

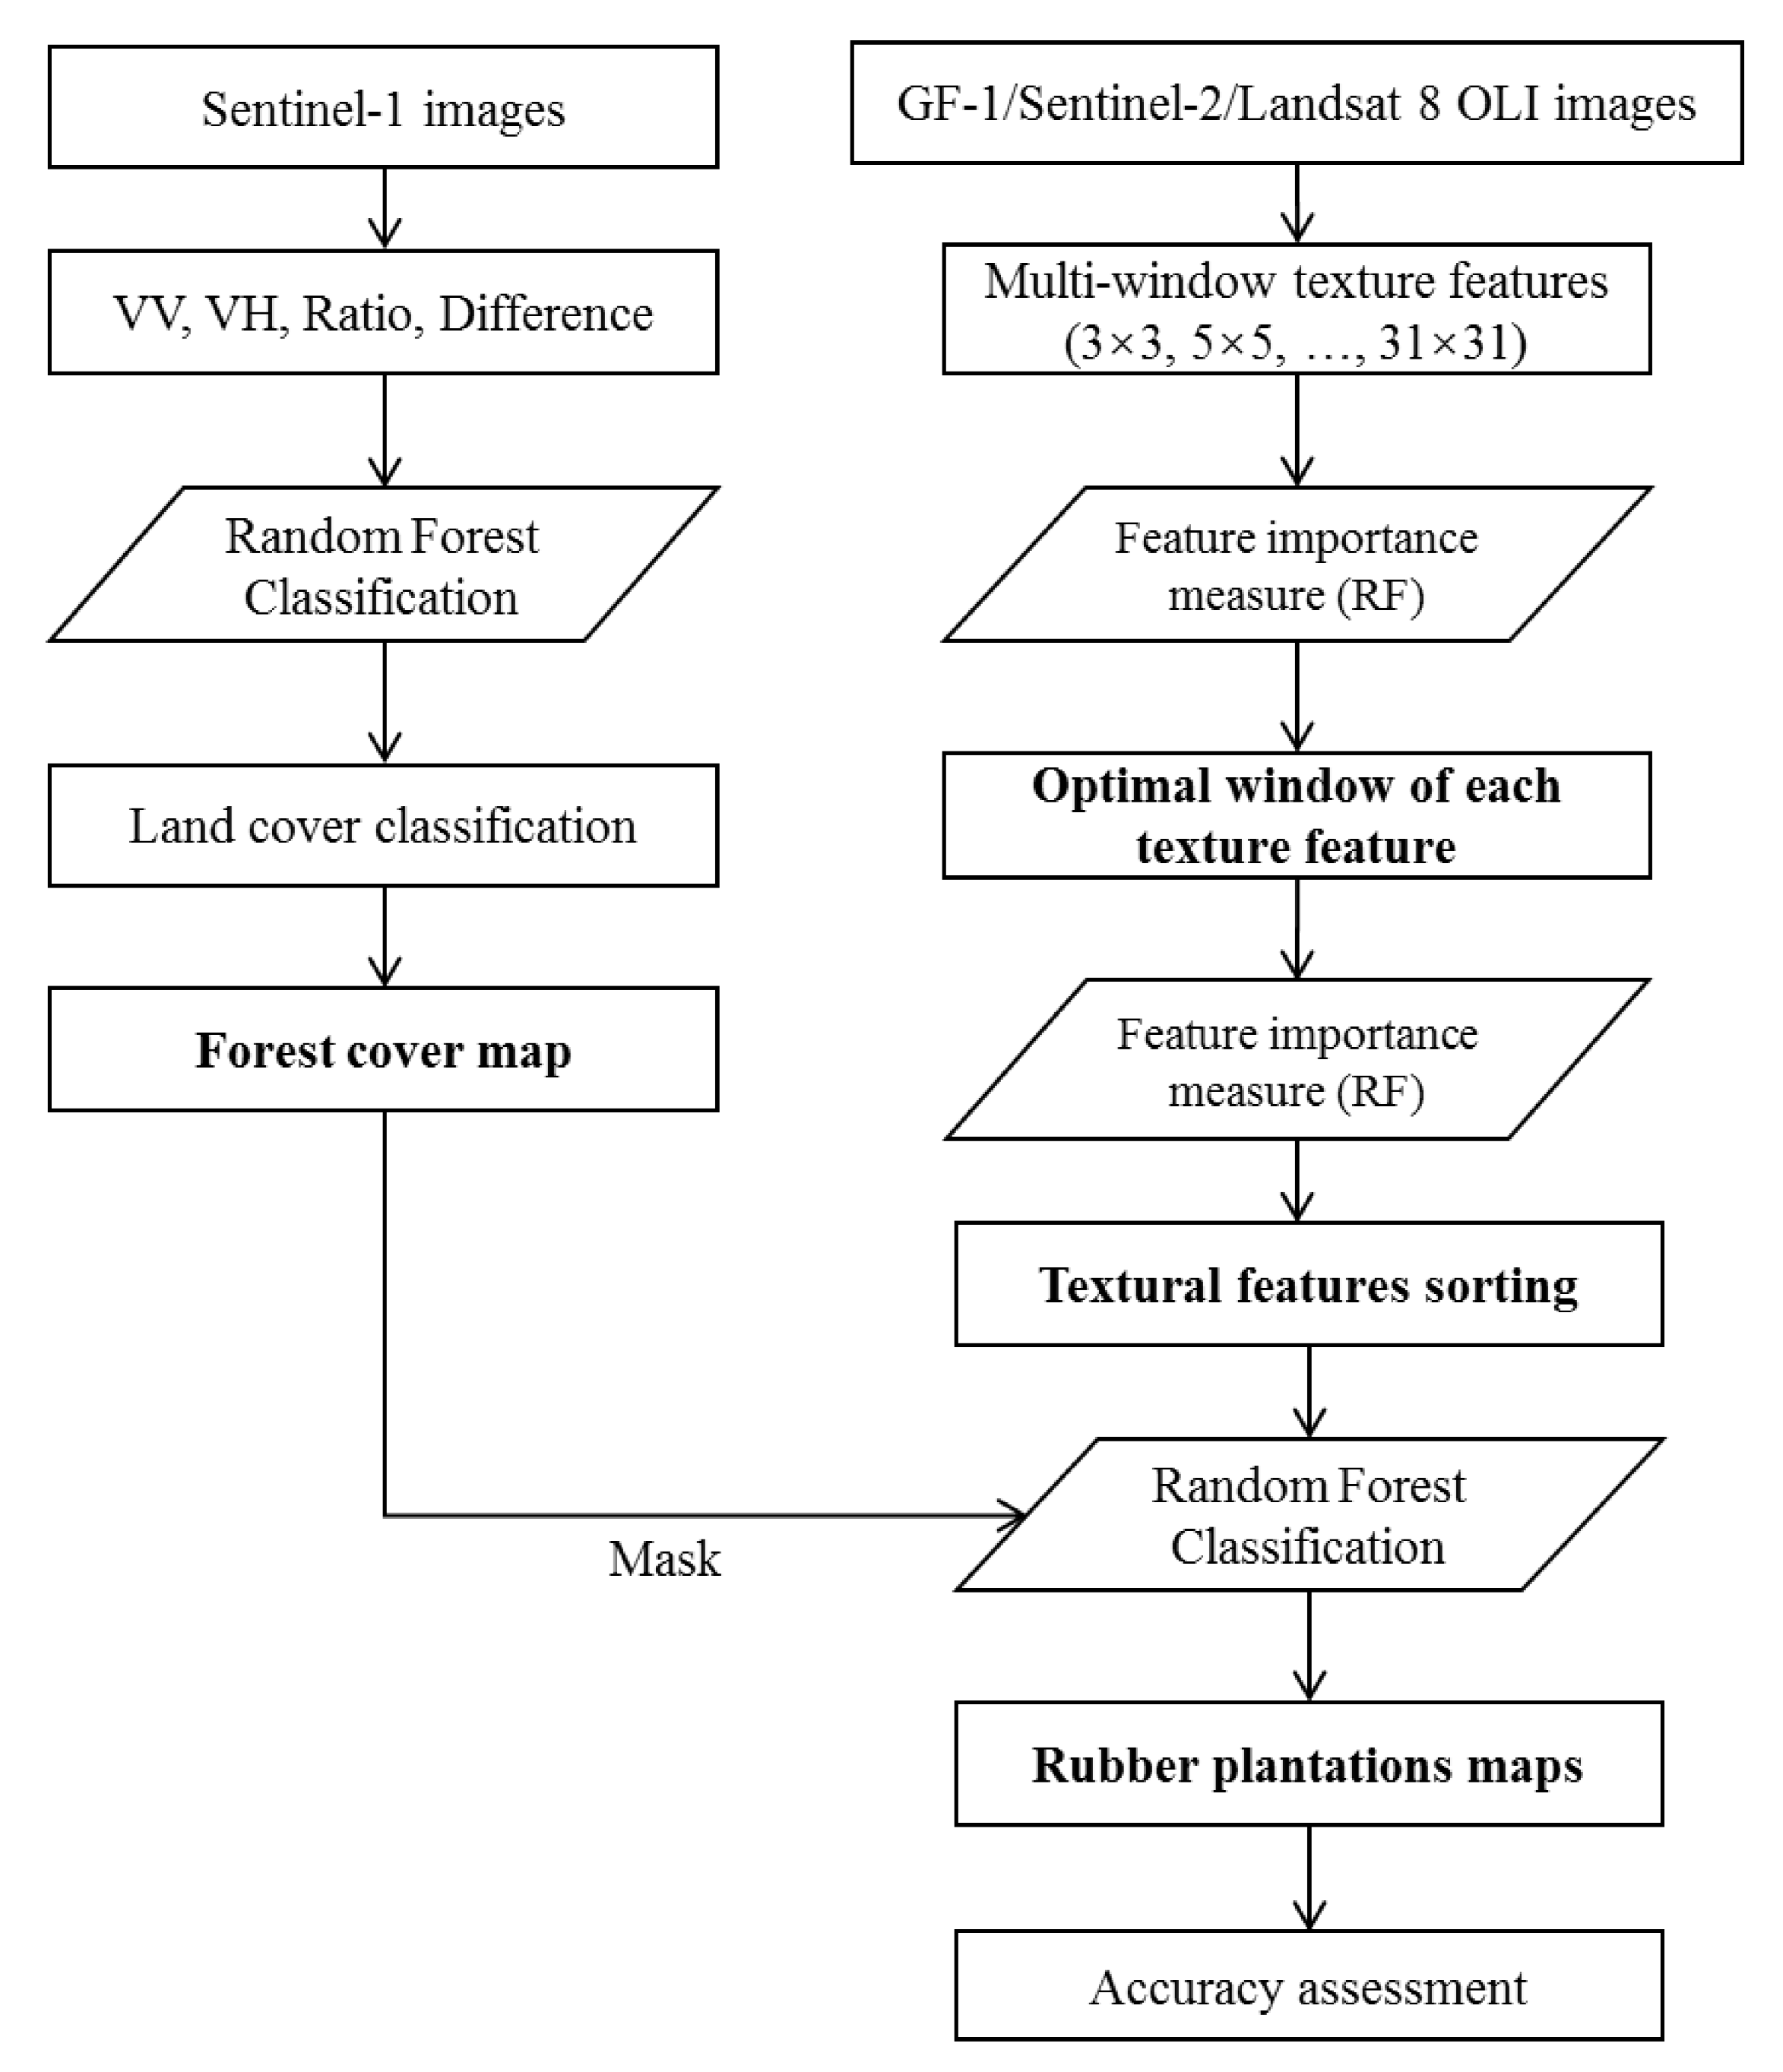
2.3. Texture Processing

The gray-level co-occurrence matrix (GLCM) is currently the most prevalent statistical method to derive textural features [26,27]. We used GLCM to exploit the texture information of GF-1, Sentinel-2, and Landsat 8 images. GLCM is a symmetric matrix with each value representing the probability values of a nearest-neighbor gray tone at a given distance and orientation [26]. This technique first uses a spatial co-occurrence matrix that computes the relationships of pixel values, and then the second-order statistics will be computed by using this matrix. In this study, textural features were retrieved with fifteen window sizes from 3 × 3 to 31 × 31. The following eight textural features including Mean (MEAN), Variance (VAR), Homogeneity (HOM), Contrast (CON), Dissimilarity (DIS), Entropy (ENT), Angular Second Moment (ASM), and Correlation (COR) were computed by the formulas [26] shown in Table 2.
There is a certain degree of correlation between multispectral bands, resulting in information overlap between different bands [11], so we used the first principal component of the images in the principal component analysis (PCA) [28] to extract the textural features. Bands 1–4 were input into the PCA for GF-1 image, Bands 2–8A, 11 and 12 for Sentinel-2 image, and Bands 2–7 for Landsat 8. The variance contribution of the first principal component of GF-1, Sentinel-2A, and Landsat 8 are 92.41%, 69.53%, and 74.34%, respectively.

2.4. Random Forest Classification

Random Forest (RF), proposed by Leo Breiman [29] in 2001, is an ensemble learning algorithm for supervised classification with a decision tree as the basic classifier. Previous studies have shown RF algorithms can process high-dimensional, massive data in parallel with high accuracy compared with other machine learning algorithms. In this study, Random Forest was employed as a tool to classify and assess the effect of textural features in remote sensed data at different spatial resolutions on rubber plantation extraction (Figure 2).

2.4.1. Forests Mapping

Previous studies have proved that mapping forests using SAR data was feasible and accurate [7,30,31]. In this study, Sentinel-1 SAR data were employed to produce the forest map as the baseline for further assessing the effect of textures on classifying rubber plantations from natural forests. The annual average value images of VV, VH, Ratio, and Difference were input to RF model for classifying forests from other land cover types in reference to [31,32]. In this study, a Python script was used to import the GDAL library to read training sample data and the Random Forest classifier was imported from the Scikit-learn library. Each Random Forest was built using ntree = 800 trees, and the number of variables randomly sampled as candidates at each split (mtry) was set by default (sqrt(p), where p is the number of variables). Stratified random sampling of all the 2046 samples was carried out in ArcGIS 10.5, 70% of which were selected to train RF model and the remaining 30% were used for accuracy assessments of forests mapping using confusion matrix. The 10 m forest/non-forest map was obtained by merging non-forest categories and resampled to 2 m and 30 m to match the GF-1 and Landsat 8 spatial resolutions.

2.4.2. Feature Importance Measure

The RF algorithm is more advantageous for estimating the importance of predictor variables compared with other machine learning algorithms [33,34]. The feature importance is calculated using the Mean Decrease in Gini (MDG), which measures how much a feature reduces the Gini Impurity metric in a class. The Out of Bag (OOB) error is then used for model evaluation to determine the importance of model features. We calculated different window sizes for each texture with 3 × 3, 5 × 5, 7 × 7, 9 × 9, 11 × 11, 13 × 13, 15 × 15, 17 × 17, 19 × 19, 21 × 21, 23 × 23, 25 × 25, 27 × 27, 29 × 29, and 31 × 31 to assess the effect of window sizes on textures for rubber plantation extraction. Then the 15 variables were input to RF to determine the optimal window size for each texture using out-of-bag (OOB) estimation. After that, eight textural features which were calculated using individual optimal window size were input to RF to measure their importance for rubber plantation identification.

2.4.3. Rubber Plantation Extraction Using GF-1, Sentinel-2, and Landsat 8 Data

To evaluate the effect of different data sources on rubber plantation extraction, RF models were established using only the original spectral bands and spectral bands combined with textural features selected above to classify the images masked by the forest map. A total of 1528 rubber plantation and natural forest samples were used for training and validation using confusion matrices.

3. Results

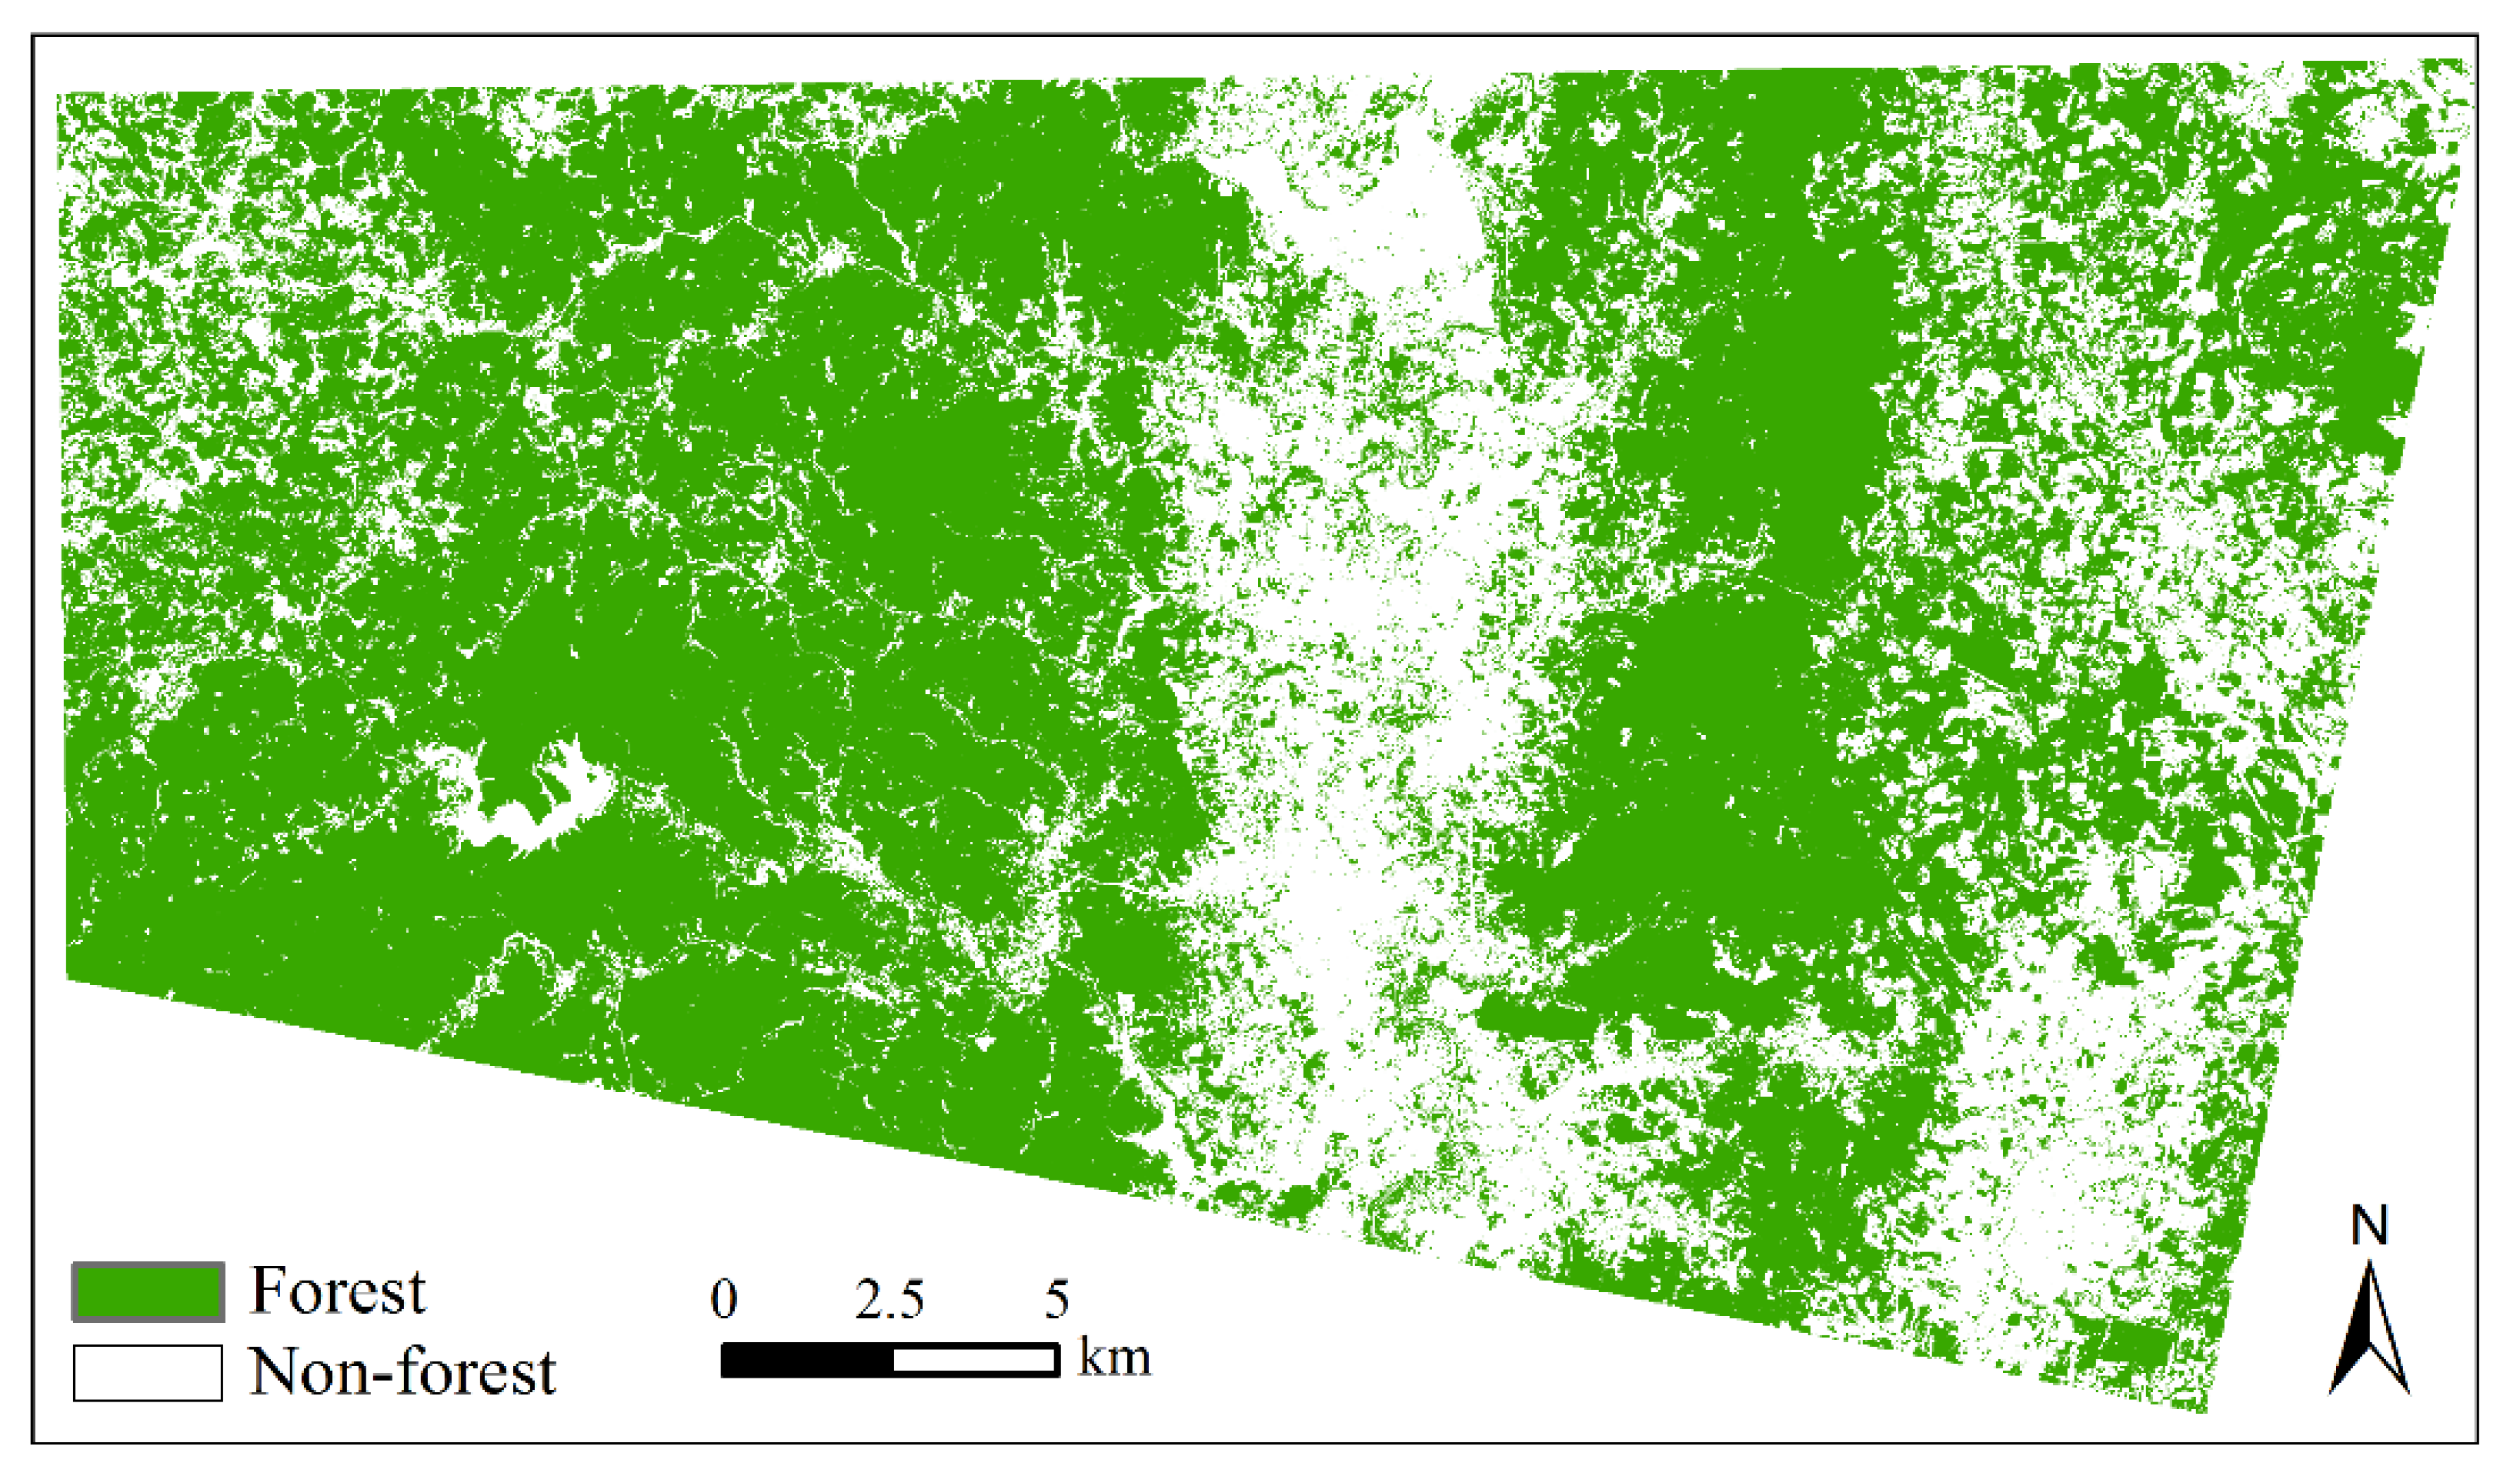
3.1. Forest Mapping and Accuracy Assessment

According to the validation results of the confusion matrix (Table 3), the resultant Sentinel-1 forest/non-forest map (Figure 3) has a high accuracy. The overall accuracy is 0.9593, and the Kappa coefficient is 0.8919. The user’s accuracy and producer’s accuracy of the ‘forest’ category are 98.24% and 96.34%, respectively. Therefore, the forest map can be used as a reliable base map for further analysis.

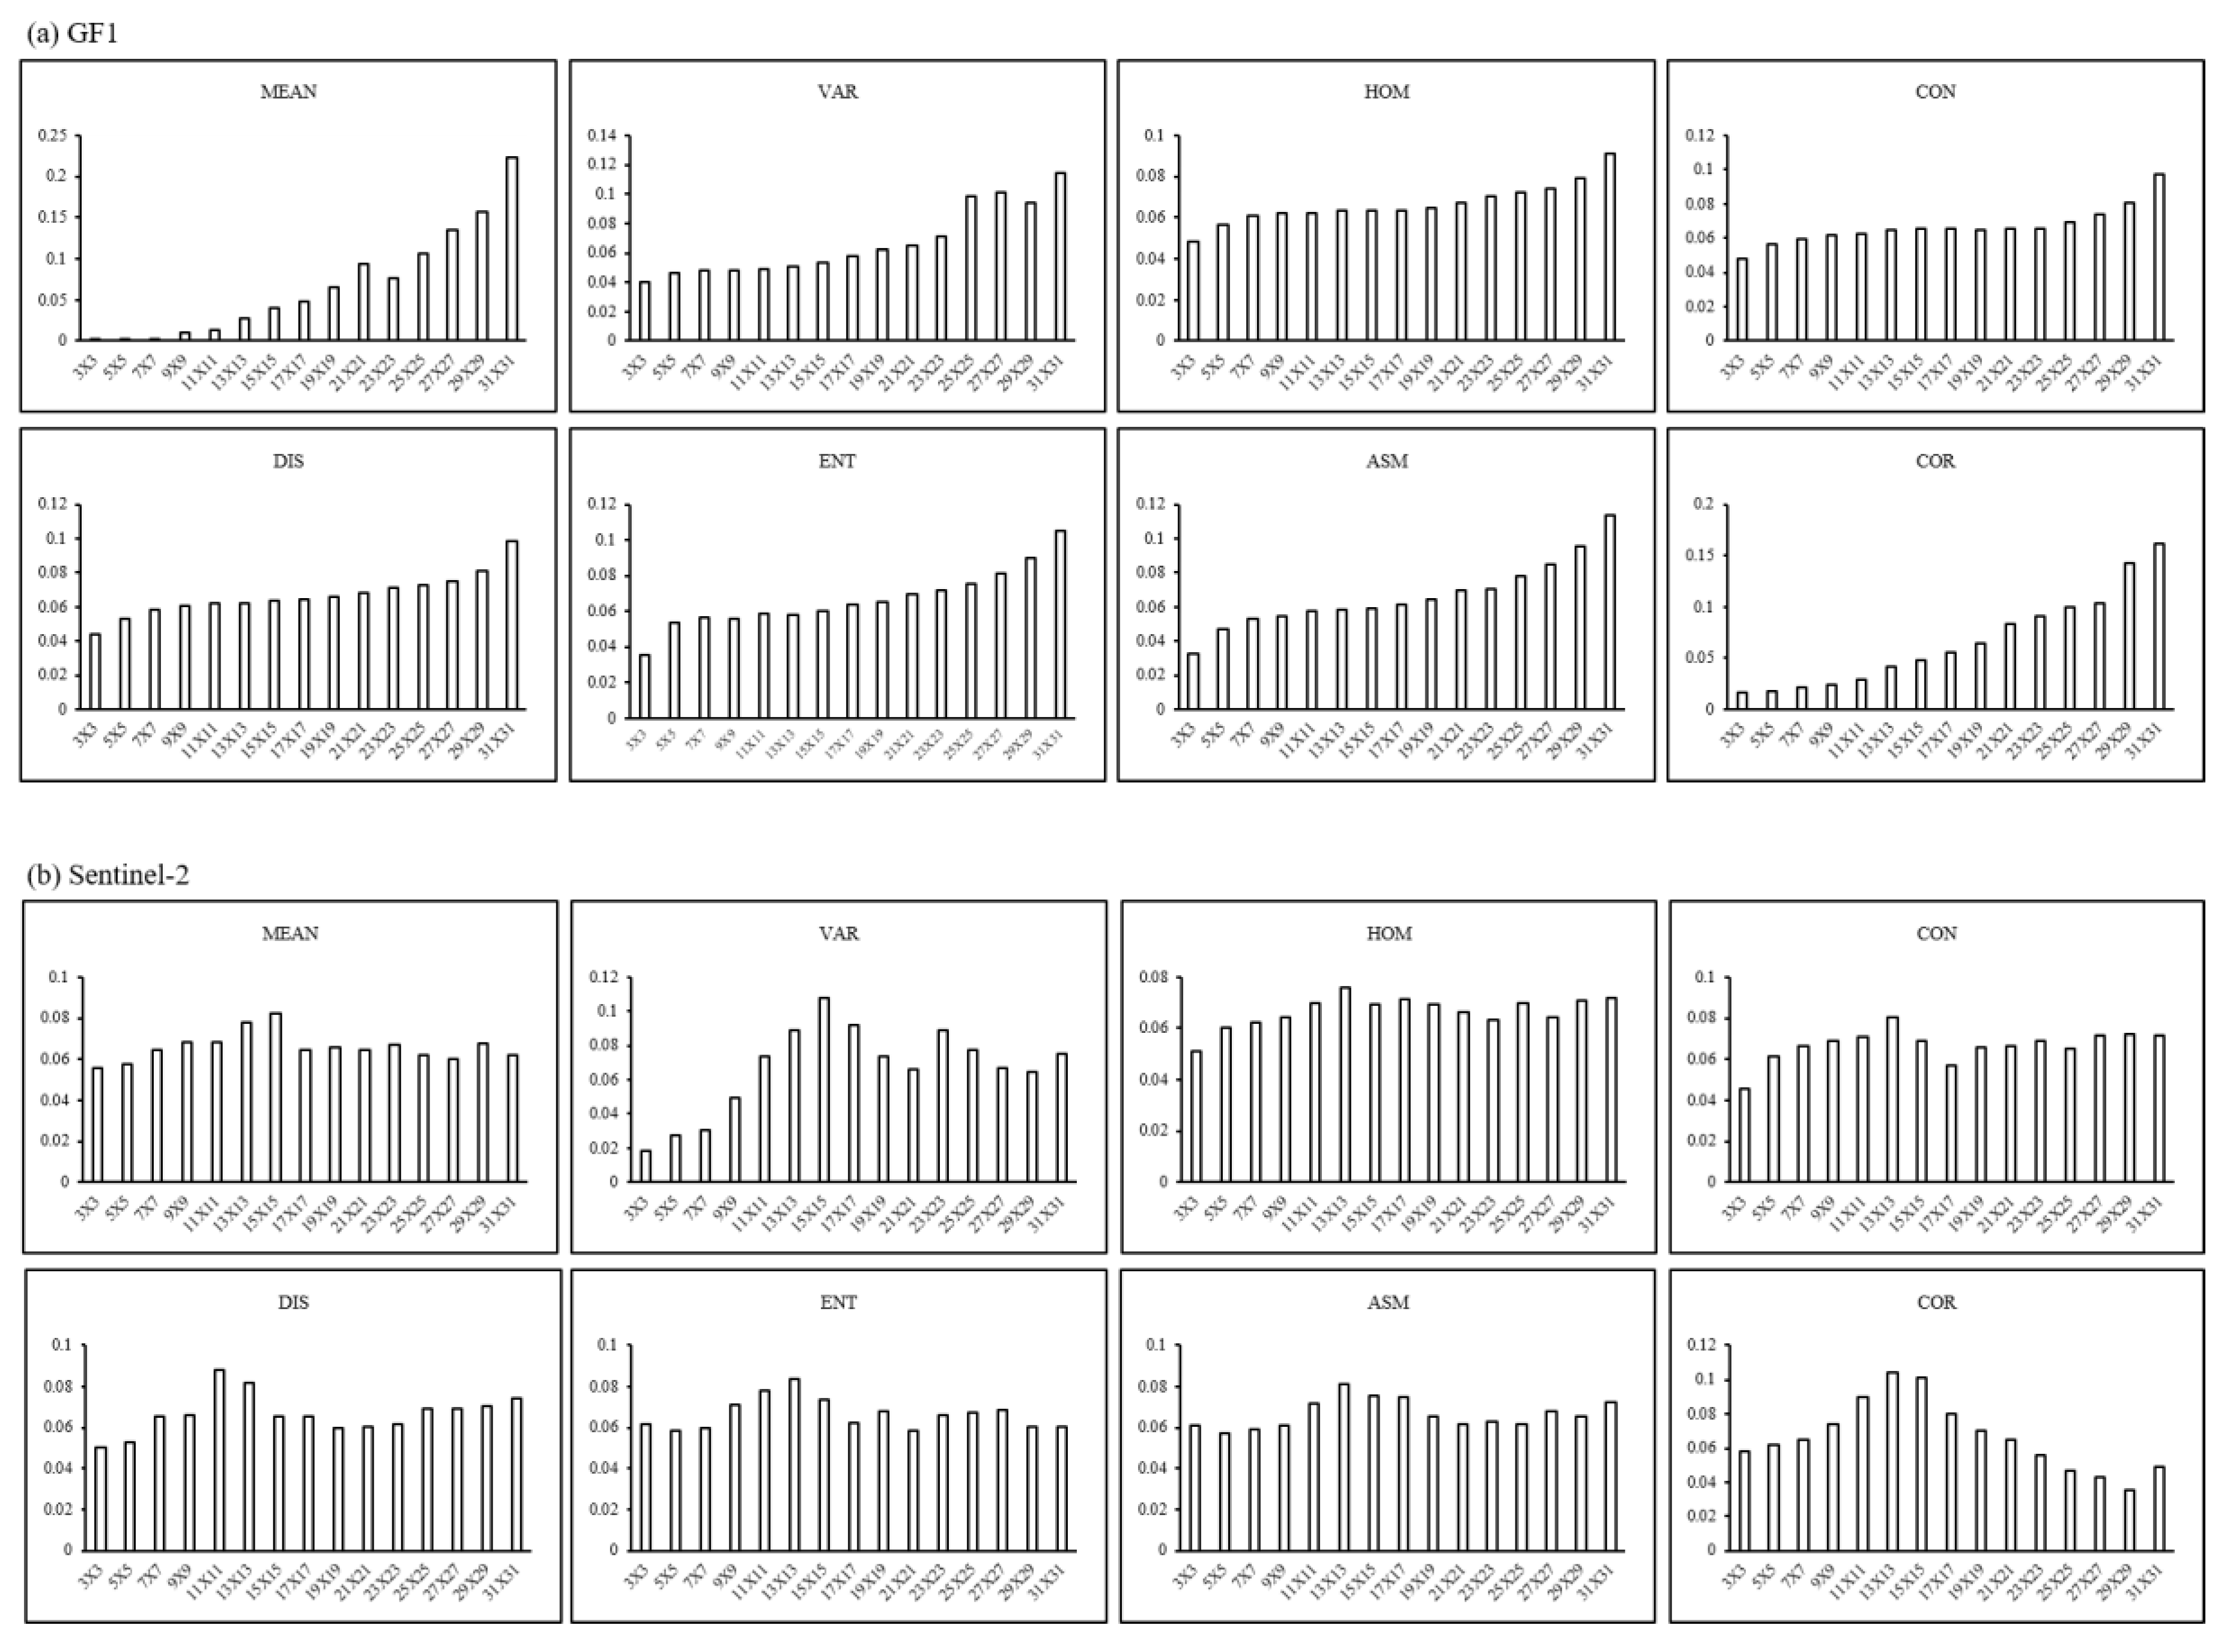
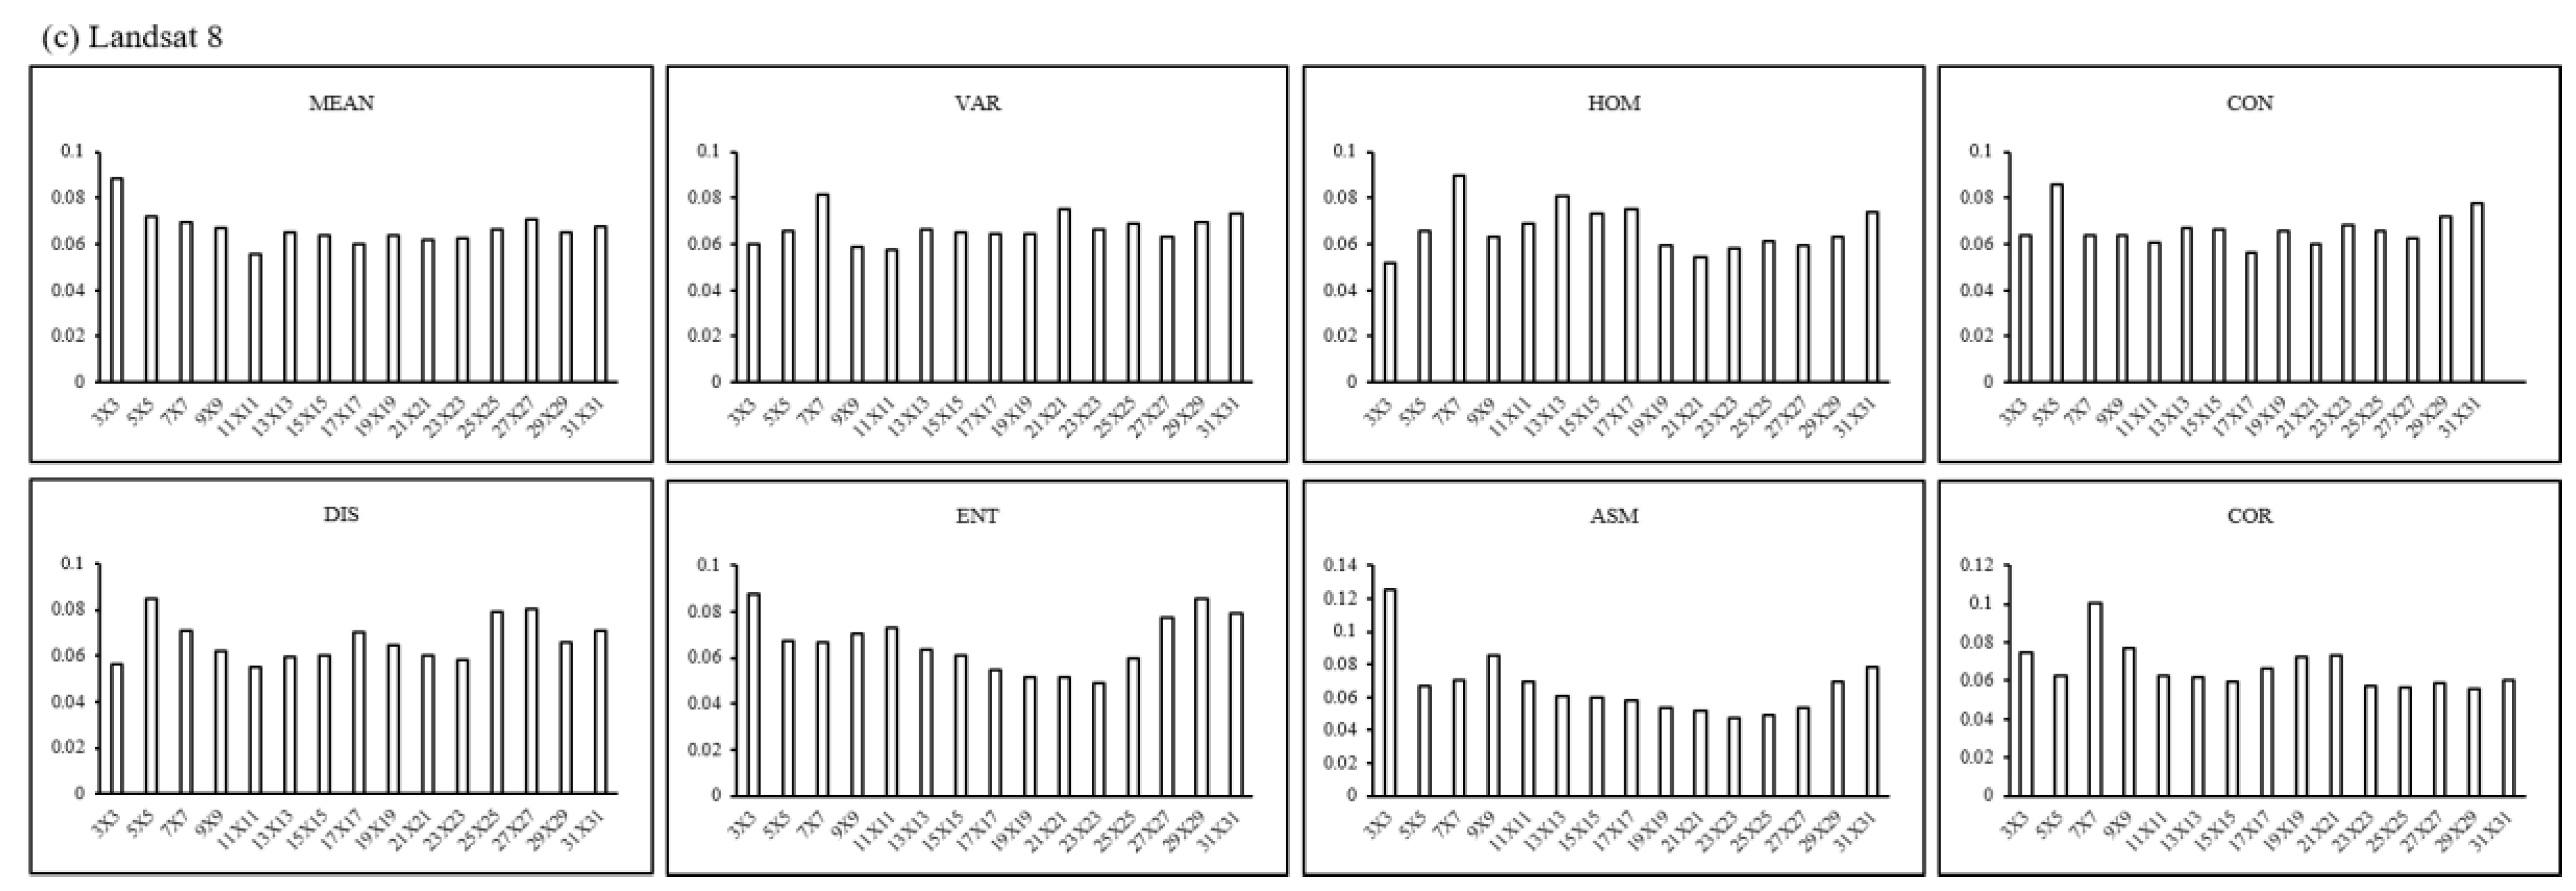
3.2. The Optimal Window Sizes for Textures Calculation

Figure 4 shows how the importance of textural features, derived from GF-1, Sentinel-2, and Landsat 8, varies with the window size in distinguishing rubber plantations from natural forest. With the increase in the window size, the importance of the textural features exhibited different variation modes for the three data sources.
The importance of GF-1 textural features increases with small fluctuations as the window size enlarges, and the increasing trends of the MEAN and CON are especially obvious. The importance of the eight textural features of Sentinel-2 follows up-down-up modes with the increase in window size and reaches the maximum mainly at 11 × 11, 13 × 13, and 15 × 15. Among the eight textural features, the increasing and decreasing trend of the importance of VAR and COR is most obvious before and after the peak. In the case of Landsat 8, high importance can be observed in smaller window sizes (3 × 3 to 7 × 7). Except for COR, the rest of the textural features are of relatively high importance at window sizes ≥25 × 25. Considering the 30 m resolution of Landsat 8, too large of a window size will over-smooth the image, introducing erroneous spatial information, and thus is not suitable for calculating Landsat 8 textural features. To define the appropriate window size is a very important step when textural features are considered for classification because the window sizes selected have had a great effect on feature contribution.
The optimal window size was determined where the peak importance was located for rubber extraction. The resultant window size for extracting eight textural features from GF-1 is 31 × 31. For Sentinel-2, the window sizes are 15 × 15 for MEAN and VAR, 13 × 13 for HOM, CON, ENT, ASM, and COR, and 11 × 11 for DIS. For Landsat 8, the textural features calculation window sizes of MEAN, ENT, and ASM are 3 × 3; CON and DIS are 5 × 5; and HOM, VAR and COR are 7 × 7.

3.3. The Importance Sorting of Textural Features for GF-1, Sentinel-2, and Landsat 8

We calculated the importance of eight textural features derived from the optimal window size defined in Section 3.2. The results are shown in Figure 5. Among the textural features of GF-1, ENT is the most important, accounting for 32.02%, followed by MEAN, COR, VAR, accounting for 25.48%, 19.30%, and 10.96%, respectively. The textural features of Sentinel-2 with relatively high importance are HOM, ENT, COR, and ASM, with values of 20.22%, 19.52%, 17.84%, and 13.78%, respectively. For Landsat 8, COR is the most important textural feature, accounting for 17.87%, followed by MEAN, CON, and HOM, accounting for 17.49%, 15.82%, and 13.13%, respectively. Among the top 3 important textural features, COR is the only robust feature in rubber plantations delineation concurrently for all three data sources.
The cumulative contribution rate of the top 3 textural features is 76.80% for GF-1, 57.58% for Sentinel-2, but only 51.18% for Landsat 8. Similarly, the cumulative contribution rate of textural features ranked top 4 is 87.76% for GF-1, 71.36% for Sentinel-2, but only 64.31% for Landsat 8. So, we can find the contribution is more concentrated on a small number of contextual features for GF-1, and less concentrated for Sentinel-2. For Landsat 8, the contribution disperses among all textural features, with no one more than 18%.
According to the ranking results, MEAN, VAR, ENT, and COR were selected as important textural features to combine with spectral information for Random Forest classification of GF-1. Similarly, HOM, ENT, ASM, and COR of Sentinel-2 imagery and MEAN, HOM, CON, and COR of Landsat 8 were chosen to build the Random Forest model.

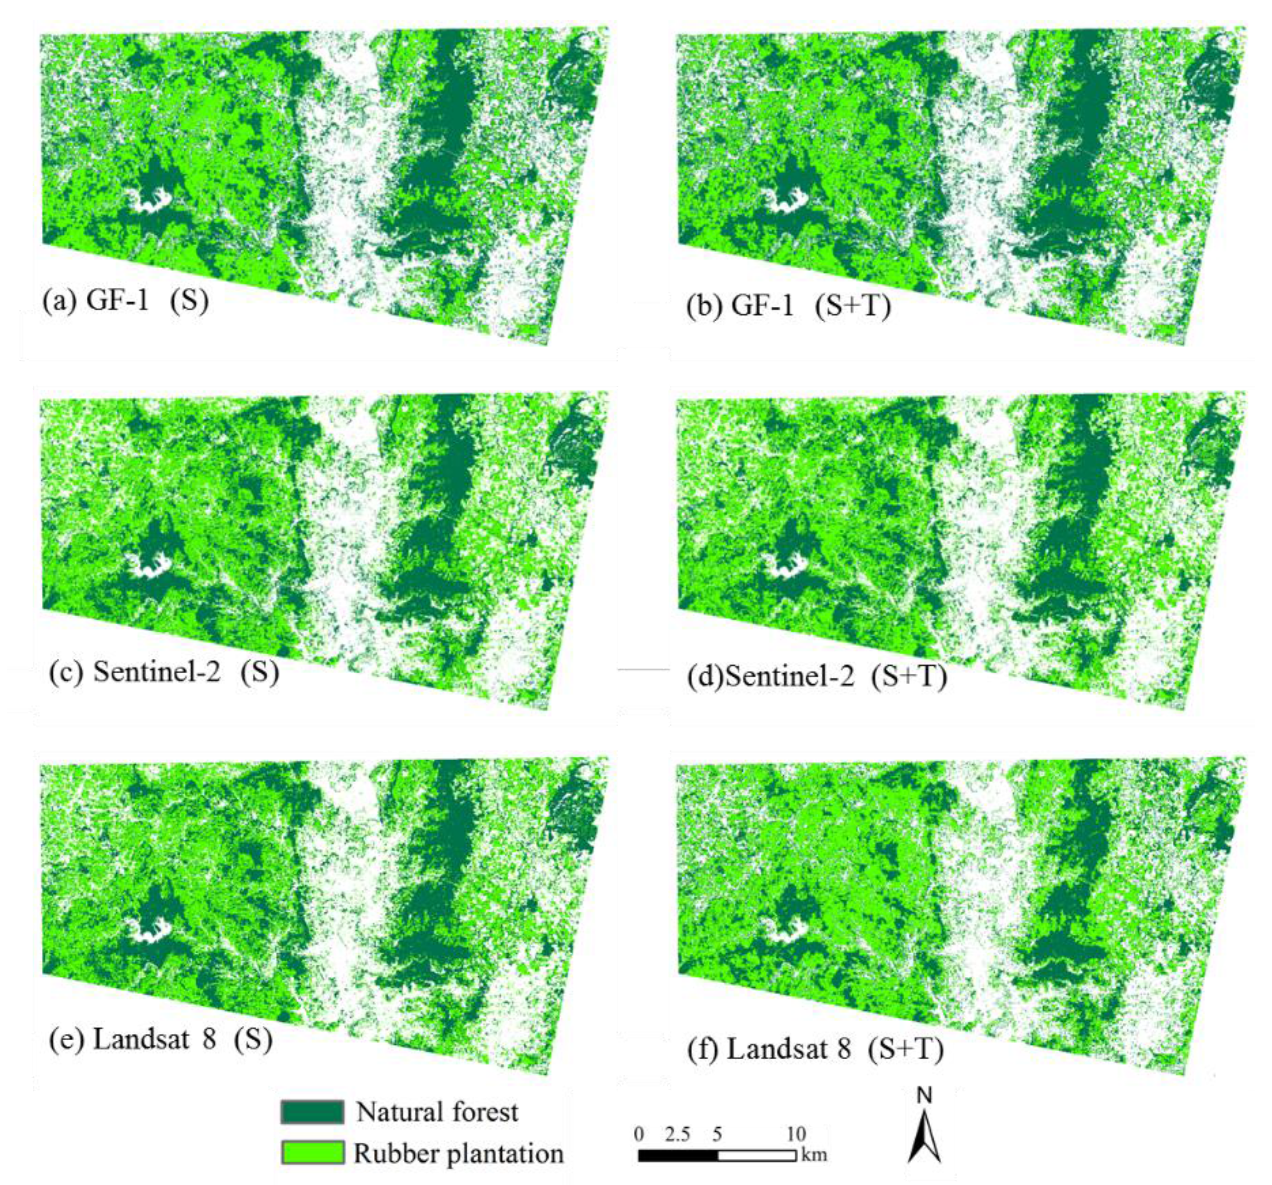
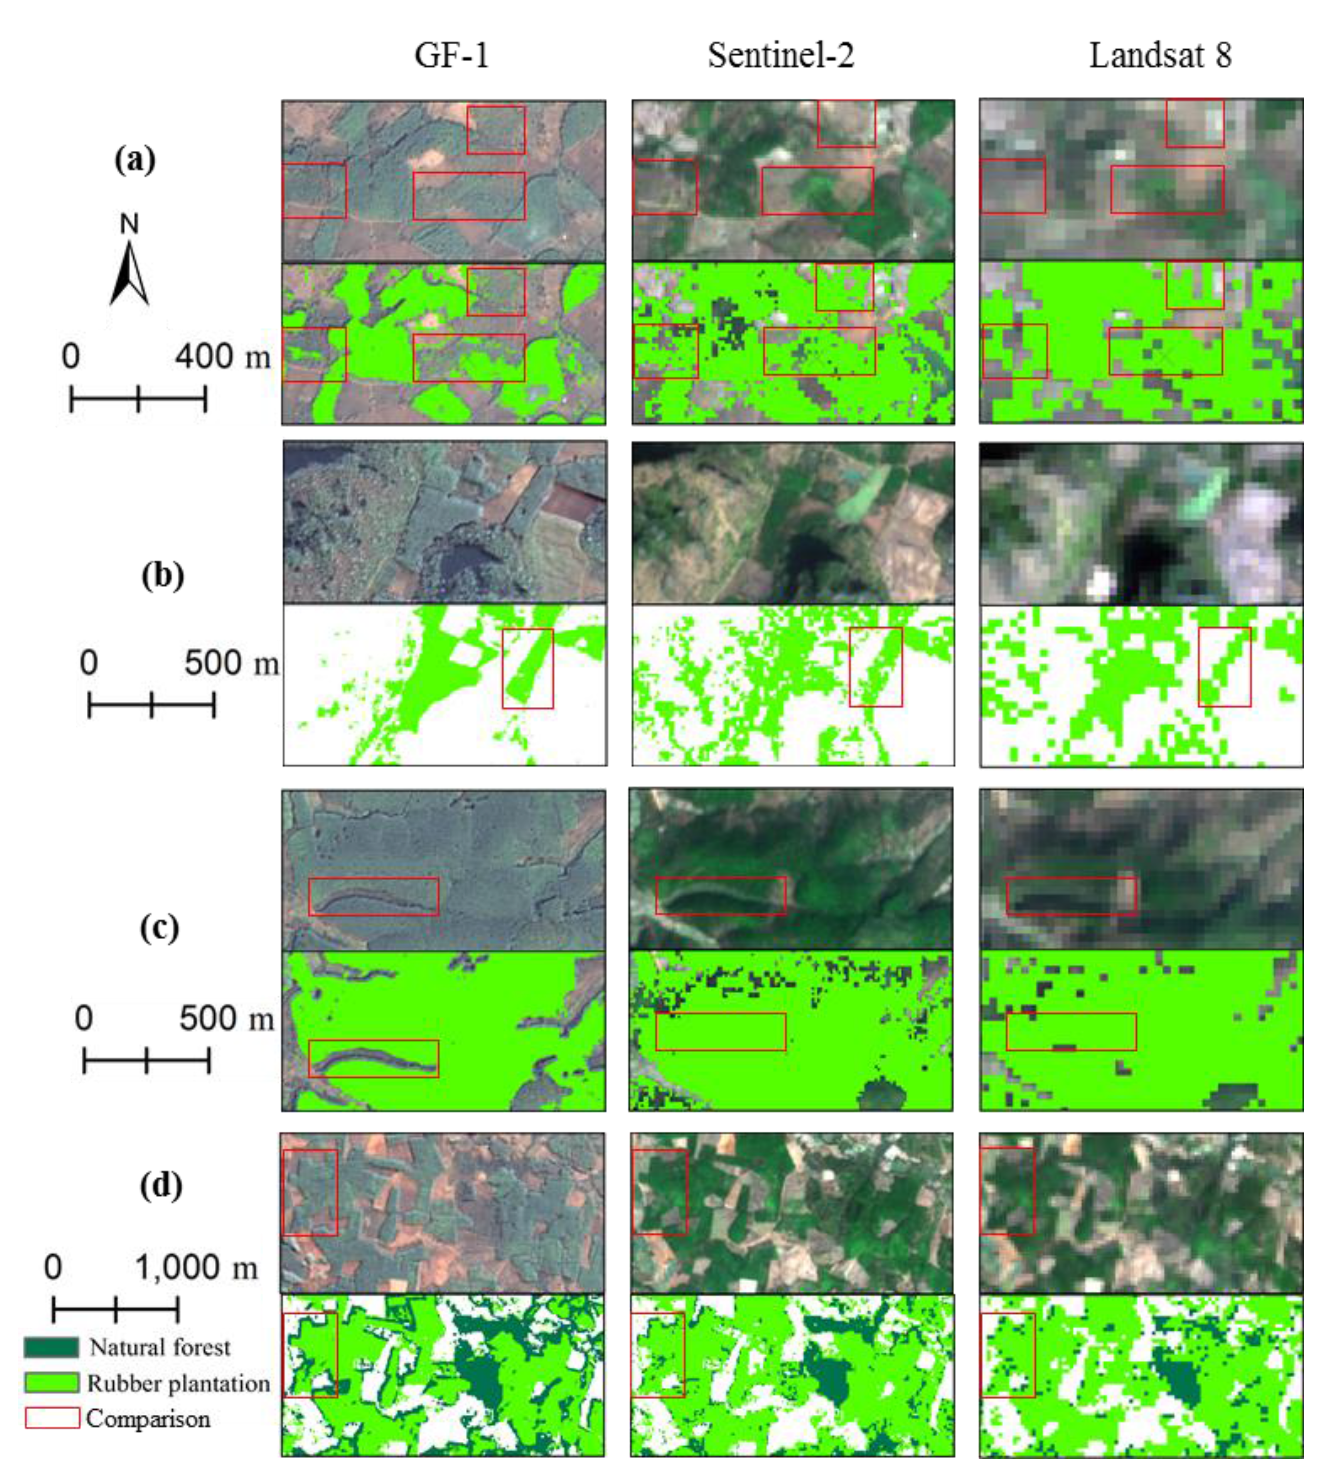
3.4. Classification Results Using GF-1, Sentinel-2, and Landsat 8 Data

The resultant rubber plantation and natural forest maps produced from GF-1, Sentinel-2, and Landsat 8 imagery are shown in Figure 6. The classification accuracy was validated using a confusion matrix for each data source (Table 4 and Table 5). As expected, rubber plantations were confused with natural forest in the classification that only used spectral bands. The producer’s accuracy of rubber delineation results for Sentinel-2 and Landsat 8 data was less than 82%, and for GF-1 the rubber plantations producer’s accuracy was the lowest with an accuracy of only 79.37%, which implied that the resultant rubber plantation map produced by GF-1 had the largest number of rubber plantations that was misclassified as natural forests. Regarding the user’s accuracy, GF-1 had the highest accuracy (92.65%), followed by Sentinel-2 (92.13%) and Landsat 8 (89.84%), indicating that it had the largest incorrect classification of the rubber plantation objects in Figure 6e. The overall accuracy of rubber plantations and natural forests classifications using GF-1, Sentinel-2, and Landsat 8 were 0.8271, 0.8386, and 0.8161, respectively, and the Kappa coefficients were 0.6448, 0.6639, and 0.6162, respectively.
The accuracy of combining spectral and textural features is higher than that of only using spectral features (Table 5). The improvement in accuracy varies under different resolutions. The overall accuracy of Sentinel-2 is the highest at 0.9238, followed by Landsat 8 at 0.9103 and GF-1 at 0.9036. The accuracy changes before and after adding textural features are shown in Figure 7. The producer’s accuracy of rubber plantations based on GF-1, Sentinel-2, and Landsat 8 was improved by 8.04%, 9.44%, and 8.74%, respectively, and the estimation error was reduced correspondingly. The user’s accuracy was increased by 4.63%, 4.54%, and 6.75%, respectively. The overall accuracy and Kappa coefficient have been increased to varying degrees. In addition, the “salt and pepper” phenomenon shows an obvious improvement, and the uniformity effect of rubber forests is better after adding textural features. The GF-1, Sentinel-2, and Landsat 8 classifications after adding textural features could accurately extract the rubber plantation areas, with an area of 179.44 km2, 204.83 km2, and 221.01 km2, respectively.

4. Discussion

4.1. The Optimal Window Sizes for Textural Features Calculation

The importance of textural features for land cover classification has been studied by several researchers [27], and window size plays a critical role in texture calculation [14]. The standard method of texture analysis is to process spectral information in a single band with a fixed window size. However, this method has limitations because a single window size is not able to adequately describe multi-scale characteristics of different objects [10], nor can it fully characterize all the textures for the image. In previous studies [36,37], all textural features were defined by only one fixed window size; we further defined the optimal window size for each individual textural feature.
Window size selection depends on the spatial resolution of the image and the relationship between features (such as canopy size) [16] and texture indices to be calculated [38]. In fact, the spatial characteristics of specific land cover types cannot be exploited sufficiently if the window is too small. Too large of a window may cause mixed pixels at the boundary of two categories to be misclassified, and even pure pixels may be misclassified into another category due to the edge effect [39,40]. Therefore, selecting the texture window is a very important step in calculating textural features. In this study, we used data in three different spatial resolutions to study the multi-scale effect. With the decrease in spatial resolution, the edge effect became more and more obvious for the “rubber plantation” category. The edge effect was apparent for rubber plantations in Sentinel-2 and Landsat 8 images, especially in small rubber plantation patches, since there were more non-rubber plantation pixels involved in the texture measuring area. The lesser edge effect in GF-1 may be due to the higher spatial resolution and higher spectral variation of the pixels at the edges, which leads to insufficient spatial characteristics of rubber plantations, even though the window size had already been set to 31 × 31.
As window size for texture analysis is related to image resolution, it is meaningful to choose the texture calculation window size for images with different resolutions. At finer spatial resolutions, the suitable window size used for extracting textural features should be larger when extracting rubber plantations. In this study, the appropriate texture window sizes for GF-1 images is 31 × 31, then 11 × 11 to 15 × 15 for Sentinel-2, and 3 × 3 to 7 × 7 for Landsat 8 as the textural features of rubber plantations and natural forests could achieve the maximum differentiation among such windows. The results for window size are partially consistent with previous, similar studies. Aguera et al. [17] used QuickBird imagery (2.5 × 2.5 m) to detect plastic-covered greenhouses. Their results revealed that the optimal window size was around 15 × 15. Zhou et al. [38] used 37 window sizes from 3 × 3 to 75 × 75 to test the optimal window size of Sentinel-1 imagery for urban land cover classification. They revealed that for each individual textural feature (MEAN, VAR, ENT, DIS, HOM, COR, CON, and ASM), the optimal window sizes for the best classification results were: 5 × 5, 23 × 23, 25 × 25, 13 × 13, 19 × 19, 49 × 49, 51 × 51, and 9 × 9, respectively. Gao et al. [41] suggested that a smaller window size (5 × 5) may be more representative to obtain multi-seasonal textures of Landsat 8 to map the spatial distribution of the six forest types. Compared to rubber plantations, plastic greenhouses have a smoother texture and larger contrast with surrounding objects, so a small window size can adequately describe the difference. When selecting the window size of a texture, the special conditions of the study area, the bands used to calculate textures, the contents within the images, and the main objective of the classification and other factors should be taken into consideration [16,27].

4.2. Contribution of Textural Features on Rubber Plantation Delineation

This study showed that texture information is a valuable feature for rubber plantation delineation as the addition of textural features makes it easier to accurately separate rubber plantations from natural forests. After adding textural features, overall accuracies of the resultant rubber plantation map were increased by 0.0765 to 0.0942 and the Kappa coefficients were increased by 0.1537 to 0.1946. Several studies have found that individual textural feature contributed differently to specific land cover classification [9]. Pei et al. [42] chose CON as the best textural feature to participate in classification. Berberoğlu et al. [27] also found that CON was a useful discriminator for any individual class. Mongus et al. [43] found that texture measures including MEAN, CON, HOM, and DIS extracted from Sentinel-2 data had increased the classification method’s total F1 score by over 7%. Moreover, CON introduced the largest improvements (approximately 3%). Torbick et al. [9] found that the Landsat textural features based on NIR had substantial separation between plantations and forests as forests have higher values of VAR, CON, DIS, while plantations have higher ENT values. The four highest information entropy values of the textural features, including MEAN, CON, HOM, and VAR, were selected to classify the image using the information entropy theory in the study by Zhang et al. [44]. After adding textural features, the overall accuracy was improved by 10.99–24.10% compared with spectral information alone. Similar to these studies, we evaluated the importance of eight textural features when distinguishing between rubber plantations and natural forests. Our results also showed that MEAN, HOM, CON, VAR, and ENT have important effects on improving the separation of rubber plantations and natural forests.
Sorting the results of textural feature importance (Figure 5) showed that COR was the most robust feature when distinguishing rubber plantations from natural forests as its importance has always been in the top three in images of all three spatial resolutions, although not always of the highest importance. COR may provide additional insight into the characteristics of rubber plantations.

4.3. Applicability of Remote Sensing Data at Different Resolutions to Rubber Plantation Extraction

Many studies have shown that the specific land cover type area is closely related to the sensor data used. We also found that there were significant differences in the rubber plantation areas produced by GF-1, Sentinel-2, and Landsat 8. With the decrease in spatial resolution, the rubber plantation area that was extracted increased gradually. The outcome of the study by Paul et al. [45] also showed that glacier extents derived from the 30 m Landsat 8 imagery are 4–5% larger than those from 10 m Sentinel-2. The results are related to the generous interpretation of mixed pixels, especially along the target category perimeter. In this study, the rubber plantation area estimated with GF-1 was less than the actual area as the ability of GF-1 to recognize edges for rubber plantations is still insufficient (Figure 8), although GF-1 rubber plantation extraction results were rich in detail.
According to the classification accuracies shown in Table 5, after adding textural features, the moderate spatial resolution Sentinel-2 and Landsat 8 data outperformed GF-1 with high spatial resolution in extracting rubber plantations. This may be because of the absence of a SWIR band, which was also demonstrated by Shapiro et al. [46] and Wang et al. [47] when mapping mangrove extent. Wang et al. [47] found that the moderate Sentinel-2 and Landsat 8 imagery could outperform high-resolution Pléiades-1 imagery with the help of more refined spectral divisions when using different sensors to map larger mangrove zonation and extent. In this study, the ability of the GF-1 sensor to discriminate rubber plantations with low canopy density was lower than that of Sentinel-2 and Landsat 8 (Figure 8a). This may be because GF-1 imagery has only four multispectral bands, lacking a SWIR band compared with Landsat 8 and Sentinel-2. In previous studies [9,48], LSWI and NBR indices (the function of SWIR) played important roles in distinguishing rubber plantations from natural forests. Consequently, the absence of a SWIR band may limit the accuracy of GF-1 imagery in identifying rubber plantations. In addition, the rubber plantations with low canopy density were more affected by the vegetation and soil under the plantations, which will enlarge the variability of its interior and increase the difficulty of identifying other rubber plantations.
When using different sensors to map small-sized features and the details of rubber plantations, spatial resolution might be more important than the spectral bands. All three rubber plantation maps from GF-1, Sentinel-2, and Landsat 8 show generally consistent spatial distribution but differ in geometric details such as boundaries and gaps between two rubber plantation patches. The higher the spatial resolution, the richer the detailed information, especially in scattered, small plantation plots (Figure 8b). The Landsat 8 sensor resulted in under classification of line shape (Figure 8b). This may be because the spatial extent of rubber plantation is less than the pixel size, which leads to the rubber plantations being dissolved by surrounding objects. Plantations along the gaps and boundaries were underestimated, even though the map produced by the high spatial resolution GF-1 data could better distinguished the gaps between two rubber plantation patches and boundaries between rubber plantations and surrounding objects better than Sentinel-2 and Landsat 8. This may be due to the high spatial resolution of GF-1, which resulted in large spectral variation at the edges of the rubber plantation, and the rubber tree shadow at the edges (Figure 8c) and boundaries could be misclassified as natural forest (Figure 8d).
When we decide which data source to use, a variety of factors needs to be taken into account, such as spatial resolution, spectral resolution [47], and the patch size of rubber plantation. The 2 m GF-1 imagery presents more abundant details of the rubber plantations with its smaller pixel size, which can provide excellent imagery for visual interpretation. However, fine spatial resolution will bring more variability than moderate resolutions. In addition, texture calculation is based on the spectral relationship among pixels within a certain window range; the low spectral resolution of GF-1 may limit the distinction between rubber plantations and natural forests in texture characteristics. Owing to those reasons, GF-1 has limited advantages in automatic extraction of rubber plantations. Regarding the 10 m Sentinel-2 imagery with the most refined spectral division, the highest rubber plantation accuracy and accurate boundary of rubber plantation were achieved with a 10 m Sentinel-2 image. Furthermore, as frequent cloud cover is a major obstacle for creating precise images in tropical regions, the shorter repetition interval of Sentinel-2 might allow an increased availability of appropriate images. Compared with GF-1, Landsat 8 has more spectral bands. However, a 30 × 30 m Landsat 8 pixel tends to contain several types of land cover with a fragmented context, which limits its suitability for mapping smaller rubber plantations, as Landsat 8 over- or under-classified rubber plantations to some extent. On the whole, for continuous or large areas of rubber plantations, Sentinel-2 and Landsat 8 are good choices; for scattered rubber plantations and small plot sizes, GF-1 may be better.

5. Conclusions

Land use in northeastern Thailand has undergone tremendous changes in the past two decades because the Thai government launched a plan to promote rubber plantations from 2003 to 2013. Due to the limitation of similar spectral characteristics between rubber plantations and natural forests, textural features were introduced in this study to improve the accuracy of rubber plantations recognition. We explored the performance of textural features for three different image resolutions images including 2 m GF-1, 10 m Sentinel-2, and 30 m Landsat 8. Several conclusions can be drawn from this study:
(1)
The higher the resolution, the larger the window size needed. The resultant window size for extracting eight textural features from GF-1 images is 31 × 31. For Sentinel-2, the window sizes are 15 × 15 for MEAN and VAR, 13 × 13 for HOM, CON, ENT, ASM, and COR, and 11 × 11 for DIS. For Landsat 8, the textural feature calculation window sizes of MEAN, ENT, and ASM are 3 × 3, 5 × 5 for CON and DIS, and 7 × 7 for HOM, VAR and COR.
(2)
The Random Forest importance measures show that MEAN, VAR, ENT, and COR were important for GF-1 classification, while HOM, ENT, ASM, and COR were chosen for Sentinel-2 classification. MEAN, HOM, CON, and COR had more influence in the separation of rubber plantations and natural forests for Landsat 8.
(3)
The importance of COR was always in the top three among the eight textural features in GF-1, Sentinel-2, and Landsat 8, so COR is a robust textural feature in three different resolutions when distinguishing rubber plantations from natural forests.
(4)
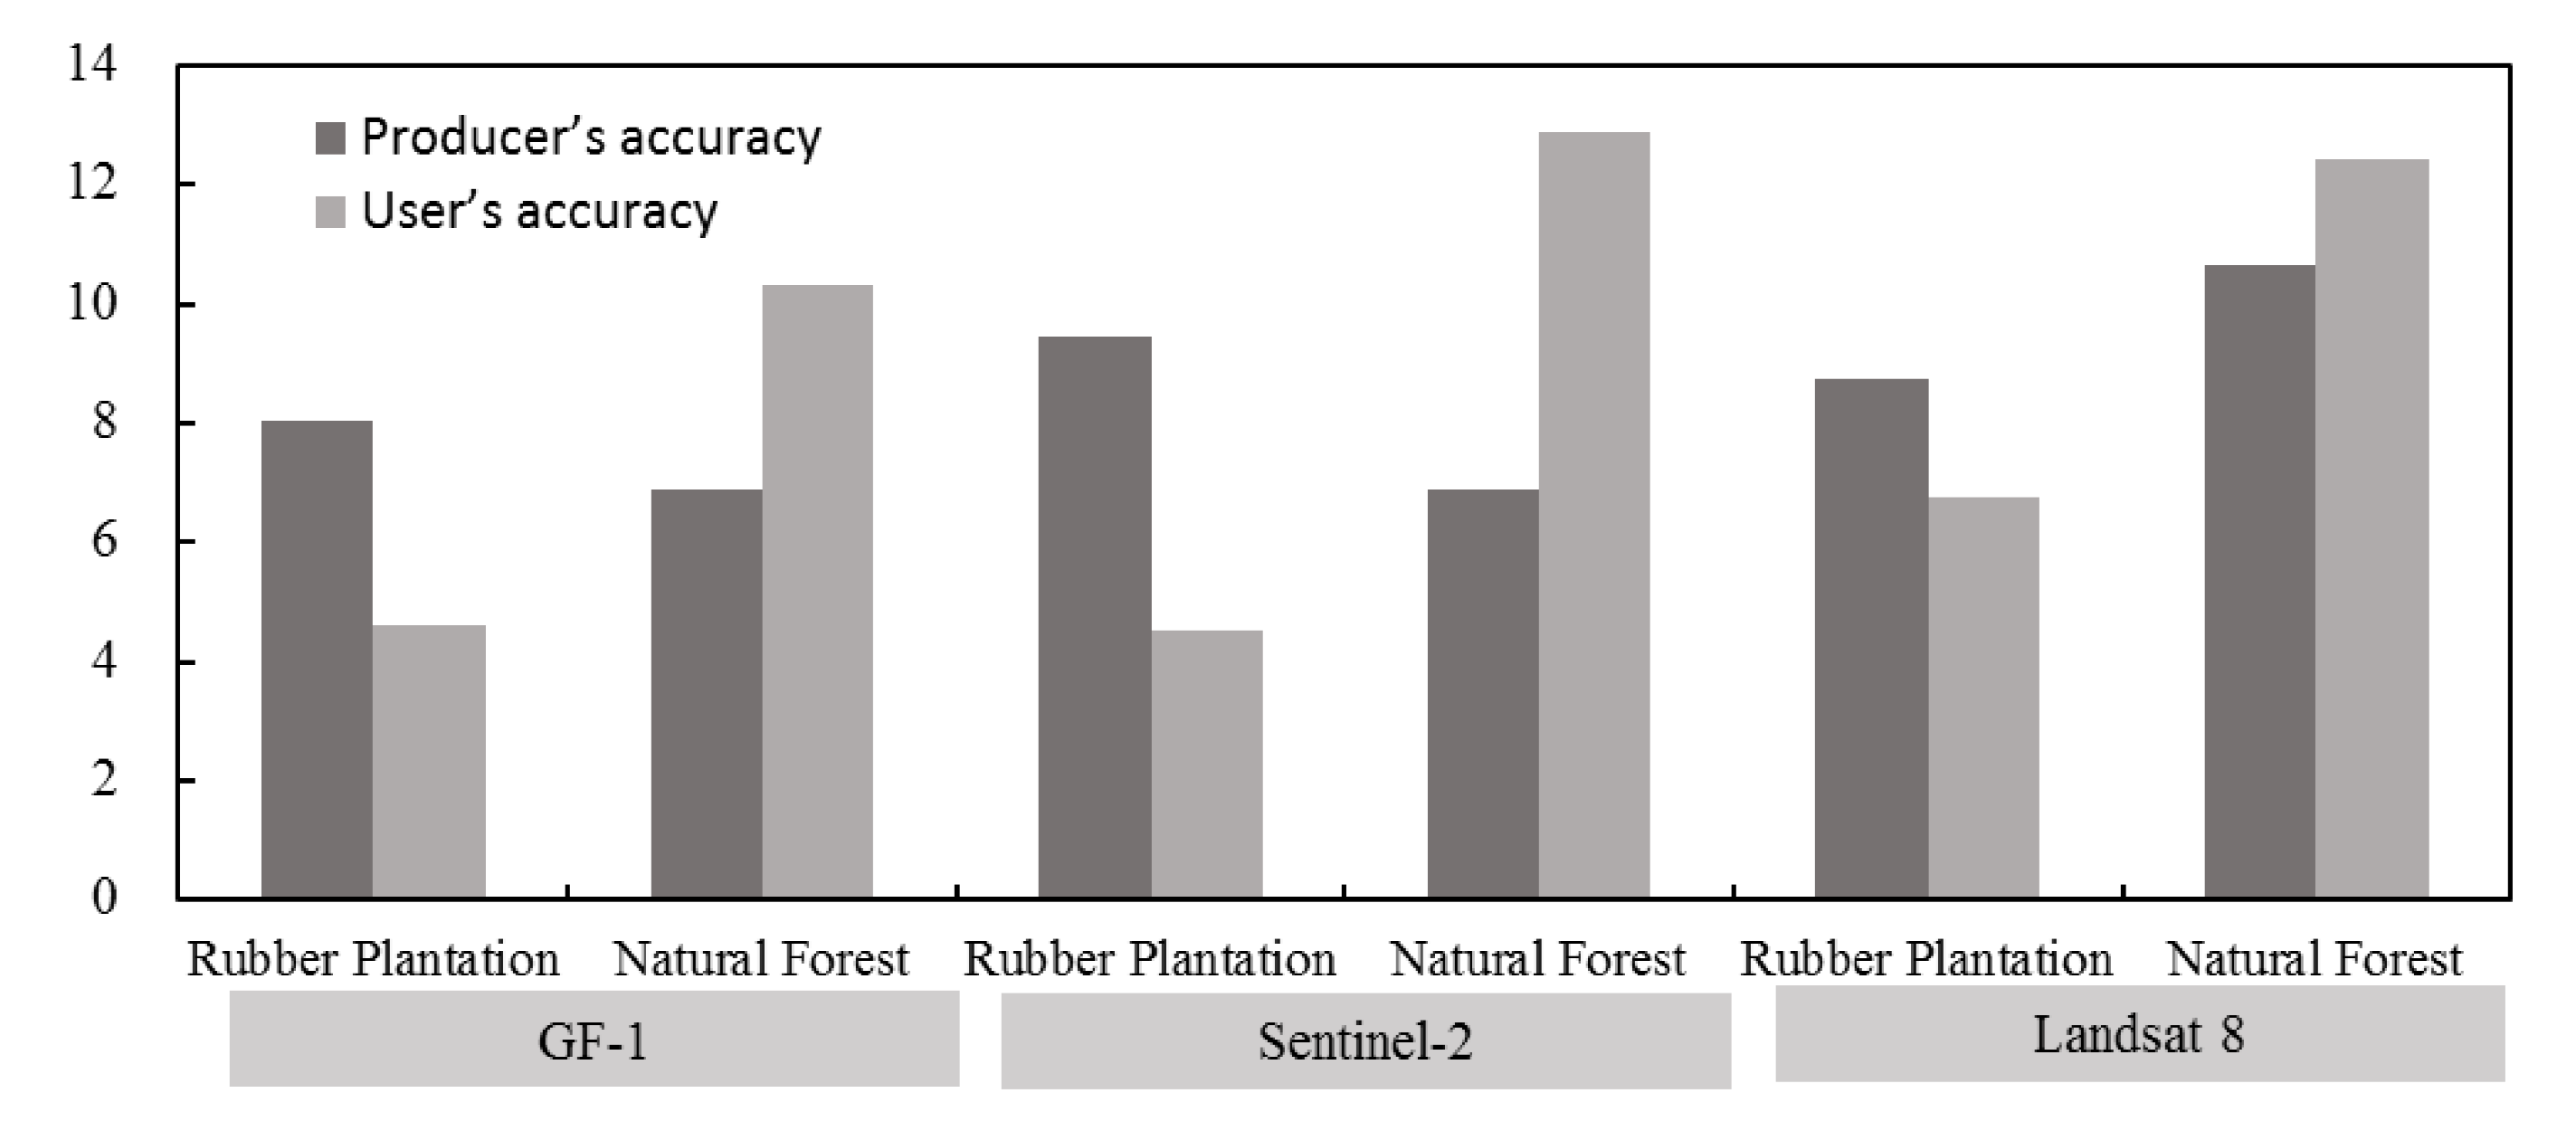
Adding textural features as additional inputs improved the overall accuracy and the producer’s and user’s accuracies compared to using spectral features only for rubber plantation classification. With the help of textural features, the 10 m Sentinel-2 imagery could accurately extract rubber plantations with the producer’s accuracy reaching 91.26% and the user’s accuracy reaching 96.67%. Meanwhile, the 2 m GF-1 imagery underestimated rubber plantations with a producer’s accuracy of 87.41% and a user’s accuracy of 97.28%, and the rubber plantation area was overestimated by the 30 m Landsat 8 imagery with a user’s accuracy of 96.59% and a producer’s accuracy of 89.16%. Compared with GF-1, the higher accuracies of the Sentinel-2 and Landsat 8 sensors may be attributed to the SWIR band.
Textural features can capture the homogeneity of plantation canopy, spacing, and structure. Textural features are more stable than spectral characteristics as textural features reflect the varying frequency of tone in a certain window size, rather than depending on the tone and brightness of the object surface. Due to such advantages, the textural-based approach can be duplicated or transferred to other geographical regions and other plantation species such as oil palm (Elaeis guineensis) and teak (Tectona grandis). We finally contend that these achievements are of great significance to guide the sustainable management of forest resources, soil erosion control, and sustainable development of society in Southeast Asia and other regions.

Author Contributions

Conceptualization, C.H. and C.Z.; methodology, C.Z.; validation, H.L. and C.Z.; writing—original draft preparation, C.Z.; writing—review and editing, C.H., Q.L., A.B. and J.L.; supervision, G.L.; All authors have read and agreed to the published version of the manuscript.

Funding

This study was supported by the CAS Earth Big Data Science Project, Grant No. XDA19060302; the National Science Foundation of China, Grant No. 41561144012, 41661144030; and the Innovation Project of LREIS, Grant No. O88RA303YA.

Conflicts of Interest

The authors declare no conflict of interest. The funders had no role in the design of the study; in the collection, analyses, or interpretation of data; in the writing of the manuscript, or in the decision to publish the results.

References

  1. Payn, T.; Carnus, J.-M.; Freer-Smith, P.; Kimberley, M.; Kollert, W.; Liu, S.; Orazio, C.; Rodriguez, L.; Silva, L.N.; Wingfield, M.J. Changes in planted forests and future global implications. For. Ecol. Manag. 2015, 352, 57–67. [Google Scholar] [CrossRef] [Green Version]
  2. FAO. Global Forest Resources Assessment 2015: How Have the World’s Forests Changed? Food and Agriculture Organization of the United Nations (FAO): Rome, Italy, 2015. [Google Scholar]
  3. Buongiorno, J.; Zhu, S. Assessing the impact of planted forests on the global forest economy. New Zealand J. For. Sci. 2014, 44, S2. [Google Scholar] [CrossRef] [Green Version]
  4. Foley, J.A.; DeFries, R.; Asner, G.P.; Barford, C.; Bonan, G.; Carpenter, S.R.; Chapin, F.S.; Coe, M.T.; Daily, G.C.; Gibbs, H.K.; et al. Snyder. Global Consequences of Land Use. Science 2005, 309, 570–574. [Google Scholar] [CrossRef] [Green Version]
  5. Ziegler, A.D.; Fox, J.M.; Xu, J. The rubber juggernaut. Science 2009, 324, 1024–1025. [Google Scholar] [CrossRef] [PubMed]
  6. Hurni, K.; Fox, J. The expansion of tree-based boom crops in mainland Southeast Asia. J. Land Use Sci. 2018, 13, 198–219. [Google Scholar] [CrossRef]
  7. Dong, J.; Xiao, X.; Chen, B.; Torbick, N.; Jin, C.; Zhang, G.; Biradar, C. Mapping deciduous rubber plantations through integration of PALSAR and multi-temporal Landsat imagery. Remote Sens. Environ. 2013, 134, 392–402. [Google Scholar] [CrossRef]
  8. Friedl, M.A.; Sulla-Menashe, D.; Tan, B.; Schneider, A.; Ramankutty, N.; Sibley, A.; Huang, X. MODIS Collection 5 global land cover: Algorithm refinements and characterization of new datasets. Remote Sens. Environ. 2010, 114, 168–182. [Google Scholar] [CrossRef]
  9. Torbick, N.; Ledoux, L.; Salas, W.; Zhao, M. Regional mapping of plantation extent using multisensor imagery. Remote Sens. 2016, 8, 236. [Google Scholar] [CrossRef] [Green Version]
  10. Chen, D.; Stow, D.A.; Gong, P. Examining the effect of spatial resolution and texture window size on classification accuracy: An urban environment case. Int. J. Remote Sens. 2004, 25, 2177–2192. [Google Scholar] [CrossRef]
  11. Chatziantoniou, A.; Psomiadis, E.; Petropoulos, G.P. Co-Orbital Sentinel 1 and 2 for LULC mapping with emphasis on wetlands in a mediterranean setting based on machine learning. Remote Sens. 2017, 9, 1259. [Google Scholar] [CrossRef] [Green Version]
  12. Zhu, J.; Pan, Z.; Wang, H.; Huang, P.; Sun, J.; Qin, F.; Liu, Z. An Improved Multi-temporal and Multi-feature Tea Plantation Identification Method Using Sentinel-2 Imagery. Sensors 2019, 19, 2087. [Google Scholar] [CrossRef] [PubMed] [Green Version]
  13. Wang, L.; Zhang, S. Incorporation of texture information in a SVM method for classifying salt cedar in western China. Remote Sens. Lett. 2014, 5, 501–510. [Google Scholar] [CrossRef]
  14. Marceau, D.J.; Howarth, P.J.; Dubois, J.-M.M.; Gratton, D.J. Evaluation of the grey-level co-occurrence matrix method for land-cover classification using SPOT imagery. IEEE Trans. Geosci. Remote Sens. 1990, 28, 513–519. [Google Scholar] [CrossRef]
  15. Lu, D.; Batistella, M.; Li, G.; Moran, E.; Hetrick, S.; Freitas, C.d.C.; Dutra, L.V.; Sant’Anna, S.J.S. Land use/cover classification in the Brazilian Amazon using satellite images. Pesqui. Agropecuária Bras. 2012, 47, 1185–1208. [Google Scholar] [CrossRef]
  16. Dian, Y.; Li, Z.; Pang, Y. Spectral and Texture Features Combined for Forest Tree species Classification with Airborne Hyperspectral Imagery. J. Indian Soc. Remote Sens. 2015, 43, 101–107. [Google Scholar] [CrossRef]
  17. Agüera, F.; Aguilar, F.J.; Aguilar, M.A. Using texture analysis to improve per-pixel classification of very high resolution images for mapping plastic greenhouses. ISPRS J. Photogramm. Remote Sens. 2008, 63, 635–646. [Google Scholar] [CrossRef]
  18. Ferreira, M.P.; Wagner, F.H.; Aragão, L.E.; Shimabukuro, Y.E.; de Souza Filho, C.R. Tree species classification in tropical forests using visible to shortwave infrared WorldView-3 images and texture analysis. ISPRS J. Photogramm. Remote Sens. 2019, 149, 119–131. [Google Scholar] [CrossRef]
  19. Woodcock, C.E.; Strahler, A.H. The factor of scale in remote sensing. Remote Sens. Environ. 1987, 21, 311–332. [Google Scholar] [CrossRef]
  20. Li, Z.; Fox, J.M. Mapping rubber tree growth in mainland Southeast Asia using time-series MODIS 250 m NDVI and statistical data. Appl. Geogr. 2012, 32, 420–432. [Google Scholar] [CrossRef]
  21. Fox, J.; Castella, J.-C. Expansion of rubber (Hevea brasiliensis) in Mainland Southeast Asia: What are the prospects for smallholders? J. Peasant Stud. 2013, 40, 155–170. [Google Scholar] [CrossRef]
  22. Gorelick, N.; Hancher, M.; Dixon, M.; Ilyushchenko, S.; Thau, D.; Moore, R. Google Earth Engine: Planetary-scale geospatial analysis for everyone. Remote Sens. Environ. 2017, 202, 18–27. [Google Scholar] [CrossRef]
  23. Veci, L.; Lu, J.; Prats-Iraola, P.; Scheiber, R.; Collard, F.; Fomferra, N.; Engdahl, M. The Sentinel-1 Toolbox. In Proceedings of the IEEE International Geoscience and Remote Sensing Symposium (IGARSS), Quebec, QC, Canada, 13–18 July 2014. [Google Scholar]
  24. Maurer, T. How to pan-sharpen images using the Gram-Schmidt pan-sharpen method—A recipe. Int. Arch. Photogramm. Remote Sens. Spat. Inf. Sci. 2013, 1, W1. [Google Scholar] [CrossRef] [Green Version]
  25. Zuhlke, M.; Fomferra, N.; Brockmann, C.; Peters, M.; Veci, L.; Malik, J.; Regner, P. SNAP (sentinel application platform) and the ESA sentinel 3 toolbox. In Proceedings of the Sentinel-3 for Science Workshop, Venice, Italy, 2–5 June 2015. [Google Scholar]
  26. Haralick, R.M. Statistical and structural approaches to texture. Proc. IEEE 1979, 67, 786–804. [Google Scholar] [CrossRef]
  27. Berberoğlu, S.; Akin, A.; Atkinson, P.M.; Curran, P.J. Utilizing image texture to detect land-cover change in Mediterranean coastal wetlands. Int. J. Remote Sens. 2010, 31, 2793–2815. [Google Scholar] [CrossRef] [Green Version]
  28. Howley, T.; Madden, M.G.; O’Connell, M.-L.; Ryder, A.G. The effect of principal component analysis on machine learning accuracy with high dimensional spectral data. In Applications and Innovations in Intelligent Systems XIII, Proceedings of the International Conference on Innovative Techniques and Applications of Artificial Intelligence, Cambridge, UK, 12–14 December 2005; Springer: Berlin, Germany, 2005. [Google Scholar]
  29. Breiman, L. Random Forests. Mach. Learn. 2001, 45, 5–32. [Google Scholar] [CrossRef] [Green Version]
  30. Dostálová, A.; Hollaus, M.; Milenković, M.; Wagner, W. Forest area derivation from sentinel-1 data. ISPRS Ann. Photogramm. Remote Sens. Spat. Inf. Sci. 2016, 3, 227. [Google Scholar] [CrossRef]
  31. Kou, W.; Xiao, X.; Dong, J.; Gan, S.; Zhai, D.; Zhang, G.; Qin, Y.; Li, L. Mapping deciduous rubber plantation areas and stand ages with palsar and landsat images. Remote Sens. 2015, 7, 1048–1073. [Google Scholar] [CrossRef] [Green Version]
  32. Dong, J.; Xiao, X.; Sheldon, S.; Biradar, C.; Duong, N.D.; Hazarika, M. A comparison of forest cover maps in Mainland Southeast Asia from multiple sources: PALSAR, MERIS, MODIS and FRA. Remote Sens. Environ. 2012, 127, 60–73. [Google Scholar] [CrossRef]
  33. Belgiu, M.; Drăguţ, L. Random forest in remote sensing: A review of applications and future directions. ISPRS J. Photogramm. Remote Sens. 2016, 114, 24–31. [Google Scholar] [CrossRef]
  34. Li, M.; Lei, M.; Blaschke, T.; Liang, C.; Tiede, D. A systematic comparison of different object-based classification techniques using high spatial resolution imagery in agricultural environments. Int. J. Applied Earth Obs. Geoinf. 2016, 49, 87–98. [Google Scholar] [CrossRef]
  35. Witten, I.H.; Frank, E. Data Mining: Practical Machine Learning Tools and Techniques, 3rd ed.; Morgan Kaufmann Publishers: Burlington, MA, USA, 2005. [Google Scholar]
  36. Clerici, N.; Valbuena, C.A.; Calderón, J.M. Posada. Fusion of Sentinel-1A and Sentinel-2A data for land cover mapping: A case study in the lower Magdalena region, Colombia. J. Maps 2017, 13, 718–726. [Google Scholar] [CrossRef] [Green Version]
  37. Sothe, C.; Almeida, C.; Liesenberg, V.; Schimalski, M. Evaluating sentinel-2 and landsat-8 data to map sucessional forest stages in a subtropical forest in southern brazil. Remote Sens. 2017, 9, 838. [Google Scholar] [CrossRef] [Green Version]
  38. Zhou, T.; Li, Z.; Pan, J. Multi-Feature Classification of Multi-Sensor Satellite Imagery Based on Dual-Polarimetric Sentinel-1A, Landsat-8 OLI, and Hyperion Images for Urban Land-Cover Classification. Sensors 2018, 18, 373. [Google Scholar] [CrossRef] [PubMed] [Green Version]
  39. Coburn, C.A.; Roberts, A.C.B. A multiscale texture analysis procedure for improved forest stand classification. Int. J. Remote Sens. 2004, 25, 4287–4308. [Google Scholar] [CrossRef] [Green Version]
  40. Csillag, F.; Kabos, S. Hierarchical decomposition of variance with applications in environmental mapping based on satellite images. Math. Geol. 1996, 28, 385–405. [Google Scholar] [CrossRef]
  41. Gao, T.; Zhu, J.; Zheng, X.; Shang, G.; Huang, L.; Wu, S. Mapping spatial distribution of larch plantations from multi-seasonal landsat-8 oli imagery and multi-scale textures using random forests. Remote Sens. 2015, 7, 1702–1720. [Google Scholar] [CrossRef] [Green Version]
  42. Pei, H.; Sun, T.; Wang, X. Object-oriented land use/cover classification based on texture features of Landsat 8 OLI image. Trans. Chin. Soc. Agric. Eng. 2018, 34, 248–255. [Google Scholar]
  43. Mongus, D.; Žalik, B. Segmentation schema for enhancing land cover identification: A case study using Sentinel 2 data. Int. J. Appl. Earth Obs. Geoinf. 2018, 66, 56–68. [Google Scholar] [CrossRef]
  44. Zhang, F.; Li, W.; Lu, L.; Qingfeng, Z.; Kang, L. Technologies of extracting land utilization information based on SVM method with multi-window texture. J. Remote Sens. 2012, 16, 67–78. [Google Scholar]
  45. Paul, F.; Winsvold, S.; Kääb, A.; Nagler, T.; Schwaizer, G. Glacier Remote Sensing Using Sentinel-2. Part II: Mapping Glacier Extents and Surface Facies, and Comparison to Landsat 8. Remote Sens. 2016, 8, 575. [Google Scholar] [CrossRef] [Green Version]
  46. Shapiro, A.; Trettin, C.; Küchly, H.; Alavinapanah, S.; Bandeira, S. The mangroves of the Zambezi Delta: Increase in extent observed via satellite from 1994 to 2013. Remote Sens. 2015, 7, 16504–16518. [Google Scholar] [CrossRef] [Green Version]
  47. Wang, D.; Wan, B.; Qiu, P.; Su, Y.; Guo, Q.; Wang, R.; Sun, F.; Wu, X. Evaluating the performance of sentinel-2, landsat 8 and pléiades-1 in mapping mangrove extent and species. Remote Sens. 2018, 10, 1468. [Google Scholar] [CrossRef] [Green Version]
  48. Li, P.; Zhang, J.; Feng, Z. Mapping rubber tree plantations using a Landsat-based phenological algorithm in Xishuangbanna, southwest China. Remote Sens. Lett. 2015, 6, 49–58. [Google Scholar] [CrossRef]
Figure 1. Study area.
Forests 11 00399 g001
Figure 2. Flow chart for the method proposed in this study.
Forests 11 00399 g002
Figure 3. The 10 m forest/non-forest map in 2018 derived from Sentinel-1 data.
Forests 11 00399 g003
Figure 4. Feature importance at different window sizes of GF-1 (a), Sentinel-2 (b) and Landsat 8 (c). Vertical axis represents the value of feature importance.
Forests 11 00399 g004aForests 11 00399 g004b
Figure 5. Feature importance of gray-level co-occurrence matrix (GLCM) textural features for GF-1 (a), Sentinel-2 (b) and Landsat 8 (c). Vertical axis represents the value of feature importance.
Forests 11 00399 g005
Figure 6. Random forest (RF) classification results based on the spectral features only (a,c,e) and the spectral + textural features (b,d,f).
Forests 11 00399 g006
Figure 7. Accuracy changes before and after adding textural features.
Forests 11 00399 g007
Figure 8. Comparison of rubber plantation maps using GaoFen-1 (GF-1), Sentinel-2, and Landsat 8 imagery. Group (a) is the example of low canopy density rubber plantation classification, and Group (b) is the example of scattered rubber plantation classification. Group (c,d) are the examples of rubber plantation classification at the edges and boundaries
Forests 11 00399 g008
Table 1. Summary of the characteristics of the remotely sensed datasets used in the study.
Sensor NameSensor TypeAcquisition DateBandResolution (m)
Sentinel-1C-band RadarAll throughout 2018VV + VH10
Sentinel-2Optical16th February 2018490–2190 nm10–20
GF-1Optical5th March 2019450–890 nm2–8
Landsat 8Optical13th February 2018450–2290 nm30
Table 2. Image texture measure formulas.
Texture MeasureFormulaDescription
Mean (MEAN) MEAN = i , j = 0 N 1 i P i , j   MEAN represents the average brightness information in the window. It reflects the degree of texture rules. The stronger the rules, the greater the value.
Variance (VAR) VAR = i , j = 0 N 1 ( P i , j μ ) 2 / ( N 1 )   VAR reflects the contour of each homogeneous region of the image and the change in gray level. When the gray level changes greatly, its value is larger.
Homogeneity (HOM) HOM = i , j = 0 N 1 i P i , j 1 + ( i j ) 2   HOM is a measure of smoothness of image distribution. The more uniform the image matrix, the larger the value.
Contrast (CON) CON = i , j = 0 N 1 i P i , j ( i j ) 2   CON reflects texture thickness. The bigger the difference between adjacent pixels and gray value, the bigger the value.
Dissimilarity (DIS) DIS = i , j = 0 N 1 i P i , j | i j |   DIS is similar to contrast (CON), reflecting the heterogeneity
of images.
Entropy (ENT) ENT = i , j = 0 N 1 i P i , j ( ln P i , j )   ENT is a measure of the amount of information. The more complex the texture in the window, the greater
the entropy value.
Angular Second Moment (ASM) ASM = i , j = 0 N 1 i P i , j 2   ASM is the roughness of image texture. The finer the texture, the smaller the ASM.
Correlation (COR) COR = i , j = 0 N 1 i j P i , j μ 1 μ 2
μ 1 = i = 0 N 1 i j = 0 N 1 P i , j
μ 2 = j = 0 N 1 j i = 0 N 1 P i , j
  COR reflects the similarity of pixels in row and column directions of the gray level co-occurrence matrix. The higher the correlation, the greater the value.
Where i, j are the gray levels of paired pixels; P(i,j) are the probabilities of co-occurrence; and N is the number of distinct gray levels in the quantized image.
Table 3. Accuracy validation of forest/non-forest classification result based on 10 m Sentinel-1.
ClassUser’s AccuracyProducer’s AccuracyEstimation Error 1Overall AccuracyKappa
Forest 298.24%96.34%3.66 ± 1.71%0.95930.8919
Non-forest 389.31%94.67%5.33 ± 3.59%
Note: 1 the error associated to the estimation of a proportion p is z*sqrt(p(1 − p)/n), where n is the number of data points utilized to compute p, and z the tabulated z-score [35]. The number of forest points is 464 and that of non-forest is 150. Z = 1.96 ( α = 0.05) in this study. 2 Forest types mainly include natural forest and rubber plantation. 3 Non-forest mainly includes cropland, water, and built-up land.
Table 4. Accuracy validation of RF classification using only spectral information.
ClassUser’s AccuracyProducer’s AccuracyEstimation ErrorOverall AccuracyKappa
GF-1Rubber plantation92.65%79.37%20.63 ± 6.27%0.8271 0.6448
Natural forest70.65%88.75%11.25 ± 3.66%
Sentinel-2Rubber plantation92.13%81.82%18.18 ± 5.98%0.83860.6639
Natural forest72.92%87.50%12.50 ± 3.83%
Landsat 8Rubber plantation89.84%80.42%19.58 ± 6.15%0.81610.6162
Natural forest70.53%83.75%16.25 ± 4.28%
Note: The number of rubber plantation points is 286 and that of natural forest is 160. z = 1.96 (α = 0.05) in this study.
Table 5. Accuracy validation of RF classification using spectral and texture information.
ClassUser’s AccuracyProducer’s AccuracyEstimation ErrorOverall AccuracyKappa
GF-1Rubber plantation97.28%87.41%12.59 ± 5.14%0.90360.7985
Natural forest80.95%95.63%4.37 ± 2.37%
Sentinel-2Rubber plantation96.67%91.26%8.74 ± 4.38%0.92380.8379
Natural forest85.80%94.38%5.62 ± 2.67%
Landsat 8Rubber plantation96.59%89.16%10.84 ± 4.82%0.91030.8108
Natural forest82.97%94.38%5.62 ± 2.67%

