Article

Ecostoichiometry Reveals the Separation of Microbial Adaptation Strategies in a Bamboo Forest in an Urban Wetland under Simulated Nitrogen Deposition

1
China National Bamboo Research Center, Key Laboratory of High Efficient Processing of Bamboo of Zhejiang Province, Hangzhou 310012, China
2
College of Life Sciences, Southwest Forestry University, Kunming 650224, China
3
Hangzhou Academy of Environmental Protection Science, Hangzhou 310014, China
4
Center for Social Economic Policy and Climate Change Research and Development, Forestry and Environment Research Development and Innovation Agency, Bogor 16610, Indonesia
5
East China Inventory and Planning Institute, NFGA, Hangzhou 310019, China
*
Author to whom correspondence should be addressed.
Forests 2020, 11(4), 428; https://doi.org/10.3390/f11040428
Submission received: 21 February 2020 / Revised: 7 April 2020 / Accepted: 8 April 2020 / Published: 9 April 2020
(This article belongs to the Section Forest Ecology and Management)

Abstract

:
The effect of nitrogen (N) deposition on N limitation, phosphorus (P) limitation and the related soil and microbial stoichiometries remains unclear. A simulated nitrogen deposition (SND) experiment (control, ambient, medium and high) and molecular techniques (high-throughput sequencing of 16S and ITS) were conducted to examine the variations in abiotic and biotic properties and to describe the responses of microbial (bacteria and fungi) adaptation strategies in a moso bamboo (Phyllostachys edulis J. Houzeau) forest following SND. Soil water content (SWC) was positively correlated with the microbial community composition. Observed increases in total N and nitrate N contents and decreased ammonia N suggested that SND influenced nitrification. Chao1 and F:B showed that bacteria were more sensitive to SND than fungi. PCoA and linear discriminant analysis (LDA), coupled with effect size measurements (LefSe), confirmed that microbial community composition, including the subgroups (below class level), responded to SND by employing different adaptation strategies. Soil C:N indicated that the soil of the moso bamboo forest was under N limitation prior to SND. The increase in total P (TP), available P (AP) and microbial biomass P (MBP) suggested the acceleration of soil P cycling. Microbial biomass C (MBC) and microbial biomass N (MBN) were not affected by SND, which led to a significant shift in MBC:MBP and MBN:MBP, suggesting that P utilization per unit of C or N was promoted. There was a negative gradient correlation between the fungal community composition and MBC:MBP, while bacteria were positively correlated with MBN:MBP. The results illustrated that the response of fungi to MBC was more sensitive than that of bacteria in the process of accelerated P cycling, while bacteria were sensitive to MBN. Prior to P limitation, SND eliminated the soil N limitation and stimulated soil microorganisms to absorb more P, resulting in an increase in MBP, but did not alter MBC or MBN. This study contributes to our understanding of the adaptation strategies of fungi and bacteria and their responses to soil and microbial stoichiometries.

1. Introduction

N deposition has become an important global change factor [1]. During the last century, the amount of reactive nitrogen (N) has doubled globally, and the biodiversity of soil microorganisms has responded sensitively [2]. Active N produced by human activities enters the atmosphere and then settles in terrestrial ecosystems, which interferes with the natural cycling of N, changes the availability of N, and thus not only has a wide impact on the fixing capacity of forest N, but also accelerates soil N leaching, causes changes in soil N use efficiency and soil C:N and C:P stoichiometric ratios, and results in soil acidification. N and P availability plays a crucial role in C cycling in terrestrial ecosystems [3,4,5,6,7]. However, the soil stoichiometric regulation of the microbial community assembly and its impact on microbial ecological adaptability in the soil of wetland forests remains unclear.
The change in soil pH and stoichiometry under the continuous increase in N deposition makes the study of the soil microbial feedback mechanism an important topic in global change research [1]. Microbes regulate core ecosystem processes, such as organic matter decomposition, soil C retention and nutrient (N, P) transformation, and therefore are a vital part of the global biogeochemical cycle [8]. Ecological stoichiometrics are helpful to understand nutrient cycling relationships within ecosystems by analyzing the imbalances in the supply and consumption of ternary elements (C:N:P) between organisms and their resources [9]. This study provides a method for studying the impact of N deposition on the structure and function of plant–microorganism–soil systems. Homeostasis is key to nutrient recycling and the substrate quality effects of stoichiometry; different organisms vary in how they regulate their elemental composition in response to variations in resource stoichiometry [10,11]. A stoichiometry meta-analysis found that the fungal C:N:P stoichiometry is, on average, 250:16:1 (by atoms) [7], which is close to the Redfield ratio (106:16:1) for marine phytoplankton. Cleveland and Liptzin [12] proposed a hypothesis of soil homeostasis and reported a value of 60:7:1 for soil bacteria. The variation in elemental composition is linked to the differences in organismal allocation to biochemical and structural components that differ in C, N, and P contents [9]. Therefore, comparing soil microbial C:N:P stoichiometry can be used as a tool to evaluate nutrient limitations [13,14]. González-Chávez et al. [15] used microbial N:P (MBN:MBP) to examine the nutrient limitations of soil cultivated with N fertilizer over a long-term period, indicating that the cultivated soil was limited by P. The effect of P limitation on C and N fixation in ecosystems may be underestimated [16]. Studies have found that N deposition is likely to increase soil microbial C:N (MBC:MBN), N:P (MBN:MBP) and C:P (MBC:MBP) [17,18,19]. Studies have suggested that elevated N deposition can lead to decreased soil microbial biomass [20], and MBC:MBN and MBN:MBP are negatively correlated with N deposition [21,22,23]. Studies have also documented nutrient stoichiometry decoupled from microbial behavior [24,25]. As the soil changes induced by N deposition are mainly the result of microbiological processes, different niche characteristics, such as substrates and soil properties, are selected by specifically adapted microbial communities [7,26]. The microbial acquisition of a selected substrate is regulated by relatively stable C, N and P levels [27]. Ecostoichiometry, which allows the separation of soil biotic and abiotic environments with varying degrees of microbial alteration, might help to elucidate microbial-mediated soil C, N and P cycling characteristics [7,28]. Studies that examine the degree to which soil microbial C:N:P stoichiometry in natural communities is driven by adjustments to variations in external N supplies or by shifts in the relative abundance are still lacking.
The Yangtze River delta, an area with conflicts between economic development and natural ecological protection, is one of the highest N deposition regions in the world (exceeding 30 kg N hm−2 a−1) [29]. This delta is also an important wetland protection area in China, with a wetland area of 618.55 × 10⁴ hm2 [30]. The delta provides an ideal place to study the soil microbial adaptation strategies of wetland forests affected by the increasing threat of elevated N deposition due to the combustion of fossil fuels and a growing demand for N in agriculture [31]. The dike–pond system is a typical ecosystem of urban wetlands formed by a dense network of slow-moving rivers and lakes in the delta. With the development of industrialization and urbanization, the original dike-pond wetland ecosystem has changed, e.g., wetland reduction, or even disappearance, and water eutrophication have occurred. However, little is known about the soil microbial ecostoichiometric response mechanism to human-induced nitrogen deposition in the urban wetlands of these developed regions.
The present study was undertaken to determine how microbial communities respond to soil ecostoichiometric variations. Ultimately, our goal was to understand the effects of N deposition on abiotic (soil C, N and P) and biotic (microbial biomass C, N and P) properties and their characteristics of niche separation. Hence, we examined the microbial variations in topsoil (0–20 cm) under simulated N deposition (SND) and evaluated the compositional changes in bacteria and fungi communities using high-throughput sequencing of the 16S ribosomal RNA (rRNA) gene and ribosomal ITS, respectively. We hypothesized that (i) SND would influence the community structure and microbial stoichiometry by changing the soil stoichiometry and (ii) SND would depress the abundance of fungi but stimulate the abundance of bacteria due to their different preferences for adaptable strategies.

2. Materials and Methods

2.1. Overview of the Study Area

The experimental site was Xixi National Wetland Park (120°03′ E, 30°15′ N) in the western suburb of Hangzhou, Zhejiang Province, China. The details of the study area were described by Li et al. [32]. This area has a monsoon climate within the northern margin of the subtropical zone. The average annual temperature is 16.4 °C, and the annual precipitation is 11003–1600 mm. The wetland is formed by ponds, rivers, lakes, swamps, dikes and islets with aquaculture in ponds and cultivation of economic tree species on dikes in delta regions, fertilizing manure and pond sediment. The main soil type is paddy soil.

2.2. Field Experiment and Soil Sampling

Moso bamboo (Phyllostachys edulis J. Houzeau), a giant and arbor-like bamboo species, is one of the main economic species in the compound production system of dike ponds, which have grown naturally in the reserve in recent decades to better protect wetlands. The dike width of the moso bamboo forest ranges from 16 to 28 m. There are few herbaceous plants because of the high canopy density, such as Ophiopogon japonicas Ker-Gawl., Cardamine hirsute L., and Pteris multifida Poir., beneath the forest. The dike surface is 80-120 cm away from the water surface. The density, height, and DBH of moso bamboo are 0.7–1.1 stalks·m2, 9.0–11.4 m, and 7.3–12.5 cm, respectively. The light conditions beneath the forest are 7.8–13.1% compared with full sunlight.
According to the actual N deposition in subtropical China (30–37 kg·hm−2 a−1) [29], four levels of SND were derived: control (CK, 0 kg·hm−2·a−1, ambient deposition), low N (N30, 30 kg·hm−2·a−1), medium N (N60, 60 kg·hm−2·a−1), and high N (N90, 90 kg·hm−2·a−1). Three 3 × 3 m replicate plots were set up in each of the four SND levels, with a total of 12 plots established in this study. There was an interval of 10–20 m between each plot as a buffer to prevent interaction.
SND spraying began in October 2016. Briefly, the annual N application rate was divided into 12 parts, once per month. NH4NO3 was fully dissolved in 2.7 L pure water and uniformly sprayed on the surface of each plot of forestland. After surface litter and impurities were removed, soil samples were collected from a depth of 0–20 cm from three randomly selected points in each plot in October 2018. Subsequently, a total of 36 soil samples were collected. The samples were sieved (=2 mm) for homogenization, and three portions of the sieved soil samples were retrieved. One portion of the sieved sample was stored at −78 °C for DNA extraction and 16S and ITS sequencing. One portion was air-dried, and the remaining fresh, portion was stored at 4 °C and used for the determination of soil properties [32].

2.3. Measurement of Soil Properties

The following soil properties were determined for each sample and used in the subsequent statistical analyses: soil water content (SWC), pH, soil organic carbon (SOC), total nitrogen (TN), total phosphorus (TP), available phosphorus (AP), total sulfur (TS), nitrate-N (NO3-N) and ammonium-N (NH4+-N), water dissolved organic carbon (WSOC), water dissolved organic nitrogen (WSON), microbial biomass carbon (MBC), microbial biomass nitrogen (MBN), and microbial biomass phosphorous (MBP).
The soil water content (SWC) was determined by the oven-dry weight method. The pH was determined in a 1:2.5 (w/v) soil:water extract using a glass LE410 pH electrode (FiveEasy™ pH meter; Mettler-Toledo AG, Zurich, Switzerland). SOC, WSOC and WSON were measured using a total organic carbon (TOC) analyzer (multi N/C 3100 and HT 1300; Analytikjena, Jena, Germany). TC, TN and TS were determined using an elemental analyzer (vario MAX cube; Elementar Analysensysteme GmbH, Hanau, Germany). TP was measured by the Mo-Sb anti-spectrophotometric method. The soil C:N, C:P and N:P ratios were calculated using the SOC, TN and TP datasets. NO3-N and NH4+-N were extracted with 2 M KCl and then determined using a continuous-flow ion autoanalyzer (Flowsys III; Systea, Anagni, Italy). MBC and MBN, determined using the chloroform-fumigation-extraction method [33], were calculated as the difference between fumigated and nonfumigated samples, adjusted by a coefficient (kEC, kEN = 0.45). MBP was determined according to Brookes et al. [34]. With the exception of a 5.0 g soil sample being used, the fumigation procedure was the same as that used for MBC and MBN with an adjusted coefficient (kEP = 0.4).

2.4. DNA Extraction, Polymerase Chain Reaction, and Illumina HiSeq Sequencing

DNA was extracted using the HiPure soil DNA kit B (Magen, Guangzhou, China). The bacterial 16S rRNA gene was amplified using the forward primer 5′-CCTACGGGNGGCWGCAG-3′ and reverse primer 5′-GACTACHVGGGTATCTAATCC-3′ [35]. The fungal ITS2 rRNA gene was amplified using the forward primer 5′-GCATCGATGAAGAACGCAGC-3′ and reverse primer 5′-TCCTCCGCTTATTGATATGC-3′ [36]. The polymerase chain reaction (PCR) was set up as described by Li et al. [32]. Library construction and Illumina HiSeq 2500 platform (Illumina Inc., San Diego, CA, USA) sequencing were completed by Xiangyin Biological Technology Co., Ltd (Shanghai, China).

2.5. Data Processing and Statistical Analysis

Obtained DNA sequence reads were trimmed, and then chimeras were removed using USEARCH, and sample sequences were combined using QIIME_1.9.1 software. An operational taxonomic unit (OTU) was defined as a set containing DNA sequences with a similarity of >97%. OTUs representing less than 0.005% of all sequences were removed before analysis. Diversity indexes were calculated using QIIME software.
One-way ANOVA, multiple comparative analysis of OTU frequencies (α = 0.05) and nonparametric multivariate analysis of variance (PERMANOVA) were conducted using the Data Processing System (DPS) (17.10 for Windows, Zhejiang University, Hangzhou, China) [37]. The contributions of soil properties to the dissimilarities in microbial communities and differences in the relative abundances of microbial phyla were based on the DPS module of the Spearman correlation and best multiple regression. Alpha diversity type complexity, principal coordinates analysis (PCoA) and redundancy analysis (RDA) were conducted using the “vegan” and “ggplot” packages in R [38,39]. Absolute quantity (i.e., observed species) was used to calculate fungi:bacteria (F:B) [26]. Linear discriminant analysis (LDA) coupled with effect size measurements (LefSe) was applied to measure the main differential clades using the “stats” package in R [40,41].

3. Results

3.1. The Effects of SND on Soil Physicochemical Properties and Ecostoichiometry

Increased N deposition via SND resulted in a decline in soil pH, most notably at N60 and N90, compared with that in CK (Table 1). SOC decreased at N90, and WSOC also decreased at N30, N60 and N90. WSON at N90 was different from that of CK and was found to decrease, but no significant difference was observed between N30 and N60, suggesting an increased risk of N leaching and water eutrophication. There was no difference in MBC and MBN among the different treatments, but MBP showed a difference at N90 compared with the other treatments. NH4+-N and NO3-N exhibited the opposite result, with NH4+-N decreasing with increasing SND, while NO3-N increased at N90.
As SND increased, soil C:N decreased significantly at N90, which was different from that of N30 and CK, while N60 was different from CK (Figure 1). There was no difference in C:P among treatments, while N:P reached the maximum value at N60. The trends of MBC:MBP and MBN:MBP were similar, with no difference among N30, N60 and N90, but both decreased significantly compared with the values observed for CK.

3.2. Effect of SND on the Alpha Diversity of Bacteria and Fungi

There was a stronger response in bacteria to SND than that for fungi (Table 2). Specifically, the Chao1 index reached its peak value at N30, with a significant difference compared with CK, but there were such no responses at N60 and N90. The OS also showed the same trend, indicating that the bacterial community of CK was at a disadvantage; the population composition of N30 was the most abundant, and SND stimulated the quantity and richness of the bacterial community at N30. The Shannon and Simpson indexes were not different among the treatments, indicating that SND had no role in improving the bacterial diversity and community evenness. Fungi had a certain inertia and showed no difference, and all the average values of the index (Chao1, OS, Shannon and Simpson) showed only a downward trend. F/B declined from ambient levels at higher N deposition rates.

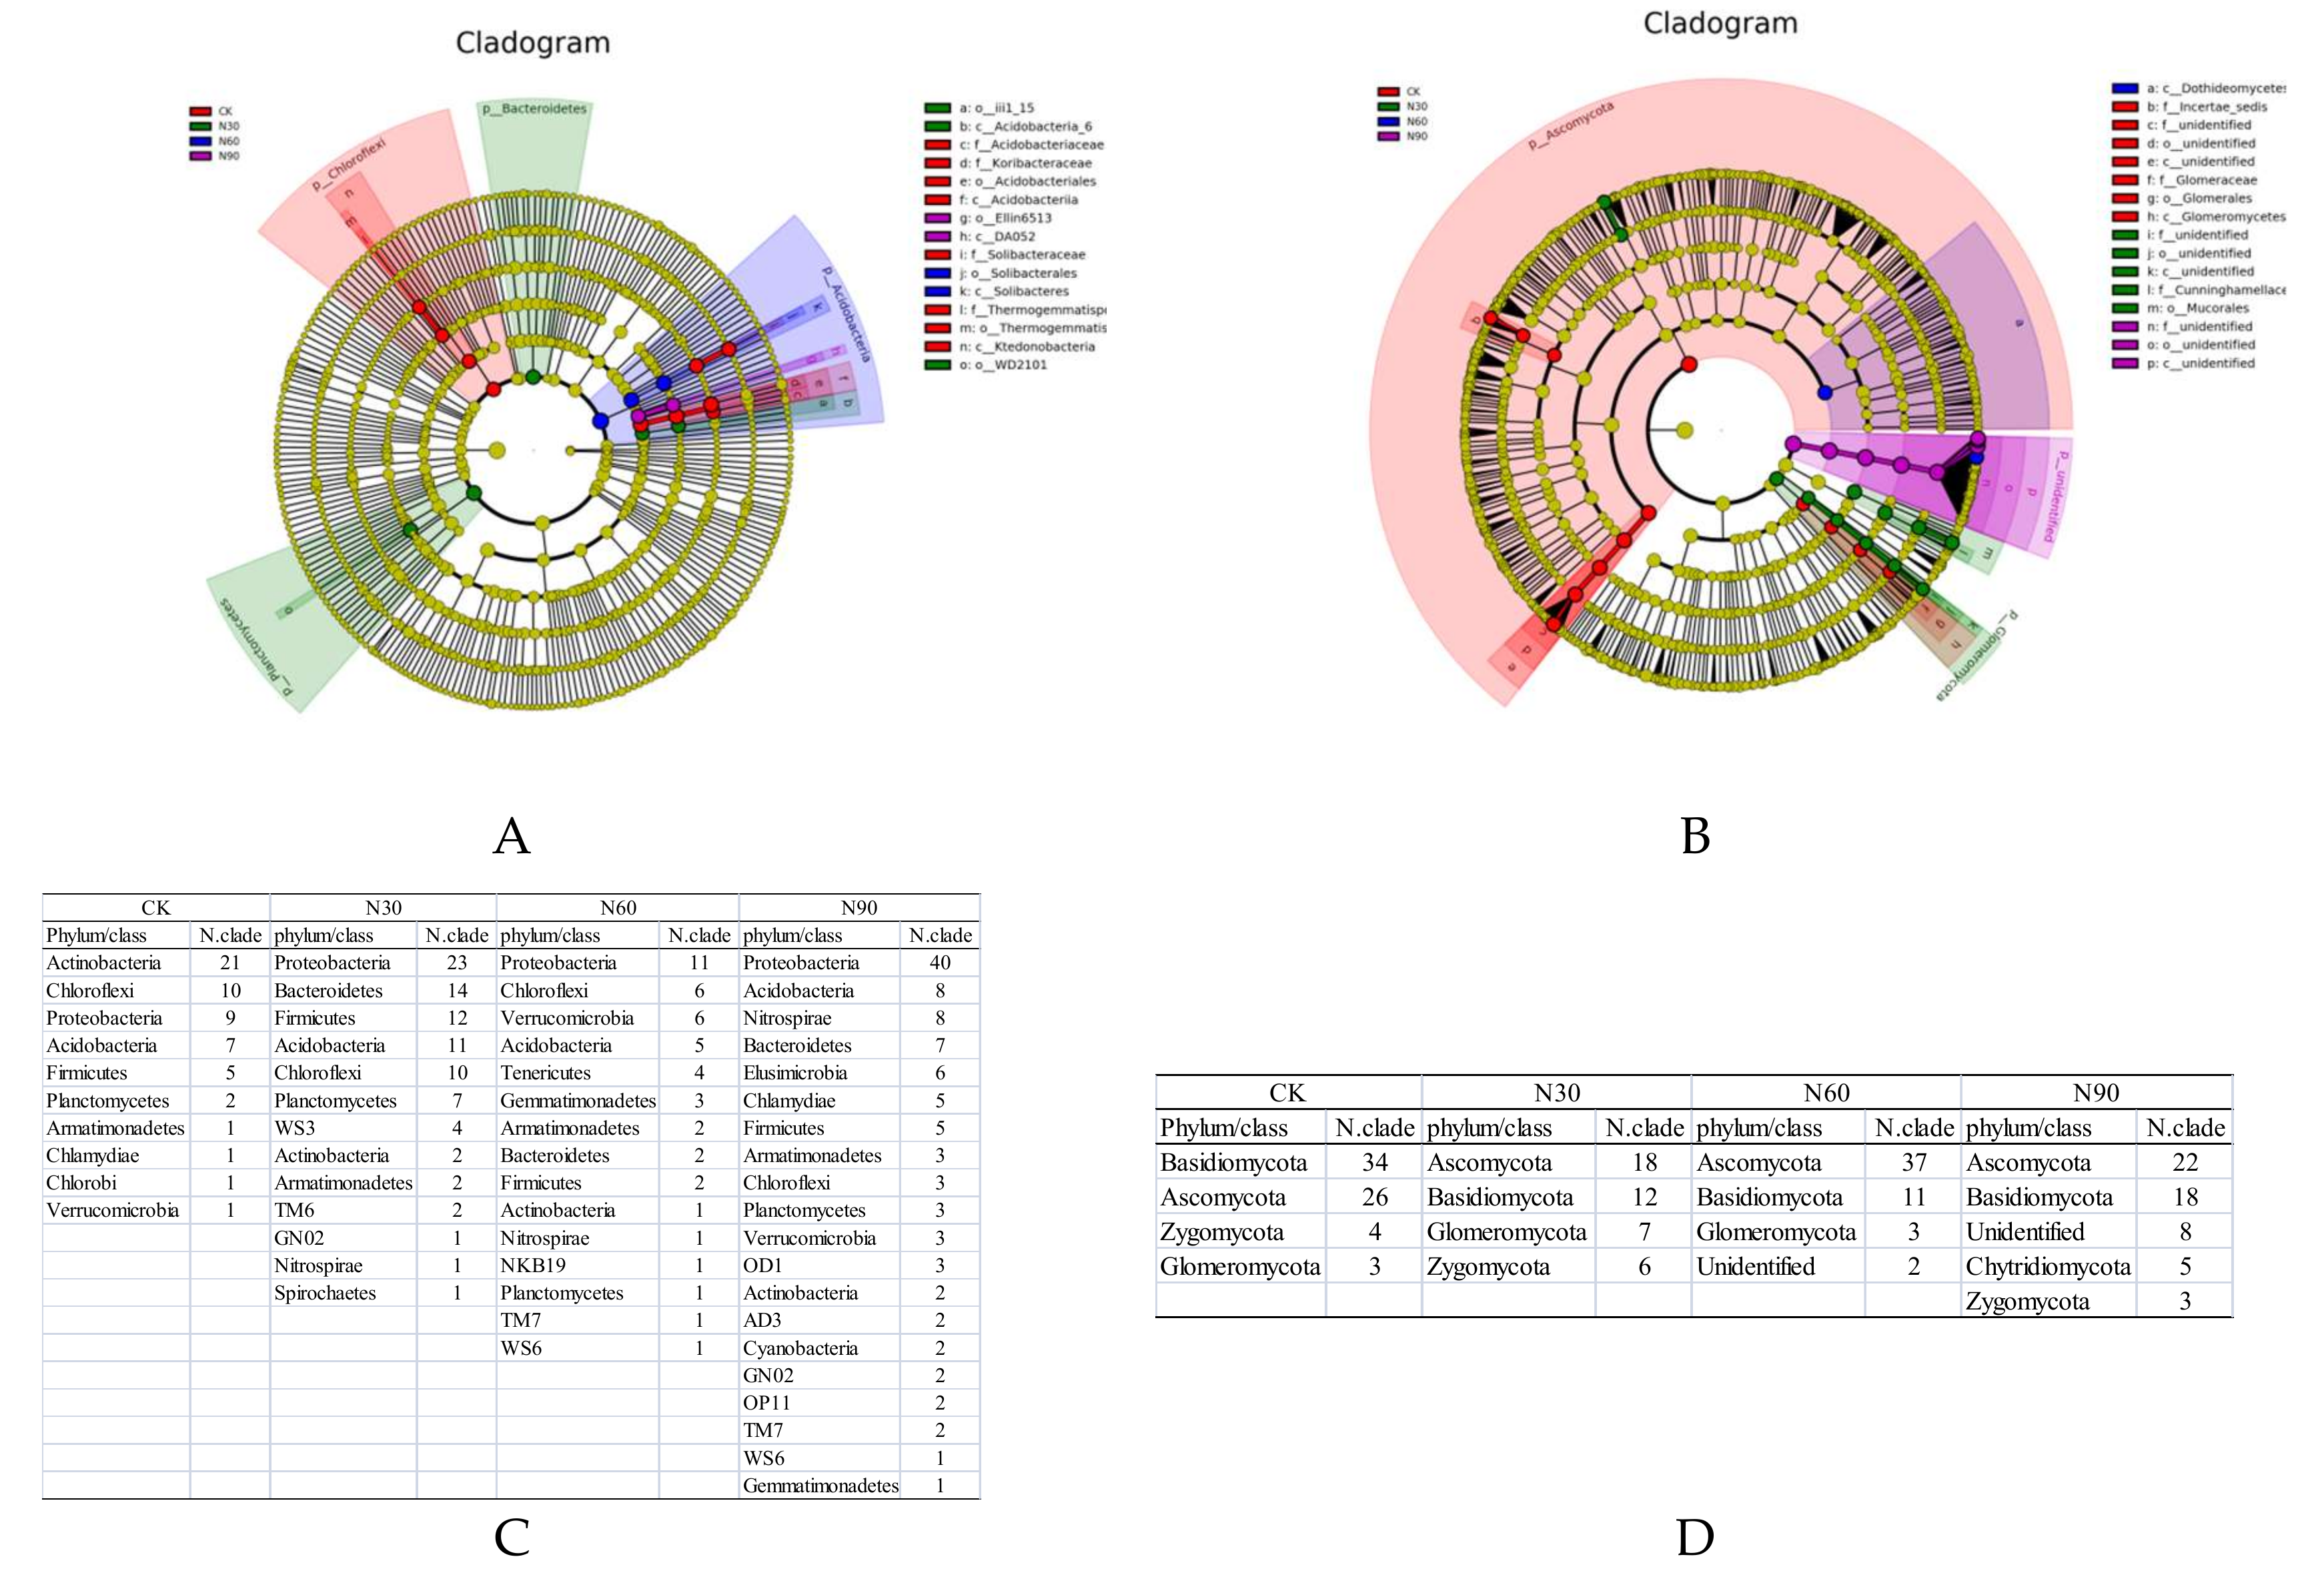
3.3. Effects of SND on the Beta Diversity of Soil Bacteria and Fungi

The PCoA results of the bacterial community in the moso bamboo forest showed that the PC1 and PC2 dimensions calculated from the distance matrix explained 27.98% and 16.75%, respectively, of the OTU variation in the soil bacterial composition at the genus level (Figure 2A). The bacterial communities of N30, N60 and N90 were different from that of CK, which is consistent with the PERMANOVA results. There was no significant difference between N30 and N60, both of which were different from N90, indicating that N30 and N60 had similar effects on the composition of the bacterial community. The PC1 and PC2 dimensions calculated from the distance matrix explained 20.65% and 14.26%, respectively, of the OTU variation in the soil fungal composition at the genus level (Figure 2B). N30, N60 and N90 influenced the fungal community structure for those fungal communities that differed from that in CK. N60 and N90 had similar influences (PERMANOVA, N60 vs. N90 p-value = 0.1014), which suggested that both N60 and N90 exerted a greater effect than N30 based on the distances from CK.
LEfSe detected differential clades at all SND levels, which clarified statistically significant differences om diversity among the bacterial and fungal communities (Figure 3). At an LDA score of ≥4, LEfSe showed that the most notably differential clades were Acidobacteria (5) and Chloroflexi (3) in the CK, Acidobacteria (2) and Planctomycetes (1) at N30, Acidobacteria (2) at N60, and Acidobacteria (2) at N90 (Figure 3A). The cladogram also identified the Incertae_sedis (1), Ascomycota (3) and Glomeromycota (3) in the CK; Glomeromycota (3), the Cunninghamellaceae family and the Mucorales order at N30; the Dothideomycetes class at N60; and an unidentified phylum (3) at N90 for fungi (Figure 3B). At an LDA score of ≥2, the numbers of bacterial discriminant clades from the CK to N90 were 58, 90, 47, and 108, respectively, while the discriminant clades of fungi from the CK to N90 numbered 67, 43, 53, and 56, respectively. At the CK level, the LEfSe indicated Actinobacteria (21), Chloroflexi (10), Proteobacteria (9), Acidobacteria (7) and Firmicutes (5) as the most differentially abundant bacterial taxa. It also revealed that, in contrast to CK, Proteobacteria (23, 11, and 40) was commonly found at the N30–N90 levels. Fungal LEfSe indicated that Ascomycota (26, 18, 37, and 22) and Basidiomycota (34, 12, 11, and 18) were the main discriminant clades, with Basidiomycota prominent in the CK. These results indicated that both bacterial and fungal groups differed under SND, thereby suggesting that both bacteria and fungi are sensitive to N deposition.

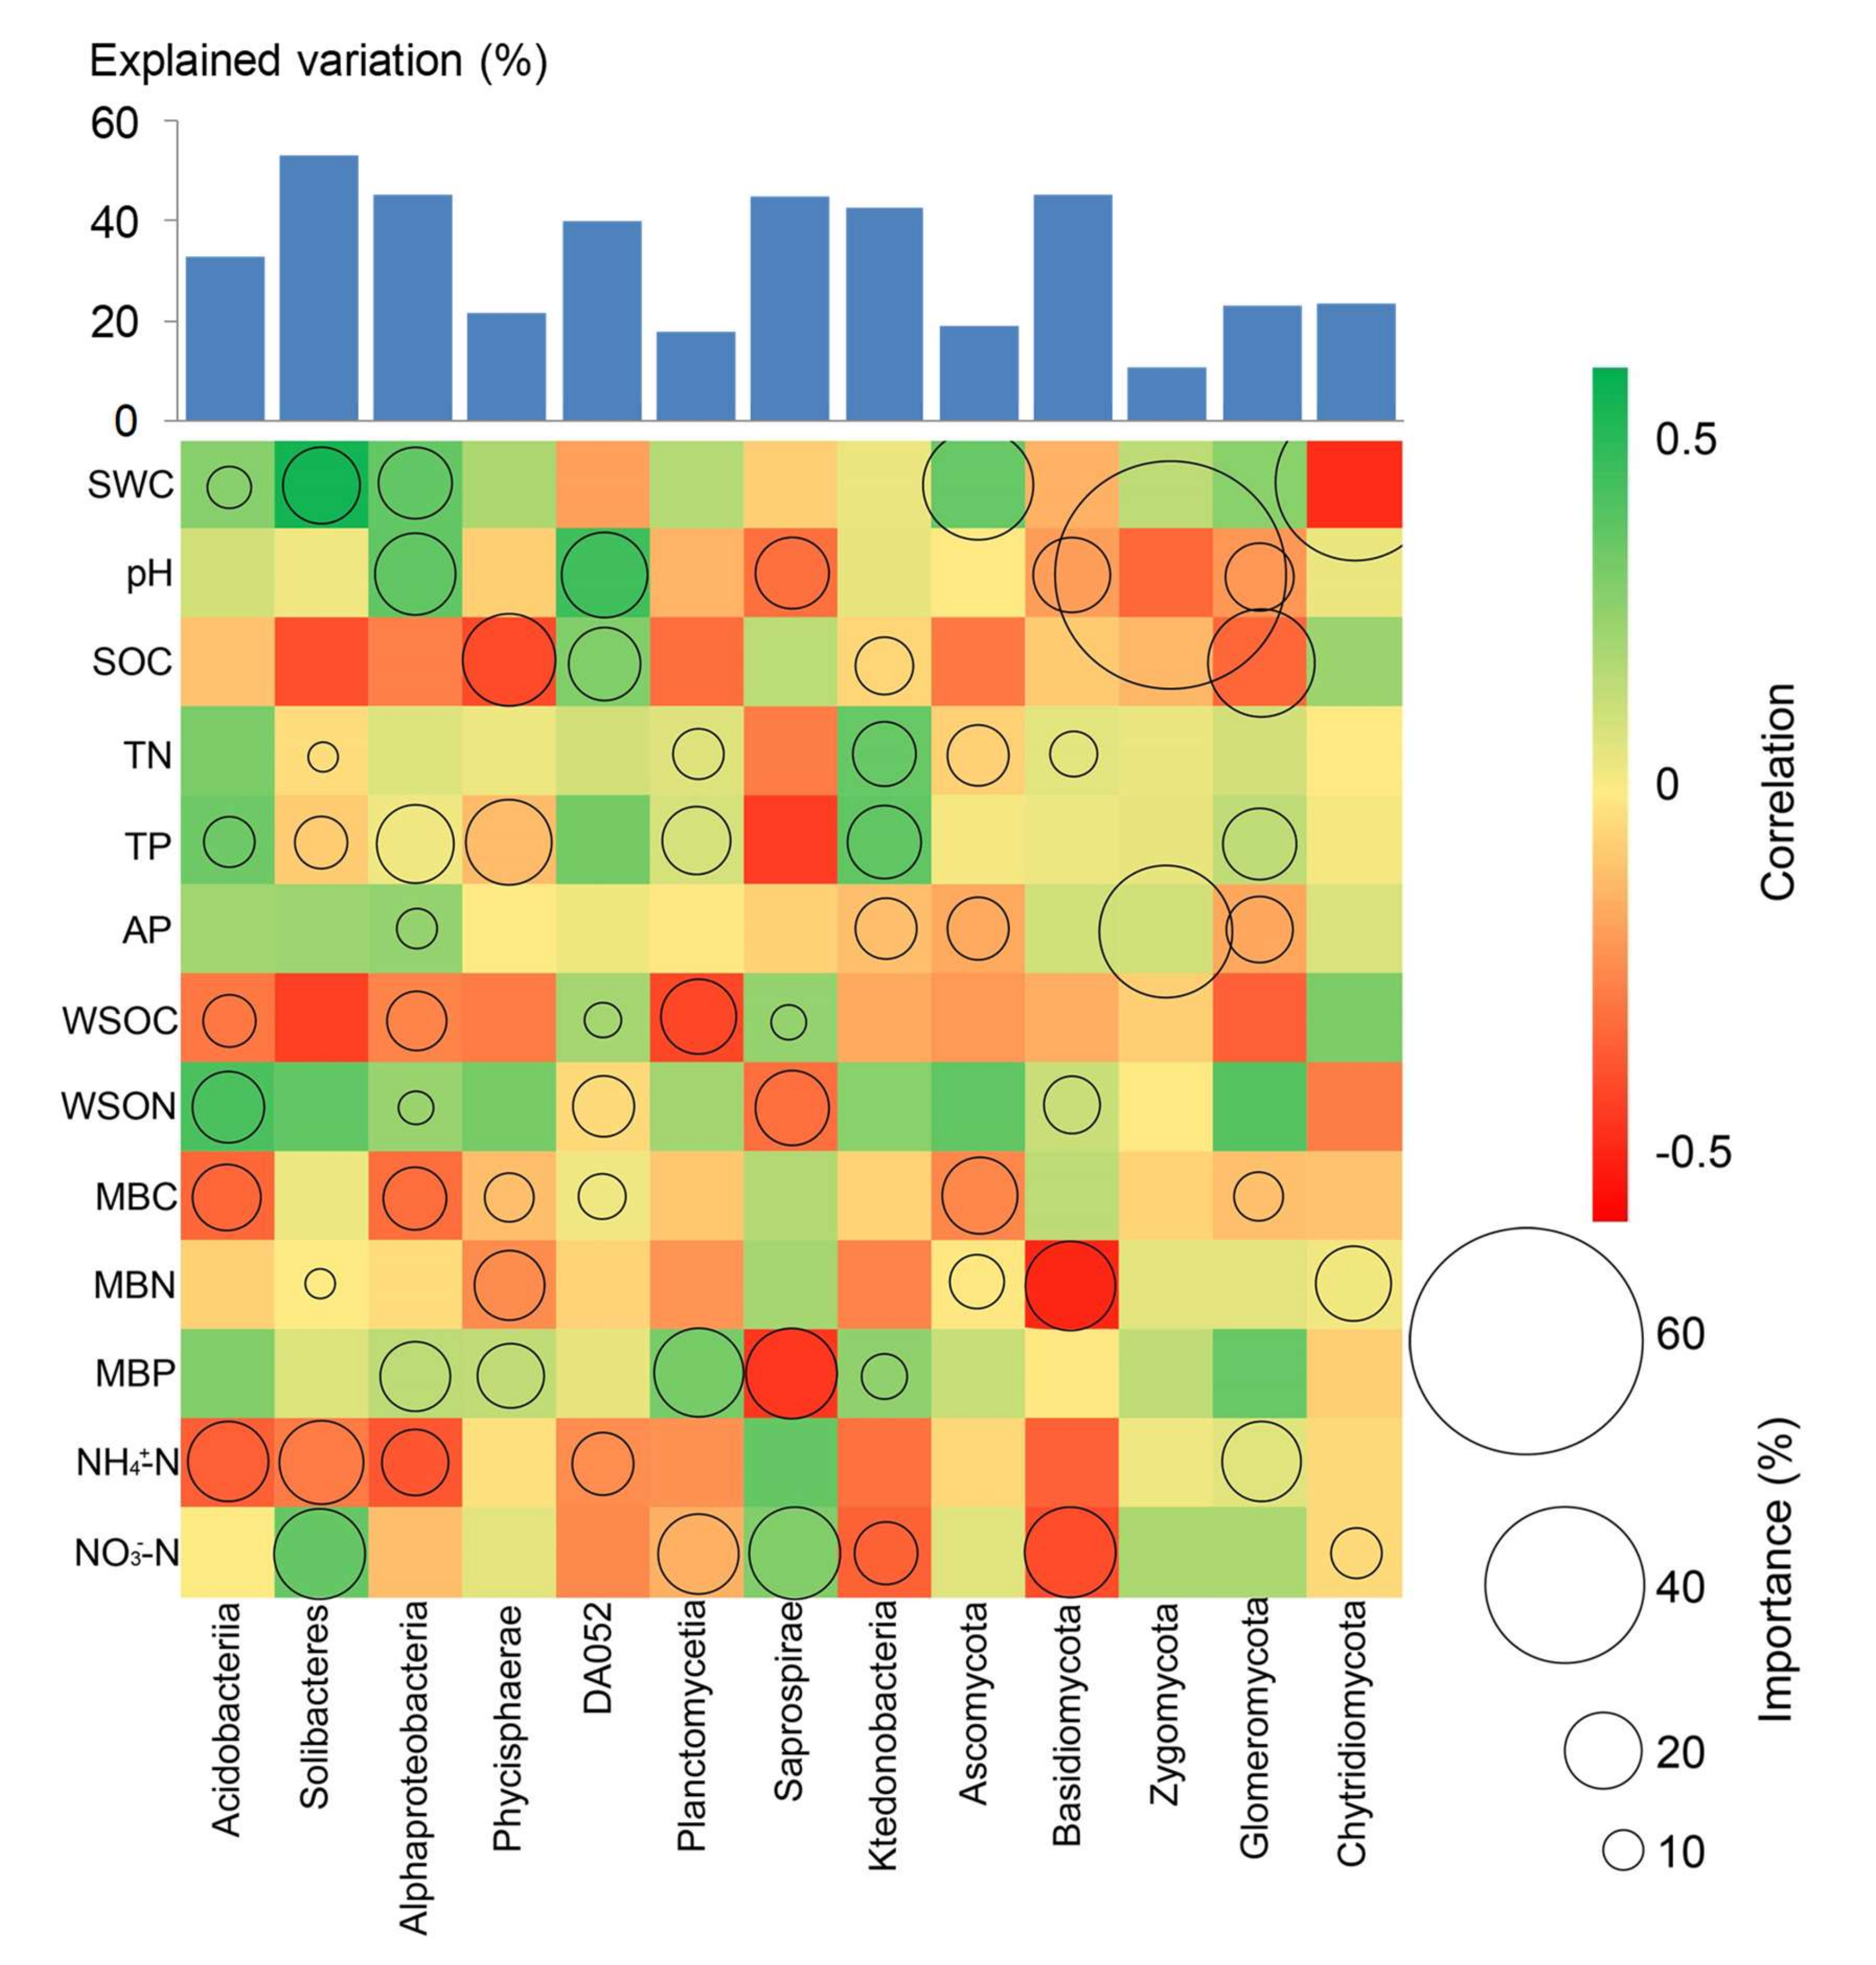
3.4. Association between Soil Properties and the Microbial Community Composition

Under SND conditions, the relative abundance of bacterial and fungal communities at the phylum level can be expressed by different physicochemical parameters based on the best model (Figure 4). The correlation of the values with the differences in soil properties between bacterial and fungal phyla showed that microbial diversity exhibited strong, microhabitat-specific patterns. The major predictors were identified according to the correlation and the best multiple regression model, suggesting that this approach is helpful for us to understand the relationship between microbial community changes and microhabitat along the N deposition continuum.
Based on a VIF test, the inflation factors of all physicochemical parameters were smaller than 20.0, among which 11 parameters were selected for bacterial RDA (Figure 5A). The four-dimensional axes revealed that the cumulative percentage variance (CPV) of bacterial genus data was 50.9%, and the CPV between the bacterial genus composition and the environment was 78.4% based on a Monte Carlo test of the significance of all canonical axes (F-ratio = 1.560, p-value = 0.024). According to the correlation coefficient (R) of RDA, WSON (R = 0.565), NH4+-N (R = −0.531) and C/N (R = −0.501) were correlated with the first axis, while SOC (R = −0.624), SWC (R = 0.557), WSOC (R = −0.565) and MBN/MBP (R = −0.534) were correlated with the second axis, indicating that the bacteria exhibited a gradient response to the above soil properties at the genus level. However, there were no such responses at the genus level of fungi, but the fungal phylum composition had weak responses to SWC (R = −0.739), WSON (R = −0.667) and MBC/MBP (R = 0.657), which were correlated with the first axis based on a Monte Carlo test of significance (F-ratio = 1.822, p-value = 0.056) (Figure 5B).
Variance partitioning analysis (VPA, Figure 5C) with partial RDA showed that the C, N, P, soil CNP ratio and microbial biomass CNP ratio groups accounted for 5.8%, 13.2%, 8.3%, 5.1% and 6.2%, respectively, of the total bacterial genus variance after the fitting of covariables. The intersection variation explained by all of the soil properties was 17.2%. SWC, WSON, NO3-N, MBN, MBC/MBP and MBN/MBP explained 17.4% of the total fungal phylum variance (Figure 5D). The CPV of the fungal phylum data was 27.3%, indicating that there were other properties that were more influential than the factors we examined in this study.

4. Discussion

Soil acidification is an important cause of soil quality decline and further causes a series of ecological problems, such as ecosystem degradation, biodiversity reduction, and nutrient loss [42]. At present, it is generally accepted that long-term N addition will cause a significant decrease in soil microbial biomass because of soil acidification and a decline in soil microbial activity [18,22]. Our results showed that the N60 and N90 levels had an impact on soil pH, but pH had no gradient correlation with the microbial community composition, while SWC did have a gradient correlation, which may be related to the short implementation of SND, which had not yet affected the overall microorganism community [43]. The change in the microbial community’s abundance of individual phyla was related to pH, which indicates that pH and other related parameters can be used to predict the dynamics of microbial abundance. TN increased with decreasing pH, which was similar to the results of nitrogen addition experiments in many ecosystems, indicating that N deposition could significantly improve soil N content [44]. In turn, N deposition can improve the rate of soil net nitrogen mineralization and greatly improve available N in the soil, thus increasing the amount of nitrogen available to plants and soil microorganisms [43,45]. In our experiment, ammonia N decreased, and nitrate N increased, which was similar to the research results of short-term N input by Hall and Matson [46], indicating that the net nitrification rate gradually increased with increasing N addition dose [47]. In general, the moso bamboo forest was short of N, especially with respect to the natural growth status, i.e., 20 years in our study, which is related to its preference for ammonium-N and strong clonal breeding habits [48]. Therefore, N deposition in moso bamboo forests can alleviate the degradation of ecosystems caused by N deficiency to a certain extent. Consequently, a slight N addition was beneficial to the stability of the moso bamboo forest and soil flora. It was suggested that 30 kg·hm−2·a−1 N can be used as a reference value for maintaining the development of bamboo ecosystems over a short period. However, the long-term application of chemical N fertilizer alone will accelerate the leaching loss of soil alkaline matter [6]. Furthermore, soil stoichiometry changed with the increase in nitrate N and, in the aerobic environment, the bacteria could not obtain enough available N (except for denitrifying bacteria) during competition with moso bamboo, which led to an imbalance in the bacterial community’s composition and variation in life strategies and ecological adaptability [49]. Therefore, over the long term, N deposition is not conducive to the healthy development of the ecosystem.
The N and P pools are closely related, and their consumption processes control the N and P circulation within microorganisms [13,50]. The increase in the average value of TN in this study showed that exogenous N input alleviated nitrogen deficiency in the moso bamboo ecosystem, which is similar to the results of most studies [5,31,42,51]. Wang’s results [52] suggest that a soil C:N greater than 25.0 is nitrogen-limiting for microorganisms. Our experiment shows that the soil C:N was between 12.6 and 26.8, and some of the control plots (CK) were in the critical state of N limitation. Therefore, in this non-N-limited environment of SND, N was not utilized by microorganisms but was nitrated or denitrified [53]. The soil C:N directly controls the nitrification rate and indirectly affects the nitrate used for denitrification [10]. This study also confirmed this point of view: with the decline in the C:N ratio and the increase in nitrate N, the development of the bacterial community had a negative gradient correlation with ammonium-N and C:N, which shows that SND affected soil C:N and was closely related to the decomposition ability of soil microorganisms [4]. However, in a non-N-limited environment, high growth rates are needed to increase the investment of P-rich ribosomal RNA, which means a decrease in the soil N:P when the soil status becomes P-limited [10]. In contrast, our moso bamboo forest may be in the transformation period from non-N limitation to P limitation but not but not yet experiencing P limitation, which was identified by the increased average value of TP and AP and the increasing soil N:P in N60 and N90. Moorhead and Sinsabaugh [54] showed a decrease in soil C:P, indicating that N had a positive effect on the mineralization of organic and inorganic P, which is consistent with our results. This finding suggests that N deposition may stimulate mineralization and increase biological demand for P [55], resulting in accelerated P cycling in forest ecosystems, especially litter decomposition and P acquisition [56], which may lead to P limitation in the long term.
The microbial community is constantly adapting to changes in specific microhabitat conditions provided by the soil [28]. The variation in microbial stoichiometry is the change in different adaptation strategies of microorganisms [4]. It was found that 12 years of N deposition in broad-leaved forests in the northern United States resulted in a decrease in soil microbial biomass and a 10% decrease in F:B [51]. In our study, the Chao1 index showed that bacteria were more sensitive to SND than fungi, which was related to their different life strategies (r-K strategy) [27]. Fierer et al. [57] found that F:B increased with increasing soil C:N in a meta-analysis of the global soil microbial community pattern, which is similar to our research results. After SND, F:B decreased due to the decline in C:N, mainly because K-strategy fungi had higher biomass C:N than bacteria [3]. Li et al. [48] suggested that N deposition can increase the soil MBC content, thus increasing MBC:MBN and reducing competition between plants and microorganisms [58]. Our results showed some differences from those conclusions, as they indicated that MBC decreased while MBC:MBN changed little. The reasons for this may be as follows: first, the active soil C pool of the moso bamboo forest was small and the degradation was very fast in the case of SND, which led to the loss of active organic C [5]. Therefore, there was not enough active organic matter to support high metabolic rates. Second, SND alleviated the rhizosphere microbial driving demand for nutrients, thus reducing the C input flux of plant root exudates; i.e., plants adopted the physiological strategy of a low N yield and low C input under the condition of N enrichment [59]. Consequently, sufficient active C could not be provided, which directly led to the decline in the microbial biomass. Third, due to the limitation of other nutrients, SND did not change the C ratio of microbial cells (no difference in MBC:MBN) and did not reduce the C ratio of microbial metabolic consumption [15]. In the context of wetland protection, bamboo forests require management that includes the application of an organic P fertilizer to help alleviate P limitation.
Our results showed that MBP increased and caused a significant decrease in MBC:MBP and MBN:MBP, which is similar to previous research results [21,22,23]. Deng’s global meta-analysis [49] showed that N addition did not change microbial P but did enhance phosphatase activity. This different conclusion may, in part, be a matter of scale. The generalities derived from global meta-analyses tend not to detect stand-scale responses. Our results confirmed that N can release other nutrients (such as P) by producing N-rich enzymes, such as phosphatase, by shifting from a critical state of N limitation to a P-released state after sufficient N is provided. Therefore, short-term SND is distinct from the long-term ecosystem succession process of N deposition, in which MBN:MBP will increase, while short-term SND will result in a short period of P release followed by a P-limitation period. Furthermore, we found that MBC:MBP had a gradient correlation with the fungal community compositions, while MBN:MBP had a gradient correlation with bacteria, indicating that the P utilization efficiency per unit of C or N increased and SND raised the demand of soil microorganisms for P [60], implying that different microbial groups have their own unique adaptive strategies [11].

5. Conclusions

In summary, 2 years of SND reduced ammonia N and accumulated nitrate N, resulting in soil acidification, but the pH value showed no correlation with the microbial community compositional response. SND did not alter the alpha diversity of fungi but changed the bacterial Chao1 index, suggesting that bacteria were more sensitive than fungi. SND changed the F:B and beta diversity of both fungi and bacteria, suggesting that the microbial community composition was modified. The soil of the moso bamboo forest was in a state of N limitation and P cycling acceleration. During the short-term stimulation process of N and before P limitation, MBC:MBP and MBN:MBP experienced a short period of decline, indicating that the P utilization efficiency was enhanced. Under SND conditions, there may be heightened risk of bacterial breeding and N and P limitations over the long term in natural growth of the wetland moso bamboo forest, which will further affect the sustainable and healthy development of those wetland ecosystems. It is suggested that the necessary management interventions should be applied, such as the application of organic fertilizer.

Author Contributions

Conceptualization, W.L. and Y.L. (Yi Lou); methodology, W.L. and H.S.; software, W.L.; validation, Y.L. (Yaoyao Liu) and R.Z.; formal analysis, H.S.; investigation, H.S., Y.L. (Yi Lou), Y.Q. and R.Z.; resources, Y.L. (Yi Lou); writing—original draft preparation, W.L., H.S. and Y.L. (Yi Lou); writing—review and editing, D.E.; supervision, D.E. and Y.L. (Yi Lou); All authors have read and agreed to the published version of the manuscript.

Funding

This work was supported by the Central Nonprofit Research Institution of CAF (CAFYBB2017MA024).

Conflicts of Interest

All the authors declare that they have no conflict of interest.

References

  1. Houlton, B.Z.; Wang, Y.-P.; Vitousek, P.; Field, C.B. A unifying framework for dinitrogen fixation in the terrestrial biosphere. Nature 2008, 454, 327–330. [Google Scholar] [CrossRef] [PubMed]
  2. Galloway, J.; Townsend, A.R.; Erisman, J.W.; Bekunda, M.; Cai, Z.; Freney, J.; Martinelli, L.; Seitzinger, S.P.; Sutton, M.A. Transformation of the Nitrogen Cycle: Recent Trends, Questions, and Potential Solutions. Science 2008, 320, 889–892. [Google Scholar] [CrossRef] [Green Version]
  3. Fanin, N.; Fromin, N.; Buatois, B.; Hättenschwiler, S. An experimental test of the hypothesis of non-homeostatic consumer stoichiometry in a plant litter-microbe system. Ecol. Lett. 2013, 16, 764–772. [Google Scholar] [CrossRef] [PubMed]
  4. Mooshammer, M.; Wanek, W.; Zechmeister-Boltenstern, S.; Richter, A. Stoichiometric imbalances between terrestrial decomposer communities and their resources: Mechanisms and implications of microbial adaptations to their resources. Front. Microbiol. 2014, 5, 22. [Google Scholar] [CrossRef] [PubMed] [Green Version]
  5. Ramirez, K.S.; Craine, J.M.; Fierer, N. Consistent effects of nitrogen amendments on soil microbial communities and processes across biomes. Glob. Chang. Boil. 2012, 18, 1918–1927. [Google Scholar] [CrossRef]
  6. Yuan, H.; Liu, S.; Razavi, B.S.; Zhran, M.; Wang, J.; Zhu, Z.; Wu, J.; Ge, T. Differentiated response of plant and microbial C: N: P stoichiometries to phosphorus application in phosphorus-limited paddy soil. Eur. J. Soil Boil. 2019, 95, 103122. [Google Scholar] [CrossRef]
  7. Zhang, J.; Elser, J.J. Carbon:Nitrogen:Phosphorus Stoichiometry in Fungi: A Meta-Analysis. Front. Microbiol. 2017, 8. [Google Scholar] [CrossRef] [PubMed]
  8. Schimel, J.P.; Bennett, J. Nitrogen mineralization: Challenges of a changing paradigm. Ecology 2004, 85, 591–602. [Google Scholar] [CrossRef]
  9. Frost, P.C.; Stelzer, R.S.; Lamberti, G.A.; Elser, J. ROSEMARY MACKAY FUND ARTICLE: Ecological stoichiometry of trophic interactions in the benthos: Understanding the role of C:N:P ratios in lentic and lotic habitats. J. North Am. Benthol. Soc. 2002, 21, 515–528. [Google Scholar] [CrossRef] [Green Version]
  10. Elser, J.; Acharya, K.; Kyle, M.; Cotner, J.B.; Makino, W.; Markow, T.; Hobbie, S.E.; Fagan, W.; Schade, J.; Hood, J.; et al. Growth rate-stoichiometry couplings in diverse biota. Ecol. Lett. 2003, 6, 936–943. [Google Scholar] [CrossRef] [Green Version]
  11. Cui, Y.; Zhang, Y.; Duan, C.; Wang, X.; Zhang, X.; Ju, W.; Chen, H.; Yue, S.; Wang, Y.; Li, S.; et al. Ecoenzymatic stoichiometry reveals microbial phosphorus limitation decreases the nitrogen cycling potential of soils in semi-arid agricultural ecosystems. Soil Tillage Res. 2020, 197, 104463. [Google Scholar] [CrossRef]
  12. Cleveland, C.C.; Liptzin, D. C:N:P stoichiometry in soil: Is there a ‘Redfield ratio’ for themicrobial biomass? Biogeochemistry 2007, 85, 235–252. [Google Scholar] [CrossRef]
  13. Chen, X.; Daniell, T.; Neilson, R.; O’Flaherty, V.; Griffiths, B. Microbial and microfaunal communities in phosphorus limited, grazed grassland change composition but maintain homeostatic nutrient stoichiometry. Soil Boil. Biochem. 2014, 75, 94–101. [Google Scholar] [CrossRef]
  14. Ren, C.; Zhao, F.; Kang, D.; Yang, G.; Han, X.; Tong, X.; Feng, Y.; Ren, G. Linkages of C:N:P stoichiometry and bacterial community in soil following afforestation of former farmland. For. Ecol. Manag. 2016, 376, 59–66. [Google Scholar] [CrossRef]
  15. González-Chávez, M.D.C.A.; Aitkenhead-Peterson, J.A.; Gentry, T.J.; Zuberer, D.; Hons, F.; Loeppert, R. Soil microbial community, C, N, and P responses to long-term tillage and crop rotation. Soil Tillage Res. 2010, 106, 285–293. [Google Scholar] [CrossRef]
  16. Peng, Y.; Thomas, S. Influence of Non-nitrogenous Soil Amendments on Soil CO2 Efflux and Fine Root Production in an N-Saturated Northern Hardwood Forest. Ecosystem 2010, 13, 1145–1156. [Google Scholar] [CrossRef]
  17. Crowther, T.W.; Thomas, S.M.; Maynard, D.S.; Baldrián, P.; Covey, K.; Frey, S.D.; Van Diepen, L.T.A.; Bradford, M.A. Biotic interactions mediate soil microbial feedbacks to climate change. Proc. Natl. Acad. Sci. USA 2015, 112, 7033–7038. [Google Scholar] [CrossRef] [Green Version]
  18. Johnson, D.; Leake, J.R.; Lee, J.; Campbell, C. Changes in soil microbial biomass and microbial activities in response to 7 years simulated pollutant nitrogen deposition on a heathland and two grasslands. Environ. Pollut. 1998, 103, 239–250. [Google Scholar] [CrossRef]
  19. Rinnan, R.; Michelsen, A.; Bååth, E.; Jonasson, S. Fifteen years of climate change manipulations alter soil microbial communities in a subarctic heath ecosystem. Glob. Chang. Boil. 2007, 13, 28–39. [Google Scholar] [CrossRef]
  20. Compton, J.E.; Watrud, L.S.; Porteous, L.A.; DeGrood, S. Response of soil microbial biomass and community composition to chronic nitrogen additions at Harvard forest. For. Ecol. Manag. 2004, 196, 143–158. [Google Scholar] [CrossRef]
  21. Hart, S.C.; Perry, D.A. Transferring soils from high- to low-elevation forests increases nitrogen cycling rates: Climate change implications. Glob. Chang. Boil. 1999, 5, 23–32. [Google Scholar] [CrossRef] [Green Version]
  22. Heuck, C.; Weig, A.R.; Spohn, M. Soil microbial biomass C:N:P stoichiometry and microbial use of organic phosphorus. Soil Boil. Biochem. 2015, 85, 119–129. [Google Scholar] [CrossRef]
  23. Sinsabaugh, R.L.; Hill, B.H.; Shah, J.J.F. Ecoenzymatic stoichiometry of microbial organic nutrient acquisition in soil and sediment. Nature 2009, 462, 795–798. [Google Scholar] [CrossRef] [PubMed]
  24. Peñuelas, J.; Poulter, B.; Sardans, J.; Ciais, P.; Van Der Velde, M.; Bopp, L.; Boucher, O.; Godderis, Y.; Hinsinger, P.; Llusià, J.; et al. Human-induced nitrogen–phosphorus imbalances alter natural and managed ecosystems across the globe. Nat. Commun. 2013, 4, 2934. [Google Scholar] [CrossRef] [PubMed] [Green Version]
  25. Yuan, Z.Y.; Chen, H.Y.H. Decoupling of nitrogen and phosphorus in terrestrial plants associated with global changes. Nat. Clim. Chang. 2015, 5, 465–469. [Google Scholar] [CrossRef]
  26. Hemkemeyer, M.; Christensen, B.T.; Martens, R.; Tebbe, C.C. Soil particle size fractions harbour distinct microbial communities and differ in potential for microbial mineralisation of organic pollutants. Soil Boil. Biochem. 2015, 90, 255–265. [Google Scholar] [CrossRef]
  27. Sessitsch, A.; Weilharter, A.; Gerzabek, M.H.; Kirchmann, H.; Kandeler, E. Microbial Population Structures in Soil Particle Size Fractions of a Long-Term Fertilizer Field Experiment. Appl. Environ. Microbiol. 2001, 67, 4215–4224. [Google Scholar] [CrossRef] [Green Version]
  28. Neumann, D.; Heuer, A.; Hemkemeyer, M.; Martens, R.; Tebbe, C.C. Response of microbial communities to long-term fertilization depends on their microhabitat. FEMS Microbiol. Ecol. 2013, 86, 71–84. [Google Scholar] [CrossRef] [Green Version]
  29. Cui, J.; Zhou, J.; Peng, Y.; He, Y.; Yang, H.; Mao, J.; Zhang, M.; Wang, Y.; Wang, S. Atmospheric wet deposition of nitrogen and sulfur in the agroecosystem in developing and developed areas of Southeastern China. Atmos. Environ. 2014, 89, 102–108. [Google Scholar] [CrossRef]
  30. Li, W.C.; Sheng, H.Y.; Jiang, Y.P.; Wen, X. Soil CO2 flux and its influence factors of different bamboo plantations in the dike-pond ecosystem. Sci. Silvae Sin. 2018, 54, 13–22. [Google Scholar]
  31. Fang, Y.; Yoh, M.; Koba, K.; Zhu, W.; Takebayashi, Y.; Xiao, Y.; Lei, C.; Mo, J.; Zhang, W.; Lu, X. Nitrogen deposition and forest nitrogen cycling along an urban-rural transect in southern China. Glob. Chang. Boil. 2011, 17, 872–885. [Google Scholar] [CrossRef]
  32. Li, W.; Sheng, H.; Ekawati, D.; Jiang, Y.; Yang, H. Variations in the Compositions of Soil Bacterial and Fungal Communities Due to Microhabitat Effects Induced by Simulated Nitrogen Deposition of a Bamboo Forest in Wetland. Forest 2019, 10, 1098. [Google Scholar] [CrossRef] [Green Version]
  33. Wu, J.; Joergensen, R.G.; Pommerening, B.; Chaussod, R.; Brookes, P.C. Measurement of soil microbial biomass C by fumigation-extraction—An automated procedure. Soil Boil. Biochem. 1990, 22, 1167–1169. [Google Scholar] [CrossRef]
  34. Brookes, P.; Powlson, D.; Jenkinson, D. Phosphorus in the soil microbial biomass. Soil Boil. Biochem. 1984, 16, 169–175. [Google Scholar] [CrossRef]
  35. Klindworth, A.; Pruesse, E.; Schweer, T.; Peplies, J.; Quast, C.; Horn, M.; Glöckner, F.O. Evaluation of general 16S ribosomal RNA gene PCR primers for classical and next-generation sequencing-based diversity studies. Nucleic Acids Res. 2012, 41, e1. [Google Scholar] [CrossRef] [PubMed]
  36. Tedersoo, L.; Lindahl, B. Fungal identification biases in microbiome projects. Environ. Microbiol. Rep. 2016, 8, 774–779. [Google Scholar] [CrossRef] [PubMed]
  37. Tang, Q.-Y.; Zhang, C.-X. Data Processing System (DPS) software with experimental design, statistical analysis and data mining developed for use in entomological research. Insect Sci. 2012, 20, 254–260. [Google Scholar] [CrossRef] [PubMed]
  38. Oksanen, J.; Blanchet, F.G.; Kindt, R.; Legendre, P.; Minchin, P.R.; O’Hara, R. Vagan: Community Ecology Package. R Package Version 22-1. 2015. Available online: http://CRAN.R-project.org/package=vegan (accessed on 12 November 2019).
  39. Wickham, H. Ggplots2: Elegant Graphics for Data Analysis; Springer: New York, NY, USA, 2016. [Google Scholar]
  40. Segata, N.; Izard, J.; Waldron, L.; Gevers, D.; Miropolsky, L.; Garrett, W.S.; Huttenhower, C. Metagenomic biomarker discovery and explanation. Genome Boil. 2011, 12, R60. [Google Scholar] [CrossRef] [Green Version]
  41. Field, A.; Miles, J.; Field, Z. Discovering Statistics Using R; Sage Publications: London, UK, 2012. [Google Scholar]
  42. Wei, C.; Yu, Q.; Bai, E.; Lü, X.-T.; Li, Q.; Xia, J.; Kardol, P.; Liang, W.; Wang, Z.; Han, X. Nitrogen deposition weakens plant-microbe interactions in grassland ecosystems. Glob. Chang. Boil. 2013, 19, 3688–3697. [Google Scholar] [CrossRef]
  43. Aber, J.D.; Magill, A.H. Chronic nitrogen additions at the Harvard Forest (USA): The first 15 years of a nitrogen saturation experiment. For. Ecol. Manag. 2004, 196, 1–5. [Google Scholar] [CrossRef]
  44. Sirulnik, A.G.; Allen, E.; Meixner, T.; Fenn, M.E.; Allen, M.F. Changes in N cycling and microbial N with elevated N in exotic annual grasslands of southern California. Appl. Soil Ecol. 2007, 36, 1–9. [Google Scholar] [CrossRef]
  45. Yang, K.; Zhu, J.; Gu, J.; Yu, L.; Wang, Z. Changes in soil phosphorus fractions after 9 years of continuous nitrogen addition in a Larix gmelinii plantation. Ann. For. Sci. 2014, 72, 435–442. [Google Scholar] [CrossRef]
  46. Hall, S.J.; Matson, P.A. Nutrient status of tropical rain forests influences soil n dynamics after n additions. Ecol. Monogr. 2003, 73, 107–129. [Google Scholar] [CrossRef]
  47. Liu, X.-R.; Ren, J.-Q.; Li, S.-G.; Zhang, Q.-W. Effects of Simulated Nitrogen Deposition on Soil Net Nitrogen Mineralization in the Meadow Steppe of Inner Mongolia, China. PLoS ONE 2015, 10, 0134039. [Google Scholar] [CrossRef] [PubMed]
  48. Li, W.; Sheng, H.; Liu, Y.; Chen, W. Responses of soil bacterial compositions to concentrations of nitrogen forms in the process of Moso bamboo invasion. Ecol. Res. 2019, 34, 743–752. [Google Scholar] [CrossRef]
  49. Deng, Q.; Hui, D.F.; Dennis, S.; Reddy, K.C. Responses of terrestrial ecosystem phosphorus cycling tonitrogen addition: A meta-analysis. Glob. Ecol. Biogeogr. 2017, 26, 713–728. [Google Scholar] [CrossRef]
  50. Ma, B.B.; Zhou, X.L.; Zhang, Q.; Qin, M.S.; Hu, L.G.; Yang, K.N.; Xie, Z.; Ma, W.B.; Chen, B.B.; Feng, H.Y.; et al. How do soil micro-organisms respond to N, P and NPadditions? Application of the ecological framework of (co-) limitation by multiple resources. J. Ecol. 2019, 107, 2329–2345. [Google Scholar] [CrossRef]
  51. Van Diepen, L.; Lilleskov, E.; Pregitzer, K.; Miller, R. Simulated nitrogen deposition causes a decline of intra- and extraradieal abundance of arbuseular mycorhizal fungi and changes in microbial community structure in northem hardwood forests. Ecosystems 2010, 13, 683–695. [Google Scholar] [CrossRef]
  52. Wang, J.Y.; Zhang, X.Y.; Wen, X.F.; Wang, S.Q.; Wang, H.M. The effect of nitrogen deposition on forest soil organic matter and litter deeompostion and the microbial mechanism. Acta Ecol. Sin. 2013, 33, 1337–1346. [Google Scholar] [CrossRef]
  53. Gundersen, P.; Callesen, I.; De Vries, W. Nitrate leaching in forest ecosystems is related to forest floor C/N ratios. Nitrogen, the Confer-N-s 1998, 102, 403–407. [Google Scholar]
  54. Moorhead, D.L.; Sinsabaugh, R.L. A theoretical model of litter decay and microbial interaction. Ecol. Monogr. 2006, 76, 151–174. [Google Scholar] [CrossRef]
  55. Walbridge, M.; Richardson, C.; Swank, W. Vertical distribution of biological and geochemical phosphorus subcycles in two southern Appalachian forest soils. Biogeochemistry 1991, 13, 61–85. [Google Scholar] [CrossRef]
  56. Che, R.; Qin, J.; Tahmasbian, I.; Wang, F.; Zhou, S.; Xu, Z.; Cui, X. Litter amendment rather than phosphorus can dramatically change inorganic nitrogen pools in a degraded grassland soil by affecting nitrogen-cycling microbes. Soil Boil. Biochem. 2018, 120, 145–152. [Google Scholar] [CrossRef]
  57. Fierer, N.; Strickland, M.S.; Liptzin, D.; Bradford, M.A.; Cleveland, C.C. Global patterns in belowground communities. Ecol. Lett. 2009, 12, 1238–1249. [Google Scholar] [CrossRef] [PubMed]
  58. Li, H.; Yang, S.; Xu, Z.; Yan, Q.; Li, X.; Van Nostrand, J.D.; He, Z.; Yao, F.; Han, X.; Zhou, J.; et al. Responses of soil microbial functional genes to global changes are indirectly influenced by aboveground plant biomass variation. Soil Boil. Biochem. 2017, 104, 18–29. [Google Scholar] [CrossRef] [Green Version]
  59. Phillips, R.P.; Finzi, A.; Bernhardt, E.S. Enhanced root exudation induces microbial feedbacks to N cycling in a pine forest under long-term CO2 fumigation. Ecol. Lett. 2010, 14, 187–194. [Google Scholar] [CrossRef]
  60. Wassen, M.J.; Venterink, H.O.; Lapshina, E.; Tanneberger, F. Endangered plants persist under phosphorus limitation. Nature 2005, 437, 547–550. [Google Scholar] [CrossRef]
Figure 1. (AC) Box plot of multiple comparative analysis of soil stoichiometries, i.e., C/N, C/P and N/P, using the Tukey method among different SND levels (CK, N30, N60 and N90). (DF) Box plot of multiple comparative analysis of microbial stoichiometries, i.e., MBC/MBN, MBC/MBP and MBN/MBP, among different SND levels (CK, N30, N60 and N90). Different letters above the box indicate that the difference is significant among the sampling plots. Light green, light blue, blue and red boxes represent the soil samples collected from CK, N30, N60 and N90, respectively. The circles represent the calculated stoichiometric values.
Forests 11 00428 g001
Figure 2. Principal coordinates analysis (PCoA) based on the weighted calculated method and Bray-Curtis distances showing the changes in soil bacterial (A) and fungal (B) compositions (based on operational taxonomic unit (out) datasets of genus) in the CK, N30, N60 and N90 levels. Pairwise comparisons for factor sort of soil bacterial (C) and fungal (D) compositions showing the significance of difference between each pair of treatments based on the Benjamini–Hochberg adjusted p-value method for multiple comparisons. The transparent polygon represents the distribution range of sampling plots. Green, yellow, purple and red circles represent the soil samples collected from CK, N30, N60 and N90 plots, respectively, using the data microbial profile at the genus level. To identify the results of PCoA, the tables underneath each PCoA report pairwise comparisons for factor sorted among CK, N30, N60 and N90 levels. PCoA indicated that the changes in the soil bacterial and fungal compositions and structure may have been associated with the changes in simulated nitrogen deposition (SND) in the moso bamboo forest.
Forests 11 00428 g002
Figure 3. Discriminant taxa significantly retrieved by LEfSe analysis for bacterial and fungal communities at different SND levels. The cladogram shows the taxonomic representation of statistically consistent differences among CK, N30, N60 and N90 treatment soil in (A) ‘bacteria’ and (B) ‘fungi’ at an LDA score ≥ 4 with the Kruskal–Wallis rank sum test. The circles radiating from inside to outside represent different taxonomic levels, i.e., kingdom, phylum, class, order, family, genus and species. Each small circle at a different taxonomic level represents a taxon. The diameter of the small circle is proportional to the relative abundance of the OTU. The coloring of the non-significant species is yellow, and the different taxa are colored with groups, representing the microbial groups that play an important role in the group. The names of the taxa are represented in the legend on the right.Below each cladogram, discriminant clades among CK, N30, N60 and N90 treatment soil are reported at an LDA score ≥2 for bacteria (C) and fungi (D). The tables underneath each cladogram report phyla/classes that statistically significantly discriminate CK, N30, N60 and N90 treatment soils.
Forests 11 00428 g003
Figure 4. Contributions of soil properties to the dissimilarities in microbial communities and differences in the relative abundances of microbial phyla based on correlation and the best multiple regression model. The correlation of the values with the differences in soil properties between bacteria and fungi for each pairwise set of soil samples was examined, and the major predictors were identified. Circle size represents the variable importance. The proportion of explained variability calculated via multiple regression modeling and variance decomposition analysis. Colors represent the Spearman correlation.
Forests 11 00428 g004
Figure 5. Biplot of redundancy analysis (RDA) of bacterial ((A), based on OTU datasets of 631 genera) community composition with soil properties selected (11 soil properties selected) based on a variation inflation factor test (VIF) determined in soil samples collected from 36 sample plots in four SND levels, i.e., CK (sample tags from 1 to 9), N30 (sample tags from 10 to 18), N60 (sample tags from 19 to 27) and N90 (sample tags from 28 to 36). RDA of fungal community composition ((B), based on OTU datasets of 24 genera) with soil properties selected based on correlation and the best multiple regression model. According to the different groups of soil properties, variance partitioning analysis (VPA, (C) for bacteria and (D) for fungi) with partial RDA was conducted to identify the proportions of variance explanation. The annotations of abbreviations in (A) and (B) are in accordance with those in 2.3, Measurement of soil properties. The annotations of abbreviations in (C) are as follows: N: Nitrogen group of soil properties including TN, WSON, NH4+-N, NO3-N and MBN; P: Phosphorus group of soil properties including TP, AP and MBP; C: Carbon group of soil properties including SOC, WSOC and MBC; O: Other soil properties including SWC and pH value; S: Soil stoichiometric properties including C:N, C:P and N:P; M: Microbial stoichiometric properties including MBC:MBN, MBC:MBP and MBN:MBP; OX: The other groups of soil properties excepting the X group, and X represents N, P, C, O, S or M; X|OX: Variations that can be explained only by the X group but not the others; O∩C∩N∩P∩S∩M: Intersection variations that can be explained by all of the properties. Unexplained: Variations that cannot be explained. The annotations of abbreviations in (D) are as follows: NF: Nitrogen group of soil properties including WSON, NO3-N and MBN; OF: Other soil properties including SWC; MF: Microbial stoichiometric properties including MBC:MBP and MBN:MBP; NF|(OF+MF): Variations that can be explained by the nitrogen group of soil properties but not the others; OF|(NF+MF): Variations that can be explained by SWC but not the others; MF|(OF+NF): Variations that can be explained by microbial stoichiometric properties but not SWC or the nitrogen group; OF∩NF∩MF: Intersection variations that can be explained by all six properties.
Forests 11 00428 g005
Table 1. Soil biochemical properties of sample plots in the moso bamboo forest under different SND levels. Values represent the mean ± SD (n = 9).
SWC (wt.%)pHSOC (g·kg−1)TN (g·kg−1)TP (mg·kg−1)AP (mg·kg−1)WSOC (mg·kg−1)WSON (mg·kg−1)MBC (mg·kg−1)MBN (mg·kg−1)MBP (mg·kg−1)NH4+−N (mg·kg−1)NO3−N (mg·kg−1)
CK15.3 ± 2.3b5.2 ± 0.3a44.5 ± 4.6a1.9 ± 0.2a51.3 ± 6.5a5.0 ± 1.9a26.3 ± 7.0a2.9 ± 0.5b432.8 ± 194.9a87.8 ± 24.7a5.4 ± 2.2b20.3 ± 6.0a4.5 ± 0.7b
N3018.8 ± 2.6ab5.2 ± 0.2a40.2 ± 3.0ab2.0 ± 3.5a57.8 ± 10.2a5.6 ± 2.4a15.9 ± 3.4bc5.1 ± 1.6ab354.2 ± 132.7a72.5 ± 15.1a10.9 ± 4.8b17.6 ± 3.1ab5.0 ± 2.0b
N6017.1 ± 3.2b4.8 ± 0.1b42.4 ± 5.8ab2.5 ± 0.7a50.2 ± 10.3a4.3 ± 2.4a19.9 ± 4.5b5.3 ± 2.5ab324.0 ± 163.6a69.6 ± 16.4a12.2 ± 5.8b16.7 ± 3.9ab6.6 ± 2.45ab
N9021.8 ± 4.3a4.8 ± 0.2b39.1 ± 2.1b2.4 ± 0.4a63.8 ± 23.6a5.0 ± 2.2a11.1 ± 2.0c7.3 ± 2.6a377.1 ± 153.1a79.1 ± 34.6a34.4 ± 24.7a14.4 ± 1.4b8.3 ± 3.1a
Values with different letters within a column indicate that the difference was significant among the plots.
Table 2. Alpha diversity index of soil bacteria and fungi in the moso bamboo forest under different nitrogen addition levels. Values represent means ± SD (n = 9).
KingdomIndexCKN30N60N90
BacteriaChao12033.5 ± 292.7b3146.7 ± 147.6a2512.0 ± 607.5ab2463.7 ± 399.5ab
Observed species (OTUs)1217 ± 148b1561 ± 332a1427 ± 258ab1473 ± 218ab
Shannon8.36 ± 0.24a8.82 ± 0.50a8.69 ± 0.47a8.79 ± 0.38a
Simpson0.9911 ± 0.0017a0.9931 ± 0.0025a0.9927 ± 0.0026a0.9936 ± 0.0021a
FungiChao1171.2 ± 21.5a166.9 ± 21.4a153.8 ± 18.9a163.6 ± 20.9a
Observed species (OTUs)136 ± 16a133 ± 13a131 ± 13a127 ± 16a
Shannon5.31 ± 0.52a5.21 ± 0.43a5.29 ± 0.35a4.87 ± 0.78a
Simpson0.9343 ± 0.0421a0.9263 ± 0.0496a0.9382 ± 0.0282a0.8985 ± 0.09920a
F/B0.1133 ± 0.0205a0.0887 ± 0.0183b0.0947 ± 0.0199ab0.0882 ± 0.0175b
Values with different letters within a row indicate that the difference is significant among the plots.

