Article

Analyses of Genetic Diversity, Differentiation and Geographic Origin of Natural Provenances and Land Races of Casuarina equisetifolia Based on EST-SSR Markers

1
Research Institute of Tropical Forestry, Chinese Academy of Forestry, Longdong, Guangzhou 510520, China
2
Experimental Centre of Forestry in North China, Chinese Academy of Forestry, Beijing 102300, China
3
CSIRO Australian Tree Seed Centre, GPO Box 1600, Canberra, ACT 2601, Australia
*
Authors to whom correspondence should be addressed.
Co-first author.
Forests 2020, 11(4), 432; https://doi.org/10.3390/f11040432
Submission received: 13 February 2020 / Revised: 7 April 2020 / Accepted: 8 April 2020 / Published: 10 April 2020
(This article belongs to the Section Forest Ecology and Management)

Abstract

:
Research Highlights: High variation of genetic diversity and differentiation among 27 seed sources within 14 natural provenances and 13 land race samples of Casuarina equisetifolia were found. High proportions of monoecious individuals may be present in some populations, as indicated by severe heterozytote deficiency and inbreeding found in many provenances and land races. The most probable origins of the land races were inferred according to the values of pairwise provenance differentiation and Nei’s genetic distances. Targeted introductions and testing of unrelated new accessions of C. equisetifolia from the Pacific and Philippines was proposed to identify Ralstonia-resistant genotypes. Background and Objectives: Casuarina equisetifolia was introduced to China a hundred years ago and has become a critically important tree species in coastal protection since the 1950s. Despite its importance, patterns of genetic variation, genetic relationships among natural provenances and probable origins of the land races remain unresolved. This has become a concern in China where Ralstonia solanacearum bacterial wilt has devastated plantations that are known to be from a narrow genetic base that urgently needs to be broadened. Materials and Methods: Fourteen natural provenances from Australia, Pacific islands and Southeast Asia, and 13 land race samples from parts of Asia and Africa outside the natural range were genotyped using 13 SSR (Simple Sequence Repeats) markers to characterize their allelic variation and genetic relationship. Results: Significant genetic diversity and differentiation among 27 seed sources within 14 provenances and 13 land race samples of C. equisetifolia was indicated. Significant heterozygote deficiency and inbreeding was indicated for a number of provenances, perhaps indicating a high proportion of monoecious parents in these populations. The most probable origins of the land races of the introduced countries were suggested according to the values of pairwise provenance differentiation (FST) and Nei’s genetic distances. Conclusions: We found significant genetic diversity and genetic differentiation among seed sources of C. equisetifolia. While individual land races do not appear to lack diversity, we were able to infer the origins of some, allowing targeted introductions of unrelated material to be made. In the case of the Chinese land race, targeting and testing new accessions from the Pacific and the Philippines may be a good strategy to identify Ralstonia-resistant genotypes.

1. Introduction

Casuarina equisetifolia ssp. equisetifolia (hereafter referred to as C. equisetifolia) belongs to the Casuarinaceae family and has a wide natural occurrence, with the most southerly part of the range in northern Australia, throughout southern Thailand, Malaysia, Indonesia, the Philippines, Melanesia and Polynesia (Figure 1) [1]. C. equisetifolia is a nitrogen-fixing tree of considerable social, economic and environmental importance in tropical and subtropical regions of the world. Over two million hectares of Casuarina plantation, most of which are C. equisetifolia, have been planted for wood production, coastal shelterbelts, vegetation rehabilitation and for ornamental purposes around the world [2]. It is an important plantation species in India where it has undergone genetic improvement, and an important and a significant tree in the Pacific, where planting is thought to have commenced around 2700 years before present time [3].
In southern China, C. equisetifolia plays a critically important role in coastal protection. An estimated 300,000 hectares of Casuarina plantations, predominantly C. equisetifolia, have been established over the past 70 years along coastlines of five provinces (Hainan, Guangxi, Guangdong, Fujian and Zhijiang) [4]. The plantations immediately adjacent to the coast are typically not harvested but left intact more-or-less permanently for environmental amelioration and protection functions. Inland of the coastal protection zones, which are typically about 200 m wide, a second belt, that is periodically harvested, is established in some regions. The two contiguous planting belts are typically established using the same planting stock at any given location.
Almost 90% of the plantations established over the past 30 years are clonal [5]. However, the genetic base of these plantations is very narrow, with only 22 clones identified from plantations of coastal Casuarina shelterbelts of Guangdong, Hainan and Fujian provinces, many of which were themselves closely related [6]. This is of particular concern given that the shelterbelt plantings are required to remain resilient to both biotic and abiotic stressors. In recent years, disease, especially bacterial wilt caused by Ralstonia solanacearum [7], and insect pests [8] have been a serious problem. They have caused extensive mortality, resulting in declining productivity in those plantations that are harvested and reduced protection from wind and erosion in littoral shelterbelts. The effects of climate change, resulting in stronger winds, together with the need to plant on degraded coastal and inland sites with saline, alkaline, waterlogged and drought-susceptible soils also require a highly resilient breed of tree with sufficient diversity to provide adaptation to these stressors. Clearly, the widely-used set of 22 clones is less than ideal in this regard. There is now a strong imperative to identify new clones or seedling-based planting materials for southern China.
As the coastal plantations are mostly not harvested, high resilience to strong winds, resistance to biotic and abiotic pests and ease of propagation are important selection traits. Reasonable growth rates are also desirable, though genetic improvement of this trait is not necessarily required. Based on the current situation of coastal Casuarina shelterbelts in China mentioned above, a wide range of seed sources of C. equisetifolia from the species’ natural distribution and land races were obtained from the Australian Tree Seed Centre for establishment of a gene bank and genetic testing, aiming at broadening and enriching the genetic base of C. equisetifolia in southern China [9]. However, the genetic diversity of these seed sources, and the genetic relationship of the seed sources derived from different regions, especially those between native provenances and land races, remain unclear.
Genetic diversity provides the basis for adaptation and resistance to abiotic and biotic stresses and changing environment, and is therefore crucial for the long-term survival and development of forests because high genetic diversity allows natural selection to result in adaptability [10,11,12]. Meanwhile, high genetic diversity in domestication and breeding populations provides opportunity for breeders to develop new and improved breeds with desirable characteristics. In artificial establishment of new forests, maintaining high genetic diversity sometimes results in reduction of productivity, but lack of genetic diversity can also lead to total failure of plantations. For example, thousands of hectares of clonal plantations of Eucalyptus species were killed by an epidemic of Cryptosporiopsis eucalypti leaf blight fungus in one year in Thailand [13], and pink disease caused by Corticium salmonicolor fungus occasionally infests stands of Acacia mangium and acacia hybrid, killing up to 70% of trees in stands in India [14]. In southern China, bacterial wilt caused by Ralstonia solanacearum damages large-scale clonal plantations of C. equisetifolia following typhoons (Y.Z., personal observation) that are becoming more intense as a result of climate change-induced ocean surface warming [15]. Indeed, abiotic stressors resulting from climate change (e.g., changes to annual temperature regimes, amount and seasonality of rainfall) are likely to act synergistically with pathogens under some circumstances, increasing the potential for widespread damage to agricultural crops [16] and plantations [17] by pathogens that have not previously been problematic. Increasing genetic diversity to maximize the likelihood of disease resistance, even if a penalty in terms of growth results, is a major objective of the Casuarina clonal selection program for southern China.
Genetic diversity studies of C. equisetifolia have been documented in some countries and regions. Morphological, allozyme and diverse dominant and codominant molecular marker techniques have been used to analyze and assess geographic variation and genetic diversity of C. equisetifolia [7,18,19,20,21]. However, these studies either used less-precise marker techniques or a limited sample of provenances; in particular, some land races which have been naturalized for many decades were not included.
In this study, we employed Simple Sequence Repeats (SSR) markers. These markers are proven to be powerful for elucidating phylogenetic relationships and estimating genetic diversity. SSR markers are codominant, highly polymorphic, selectively neutral, uniformly distributed in plant genomes, and are characterized by hypervariability, high abundance and high reproducibility. This makes them generally preferable to other molecular markers such as RAPD (Random amplified polymorphic DNA), AFLP (Amplified Fragment Length Polymorphism), ISSR (Inter-simple Sequence Repeat) and RFLP (Restriction Fragment Length Polymorphism) in population genetic applications such as ours.
In this study, genetic parameters of 27 seed sources (14 natural provenances and 13 land races) of C. equisetifolia were determined using SSR markers, aiming to achieve the following objectives: (1) to elucidate the genetic diversity and variation among natural provenances and land races across their distribution ranges around the world, (2) to explore the genetic structure and relationship of the 27 seed sources, and (3) to attempt to infer the probable origins of the land races.

2. Materials and Methods

2.1. Seed Sources

Twenty-seven seed sources (14 provenances and 13 land races) of C. equisetifolia from throughout its natural range and land races from 18 countries were used in this study. These seed sources can be divided into four broad regions, namely, Oceania natural (seven provenances), Asia natural (seven provenances), Asia introduced (eight seed sources) and Africa introduced (five seed sources). The first two groups of seed sources (seeds) were collected from natural forests in their natural range. The latter two groups were considered likely to be land races (i.e., exhibiting some genetic differentiation from their ancestral populations), having been cultivated for many generations. The female parents of progenies (seeds) of each seed source varied from four to ten depending on the population size. Detailed information of the seed sources are given in Table 1.

2.2. DNA Extraction and SSR Markers Screening

About 200 seeds of each seed source (mixture of seeds from 4 to 14 mother trees) (Table 1) were sown in a tray containing potting media (1.5:1:2 vermiculite:peat:river sands by volume) for germination and seedling growth. Due to varying germination rates of different seed sources, 15–65 seedlings (mostly around 30) of each seed source, totally 480 seedlings, were obtained for genomic DNA extraction (Table 2). Genomic DNA of the 840 seedlings was extracted from twigs using a modified CTAB (Cetyltrimethylammonium Ammonium Bromide) method [22]. Thirteen SSR markers were developed from EST (Expressed Sequence Tag) sequences of Casuarina genus downloaded from NCBI (National Center for Biotechnology Information, https://www.ncbi.nlm.nih.gov). The marker primer sequences and repeat motif of each primer pair are shown in Table 3.

2.3. PCR Amplification and Genotyping

The polymerase chain reaction (PCR) system, 10 µL in volume, was composed of 10 ng DNA template, 1.0 × buffer (100 mM Tris-HCl pH 9.0, 80 mM (NH4)2SO4, 100 mM KCl, 0.5% NP-40), 2.0 mM MgCl2, 200 μM dNTP, 10 pmol Fluorescent-dUTP (Fermentas International Inc.), 0.5 μM forward primer, 0.5 μM reverse primer and 1 U Taq DNA polymerase (Fermentas International Inc.).
A touchdown PCR program was implemented on an Applied Biosystems 2720 Thermal Cycler (Applied Biosystems, Foster City, CA, USA). The touchdown amplification protocol was as follows: denaturation at 94 °C for 5 min, followed with 20 cycles touchdown program of 30 s denaturation at 94 °C, annealing from 60 to 50 °C for 30 s with a decrease of 0.5 °C per cycle, and 30 s extension at 72 °C, then, 26 cycles of normal PCR with 30 s denaturation at 94 °C, 30 s annealing at 60 °C, and 30 s extension at 72 °C, ending with a final extension at 72 °C for 10 min. Capillary electrophoresis detection of amplified fragments of each EST-SSR locus was performed on an ABI 3130XL Genetic Analyzer (Applied Biosystems, USA) when PCR products were confirmed through agarose gel electrophoresis.

2.4. Data Analyses

Genotype data was collected using software GeneMapper 4.0 (Thermo Fisher Scientific, Waltham, MA, USA). As the samples of individuals from different provenances or land races were uneven, rarefaction was required to calculate allelic diversity indices [23]. Software FSTAT (version 2.9.4) [24] was used to calculate genetic diversity parameters of 840 accessions of C. equisetifolia based on the 13 EST-SSR markers, including number of alleles per locus (Na), number of effective alleles per locus (Ne), observed heterozygosity (Ho), expected heterozygosity (He), polymorphism information content (PIC) and Hardy–Weinberg equilibrium (HWE) was tested as well. Friedman test was used to undertake statistical significance tests and multiple-range comparison of allelic richness (AR) and expected heterozygosity (He) among the 27 seed sources using SPSS 20.0 (IBM-SPSS Inc. Chicago, IL, USA) software. Partitioning of genetic diversity within and between provenances was examined by analysis of molecular variance (AMOVA) in Arlequin 3.0 software [25]. Nei’s genetic distance among and within seed sources and pairwise genetic differentiation (FST) for the 27 seed sources were conducted using GenAlEx 6.5 [26], and a dendrogram was constructed using the Unweighted Pair Group Method with the Arithmetic Averaging (UPGMA) method based on POPTREE2 software [27] with 10,000 bootstraps.
Isolation by distance (IBD) among the 27 seed sources was tested using the Mantel test implemented in online software IBD [28], to analyze the relationship between genetic distance (GD) and geographical distance (GGD). The pairwise GGD (km) among the 27 seed sources were calculated based on their GPS (Global Positioning System) coordinates of collected locations using online software: http://jan.ucc.nau.edu/cvm/latlongdist.html. The Mantel test was applied to the matrices of pairwise population differentiation (calculated as FST/(1-FST)), and of log-transformed geographic distances between seed sources with 1000 random permutations [29]. The significance of IBD values was assessed using 9999 permutations.
A Bayesian clustering analysis was performed to infer genetic structure of the 27 seed sources using the software STRUCTURE 2.3.4 [30]. The number of assumed clusters (K) was set for a range of 1 to 30. The analysis was undertaken under the Admixture model with a “burn-in” of 100,000 followed by 50,000 iterations of the Markov Chain Monte Carlo (MCMC) model, and 10 replications were run for each K. In order to detect the optimal value of K inferred clusters, the parameter ΔK was calculated using the online Structure Harvester software [31].

3. Results

3.1. Microsatellite Loci Diversity and Polymorphism

In total, 279 alleles were identified across the 13 microsatellite loci examined in the 840 individuals representing 27 seed sources of C. equisetifolia (Table S1). The number of alleles per locus (Na) and the average effective number of alleles per locus (Ne) ranged from 9 to 46 and 1.53 to 7.03, respectively. Polymorphism information content (PIC) of the 13 loci across all the 840 provenance accessions ranged from 0.33 to 0.83 with an average of 0.60, indicating that 10 out of the 13 loci presented high PIC, and only 3 loci (P26, P52 and P81) presented moderate PIC, according to the suggested criterion of high (PIC > 0.5), moderate (0.25 < PIC < 0.5) and low (PIC < 0.25) [32]. Observed heterozygosity (Ho) and expected heterozygosity (He) per locus ranged from 0.24 to 0.64 and 0.35 to 0.85, with an average of 0.39 and 0.63, respectively. The inbreeding coefficient per locus ranged from −0.31 to 0.62, with an average of 0.39, suggesting excess of homozygotes in most loci, except locus P26. Detailed information of the genetic diversity indices revealed by 13 SSR loci is given in Table 4.

3.2. Provenance Diversity and Variation

Among the 27 seed sources, number of alleles (Na) ranged from 1.77 (Bangladesh) to 6.54 (Sarawak, Malaysia), with an average of 4.66, and effective alleles (Ne) by provenance (over all loci) ranged from 1.17 (Papua New Guinea) to 3.32 (Northern Territory, Australia), with an average of 1.54, respectively. Allelic richness (AR) ranged from 1.11 (Palawan, Philippines) to 1.66 (Kilifi, Kenya), with an average of 1.44, and statistically significant differences (p < 0.05) between the 27 seed sources were discovered. Observed heterozygosity ranged from 0.11 to 0.53, with an average of 0.39, expected heterozygosity (He) ranged from 0.47 to 0.89, with an average of 0.55, and also, statistically significant differences (p < 0.05) between the 27 seed sources were found. The inbreeding coefficient (FIS) of 27 provenances and land races ranged from −0.34 (Kenya) to 0.73 (Guam), with an average of 0.29, indicating significant heterozygotic deficits and excesses of homozygotes for a number of seed sources. It is noteworthy that natural provenances of Guam and PH1 (Philippines) presented extremely low Ho (0.09 and 0.04) and extremely high FIS (0.73 and 0.60), suggesting that the two provenances may be producing inbred seedling offspring (Table 2).
AMOVA analysis showed moderate genetic differentiation among provenances and land races (28.31%), with most of the variation observed among individuals (70.12%), and variation derived from regions was low (1.57%) (Table 5).

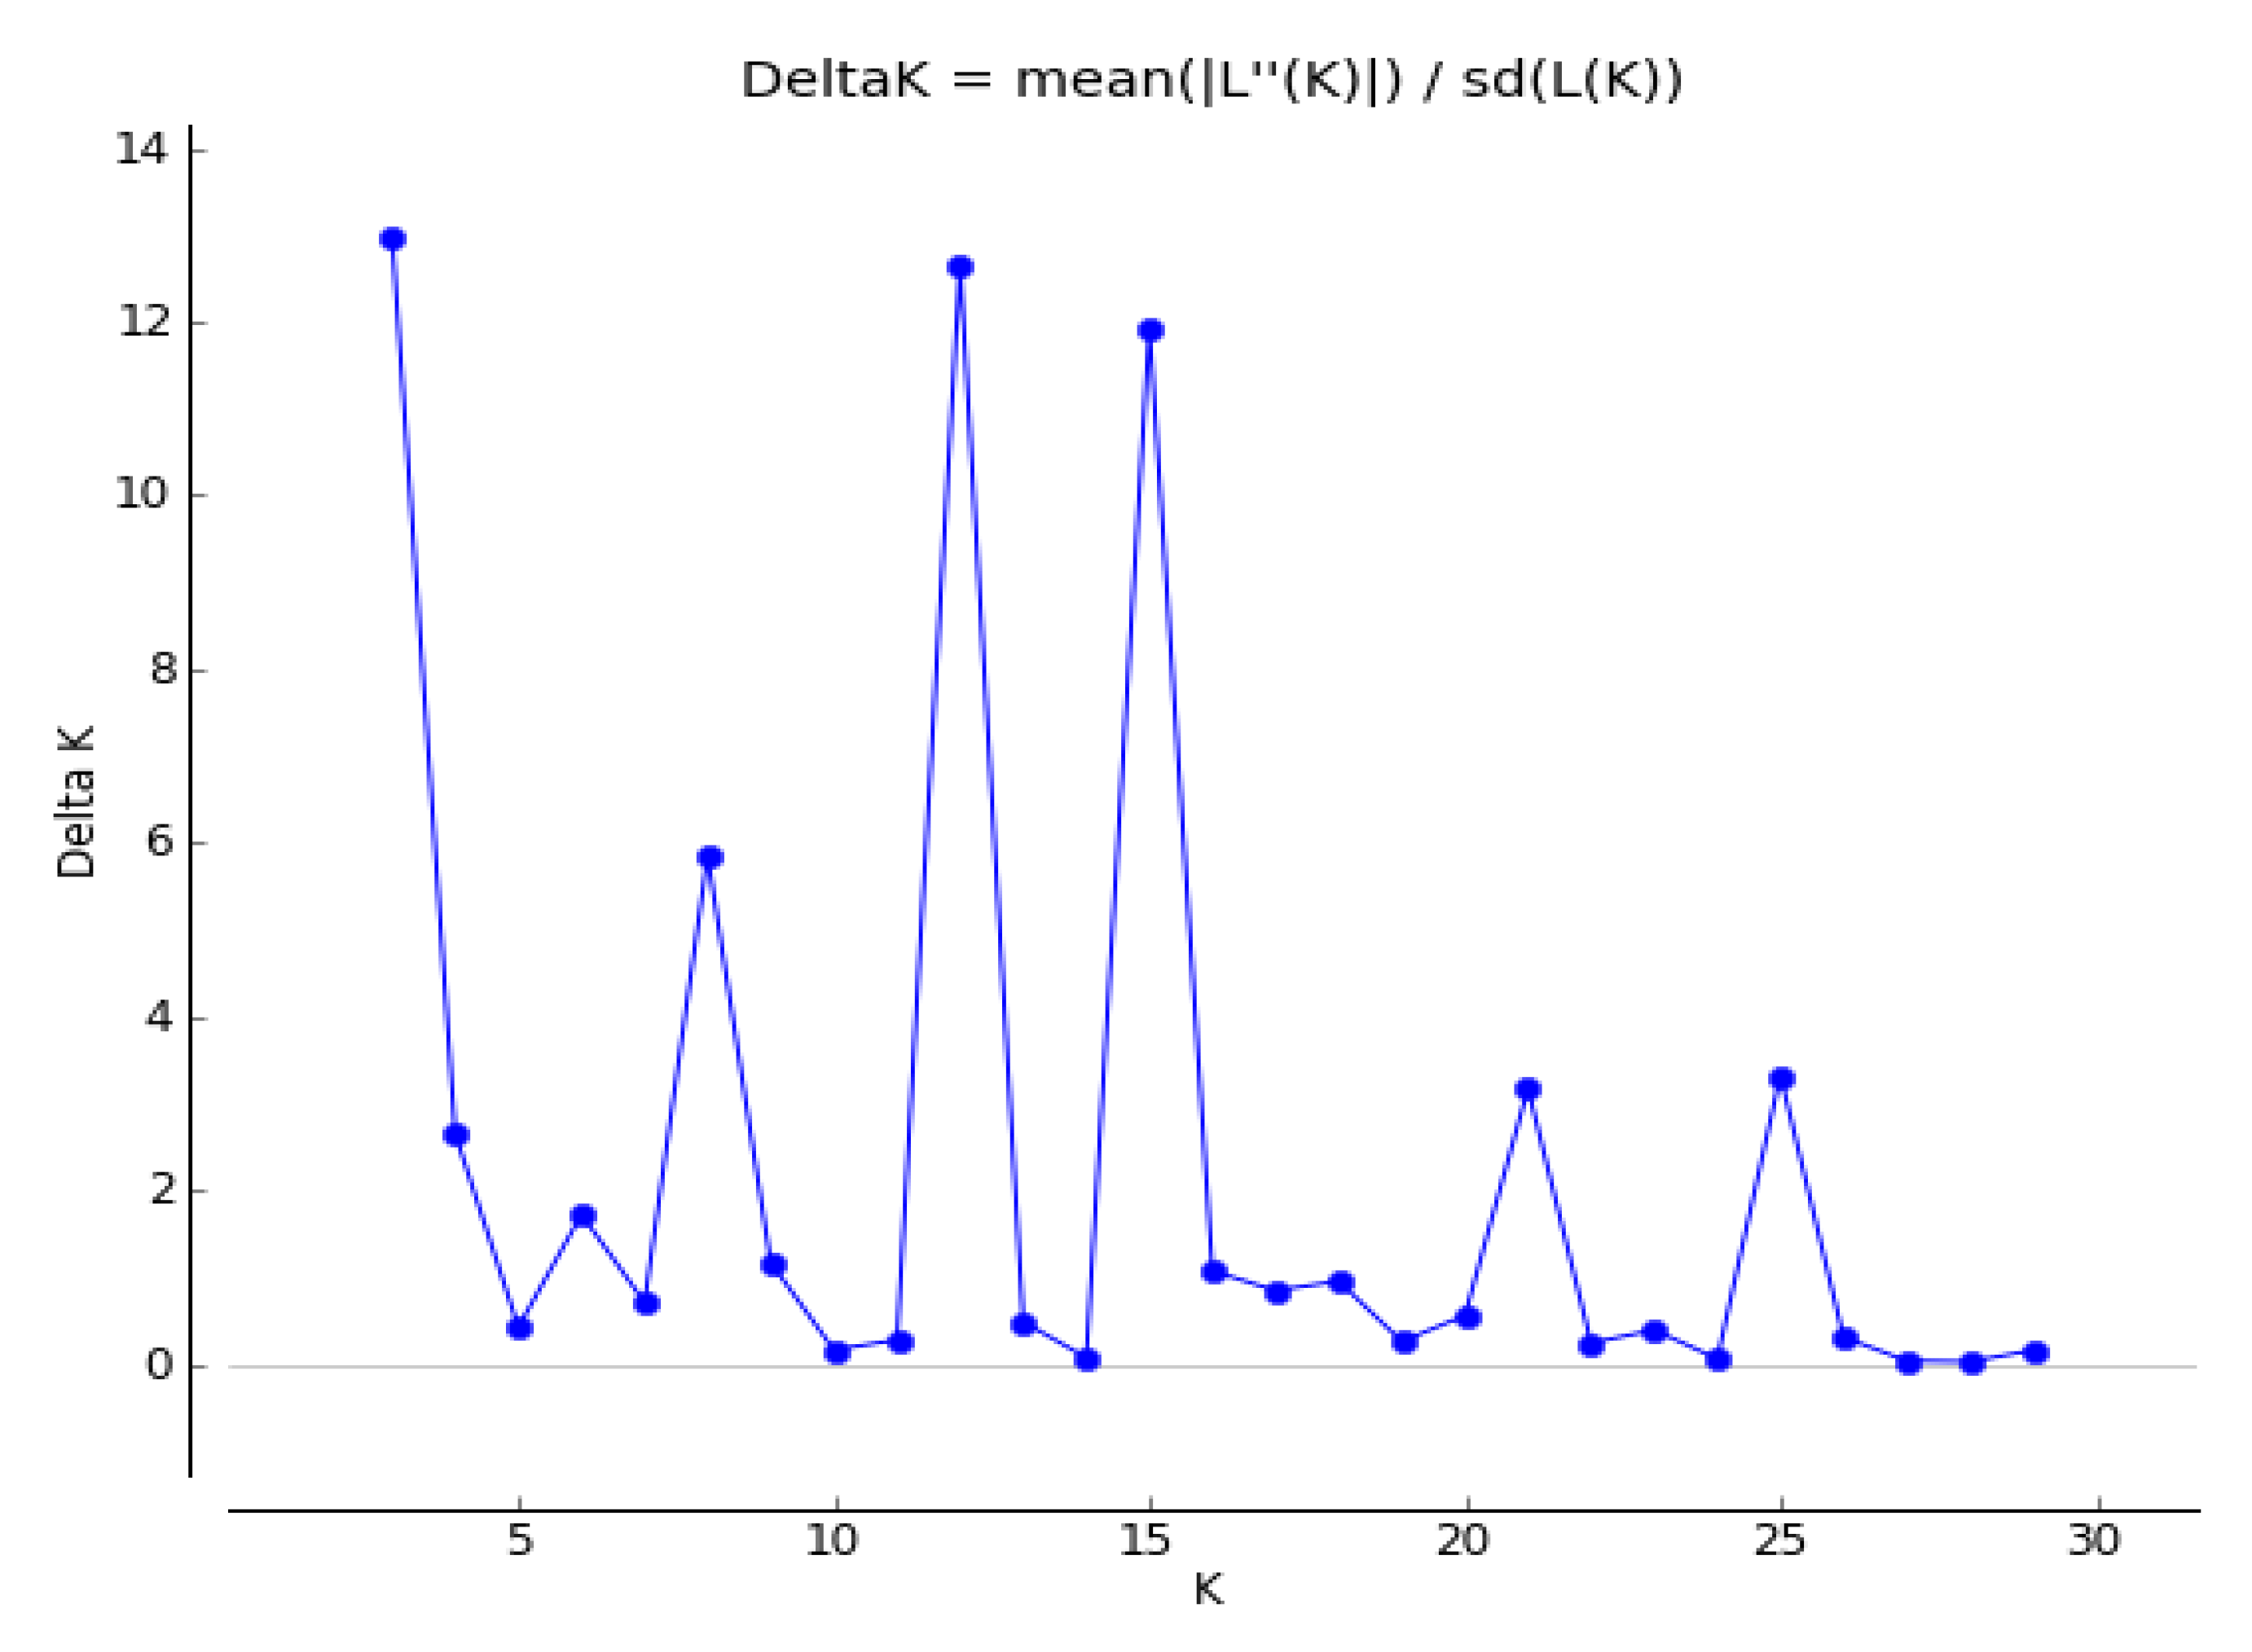
3.3. Genetic Structure of 27 Seed Sources

The average genetic differentiation index value (FST) for all pairwise provenances was 0.325, and between any two provenances, the index values varied from 0.024 to 0.502. The smallest FST value was between CN1 and CN2, which are both introduced subpopulations. In contrast, the two natural provenances PH1 and TO, which originated from two geographically distant countries, Philippines and Tonga, had the highest genetic differentiation (Table 6). Minimum genetic differentiation between putative land races and the natural seed sources (i.e., FST between a land race and the natural seed source from which it is least differentiated) ranged between 0.03 and 0.145. It was low (<0.05) for BD, BJ, CN1, CN2 and IN1. It was high (>0.1) for EG and KE1. These values might be indicative of (i) likely origins of the land races and (ii) whether a putative land race is genetically distinct from the source population. No significant correlation between genetic distances and geographic distances among the 27 seed sources was revealed by the Mantel test (p > 0.05, R2 = 0.021) (Figure 2).
STRUCTURE and Structure Harvester analysis of up to K = 30 potential clusters indicated that the ΔK reached a maximum at K = 3. All three clusters are present among the Oceania seedlots but only two are present among the Asian natural seedlots. However, two marked secondary peaks at ΔK = 12 and 15 were also found, providing evidence for finer clustering of the 27 seed sources (Figure 3 and Figure 4).

3.4. Genetic Relationship of 27 Seed Sources

Relationships between the 27 seed sources from 18 countries are summarized in a UPGMA dendrogram based on Nei’s unbiased genetic distances (Figure 5). According to the dendrogram, two main clusters are evident. The first group comprised 8 seed sources, and the second group comprised 19 seed sources. Bootstrap support for further bifurcation is typically moderate, ranging from 17% to 85%. Some seed sources appear to be closely related, such as CN1 and CN2 (Chinese land races), PH1 (Philippines) and BD (Bangladesh), PNG (Papua New Guinea) and PH1, PNG and BD.

4. Discussion

Genetic differentiation among seed sources was substantial, with AMOVA indicating 28% of variance partitioned among natural provenances. UPGMA cluster analysis of the natural and introduced populations revealed two main clusters of subpopulations (Figure 5). The first cluster comprised AU1 and TO natural provenances and putative land races from India (IN2, IN3), Vietnam, Egypt and Kenya (KE1, KE2). The second main cluster comprised a mix of Asian, Pacific and Australian (AU2) provenances along with Asian and African land races.
The optimal Bayesian clustering generated by STRUCTURE indicated K = 3 clusters, a result that prima facie is at odds with the UPGMA cluster analysis. However, the membership of the STRUCTURE clusters corresponds closely with those delineated by UPGMA. UPGMA cluster I, comprising 8 seed sources, corresponds exactly with one of the three STRUCTURE clusters, indicated by green bars in Figure 4. The K = 3 “blue” cluster corresponds to UPGMA cluster IIa, while the “red” cluster corresponds with members of UPGMA clusters IIb and IIc, also noting that bootstrap support is in many cases only weak to moderate for many of the UPGMA clusters.
Three genetic clusters are sufficient for interpretation of the probable broad regional origins of Asian and African land races. However, the finer of K = 12 and K = 15 clusters also revealed some potential affinities between wild and land race populations not resolved by the K = 3 model. An example is the affinity between AU1 and KE2, evident at both K = 12 and K = 15. The K = 12 and K = 15 models indicate Tonga (TO) as a more-specific source of introduction for some Asian (IN2, IN3, VN) and African (EG, KE1) land races than the K = 3 model, which resolves these land races to either Australia or Tonga. In fact, it would be surprising if these land races have originated from Tonga, as this nation has not been a major exporter of seed. It would seem more likely that another population in Australia, not included in this study, may be the actual origin. At K = 15, possible over-fitting of clusters is also evident, with splitting of the Guam material into two distinct clusters, for example.
Overall, the clustering observed from both UGMA and STRUCTURE analyses was surprising given the previous findings of Hu et al. [9], who studied geographic patterns of seedling morphology and growth of many of the seedlots used in this study. Their study indicated marked clustering of (i) Australian and Pacific provenances (i.e., Oceania) and African land races, and (ii) Asian provenances and Asian land races. A possible reason for the difference might be that the growth and morphological traits studied by Hu et al. [9] are controlled by loci that are under selection, while the present study used markers that are assumed to be neutral. Quantitative trait and neutral marker divergence have been observed in a number of organisms [33], including tree species [34]. A previous study using AFLP dominant markers [20] also indicated mixed clustering of Asian and Oceania natural populations.
In accord with the AMOVA analysis, the overall FST value of 0.29 (Table 5) among the 27 seed sources is considered to be high. This is not surprising considering the low probability of gene flow among the seed sources due to geographic isolation. The pairwise genetic differentiation indices (Table 6) of the 27 seed sources revealed that the most closely related pair of provenances were CN1 and CN2 (0.024), which are both samples of what could be considered to be a single land race. Gene flow between them is unlikely as they are separated by about 400 km. We therefore think it is probable that the two stands were established using the same seed source or one of them was established with seeds collected from the other. Similarly, very low pairwise FST values obtained between land races and natural provenances (for example China versus Malaysia, China versus Thailand, Benin versus Philippines) may imply that these natural provenances are the origins of the land races. Natural provenances PNG, PH1 and TO all appear to be quite strongly differentiated from the Chinese land race samples. These might provide good sources for further testing and potential widening of the genetic base in China.
Allilic richness and heterozygosity are two the most important parameters for estimating genetic diversity [35]. Overall, genetic diversity among the wild and introduced seed lots was moderate (AR = 1.44, He = 0.41), though there was considerable variation among seedlots (Table 2). Expected heterozygosity was markedly lower than estimates for natural provenances of two casuarina species, C. junghuhniana (He = 0.65) and C. cunninghamiana (He = 0.70), using EST-SSR markers [21]. The comparatively high diversity estimates for C. junghuhniana and C. cunninghamiana might be attributed to limited anthropogenic interference with the natural populations. Casuarina junghuhniana grows naturally on the slopes of volcanoes and undisturbed areas between 550 and 3100 m at altitude in Indonesia [36], and C. cunninghamiana grows naturally along stream banks and swampy areas in eastern Australia [37] and has become a protected species in NSW (New South Wales, Australia) due to past over-exploitation for fuelwood and building materials. Both possess less-extensive ranges than the cosmopolitan C. equisetifolia.
Among seedlots from the Oceania region, PNG had particularly low genetic diversity (AR = 1.13, He = 0.13) while in the Asian natural group, PH1 and TH1 both lacked diversity (AR < 0.12, He < 0.15). It is often the case that genetic diversity is low in land races due to introductions of a narrow range of genetic materials. In this case, however, genetic diversity in the introduced populations was moderate to high, with only the Bangladesh (BD) accession having AR and He below the range 1.36 to 1.66 and 0.35 to 0.65, respectively. Though heterozygosity was calculated over regions (Table 2), interpretation of these values is difficult given the lack of observed regional clustering (Figure 5).
Low expected heterozygosity of some natural provenances and land races of C. equisetifolia may be indicative of genetic diversity loss within provenances, small sample sizes and/or introductions of a narrow initial genetic base in the case of land races. Genetic diversity loss can be caused by factors including breeding system, habitat fragmentation and artificial selection. Casuarina equisetifolia is mainly dioecious, but, within subpopulations, possesses varying proportions of monoecy from less than 10% [38,39,40] to as high as 80% on Guam [41]. Provenances with a high proportion of monoecious individuals are likely to produce a high proportion of self-offspring [42], and for this reason, they are commonly culled from open-pollinated breeding populations. The Guam population provides an excellent case-in-point, exhibiting low AR and He, a major deficit of observed heterozygotes and extremely high FIS, providing strong evidence of inbreeding in this population.
Lack of genetic diversity and inbreeding in the Guam population may be a factor contributing to the widespread occurrence of Ralstonia bacterial wilt on the island [43], as there may be a lack of adaptive genes in the narrow genetic base. It is not known whether other seedlots with high FIS such as PH2 and the IN2 land race also have elevated monoecy. Inbreeding (FIS) appears to be elevated among the Asian natural populations, though TH2 is an exception. As inbreeding depression is very common among forest trees, and a number of Asian provenances have been shown to be very vigorous in plantation trials [4], it is probable that selection against homozygous individuals would be strong. This would mitigate the accumulation of homozygotes over successive generations from breeding among relatives that would be required for the observed high FIS values, and suggests that the observed inbreeding in these Asian seedlots might be the result of selfing, implying a proportion of monoecious individuals.
Geographical origin-determination for land races of exotic tree species would help to guide further introductions and breeding program composition. Based on the UPGMA dendrogram (Figure 5) and Bayesian clustering dendrogram (Figure 4), together with pairwise genetic distances (Table 2), we can infer the probable origins of some land races. For example, in addition to the aforementioned inferences that the most probable origin of land races of China was Southeast Asia, we can infer that the origin of the Bangladesh land race might be either PH1 or PNG, since both provenances had very close genetic distance with the Bangladesh subpopulation. But the lower pairwise FST values between Bangladesh and Philippines 1 (0.042) than that between Bangladesh and PNG (0.321) supported that the provenance of Philippines 1 is more likely the origin of land race of Bangladesh.
Ralstonia solanacearum bacterial wilt is an ongoing problem that has caused extensive mortality in coastal shelterbelts of C. equisetifolia [7]. There is an urgent need to develop a diverse set of new clones, with superior disease resistance, for coastal plantings in southern China. These will be particularly important for those industrial plantations situated inland of those immediately adjacent to the sea, as selection for growth and other industrial properties as well as disease resistance will be necessary. A better alternative to clonal forestry for the permanent environmental plantations is establishment using diverse seedling-based stock. Significant provenance-level variation in resistance to Ralstonia solanacearum infection has been found, especially among some Oceania provenances in a field trial of international provenance trial (Research Institute of Tropical Forestry). These provenances do not grow as rapidly as provenances from South-east Asia or the Chinese land races [2,4], though in their coastal protection function, this is not as important as long-term survival, which requires disease resistance. Since it would appear improbable that Oceania and Philippines provenances are represented among the land races of China, it would be prudent to develop new clones combining the fast growth of plus trees of the South-east Asian provenances or China’s land races and disease-resistant traits of Oceania through artificial crossing or open-pollinated hybridizing orchards.

5. Conclusions

This study revealed significant differentiation among 27 seed sources within 14 natural provenances and 13 land race samples of C. equisetifolia using 13 EST-SSR markers. Allelic diversity indices and inbreeding coefficient estimation indicated that there were significant heterozygotic deficits and excesses of homozygotes in many provenances and land races, implying that significant proportions of monoecious individuals may be present in some populations. The most probable origins of the land races were suggested according to the values of pairwise provenance differentiation (FST) and Nei’s genetic distances. The results of our neutral marker-based study only partially accorded with a previous morphology and growth study, suggesting that key traits may be under selection.

Supplementary Materials

The following are available online at https://www.mdpi.com/1999-4907/11/4/432/s1: Table S1: Genotyping data of 840 individuals of 27 C. equisetifolia seed sources.

Author Contributions

Conceptualization and methodology, C.Z., K.P. and D.B.; validation, Y.Z., P.H. and D.B.; formal analysis, Y.Z.; investigation, Y.Z., P.H., Y.W., J.M. and Z.L.; resources, C.Z. and K.P.; data curation, Y.Z. and P.H.; writing—original draft preparation, Y.Z; writing—review and editing, D.B. and K.P.; supervision, project administration and funding acquisition, C.Z. All authors have read and agreed to the published version of the manuscript.

Funding

This research was funded by the National Natural Science Foundation of China (Grant No. 31770716 and 31470634), the Fundamental Research Funds for the Central Non-profit Research Institution of CAF (No. CAFYBB2018SZ002 and CAFYBB2018ZB003).

Acknowledgments

The survey and sample collection work was kindly supported by numerous local forestry sectors, such as Jinjiang Forestry Bureau and Chihu Forest Farm in Fujian province, Dianbai Forest Institute in Guangdong province, Daodong Forest Farm in Hainan province. We are particularly grateful to Gongfu Ye and Sen Nie of Fujian Academy of Forestry Science, for their key assistance in sample and relevant information collection.

Conflicts of Interest

The authors declare no conflict of interest.

References

  1. Pinyopusarerk, K.; House, A.P.N. Casuarina: An Annotated Bibliography of C. equisetifolia, C. Junghuhniana and C. oligodon; International Centre for Research in Agroforestry: Nairobi, Kenya, 1993; pp. 1–5. [Google Scholar]
  2. Zhong, C.L.; Zhang, Y.; Chen, Y.; Jiang, Q.B.; Chen, Z.; Wu, C.; Pinyopusarerk, K.; Franche, C.; Bogusz, D. Casuarina research and development in China. Improving Smallholder Livelihoods Through Improved Casuarina Productivity. In Proceedings of the 4th Internation Casuarina Workshop, Haikou, China, 21–25 March 2010; Chinese Forestry Publishing House: Beijing, China, 2011; pp. 5–9. [Google Scholar]
  3. Fall, P.L. Pollen evidence for plant introduction in a Polynesian tropical island ecosystem, Kingdom of Tonga. In Altered Ecologies; Haberle, S.H., Stevenson, J., Prebble, M., Eds.; ANU Press: Canberra, Australia, 2010; pp. 253–272. [Google Scholar]
  4. Pinyopusarerk, K.; Kalinganire, A.; Williams, E.R.; Aken, K.M. Evaluation of International Provenance Trials of Casuarina Equisetifolia; CSIRO Forestry and Forest Products: Canberra, Australia, 2004; pp. 25–30.
  5. Zhong, C.L.; Zhang, Y.; Jiang, Q.B.; Chen, Y.; Chen, Z.; Ma, N.; Hu, P.; Liu, F.; Pinyopusarerk, K.; Bogusz, D.; et al. Constraints in Casuarina cultivation in southern coastal regions of China. Casuarina Improvement for Securing Rural Livelihoods. In Proceedings of the 5th International Casuarina Workshop, Chennai, India, 3–7 February 2014; Nicodemus, A., Pinyopusarerk, K., Zhong, C.L., Franche, C., Eds.; Institute of Forest Genetics and Tree Breeding: Coimbatore, India, 2014; pp. 10–13. [Google Scholar]
  6. Yu, W.; Zhang, Y.; Xu, X.Y.; Zhong, C.L.; Wei, Y.C.; Meng, J.X.; Chen, Y.; Li, Z.; Bush, D.J. Molecular markers reveal low genetic diversity in Casuarina equisetifolia clonal plantations in South China. New For. 2019. [Google Scholar] [CrossRef]
  7. Sun, S.; Shu, C.W.; Chen, J.L.; Wang, J.; Zhou, E. Screening for resistant clones ofCasuarina equisetifoliato bacterial wilt and the analysis of AFLP markers in resistant clones. For. Pathol. 2014, 44, 276–281. [Google Scholar] [CrossRef]
  8. Chen, Y.Z. The main diseases and insect pests of coastal Casuarina protection forests and their control countermeasures. J. Fujian For. Sci. Technol. 1995, 3, 24–28. [Google Scholar]
  9. Hu, P.; Zhong, C.; Zhang, Y.; Jiang, Q.; Chen, Y.; Chen, Z.; Pinyopusarerk, K.; Bush, D. Geographic variation in seedling morphology of Casuarina equisetifolia subsp. equisetifolia (Casuarinaceae). Aust. J. Bot. 2016, 64, 160–170. [Google Scholar] [CrossRef]
  10. Booy, G.; Hendriks, R.J.J.; Smulders, M.J.; Groenendael, J.M.; Vosman, B. Genetic Diversity and the Survival of Populations. Plant Boil. 2000, 2, 379–395. [Google Scholar] [CrossRef]
  11. Sathyanarayana, N.; Pittala, R.K.; Tripathi, P.K.; Chopra, R.; Singh, H.R.; Belamkar, V.; Slatkin, M.; Barton, N.H. A comparison of three indirect methods for estimating average levels of gene flow. Evolution 1989, 43, 1349–1368. [Google Scholar]
  12. Schaberg, P.G.; DeHayes, D.H.; Hawley, G.J.; Nijensohn, S.E. Anthropogenic alterations of genetic diversity within tree populations: Implications for forest ecosystem resilience. For. Ecol. Manag. 2008, 256, 855–862. [Google Scholar] [CrossRef]
  13. Luangviriyasaeng, V. Eucalypt planting in? Thailand. In Eucalypts in Asia; Turnbull, J.W., Ed.; Australian Centre for International Agricultural Research: Zhangian, China, 2003. [Google Scholar]
  14. Parasurama, J.; Naik, S. Reaction of Acacia hybrid clones against pink disease caused by Corticium salmonicolor. Plant Pathol. Newsl. 2003, 21, 28–30. [Google Scholar]
  15. Mei, W.; Xie, S. Intensification of landfalling typhoons over the northwest Pacific since the late 1970s. Nat. Geosci. 2016, 9, 753–757. [Google Scholar] [CrossRef]
  16. Chakraborth, S. Potential impact of climate change on plant-pathogen interactions. Australas. Plant Pathol. 2005, 34, 443–448. [Google Scholar] [CrossRef]
  17. Linnakoski, R.; Kasanen, R.; Dounavi, A.; Forbes, K.M. Editorial: Forest Health under Climate Change: Effects on Tree Resilience, and Pest and Pathogen Dynamics. Front. Plant Sci. 2019, 10, 1157. [Google Scholar] [CrossRef] [PubMed] [Green Version]
  18. Moore, N.; Moran, G. Microgeographical Patterns of Allozyme Variation in Casuarina cunninghamiana Miq Within and Between the Murrumbidgee and Coastal Drainage Systems. Aust. J. Bot. 1989, 37, 181. [Google Scholar] [CrossRef]
  19. Ho, K.Y.; Ou, C.H.; Yang, J.C.; Hsiao, J.Y. An assessment of DNA polymorphisms and genetic relationships of Casuarina equisetifolia using RAPD markers. Bot. Bull. Acad. Sin. 2002, 43, 93–98. [Google Scholar]
  20. Huang, G.; Zhong, C.L.; Su, X.H.; Zhang, Y.; Pinyopusarerk, K.; Franche, C.; Bogusz, D. Genetic Variation and Structure of native and introduced Casuarina equisetifolia (L. Johnson) Provenances. Silvae Genet. 2009, 58, 79–85. [Google Scholar] [CrossRef] [Green Version]
  21. Kullan, A.R.K.; Kulkarni, A.V.; Kumar, R.S.; Rajkumar, R. Development of microsatellite markers and their use in genetic diversity and population structure analysis in Casuarina. Tree Genet. Genomes 2016, 12, 49–60. [Google Scholar] [CrossRef]
  22. Gan, S.; Shi, J.; Li, M.; Wu, K.; Bai, J. Moderate density molecular maps of Eucalyptus urophylla S.T. Blake and E. tereticornis Smith genomes based on RAPD markers. Genetic 2003, 118, 59–67. [Google Scholar] [CrossRef]
  23. Kalinowski, S.T. hp-rare 1.0: A computer program for performing rarefaction on measures of allelic richness. Mol. Ecol. Notes 2005, 5, 187–189. [Google Scholar] [CrossRef]
  24. Goudet, J. FSTAT (version 2.9.4), a Program (for Windows 95 and Above) to Estimate and Population Genetics Parameters. Lausanne University, Switzerland, 2003. Available online: https://www2.unil.ch/popgen/softwares/fstat.htm (accessed on 10 July 2019).
  25. Excoffier, L.; Laval, G.; Schneider, S. Arlequin (version 3.0): An integrated software package for population genetics data analysis. Evol. Bioinform. 2007, 1, 47–50. [Google Scholar] [CrossRef] [Green Version]
  26. Peakall, R.; Smouse, P.E. GenAlEx 6.5: Genetic analysis in Excel. Population genetic software for teaching and research--an update. Bioinformatics 2012, 28, 2537–2539. [Google Scholar] [CrossRef] [Green Version]
  27. Takezaki, N.; Nei, M.; Tamura, K. POPTREE2: Software for Constructing Population Trees from Allele Frequency Data and Computing Other Population Statistics with Windows Interface. Mol. Boil. Evol. 2009, 27, 747–752. [Google Scholar] [CrossRef] [Green Version]
  28. Bohonak, A.J. IBD (isolation by distance): A program for analyses of isolation by distance. J. Hered. 2002, 2, 2. [Google Scholar] [CrossRef] [PubMed]
  29. Mantel, N. The detection of disease clustering and a generalized regression approach. Cancer Res. 1967, 27, 209–220. [Google Scholar] [PubMed]
  30. Pritchard, J.K.; Stephens, M.; Donnelly, P. Inference of population structure using multilocus genotype data. Genetic 2000, 155, 945–959. [Google Scholar]
  31. Earl, D.; Vonholdt, B.M. STRUCTURE HARVESTER: A website and program for visualizing STRUCTURE output and implementing the Evanno method. Conserv. Genet. Resour. 2011, 4, 359–361. [Google Scholar] [CrossRef]
  32. Botstein, D.; White, R.L.; Skolnick, M.; Davis, R.W. Construction of a genetic linkage map in man using restriction fragment length polymorphisms. Am. J. Hum. Genet. 1980, 32, 314–331. [Google Scholar]
  33. Leinonen, T.; O’Hara, B.; Cano, J.M.; Merilä, J. Comparative studies of quantitative trait and neutral marker divergence: A meta-analysis. J. Evol. Boil. 2007, 21, 1–17. [Google Scholar] [CrossRef]
  34. Savolainen, O.; Pyhäjärvi, T.; Knürr, T. Gene Flow and Local Adaptation in Trees. Annu. Rev. Ecol. Evol. Syst. 2007, 38, 595–619. [Google Scholar] [CrossRef]
  35. Slatkin, M. Estimating Levels of Gene Flow in Natural Populations. Genetic 1981, 99, 323–335. [Google Scholar]
  36. Pinyopusarerk, K.; Williams, E.R. Variations in growth and morphological characteristics of Casuarina junghuhniana provenance growth in Thailand. J. Trop. For. Sci. 2005, 17, 574–587. [Google Scholar]
  37. Johnson, L.A.S. Notes on Casuarinaceae Ⅱ. J. Adel. Bot. Gard. 1982, 6, 73–82. [Google Scholar]
  38. Dorajraj, S.; Wilson, J. Effect of sex on growth vigour in Casuarina equisetifolia. In National Seminars on Tree Improvement; Tamil Nadu: Coimbatore, India, 1981; pp. 72–78. [Google Scholar]
  39. Luechanimitchit, P.; Luangviriyasaeng, V. Study of sex ratio and relationship between growth and sex in Casuarina equisetifolia in Thailand. Recent Casuarina research and development. In Proceedings of the 3th International Casuarina Workshop, Da Nang, Vietnam, 4–7 March 1996; Pinyopusarerk, K., Turnbull, J.W., Midgley, S.J., Eds.; CSIRO Forestry and Forest Products: Melbourne, Australia, 1996; pp. 30–32. [Google Scholar]
  40. Zhang, Y. Studies on genetic improvement of three Casuarina species. Ph.D. Thesis, Chinese Academy of Forestry, Beijing, China, 2013. [Google Scholar]
  41. Schlub, R.; Mersha, Z.; Aime, M.; Badilles, A.; Cannon, P.; Marx, B.; McConnell, R.; Moore, A.; Nandwani, D.; Nelson, S.; et al. Guam ironwood (Casuarina equisetifolia) tree decline conference and follow-up. Improving smallholder livelihoods through improved casuarina productivity. In Proceedings of the 4th International Casuarina Workshop, Haikou, China, 21–25 March 2010; Zhong, C.L., Pinyopusarerk, K., Kalinganire, A., Franche, C., Eds.; Chinese Forestry Publishing House: Beijing, China, 2011; pp. 239–246. [Google Scholar]
  42. Zhang, Y.; Zhong, C.; Han, Q.; Jiang, Q.; Chen, Y.; Chen, Z.; Pinyopusarerk, K.; Bush, D. And Reproductive biology and breeding system in Casuarina equisetifolia (Casuarinaceae)—Implication for genetic improvement. Aust. J. Bot. 2016, 64, 120. [Google Scholar] [CrossRef]
  43. Ayin, C.M.; Schlub, R.L.; Yasuhara-Bell, J.; Alvarez, A.M. Identification and characterization of bacteria associated with decline of ironwood (Casuarina equisetifolia) in Guam. Australas. Plant Pathol. 2014, 44, 225–234. [Google Scholar] [CrossRef]
Figure 1. Natural distribution of Casuarina equisetifolia. The range of subsp. equisetifolia is contained within the dotted line [1].
Forests 11 00432 g001
Figure 2. Relationship between pairwise genetic distances (GD) and geographic distances (GGD) for the 27 seed sources. No significant correlation was discovered between GD and GGD (p > 0.05).
Forests 11 00432 g002
Figure 3. Genetic cluster number inferred by Structure Harvester software for K ranging from 1 to 30. The delta K shows a clear peak at K = 3, and two marked secondary peaks in delta K = 12 and 15 were found.
Forests 11 00432 g003
Figure 4. Population structure inferred by Bayesian cluster analyses (STRUCTURE) for 840 individual genotypes from 27 seed sources representing 7 Oceania natural provenances, 7 Asia natural provenances, 8 Asia introduced land races and 5 Africa introduced land races. The delta K method gave K = 3 as the optimal number of structures, large peaks corresponding to K = 12 and 15 clusters are also indicated (Figure 4).
Forests 11 00432 g004
Figure 5. Dendrogram generated by the Unweighted Pair Group Method showing the 27 seed sources of C. equisetifolia clustered as two main groups, based on Nei’s unbiased genetic distance derived from 13 EST-SSR markers. Different colour codes are used to differentiate the four regions of seed sources: red: Oceania natural, purple: Asia natural, green: Asia introduced, black: Africa introduced. Group I and Subgroups IIa–c correspond to specific clusters in the K = 3 STRUCTURE analysis.
Forests 11 00432 g005
Table 1. Information of Casuarina equisetifolia provenances used in the study.
CSIRO SeedlotCodeSeed Source LocationCountryLatitudeLongitudeAltitude (m)Rainfall (mm)No. of Parents
Oceania Natural
17862AU1Wagait, Northern TerritoryAustralia12 25S130 44E317406
18345AU2Chili Beach, QueenslandAustralia12 39S143 25E116005
21311GUInarajan BeachGuam13 15N144 44E321009
20586PNGHorno Is. ManusPapua New Guinea02 19S147 49E11800Bulk
18402SBKolombangaraSolomon Islands08 07S157 08E2350010
18040TONavutoka, TongatapuTonga21 04S175 04E1180010
18312VUEfateVanuatu17 45S168 18E302400Bulk
Asia Natural
18244MY1Bako, SarawakMalaysia01 44N110 30E5040004
18376MY2Tangjong Balau, JohorMalaysia01 36N104 16E1526004
18357PH1Narra, PalawanPhilippines09 19N118 29E1025006
18117PH2San Jose, MindoroPhilippines12 25N121 03E202000Bulk
18154PH3Aklan, Panay IslandPhilippines11 55N121 23E3021005
18297TH1Ban Kamphuam, RanongThailand09 21N98 16E1030008
18298TH2Had Chaomai, TrangThailand07 33N100 37E216009
Asia Introduced
18267CN1Yanjiang, GuangdongChina23 00N113 03E4150010
18268CN2Daodong, HainanChina19 58N110 59E10170014
18013IN1Cuttack, OrissaIndia20 12N86 38E714006
18015IN2Balasore, OrissaIndia21 30N84 53E216004
18119IN3Rameswaram, Tamil NaduIndia09 15N79 20E59008
18287LKHambantotaSri Lanka06 08N81 07E161000Bulk
18128VNHai Thinh, Ha NamNinhVietnam20 22N106 21E220007
21331BDParki Beach, ChittagongBangladesh21 11N91 48E517005
Africa Introduced
18355BJCotonouBenin06 24N02 31E813008
18122EGMontazahEgypt31 16N30 05E132008
18135KE1MalindiKenya03 15S40 09E790010
18142KE2KilifiKenya03 38S39 95E2010005
18565MUIsle D’AmbreMauritius20 03S57 39E217004
Note: CSIRO, Commonwealth Scientific and Industrial Research Organization, Australia.
Table 2. Genetic diversity indices for the 27 seed sources of C. equisetifolia.
ProvenanceNNaNeARHoHeFIS
AU1316.003.321.64 g0.740.63 g−0.17
AU2254.081.761.39 bcdef0.390.39 cdefg0.00
GU573.921.671.33 bcde0.090.33 bcdefg0.73
PNG302.231.171.13 a0.110.13 a0.13
SB305.772.581.53 fg0.490.52 fg0.06
TO303.541.711.29 abcd0.210.27 abcd0.22
VU284.311.921.43 bcdef0.410.42 bcdef0.02
ON23113.852.711.390.420.580.28
MY1296.542.661.59 g0.460.57 fg0.19
MY2305.542.851.34 bcde0.240.33 bcde0.27
PH1156.392.411.11 a0.040.10 a0.60
PH2161.921.221.52 defg0.300.49 defg0.39
PH3414.462.071.56 g0.410.56 fg0.27
TH1156.002.691.16 ab0.120.14 ab0.14
TH2324.231.671.59 g0.650.58 fg−0.12
AN20113.623.631.410.350.650.46
BD131.771.281.22 abc0.170.22 abc0.23
CN1305.002.511.53 efg0.450.51 ef0.12
CN2305.312.641.51 defg0.450.49 def0.08
IN1395.542.511.51 defg0.500.50 defg0.00
IN2465.542.561.52 fg0.320.52 fg0.38
IN3305.001.931.43 cdefg0.380.42 cdef0.10
LK153.002.181.52 fg0.610.47 cdef−0.30
VN304.541.891.41 cdef0.390.40 cdef0.03
AI23311.313.081.460.400.400.00
BJ655.852.061.45 cdef0.360.44 cdef0.18
EG304.311.871.38 bcdef0.300.37 bcdef0.19
KE1304.001.691.36 bcdef0.290.35 bcdef0.17
KE2306.153.111.66 g0.870.65 g−0.34
MU305.002.451.55 fg0.570.54 fg−0.06
AFI18511.623.241.480.340.660.48
Overall/mean8404.662.161.440.380.410.07
Note: N, number of individuals sampled; Na, number of alleles per locus averaged across the 13 loci; Ne, number of effective alleles per locus averaged across loci; AR, allelic richness; Ho, observed heterozygosity; He, expected heterozygosity; FIS, inbreeding coefficient. ON, Oceania Natural; AN, Asia Natural; AI, Asia introduced; AFI, Africa introduced; For AR and He values, values followed by the same letter are not significantly different according to the Friedman multiple range test (p < 0.05).
Table 3. Thirteen EST-SSR (Expressed Sequence Tag-Simple Sequence Repeats) primer information used for PCR amplification of 27 seed sources of C. equisetifolia.
PrimerAccession No.SSR TypePrimer Sequence
(5′-3′)
Annealing
Tm (°C)
Mg2+Concen. (mM)
P3FQ324509(AGA)6F: TGCAGCATCATCACTACT
R: ACTCCAACCAACTCTATTC
541.5
P15FQ326101(CTTCT)5F: TTTGTCTTCCCTACTCCG
R:AACCCTTTTCCACTTTCTTA
521.5
P19FQ327279(CTT)6F: TTCAAAACCCTAGCATCT
R: CATACCATTAACCAAAGC
501.5
P24FQ327965(CT)14F: GCTGGAGGTGGTGGTGTT
R: TATGGAATAGACGAGAAGTGAG
561.5
P26FQ328032(TCGCAC)3F: CATCTGAACTTTTGAAACCCTA
R:GGCATGGCTTCGTCTTGG
561.5
P36FQ363031(CAACGACAA)3F: CCTCAAACCAAGACCACC
R: CCGACTTCCATGCTCAAT
522.0
P48FQ363175(TAG)6F: GCCGAGTTATGGGGACGA
R: GGTGTTTGTGACGACGCT
582.5
P52FQ365340(CGT)6F: GCACGGTCGTCTTATTCT
R:TCGCTTCCCATACAAATC
522.0
P56FQ365696(TG)9F: TGCCGCTGAACAAAATGA
R:ATGGTCTCGCCTGGAATG
562.0
P79FQ374531(CATCTT)3F: ATGGGACATTTTGGTGAT
R:CTTTGCTTTAGGCGTTTT
501.5
P80FQ374771(GAC)12F: GCTTTGTCCTACCGTTTC
R:ATCACCACCATCCTCGTC
561.5
P81FQ374894(TC)9F: CCCTGCTTCTGGTCATTC
R: GATCTGTGGCTTTGCTTG
501.5
P93FQ376339(TC)9F: ACACGCCCTGTGATAGTT
R: GAGGAATTGAGCTTGCTG
541.5
Note: Accession No., accession number of primers generated by GeneBank after being uploaded; Annealing Tm, annealing temperature; Mg2+ Concen., Mg2+ concentration; mM, millimole·litre−1.
Table 4. Genetic diversity indices at 13 EST-SSR loci for the 840 accessions within 27 seed sources of C. equisetifolia.
LocusNaNeIPICHoHeFISF(null)
P3147.032.140.830.380.850.55***0.12
P15212.421.290.520.270.570.53***0.12
P19104.461.660.710.300.750.60***0.18
P24252.901.580.580.240.630.62***0.21
P26132.020.940.420.640.49−0.31***0.06
P36463.201.970.620.340.640.47***0.09
P48244.501.850.720.480.760.37***0.08
P5291.530.690.360.310.400.23***0.04
P56253.521.760.670.320.700.54***0.11
P79181.650.890.330.340.350.03***0.05
P80323.711.950.700.360.720.50***0.08
P81182.321.340.540.460.570.19***0.03
P93244.751.950.770.570.790.28***0.07
mean21.463.391.540.600.390.630.390.10
Note: Na, number of alleles per locus averaged across the 13 loci; Ne, number of effective alleles per locus averaged across loci; I, Shannon’s information index across loci; PIC, polymorphism information content; Ho, observed heterozygosity; He, expected heterozygosity; FIS, inbreeding coefficient; F(null), estimated frequency of null alleles; Significance levels are indicated by *** p < 0.001.
Table 5. Analysis of molecular variance (AMOVA) of 27 seed sources derived from four regions based on 13 SSR loci.
Source of VariationSSVCV%F-Statistics
Regions398.5570.0671.57FST = 0.299
Seedlots1606.6841.20628.31FSC = 0.288
Individuals4445.6052.98770.12FCT = −0.016
Total6450.8454.259
SS, sum of squares; VC, variance components; V %, percent variation; FST, differentiation among regions; FSC, differentiation among provenances; FCT, differentiation among individuals.
Table 6. Pairwise genetic differentiation indices (FST) for the 27 seed sources of C. equisetifolia. The upper right quadrant indicates the natural provenance with the lowest FST for each land race.
Natural Provenances Land Races
AU1AU2GUPNGSBTOVUMY1MY2PH1PH2PH3TH1TH2BDCN1CN2IN1IN2IN3LKVNBJEGKE1KE2MU
AU10 AU1 AU1
AU20.1620
GU0.2410.1700
PNG0.3200.1980.1240
SB0.1590.0990.1860.2060 SB
TO0.2400.3050.3590.4650.3280 TO TO TO
VU0.1730.0550.1270.1490.0770.3030 VU
MY10.1210.1350.1730.2370.1030.2210.1050 MY1MY1 MY1
MY20.1570.1380.1970.2340.1090.2950.1090.1140
PH10.3310.1980.1270.0530.2180.5020.1460.2500.2610 PH1
PH20.1340.1060.1050.1090.0990.2680.0640.0930.1280.1290
PH30.1440.1040.1280.1800.0860.2430.0770.1110.0820.1960.0850
TH10.1190.1240.1890.2250.1100.2370.0990.0670.0670.2420.1020.0940 TH1
TH20.1310.1440.1920.2310.0700.2710.1220.0990.0590.2420.1210.0860.0570 TH2
BD0.3340.3210.1490.3210.3470.4990.2710.2990.3110.0420.2600.2440.2840.2880
CN10.1360.1260.2000.2460.0940.2120.0990.0360.1300.2510.0930.1350.0790.1150.3420
CN20.1430.1230.2030.2400.1020.2150.1050.0500.1370.2480.1100.1310.0810.1190.3380.0240
IN10.1680.1320.1830.2180.0300.3120.0770.0890.0960.2220.1070.0930.0980.0650.3230.0840.0940
IN20.1120.1160.1740.2290.1400.1100.1210.0890.1310.2410.1000.0840.1030.1220.2740.0970.0900.1400
IN30.1580.1860.2540.3370.2240.0770.2090.1310.1930.3490.1780.1590.1490.1890.3460.1230.1340.2190.0510
LK0.1690.1860.2710.3010.1400.2920.1620.0840.1340.3400.1530.1570.0690.0990.3920.0770.0740.1270.1410.1790
VN0.1660.1550.2510.3030.2050.1190.1870.1240.1800.3200.1620.1510.1320.1720.3540.1050.1050.2160.0540.0370.1470
BJ0.1760.1020.0880.0910.0890.2800.0490.1030.0880.0960.0530.0660.0880.0850.2260.1120.1170.0730.1020.1900.1470.1640
EG0.1450.2160.3210.4000.2700.1490.2610.1800.2470.4450.2060.2040.1810.2100.4520.1710.1720.2860.0860.0750.2140.0610.2380
KE10.1790.2350.3330.4140.2580.1590.2740.1850.2640.4500.2130.2100.2000.2160.4640.1570.1790.2740.1160.0760.2430.0760.2510.1010
KE20.0800.1930.2470.3350.1730.2160.1880.1070.1710.3530.1350.1560.1390.1560.3330.1210.1370.1700.1130.1370.1660.1440.1830.1600.1390
MU0.1130.1200.1790.2350.0710.3240.1070.0990.1090.2340.1100.1010.1040.0680.3150.1100.1170.0710.1240.2080.1500.1840.0910.2040.2430.1390

