Article

Potential Impacts of Insect-Induced Harvests in the Mixed Forests of New England

by
Meghan Graham MacLean
1,2,*,
Jonathan Holt
3,
Mark Borsuk
3,
Marla Markowski-Lindsay
2,
Brett J. Butler
4,
David B. Kittredge
1,
Matthew J. Duveneck
1,5,
Danelle Laflower
1,
David A. Orwig
1,
David R. Foster
1 and
Jonathan R. Thompson
1
1
Harvard Forest, Harvard University, Petersham, MA 01366, USA
2
Department of Environmental Conservation, University of Massachusetts—Amherst, Amherst, MA 01003, USA
3
Civil and Environmental Engineering, Duke University, Durham, NC 27708, USA
4
USDA Forest Service Northern Research Station, Amherst, MA 01003, USA
5
New England Conservatory, Boston, MA 02115, USA
*
Author to whom correspondence should be addressed.
Forests 2020, 11(5), 498; https://doi.org/10.3390/f11050498
Submission received: 17 March 2020 / Revised: 26 April 2020 / Accepted: 27 April 2020 / Published: 29 April 2020
(This article belongs to the Section Forest Ecology and Management)

Abstract

:
Forest insects and pathogens have significant impacts on U.S. forests, annually affecting an area nearly three times that of wildfires and timber harvesting combined. However, coupled with these direct effects of forest insects and pathogens are the indirect impacts through influencing forest management practices, such as harvesting. In an earlier study, we surveyed private woodland owners in the northeastern U.S. and 84% of respondents indicated they intended to harvest in at least one of the presented insect invasion scenarios. This harvest response to insects represents a potentially significant shift in the timing, extent, and species selection of harvesting. Here we used the results from the landowner survey, regional forest inventory data, and characteristics of the emerald ash borer (Species: Agrilus planipennis Fairmaire, 1888) invasion to examine the potential for a rapidly spreading invasive insect to alter harvest regimes and affect regional forest conditions. Our analysis suggests that 25% of the woodland parcels in the Connecticut River Watershed in New England may intend to harvest in response to emerald ash borer. If the emerald ash borer continues to spread at its current rate within the region, and therefore the associated management response occurs in the next decade, this could result in an increase in harvest frequencies, from 2.6% year−1 (historically) to 3.7% year−1 through to approximately 2030. If harvest intensities remain at levels found in remeasured Forest Inventory and Analysis plots, this insect-initiated harvesting would result in the removal of 12%–13% of the total aboveground biomass. Eighty-one percent of the removed biomass would be from species other than ash, creating a forest disturbance that is over twice the magnitude than that created by emerald ash borer alone, with the most valuable co-occurring species most vulnerable to biomass loss.

1. Introduction

Forest insects and pathogens (FIPs) have significant impacts on U.S. forests, each year affecting an area nearly three times the area of all wildfires and timber harvesting combined [1,2]. FIPs selectively reduce tree species richness, thereby altering forest structure and composition; disrupting carbon, water, and nutrient cycles [1]; and undermining ecosystem service provisioning, including timber production, carbon storage, and wildlife habitat creation [3]. FIPs also have significant indirect impacts on forests by altering management practices, often initiating pre-emptive and salvage harvesting [4]. The northeastern United States is one of the most forested and most populated places on the continent, and northeastern forests are a globally important carbon sink and are expected to remain so into the next century [5]. However, the Northeast also has the largest abundance of exotic FIPs in North America and their numbers and impacts are predicted to increase with climate change and unchanged U.S. global trade policies [6]. The impacts of damaging FIPs and FIP-induced harvesting in the mixed forests of the Northeast threaten the status of these forests as a carbon sink and the combined impacts of FIPs and subsequent management responses are increasingly important to understand, despite the inherent challenge of predicting landowner response to FIPs.
In 2017, our interdisciplinary team surveyed private woodland owners (also referred to as family forest owners or non-industrial private forest owners) in the northeastern U.S.; approximately 84% of respondents indicated that they would harvest their trees in at least one of four presented forest insect invasion scenarios (see Appendix A) [7]. This management response to forest insects represents a potentially significant shift in the timing, extent, and species selection of harvesting in the Northeast. Timber harvesting is the primary driver of forest disturbance in the Northeast [8]; therefore, this shift in the harvest regime would change regional patterns of disturbance with potentially profound impacts on forest structure and function. Here we use the survey findings and regional forest inventory data to examine the potential for an emerging and rapidly spreading forest insect, the emerald ash borer (Species: Agrilus planipennis Fairmaire, 1888), to alter harvest regimes and affect regional forest conditions.
Salvage harvesting in response to disturbances, like forest insects, is commonly practiced to recover monetary value in affected timber or meet certain management goals [4]. Like all harvests, salvage harvests can alter forest development trajectories and change structural legacies with lasting impacts on biodiversity and ecosystem services [9]. Salvage harvests often occur after a stand disturbance event such as wind or fire, but, particularly in the case of forest insects, can occur preemptively in an attempt to mitigate future damage or value loss, or slow insect spread [10]. Here we use the term “insect-induced harvest” to refer to any harvest that is initiated either in anticipation of or in response to damage from a forest insect. One concern with insect-induced harvesting in mixed hardwood forests, like those in the Northeast, is the removal of the non-host tree species with the insect-host species to enhance the commercial viability of the harvest or to achieve other silvicultural objectives (e.g., regeneration of a desirable mix of species). The non-host species removals represent the impacts on species that would not have occurred without a human response to the invasive insect. For example, Irland et al. [11] reported landowners harvesting to mitigate damages from spruce budworm (Species: Choristoneura fumiferana Lederer, 1859) outbreaks in Maine, and those harvests also included tree species that were not the budworm’s primary regional hosts. Similarly, Kizlinski et al. [12] found that in harvests following hemlock woolly adelgid (Species: Adelges tsugae Annand, 1928) outbreaks in Connecticut and Massachusetts, species other than hemlock were removed in the majority of harvests.
In New England, private woodland owners control 84% percent of forested land and approximately 41% is owned by family forest owners (FFOs) [13], each with individual forest management and ownership objectives. Harvests in New England (other than Maine) are dominated by low-intensity, non-commercial harvests, but are still the primary driver of tree mortality in the region [14,15]. Kittredge and Thompson [16] found that the timing of harvests does not follow timber market trends, so most harvests on these woodlands are likely initiated by an exogenous force, such as a family event, change in income, or forest management plan. The results from our survey of FFOs (Appendix A) indicate that 84% of respondents would harvest in at least one forest insect invasion scenario [7], suggesting that forest insects may serve as an important force for initiating harvesting, resulting in a regional disturbance regime that may be distinct from either that of the forest insects or typical harvesting individually.
The survey used a contingent behavior conjoint experiment to understand what might influence FFOs with parcels > 4 ha (10 ac) in the Connecticut River Watershed of New England intent to harvest in response to a generic forest insect [7]. Respondents were given four scenarios of a forest insect arrival and tree mortality and responded whether they would harvest in each scenario and provided a measure of certainty in their answer (Appendix A). The respondents of the survey were classified into three categories: (1) Cutters (46% of respondents)—those that responded they would harvest for all four insect scenarios; (2) Responsive Cutters (42%)—those that responded they would harvest in some of the scenarios presented; and (3) Non-cutters (12%)—those that would not harvest in any of the scenarios presented [7,17]. These categories of respondents served as the basis for three agent functional types (Cutters, Responsive Cutters, and Non-cutters) that we characterized using the different landowner responses to the presence of a generic forest insect [17] (Appendix B). We then used geographic land cover and demographic data at the parcel and town level to create a predictive model for these agent functional types [17] (Appendix B). Predicting agent functional types for FFO parcels in the Connecticut River Watershed did not require knowing specific forest insect invasion characteristics; however, we found that the likelihood of harvesting in response to a forest insect for each parcel in an agent functional type relied on specific insect characteristics [17] (Appendix B). Here, we apply our knowledge of FFO response to forest insects and the developed agent functional types to the specific case of emerald ash borer (EAB) to determine the potential direct and indirect impacts on the mixed forests of the Connecticut River Watershed.
EAB is an introduced woodboring insect from Asia that attacks North American ash (Fraxinus spp.). Since its initial discovery in Michigan in 2002 [18], EAB has become the costliest exotic insect in the U.S. to date [19]. EAB typically kills ash trees in four to ten years after initial stand invasion and has caused 99% mortality of ash trees > 2.5 cm in diameter in areas surrounding the initial introduction of EAB in Michigan [18,20], although recent studies have noted local variation in mortality [21]. Regionally, EAB has caused significant biomass loss [22,23], and changes to nutrient cycling and successional dynamics [20,24,25]. EAB was first observed in New England in 2012 and the leading edge of the invasion is spreading at an average rate of 57 km/year [26], though variable by local conditions [27], suggesting that EAB will be distributed patchily throughout the entire region in the next decade, or roughly by 2030. Since EAB was first identified in New England, there has been an increase in the ash component reported in cutting plans submitted in Massachusetts (which has the most comprehensive and accessible set of documented cutting plans for our study area), as well as an increase in ash stumpage value, indicating that while there is increasing availability of ash timber, there has not yet been a subsequent decrease in value.
Indeed, EAB has the potential to cause regional elimination of this ecologically, economically, and aesthetically important hardwood species [18,20]. Information from loggers, foresters, and state agencies indicates that EAB is already prompting harvests and ash thinning as a way to attempt to slow the spread of EAB, limit financial and tree loss, and promote the regeneration of ash through larger gap silvicultural treatments (e.g., [28,29,30]). Ash often exists in relatively low abundance (averaging 5.5% in New England forests, though patchy based on local conditions) [31]. Therefore, given the volume and varied objectives of typical harvests in the region, harvests initiated by the presence of EAB are likely to remove more than the affected ash. Here we: (1) apply the results of a contingent behavior conjoint experiment to estimate a range of harvest responses to EAB based on the distribution of owner types and EAB invasion characteristics; and (2) quantify the resulting impact on regional forest biomass and composition.

2. Materials and Methods

2.1. Study Area and Spatial Data

We conducted our study on the >90,000 FFO parcels in the Connecticut River Watershed, a 3-million-ha watershed within New Hampshire, Vermont, Massachusetts, and Connecticut (Figure 1). We limited our study to FFO parcels as they represented the largest block of owners in the region and we wanted to focus our analysis on the complex FFO response to forest insects. We compiled ownership parcel boundaries for the Connecticut River Watershed from: state-level GIS sources, county and/or town websites, and tax maps. Where parcel maps were unavailable, we imputed parcel boundaries from neighboring towns with similar demographic and spatial distributions (approx. 12% of the landscape). A map of tree species-specific aboveground biomass (AGB) was estimated following the methods in Duveneck et al. [32] to associate each pixel with Forest Inventory Analysis (FIA) [31] plots with similar spectral and environmental characteristics. We used this forest map to estimate the impacts of forest insects and subsequent harvest, as well as to determine which tree species co-occur with ash and therefore may be most impacted by the harvest response to EAB (Table 1). For this study, we used the distribution of white ash (Species: Fraxinus americana Linnaeus, c. 1758) to look at management response to EAB, which is the most abundant ash species in the Connecticut River Watershed, making up >99% of total ash biomass, and is the most likely ash species to be harvested.

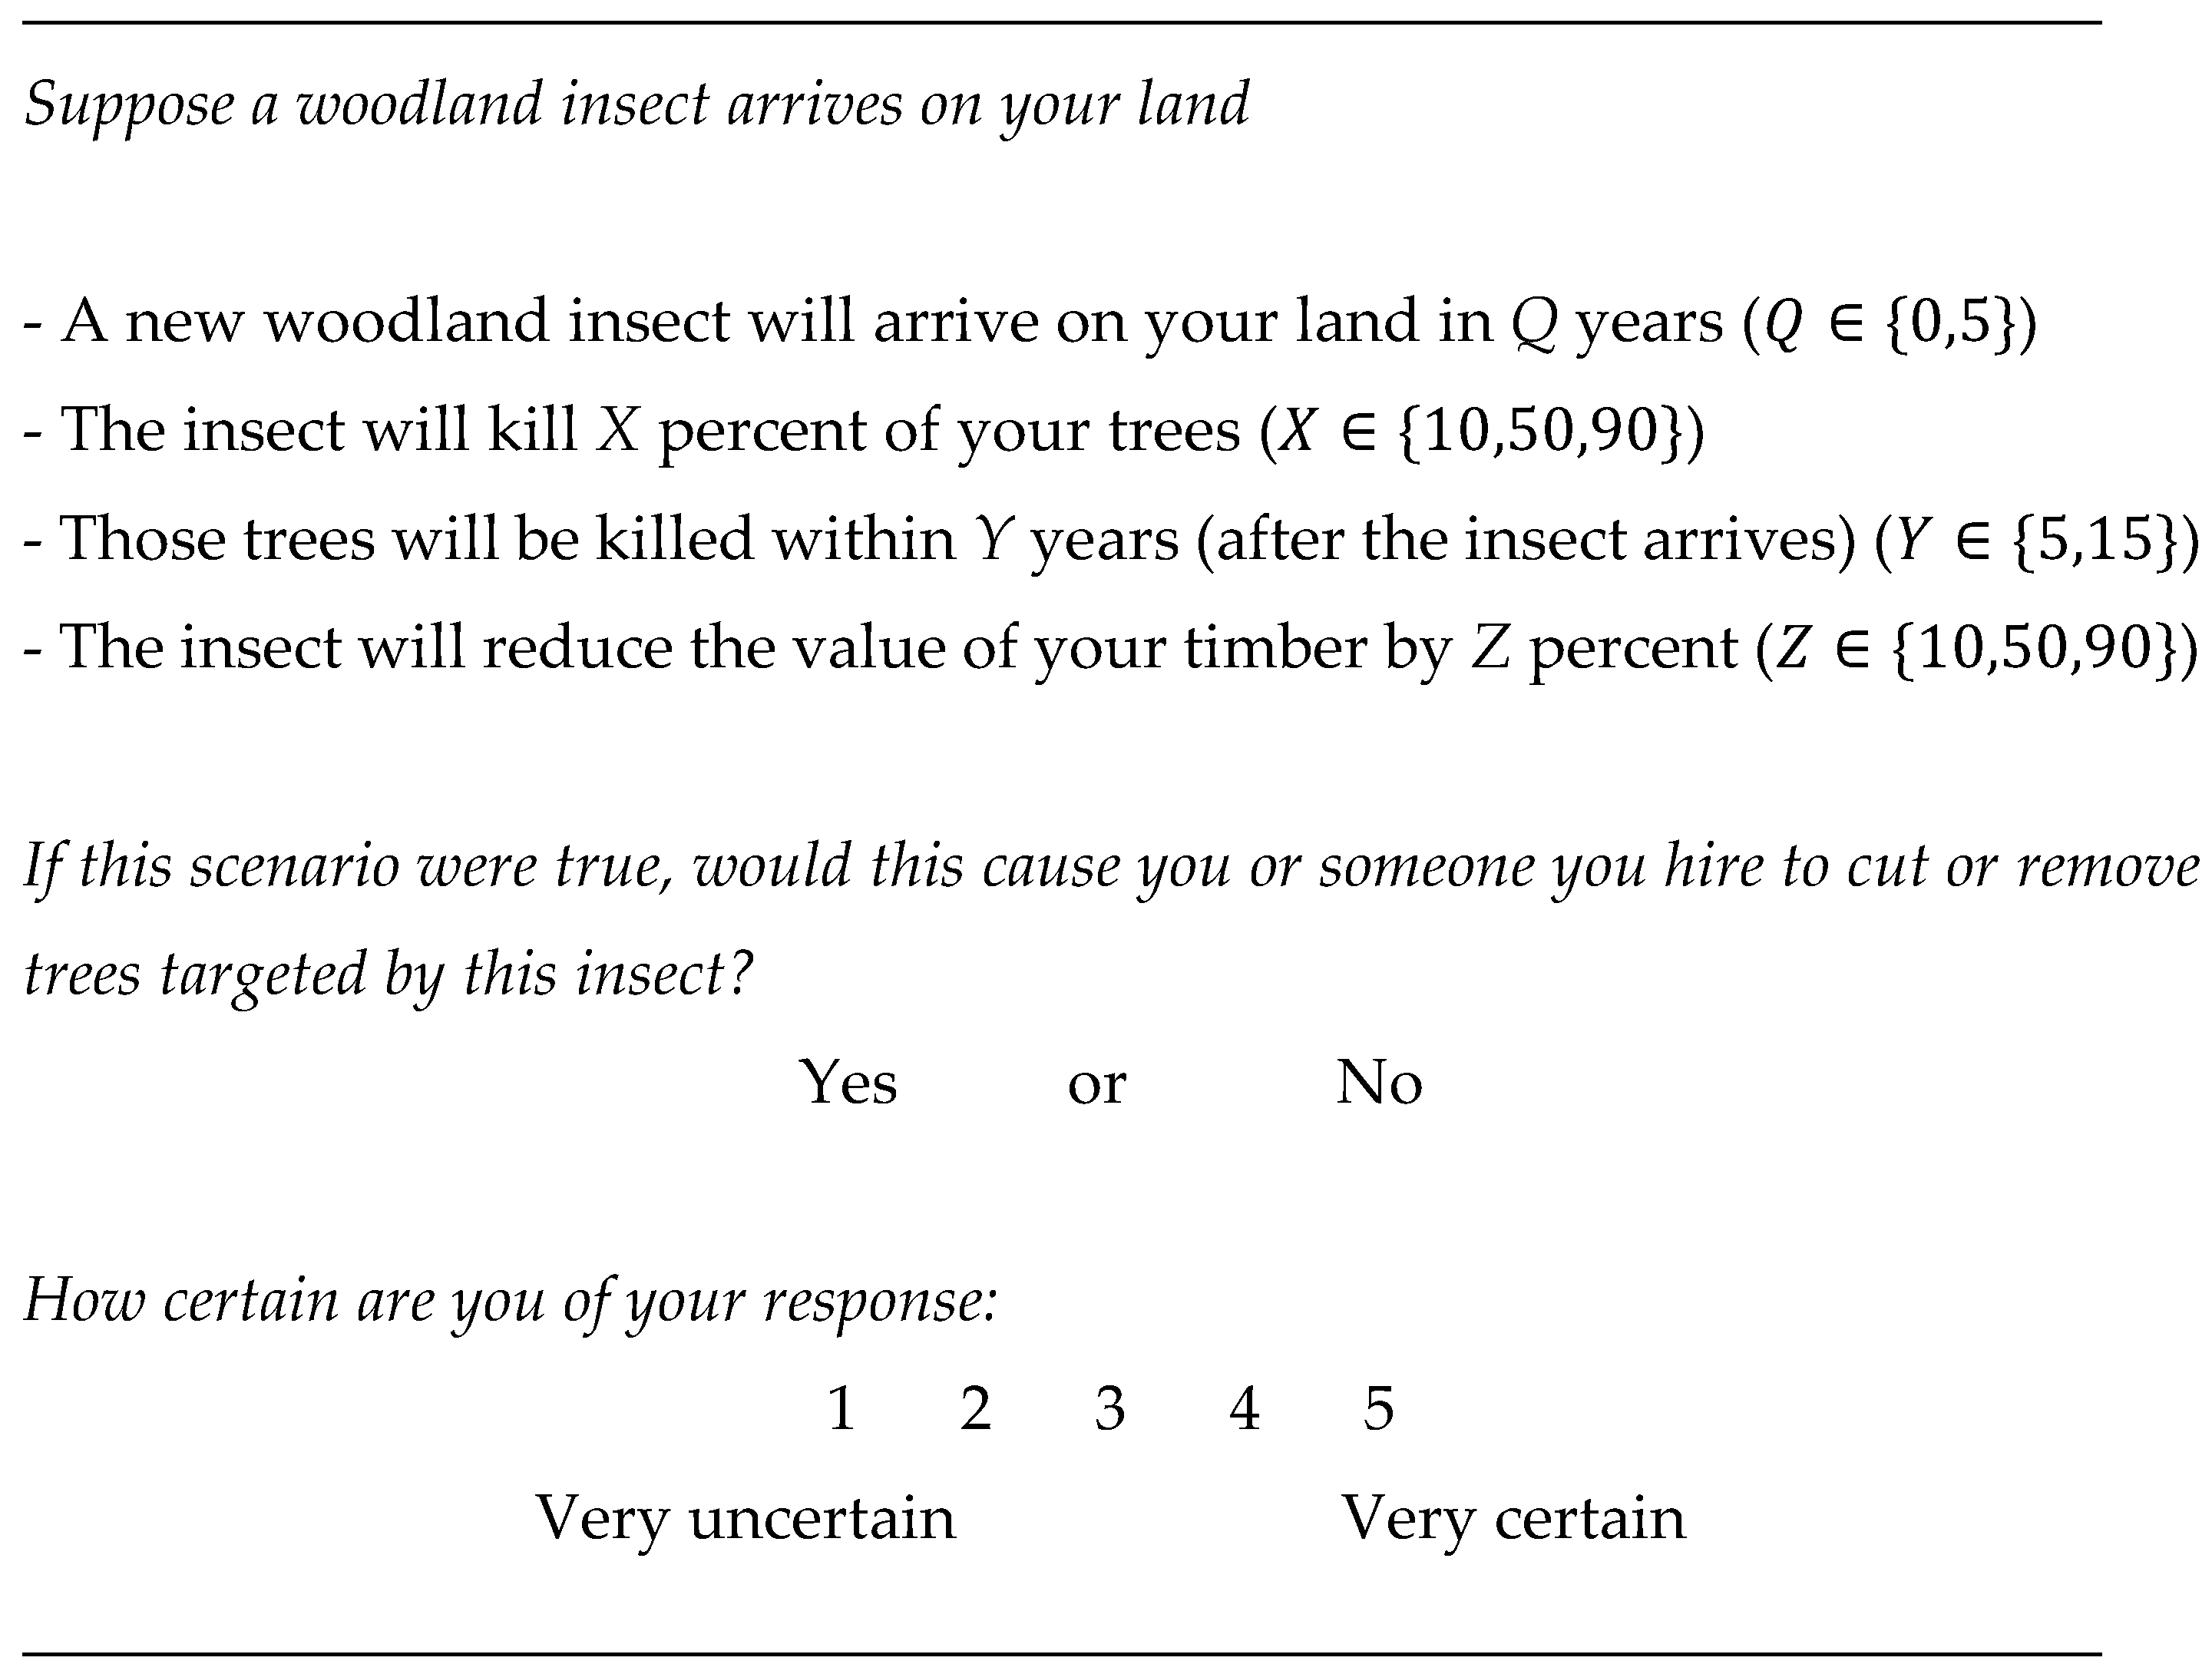
2.2. Determining Harvest Response to Emerald Ash Borer

In this region, most harvests on private woodlands are low intensity (i.e., non-commercial) harvests, but are ecologically important drivers of forest change [14,15]. Therefore, when modeling the harvest response to EAB, we assumed the range of possible harvest responses included commercial and non-commercial harvests. We also assumed that EAB was present in populations throughout the study area at high enough densities to initiate management responses throughout the watershed (at its current rate of spread, this assumption will likely be met within one decade) [26]. We used the models presented in Holt et al. [17] and Appendix B to assign agent functional types to all FFO parcels greater than 4 ha in size in the Connecticut River Watershed (Figure 2a). As described in Holt et al. [17], larger parcels (>20 ha) or any parcels in NH (as identified using a classification and regression tree method with states as a possible predictor variable) were more likely to end up in a “cutter” type class (i.e., Cutter or Responsive Cutter types) with larger amounts of forested land on their parcel. Smaller parcels (<20 ha) from all other states were more likely to end up in a “cutter” type class with larger amounts of forest both on their parcel and in their town (Figure 2a). Each parcel with ash was then assigned a probability of harvest based on the assigned agent functional type and parcel characteristics (Figure 2a).
Since the Cutter and Non-cutter type respondents were not sensitive to the presented forest insect infestation scenarios, parcels in the Cutter (likely to harvest) and the Non-cutter (unlikely to harvest) agent functional types were assigned a probability of harvest based on the distribution of certainty of harvest from the survey responses of those groups. For example, Cutter respondents had a certainty of harvest ranging from 1 to 0.5 where a respondent that consistently ranked their responses as “very certain” would have a certainty of harvest of 1, while another Cutter respondent that was consistently “very uncertain” in their responses would have a certainty of harvest of 0.5. Likewise, Non-cutter respondents were given a certainty of harvest between 0 and 0.5, where 0 represents a Non-cutter respondent that consistently ranked their responses as “very certain”, while another respondent with lower certainty in their responses would have a certainty of harvest closer to 0.5. Beta distributions were fit to these data and then Cutter and Non-cutter parcels were stochastically assigned individual harvest probabilities from their respective distributions (Figure 2a). Including the response certainty in our models of harvest probability allowed us to incorporate variability in response beyond the traditional binary yes/no models of harvest response [33,34].
The probability of harvest for Responsive Cutters was based on: (1) the percentage of trees killed by the forest insect (mortality percent); and (2) the time it would take for those trees to die (Figure 2a; see Appendix B) [17]. A higher mortality percent and more rapid tree death both increased the likelihood that a Responsive Cutter would harvest. For this application of Holt et al.’s [17] model, the mortality percentage was the relative abundance of ash on each individual parcel; so the higher the ash abundance, the higher the probability of harvest, and conversely the lower the ash abundance, the lower the probability of harvest. We also made the conservative assumption of eight years to mortality from initial ash tree invasion. Using these methods, each parcel was assigned a harvest probability unique to its agent functional type and parcel characteristics (Figure 2a). The probabilities of harvest were then stochastically used to assign either “Harvest” or “No harvest” to each parcel (Figure 2b). The process of assigning agent functional types, probabilities of harvest, and finally harvest locations was replicated 10 times to capture the variability in assigning harvest locations.

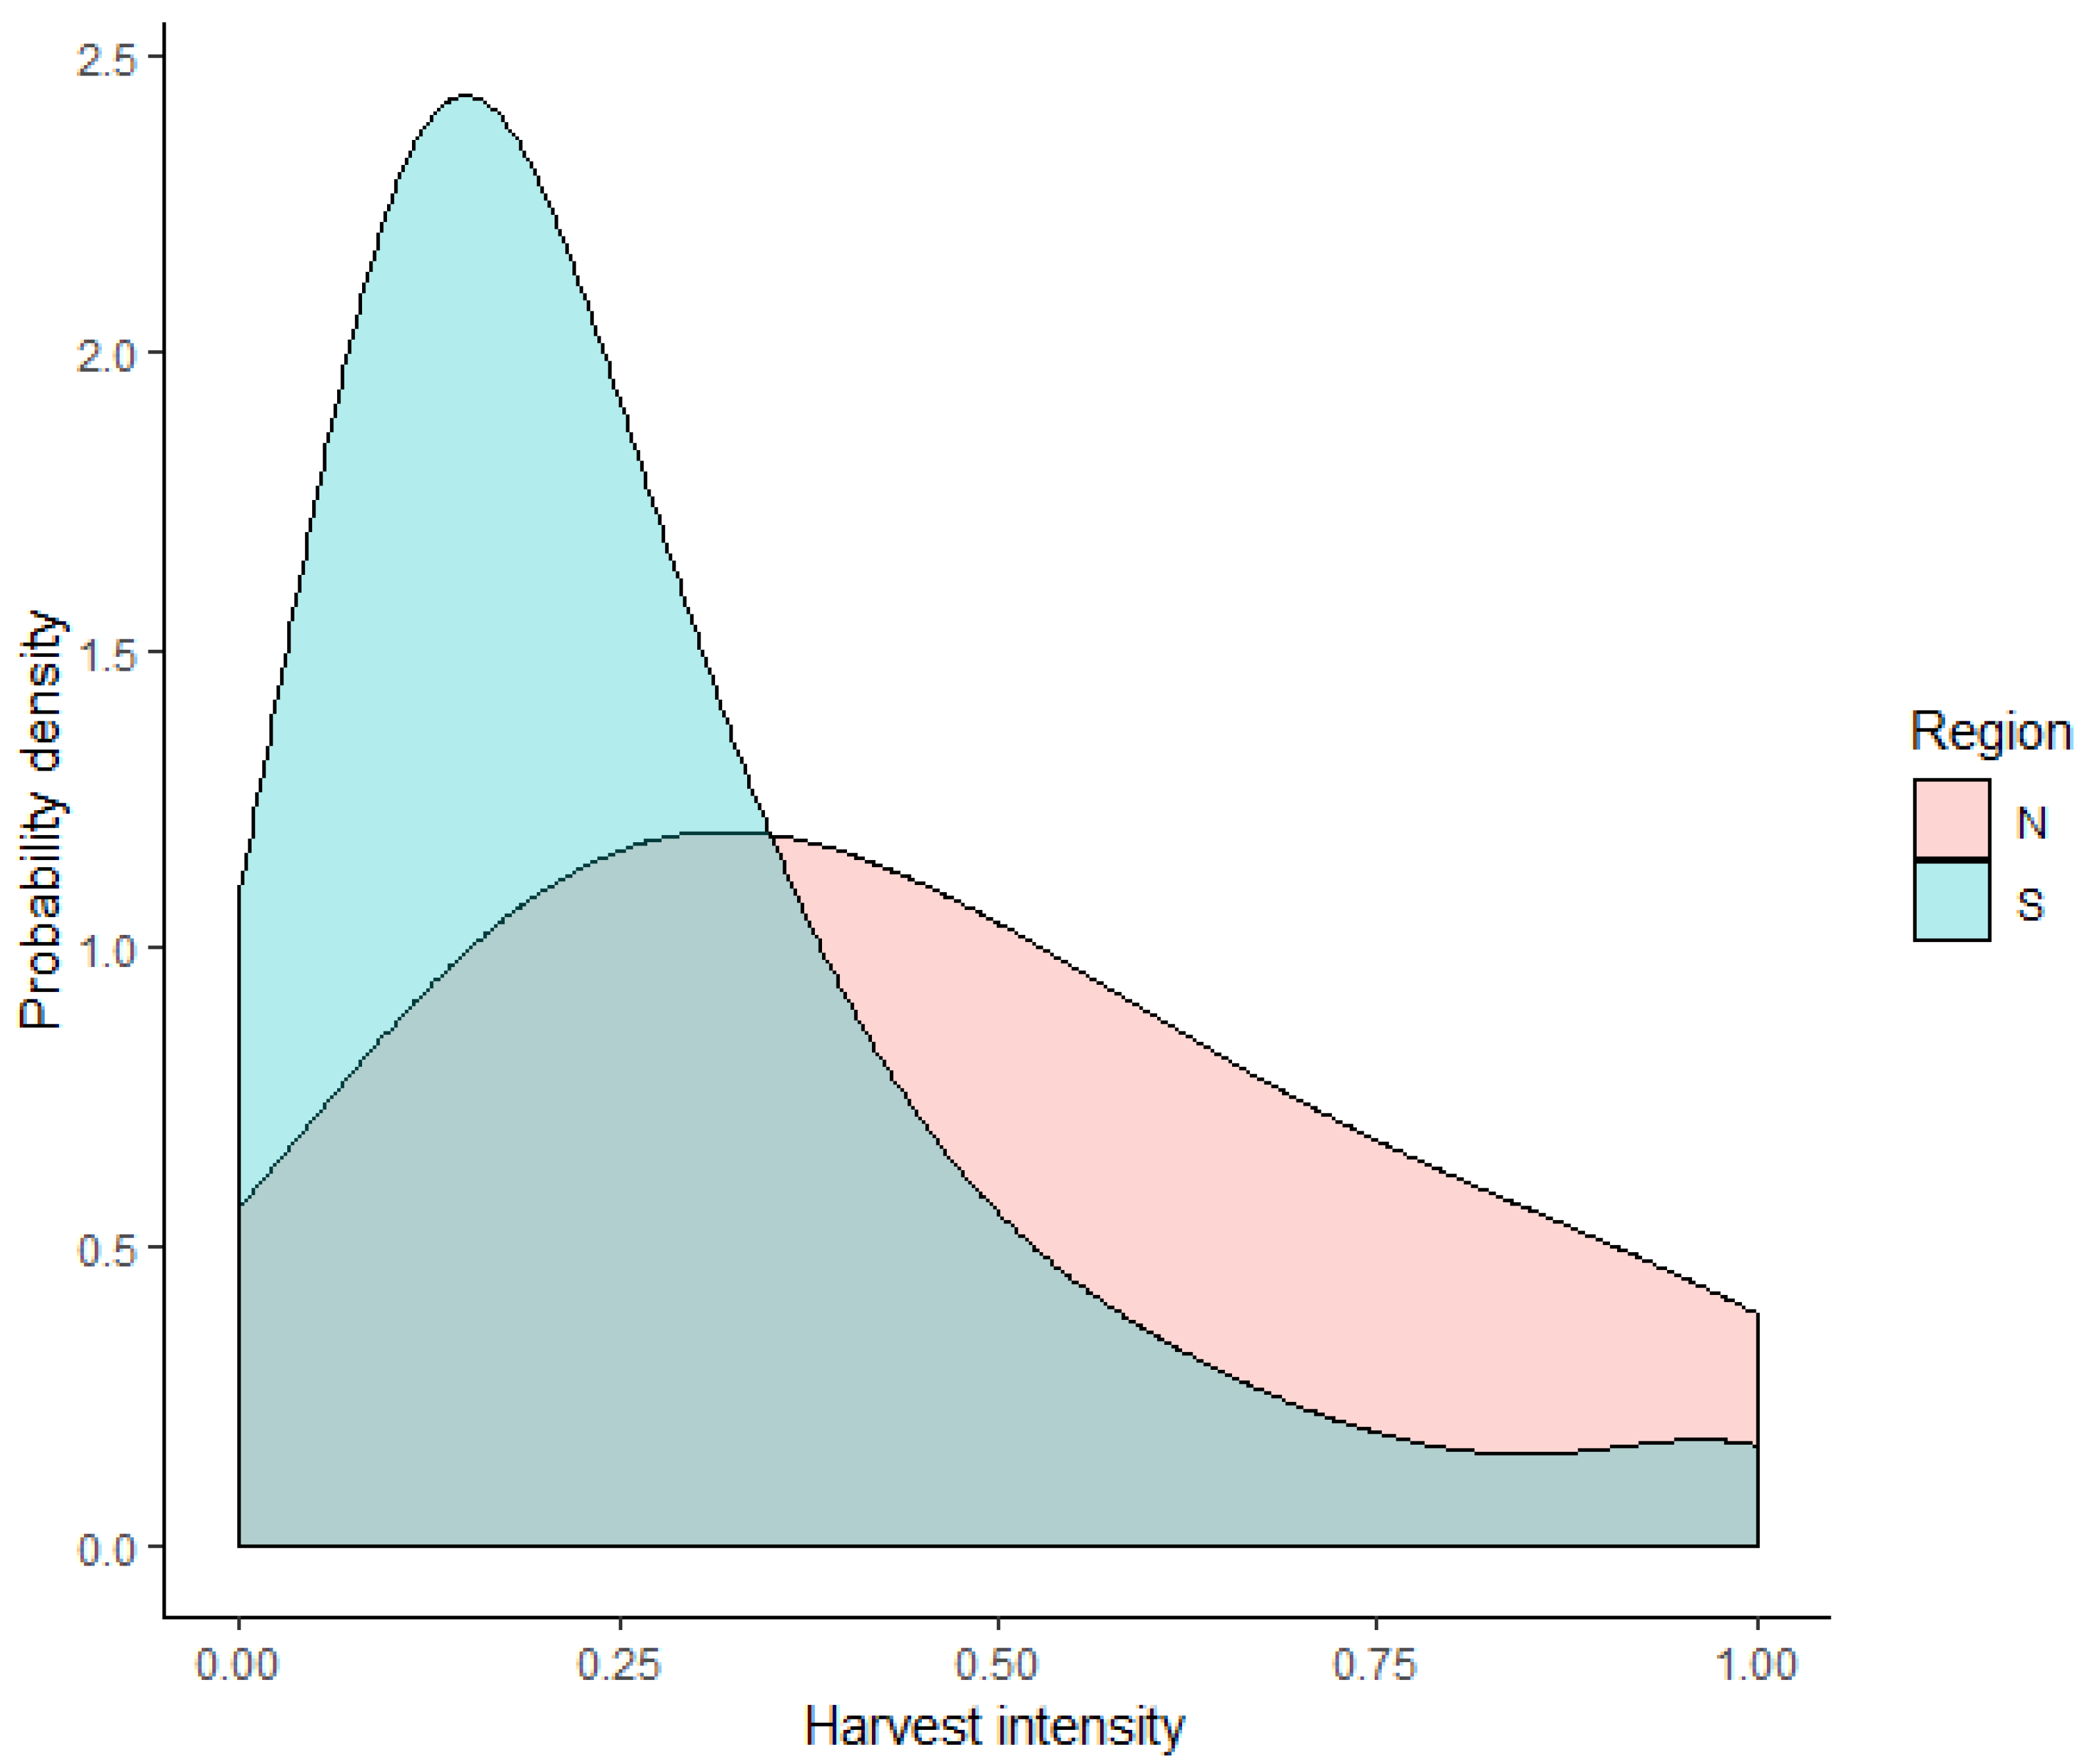
2.3. Modeling Harvest Intensities

Subsequently, to mimic typical harvest intensities across the landscape, we assigned a harvest intensity (AGB removed/AGB prior to harvest) to each harvested parcel, regardless of size or composition. We compiled harvest intensities from re-measured FIA plots in NH, VT, MA, and CT to determine what constitutes a “typical harvest” intensity for FFO harvests. We included all harvests, from very low intensity removals to clear-cuts, since we assumed all possible harvest types could occur in response to EAB. In total, approximately 5% of the saw log size trees from the two most recent remeasurement periods were removed by harvest. An exploration of the harvest intensities per harvest revealed that they were more intense in northern Vermont and northern New Hampshire (as defined in the FIA state data) when compared to the rest of the Connecticut River Watershed, and there was no relationship between harvest intensity and parcel size. The average harvest intensity of the northern region (N; northern VT and northern NH) was 46% of the total AGB removed per harvest (n = 91, re-measured FIA plots), and the southern region (S; MA, CT, and the rest of VT and NH) had an average harvest intensity of 27% (n = 120, re-measured FIA plots). The distributions of the harvest intensities captured by the FIA were also different. Therefore, multiple distributions to model the harvest intensity were tested (e.g., gamma, Weibull, lognormal, Cauchy, exponential), and the best fit was determined using the Akaike information criterion (AIC) [35] for each region independently. For the northern region, a Weibull distribution (shape = 1.49, scale = 0.512) was the best fit for harvest intensities observed in the FIA (AIC = 26.82, ΔAIC = 2.16). For the southern region, a lognormal distribution (mean = −1.61, sd = 0.831) was the best fit for the distribution of harvests in that region (AIC = −86.70, ΔAIC = 1.66). These harvest intensity distributions were used to allocate unique harvest intensities to each parcel in each of the 10 replicate Harvest/No harvest maps. The total biomass removed in each of the 10 replicates was averaged and reported with standard deviation as a measure of how much variability is induced by the process of applying harvest probabilities, harvests, and harvest intensities to the parcels.

2.4. Quantifying Cumulative Impacts of EAB

We used the forest composition biomass map and the 10 simulated Harvest/No harvest maps to estimate species AGB removal in EAB-initiated FFO harvests. Our estimates include the AGB of merchantable timber trees (i.e., larger than 23 cm (9 in) diameter at breast height (dbh) for softwoods and 28 cm (11 in) dbh for hardwoods) and only parcels that met the criteria for our survey (i.e., FFO parcels > 4 ha). We also set a minimum forest area size of 3.15 ha on mixed land use parcels to ensure enough forest for measurable tree removal and viable operational size for harvest. To account for the uncertainty regarding the specific silvicultural choices made by foresters and loggers, we examined four alternative harvest scenarios and reported the total AGB and species-specific AGB that could be harvested in response to EAB. These four harvest scenarios are described below.

2.4.1. Scenario A: Host Removal Only; No Additional Harvesting

In this scenario, we assumed landowners only removed the host (ash) in the insect-induced harvests without removing any other trees from their parcel. This scenario represents the lower bound in the harvest response to EAB.

2.4.2. Scenario B: Typical Harvest Intensities and No Species Preferences

Scenario B assumed that the presence of a forest insect is an exogenous force that initiates a typical intensity FFO harvest. As some state agencies and interest groups recommend removing healthy ash just prior to invasion (e.g., see NHBugs.org), some landowners choose to pre-emptively harvest ash, which may indeed result in a more planned and typical intensity harvest than a reactionary harvest after invasion. Furthermore, the harvests in this scenario did not make any assumptions about the silvicultural prescriptions applied within each harvest and did not differentially remove certain species over others. To mimic an EAB-initiated harvest with no assumptions about harvest species preference, all merchantable ash timber was first removed from the parcel, then any remaining timber was removed proportionally from all other species until the target harvest intensity was met (which is unique to each harvested parcel). Where the total volume of ash on a parcel exceeded the necessary volume for the target harvest intensity, all merchantable ash was removed, but no more.

2.4.3. Scenario C: Typical Harvest Intensities and Value-Driven Species Preferences

Scenario C differentially harvests tree species based on the value of species within each of our harvest regions (N—Northern VT and NH; S—all other areas in the Connecticut River Watershed). In this scenario, the assigned parcel harvest intensities were the same as in Scenario B, but the amount of biomass needed to meet the harvest intensity (after ash was removed) was met by removing valuable species on the parcel, as determined by stumpage reports from the Connecticut River Watershed states (see Appendix C) and the list of primary species for harvest for the Northeast from Belair and Ducey [14]. Like Scenario B, all ash was first removed from the parcel, but then the remainder of the AGB was removed by species in order of their mean timber value for each harvest region (N or S), until the required biomass was removed to meet the target intensity (Table A1). By removing species in order of value but without altering harvest intensity, we attempted to mimic value-driven harvests (i.e., intensity-limited high-grading) with little planning for future forests to determine how preferential species removal might impact forest composition following EAB-initiated harvests.

2.4.4. Scenario D: Atypical High-Grading

In Scenario D, we examined the possibility that harvest prompted by EAB will result in a worst-case scenario of unencumbered high-grading across the landscape. This scenario gives an upper bound of harvesting responses to EAB that could influence AGB and composition. Like in Scenario C, we removed species in order of value (Table A1) but without limiting removals based on a target harvest intensity. Therefore, in all parcels assigned a harvest, all ash is removed, as well as all species with timber value (see Appendix C) in that parcel.

3. Results

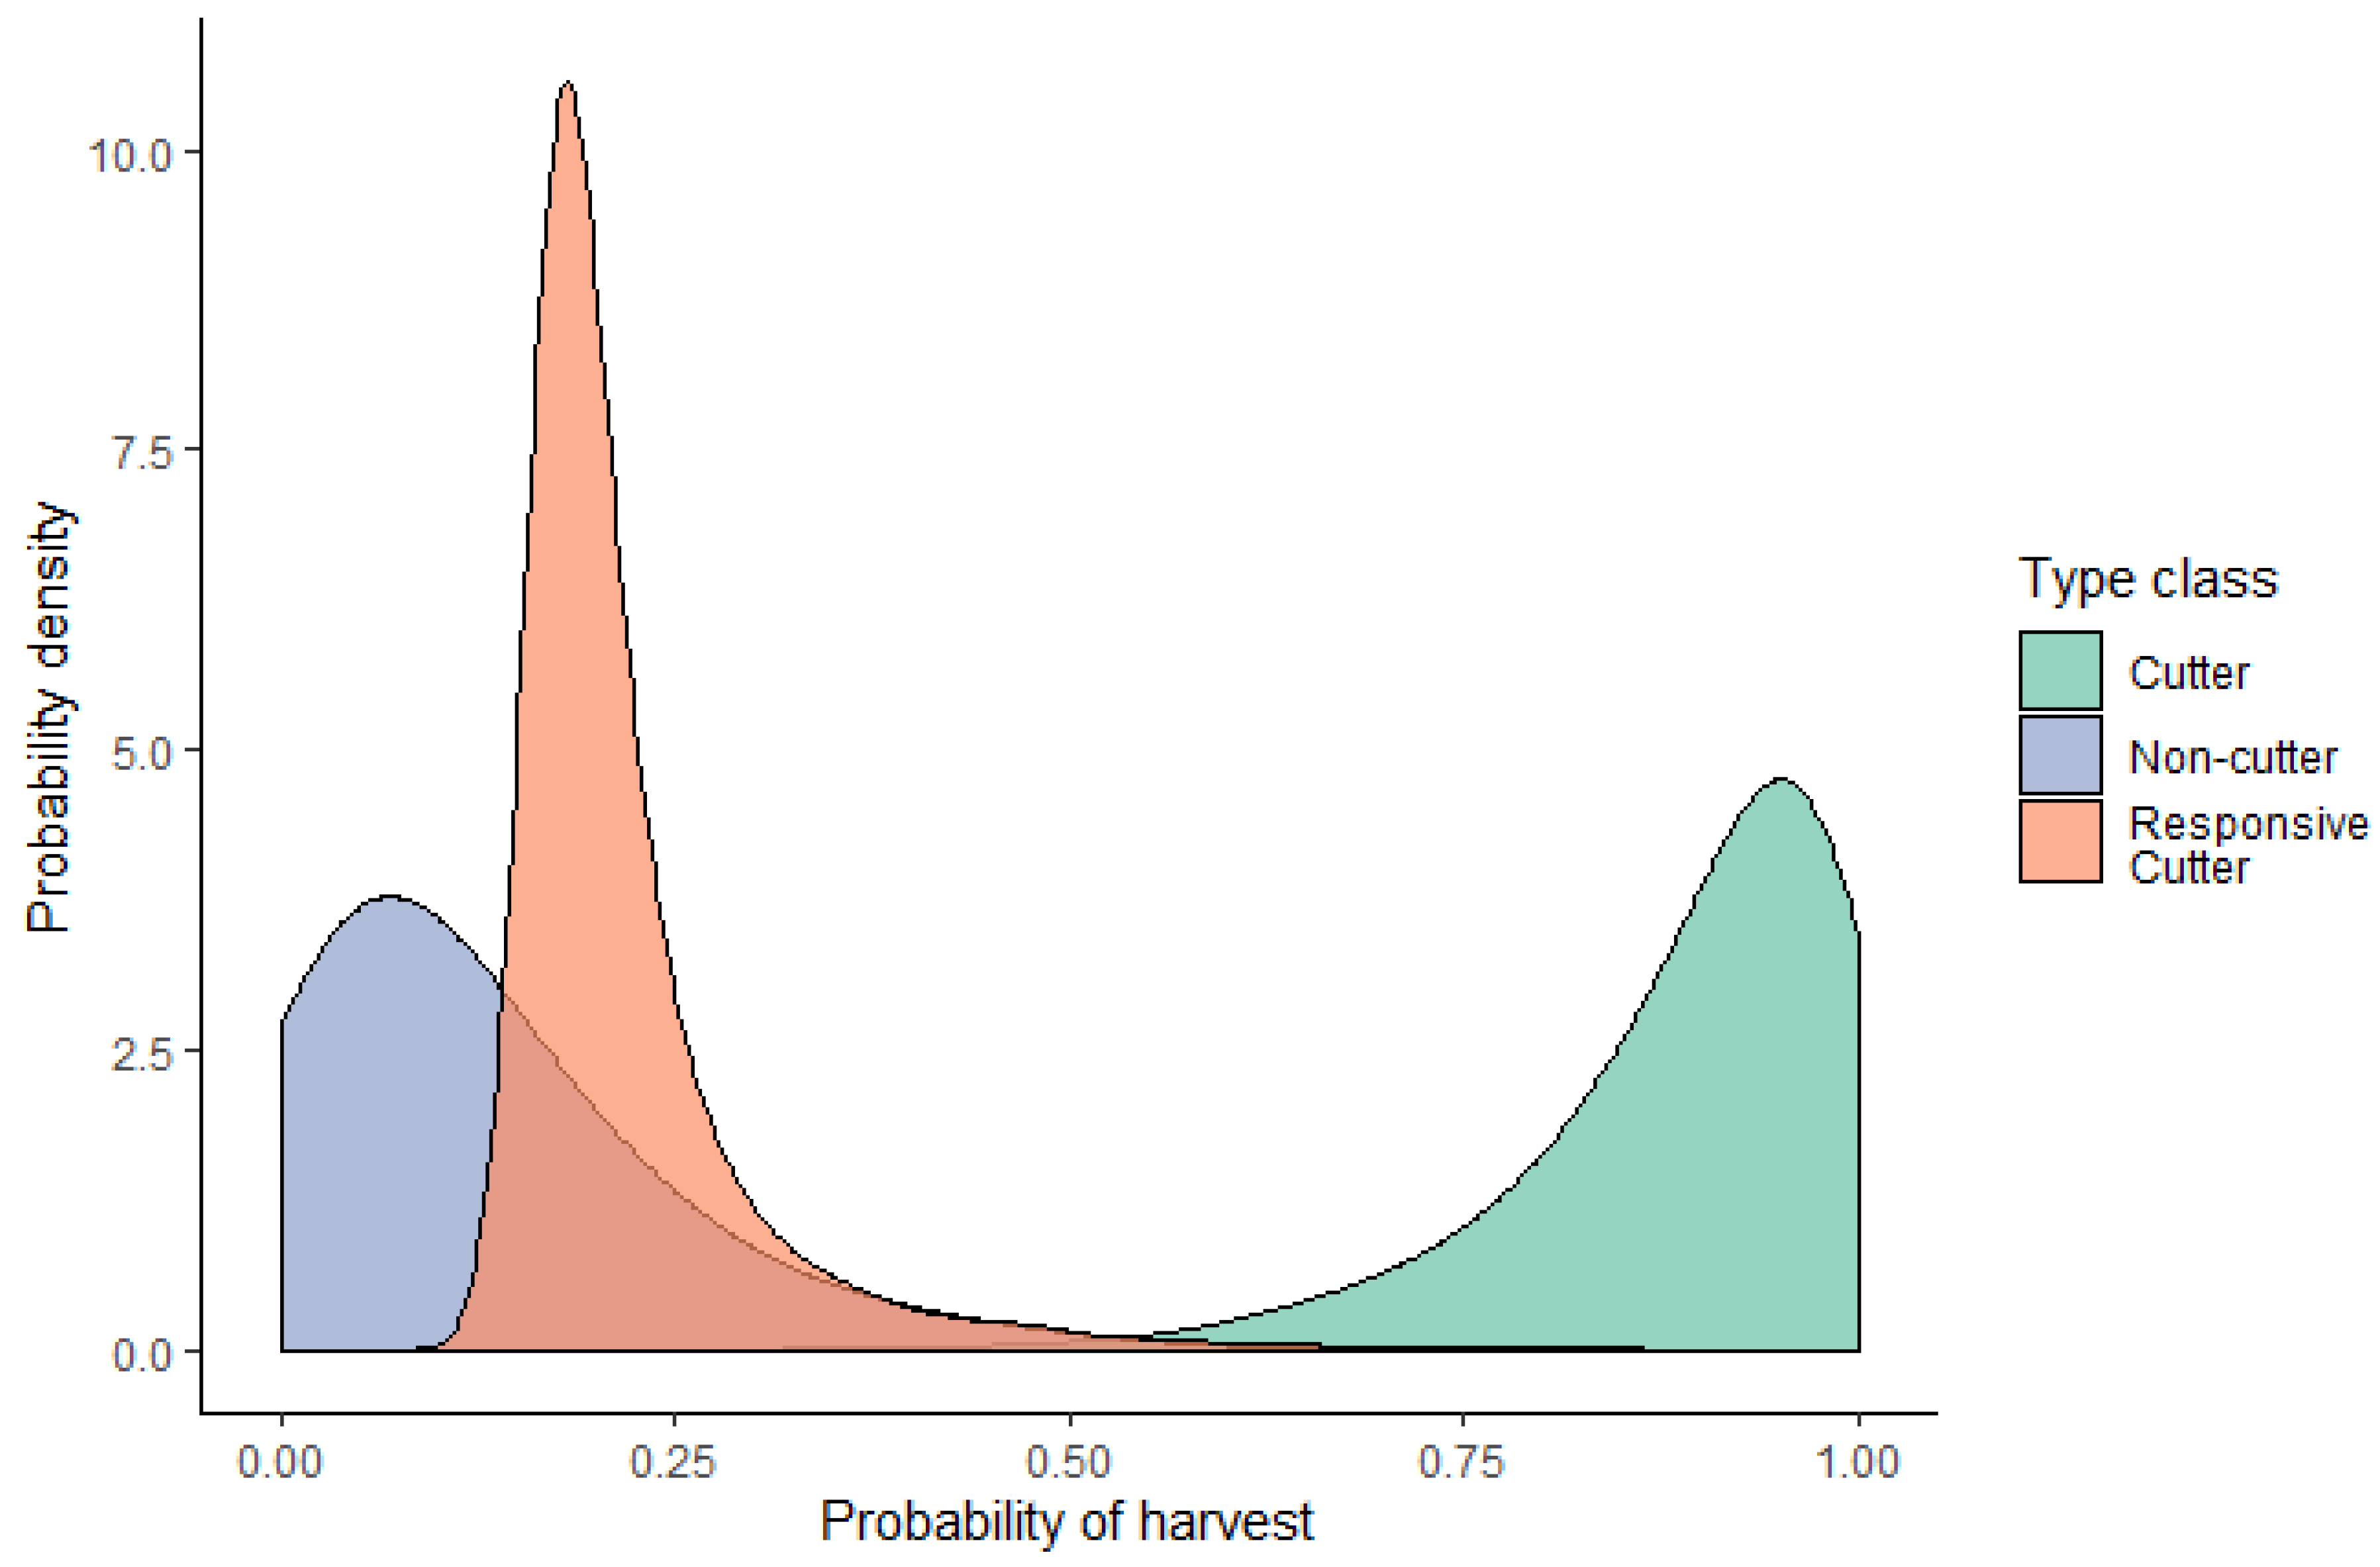
3.1. Estimating the Range of Responses to EAB

In total, 80,010 FFO parcels met the area requirements for harvest consideration in response to EAB and, of these, 40,419 parcels contained merchantable ash timber. Of these parcels, 49.5% contained less than 5.5% ash by biomass, 40.8% had between 5.5% and 20% ash abundance, and 9.7% had more than 20% ash. All measures of application of the AFTs, probabilities of harvest, assignment of harvest, harvest intensities, and biomass removed were averaged across all 10 replicates of the model. Standard deviations represent the variability of the mean across all 10 replicates. Generally, standard deviations were relatively small, indicating the application of the stochastic components of the model resulted in similar results.
On average, 42% ± 0.2% (mean ± sd) of the parcels with ash were assigned to the Cutter landowner type class; 44% ± 0.1% were Responsive Cutters; and 14% ± 0.1% were Non-cutters. The average probability of harvest for Cutters was 0.89 ± 0.003, 0.22 ± 0.004 for Responsive Cutters, and 0.12 ± 0.004 for Non-cutters (Figure 3). On average, 25% ± 0.07% (19,705 ± 55 parcels) of the parcels that met the area requirements for harvesting (with or without ash) were harvested, equating to 37% ± 0.7% of the forested area of all FFO parcels in the watershed, since larger parcels were more likely to end up in the Cutter or Responsive Cutter classes. Approximately 77% ± 0.3% of all the assigned harvests occur on Cutter parcels, 19% ± 0.3% on Responsive Cutter parcels, and 4% ± 0.1% on Non-cutter parcels. Harvest intensities also vary by location within the Connecticut River Watershed. For Scenarios B and C, the average harvest intensity applied to harvested parcels in the northern region was 45% ± 28%, and the average harvest intensity applied to the southern region was 27% ± 22% (Figure 4).

3.2. Quantifying the Impact of Insect-Induced Harvest on Regional Forest Biomass

The imputation of FIA plots within harvestable FFO parcels resulted in 8.1 Tg of merchantable white ash biomass in the Connecticut River Watershed. Approximately 54% ± 2.4% (4.4 ± 0.2 Tg) of that ash was removed from the landscape through harvest in all simulation scenarios, including Scenario A, where only ash was removed (Table 2). Ash harvesting in response to EAB removed approximately 2.4% ± 0.1% of the total AGB in all FFO parcels in the Connecticut River Watershed (not just those that were harvested). In Scenario B, where typical harvest intensities were assigned to each harvest, but no species preference was assigned, an additional 19.2 ± 1.8 Tg of AGB was harvested from co-occurring species as compared to Scenario A (Table 2), with higher percentages of removals from the species that co-occurred more frequently with ash (Table 1), or are more northernly species (where harvest intensities are higher). In this scenario, 13% ± 1.0% of the total AGB in all FFO parcels in the Connecticut River Watershed was harvested in response to EAB.
In Scenario C, a similar amount of biomass was removed as in Scenario B, since the same harvest intensities were applied to each parcel. However, since harvesting was limited to the valuable timber species defined for each region (Appendix C), the total biomass and the amount of each species removed differed from Scenario B. In this scenario, 16.3 ± 2.0 Tg of AGB was harvested from co-occurring species, in total removing 12% ± 1.1% of the total AGB in all FFO parcels (Table 2), with the highest percent removals from the species that are most valuable. In Scenario D, where all valuable species were removed from the harvested parcels, 24% ± 1.3% of the total AGB in FFO parcels was harvested, with 38.8 ± 2.3 Tg of AGB harvested from co-occurring species (Table 2). The higher percent removals are from species that frequently occur with ash and have timber value.

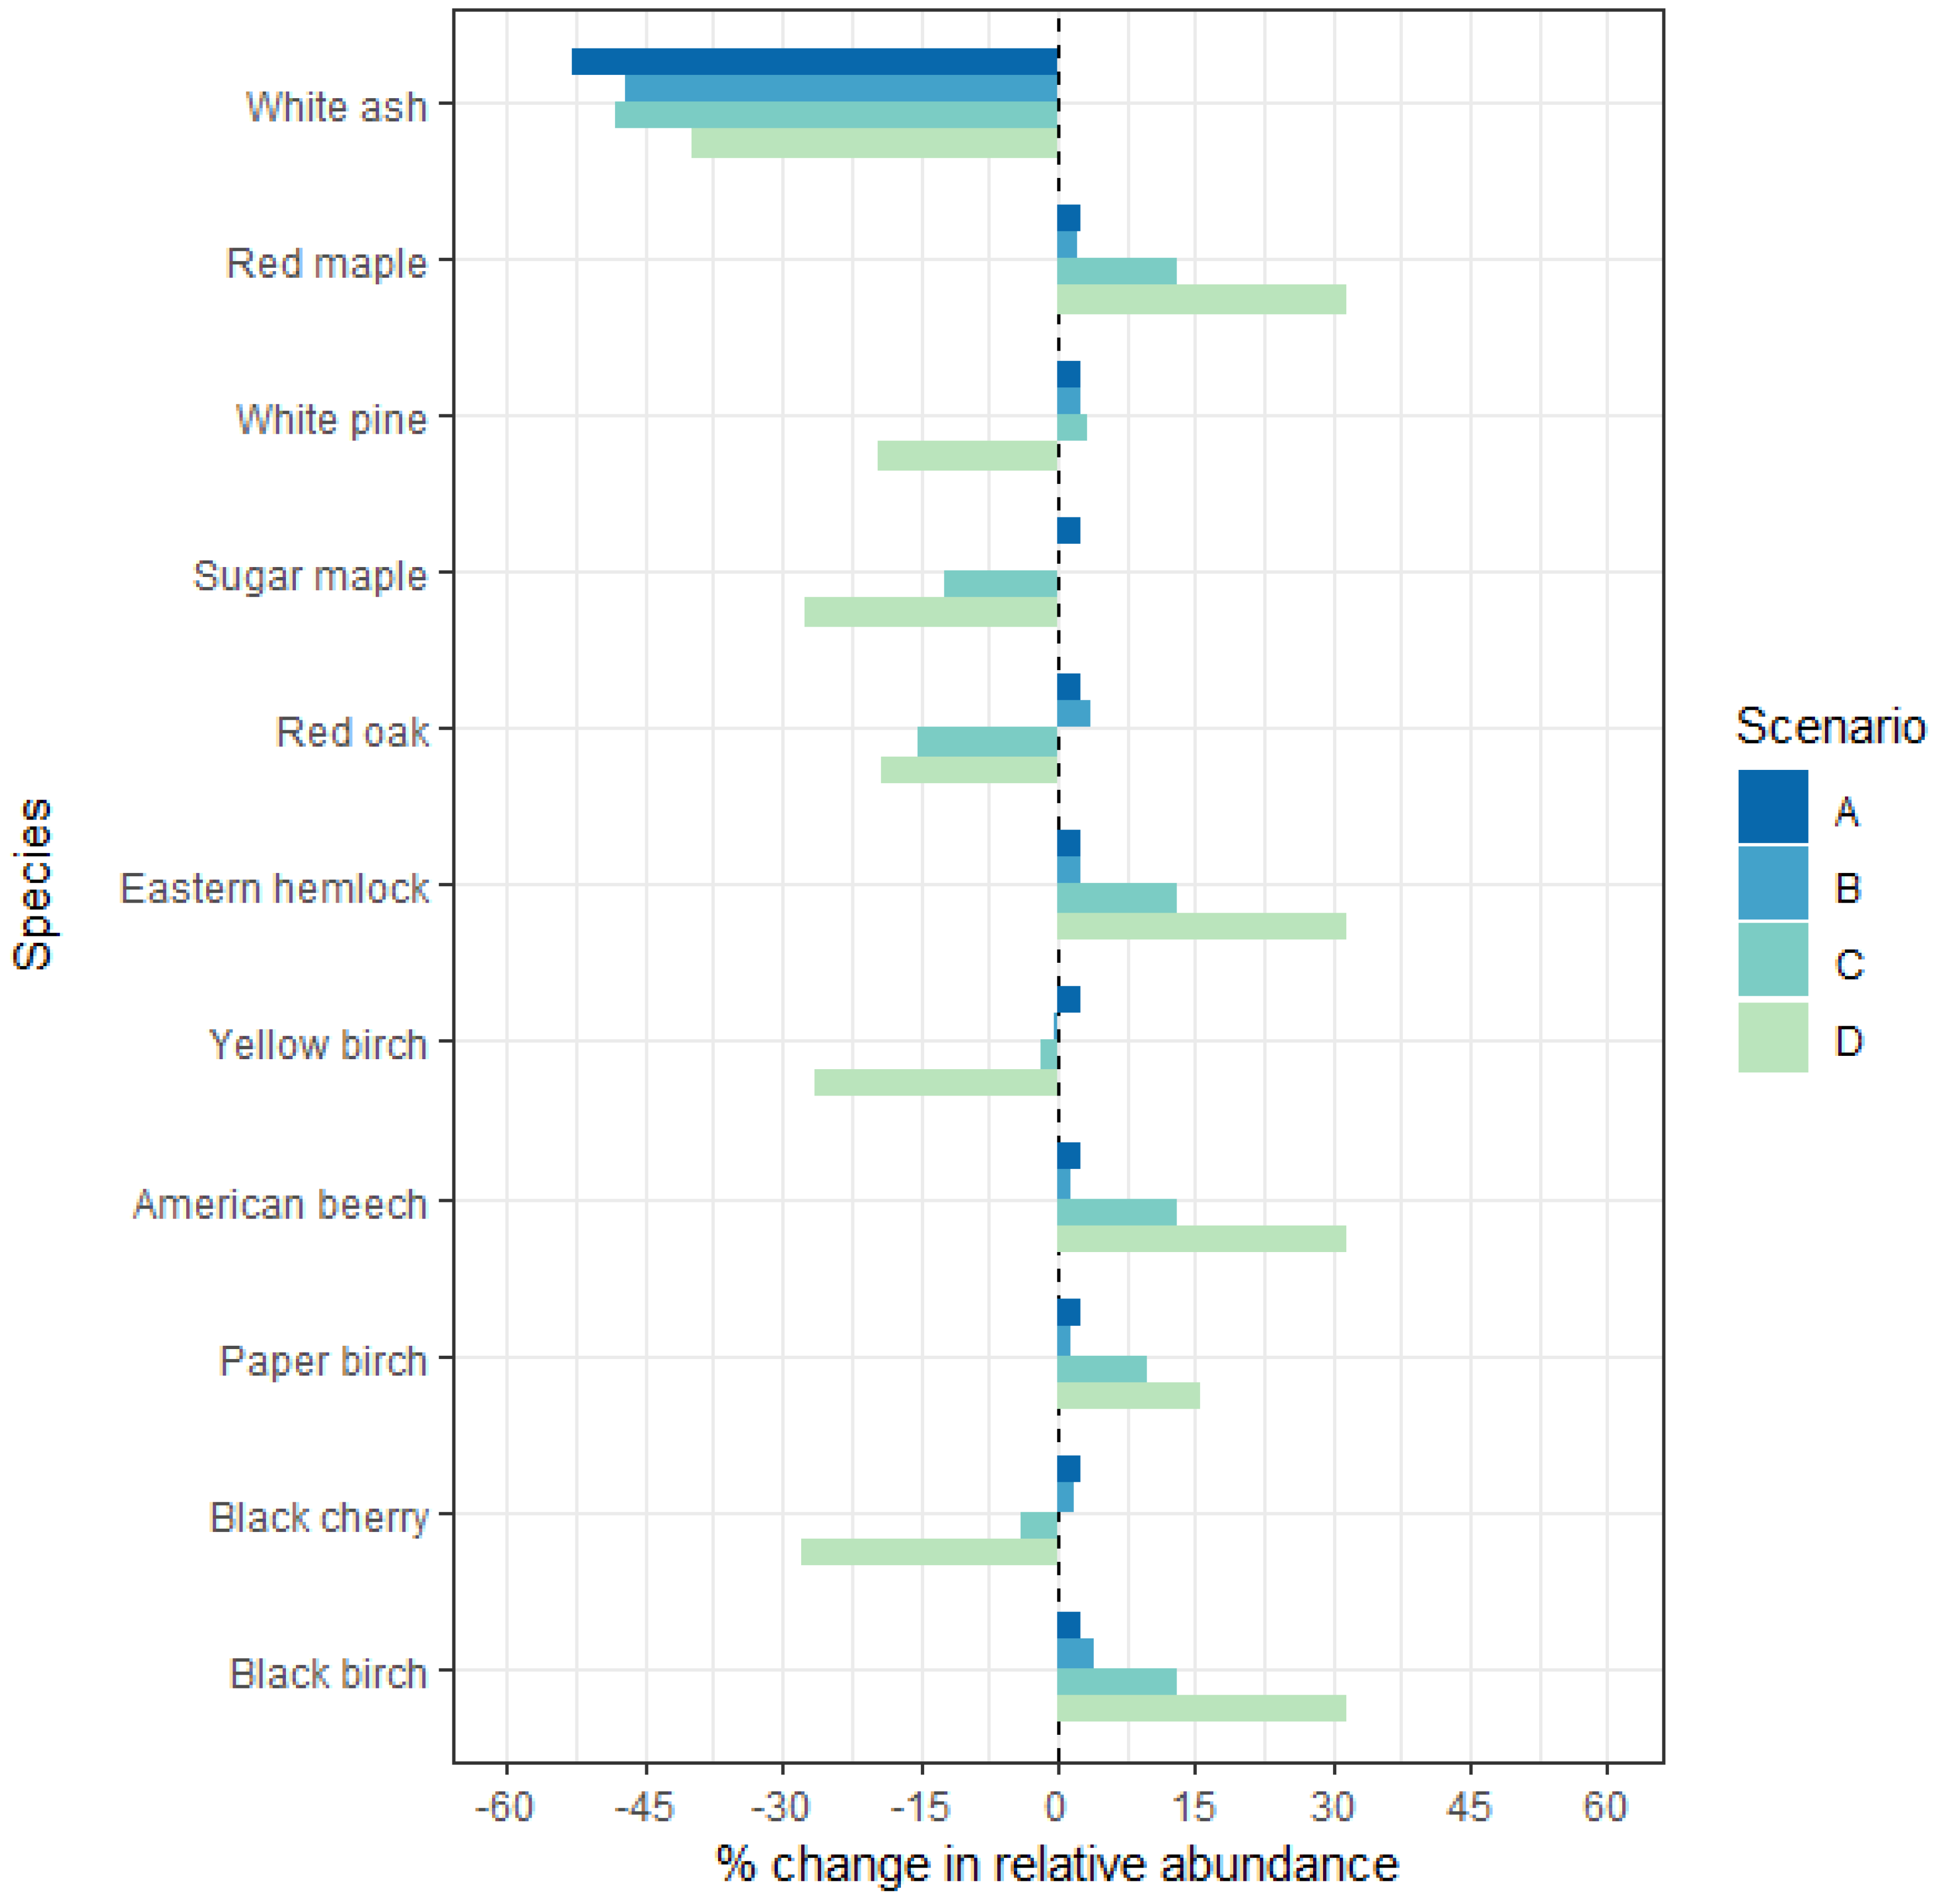
3.3. Quantifying the Impact of Insect-Induced Harvest on Regional Forest Composition

In Scenario A, only white ash was removed from the harvested parcels, so only the relative abundance of ash was adversely affected by harvest in this scenario (Figure 5), with the relative abundances of all other species increasing. In Scenario B, there was no species preference in the harvesting applied to each parcel, so the differences between the relative abundances from Scenario A and Scenario B across the landscape reflect how often each species co-occurred with ash and the abundance of that species (Table 1 and Figure 5). Species that co-occur with ash and are more abundant, such as sugar maple (Acer saccharum) and yellow birch (Betula alleghaniensis), had smaller gains in relative abundance in Scenario B, as compared to Scenario A (Figure 5). These same species also had a larger proportion of their AGB removed in Scenario B (Table 2). Species that did not co-occur with ash as frequently, such as red oak (Quercus rubra) and white pine (Pinus strobus), have similar or larger gains in relative abundance in Scenario B, as compared to Scenario A, in both the harvested plots and across the landscape (Figure 5).
When species were removed in order of their timber value (i.e., Scenarios C and D), the most valuable species had the highest biomass loss (Table 2). The relative abundance also decreased for the most valuable species and increased more substantially for species not considered valuable in this study (Figure 5). Scenario D differed from Scenario C in that there was no harvest intensity limitation. When harvests were limited to typical harvest intensities, as observed in the FIA (Scenario C), the impact on the relative abundance of high value species was less, with red oak (Q. rubra) and sugar maple (A. saccharum) having the highest decreases in relative abundance across the landscape in Scenario C (−15% and −13%, respectively, Figure 5). In Scenario D, a combination of total abundances of the valuable species, and how often they co-occurred with ash, had more of an influence on which species had the largest changes in relative abundance across the landscape (Figure 5). In Scenario D, black cherry (Prunus serotina), sugar maple (A. saccharum), and yellow birch (B. alleghaniensis) all became considerably less abundant and represented a smaller proportion of the total AGB of the Connecticut River Watershed (−28%, −28%, and −26%, respectively, Figure 5).

4. Discussion

The compound disturbance of insect-induced harvests is often overlooked when considering the effects of forest insects and pathogens. Our analysis suggests that the recent invasion of EAB into the Connecticut River Watershed could dramatically alter timber harvest regimes, increasing annual harvest rates by as much as 42%. Using our models, 25% of parcels, representing 37% of the area owned by family forest owners within the Connecticut River Watershed, were predicted to be harvested in response to EAB. Given the spread rate of EAB [26] and its current locations within the watershed, most of this harvest may take place before 2030. Assuming this future, the annual probability of harvest in response to EAB could be 3.7% for FFO lands in the Connecticut River Watershed for the next 10 years. Thompson et al. [15] found that in the 20-state northeastern region of the FIA, the annual probability of harvest on non-corporate private woodlands was 2.9%. We also confirmed that for FFO parcels in the Connecticut River Watershed, there is an average annual probability of harvest of 2.6% using the most recently remeasured FIA plots, with a slightly higher annual probably of harvest (3.2%) for the northern region (nVT and nNH). Therefore, if we assume all harvests induced by EAB replace harvests that would have occurred without EAB, the EAB harvests could increase the annual probability of harvest by approximately 42% for FFO parcels in the Connecticut River Watershed. These additional harvests could represent a potential acceleration and expansion of harvests into new areas, supporting previous observations of salvage logging expanding harvesting practices into lands that generally have limited harvesting when undisturbed [4,12].
The lower bound of insect-induced harvesting that we explored only removed the host species, ash (Fraxinus spp.). In this scenario, 54% of ash was harvested, equating to 2.4% of the aboveground biomass on these FFO parcels. It is unlikely, however, that landowners would restrict harvests to the host trees [4]. It is more likely that these insect-induced harvests will have intensities more similar to typical harvest intensities in this landscape. Therefore, when we assume that harvests prompted by EAB mimic typical harvest intensities (e.g., Scenarios B and C), 12%–13% of the total AGB in forests in the Connecticut River Watershed could be harvested by FFOs in response to the invasion of EAB. These scenarios are most likely to represent salvage harvests that are planned with specific silvicultural objectives (e.g., timber volumes, ash regeneration, ash thinning). For context, approximately 5% of the total biomass was removed through harvesting when summed across the last two remeasurement periods for FIA plots in NH, VT, MA, and CT, so the harvest prompted by EAB could remove over two-times that amount of biomass.
In Scenarios B and C, approximately 81% of the removed AGB was from species other than ash. The worst-case scenario for the remaining ash on the landscape would be that 100% of the ash trees are killed by EAB. Therefore, presuming all ash is killed by EAB, the insect-induced harvest response in Scenarios B and C still created a disturbance, in terms of total AGB affected, more than twice the magnitude of the worst-case disturbance from EAB alone, and included a larger number of species. In Scenario D, where harvests remove all valuable species after removing the host ash, the insect-induced harvests created a disturbance nearly five times the magnitude of EAB alone. Fortunately, Scenario D is extremely unlikely, but represents what could happen should insect-induced harvests proceed without planning or consideration of silvicultural or forest management principles.
Both co-occurrence with ash and silvicultural prescription influenced the scope of the disturbance for individual species. For example, to illustrate how value and co-occurrence influenced final relative abundance, white pine (P. strobus) and sugar maple (A. saccharum) started at the same relative abundance pre-harvesting; however, sugar maple co-occurs with ash 83% of the time, whereas white pine co-occurs only 72% of the time (Table 1), resulting in white pine having higher abundances than sugar maple following Scenarios B, C, and D (any that harvest more than ash). The species most influenced by silvicultural prescription were: sugar maple (A. saccharum) and black cherry (P. serotina) (range of changes to relative abundance for both species: 3% to −28%) in the negative direction, while both American beech (Fagus grandifolia) and red maple (A. rubrum) both increased their abundance (range of changes to relative abundance for both species: 3% to 32%) when species were harvested with value as a motivating factor for species selection (Table 2 and Figure 5). Therefore, in the specific case of EAB, species that co-occur with ash (Table 1), and particularly those that are preferred species for harvest (Appendix C), are most likely to be removed to enhance commercial harvest viability and are most vulnerable to EAB-induced harvests.

5. Conclusions

In all scenarios, insect-induced harvests have far-reaching ecological impacts by reducing overall biomass and altering species composition. Harvesting in response to a FIP with a specific host(s) alters the species composition of the landscape by selectively targeting the host species for removal and differentially impacting species that co-occur with the host. Our study shows that species that do not occur as frequently as the host increased in their relative abundance post insect-induced harvesting, while species that co-occur more frequently, and particularly those that are preferred timber species, did not see the same increase in relative abundance and could see a marked decrease, depending on how harvests are planned and executed in terms of target species and intensities. Non-host species removal in insect-induced harvesting will be especially prevalent in the mixed forests of the Northeast for harvests that are planned with timber volumes and value as primary objectives, or in larger gap silvicultural treatments, since one host species often will not be enough to meet target volumes or silviculture objectives.

Limitations and Future Research

The survey we used to develop and apply the landowner typology did not ask questions about the type or intensity of harvesting that a FIP might induce. To account for this uncertainty, we presented four scenarios of varying harvest intensity and species removal. Further investigation into the intensity and types of silvicultural prescriptions applied in the harvest response to EAB is necessary to quantify these effects, particularly from the viewpoint of the foresters and loggers who are completing the harvests. Additionally, it is unknown whether the harvest response may be limited by the capacity of foresters, loggers, and markets. Although to date, cutting plans, reports and news articles, and stumpage reports point to an increase in harvesting of the ash component in the region, as well as an increase in ash’s value, indicating a continuing market for ash and a lack of market saturation. We also expect that there is some interplay between harvest unrelated to EAB, insect-induced harvest in response to EAB, forest growth dynamics, and climate change. To assess specifically how insect-induced harvests may accelerate and intensify forest disturbance and change forest growth and composition over time, future research should explore these dynamics with a spatially and temporally explicit representation of background harvest and insect-induced harvest initiated by EAB.
In addition, there are several other FIPs impacting forests in the region (e.g., hemlock woolly adelgid, European gypsy moth (Species: Lymantria dispar Linnaeus, 1758), and beech bark disease), and Leung et al. [36] predicted a tripling of non-native wood-borers in the Northeast by 2050, with at least one new wood-borer having the same or larger impact on the landscape as EAB. The interactions among FIPs will have extensive ecological impacts on the forested landscape, but as shown in this study, the coupled human management response will intensify and expand the total disturbance created by these FIPs and will be highly influenced by the silvicultural prescriptions used in these insect-induced harvests. Whereas the individual ecological impacts of these FIPs on current forest structure and future forest dynamics are somewhat understood, the management responses to multiple interacting global change drivers is less well-resolved. Our study underscores the importance of better understanding these complex interactions to predict the fate of our forests and their ability to continue to provide essential ecosystem services.

Author Contributions

Conceptualization, M.B., B.J.B., M.J.D., D.R.F., D.B.K., M.M.-L., D.A.O., and J.R.T.; methodology, M.B., M.J.D., M.G.M, J.H., D.B.K., D.A.O., and J.R.T.; software, D.L.; validation, D.L.; formal analysis, M.G.M.; investigation, M.G.M. and J.R.T.; resources, M.B., B.J.B., M.G.M., J.H., M.M.-L., and D.A.O.; data curation, M.G.M., and D.L.; writing—original draft preparation, M.G.M., and J.R.T.; writing—review and editing, M.B., B.J.B., M.J.D., D.R.F., J.H., D.B.K., M.M.-L., and D.A.O.; visualization, M.G.M.; supervision, J.R.T.; project administration, D.L.; funding acquisition, M.B., B.J.B., D.R.F., D.B.K., M.M.-L., D.A.O., and J.R.T. All authors have read and agreed to the published version of the manuscript.

Funding

This research was primarily supported by the National Science Foundation Coupled Natural and Human Systems Grant No. DEB-1617075. This research was also partially funded by the Harvard Forest Long Term Ecological Research Program Grant No. LTER VI: 18-32210.

Acknowledgments

This paper is dedicated to the memory of co-author and friend David B. Kittredge, who moved on from this life to the next on March 13, 2020. Thank you to both Paul Catanzaro and Tony D’Amato for their thoughtful reviews of an early draft of this manuscript.

Conflicts of Interest

The authors declare no conflict of interest. The funders had no role in the design of the study; in the collection, analyses, or interpretation of data; in the writing of the manuscript, or in the decision to publish the results.

Appendix A

Family Forest Owner (FFO) Survey for Intent to Harvest

In 2017, our group sent a survey to 2000 FFOs in the Connecticut River Watershed with over 4 ha of land stratified by location and parcel size (to ensure representation). There was a 37% cooperation rate (n = 688) with no evidence of nonresponse biases [7]. Each survey contained questions about the demographics of the respondents, as well as a contingent behavior experiment with four scenarios of a woodland insect arriving on the FFOs parcel (Figure A1). The four scenarios each had a unique set of parameters for invasion and respondents could receive one of six variations of the survey. Overall, 84% of respondents indicated they would harvest in at least one of the scenarios [7].
Figure A1. The scenarios presented to the FFOs in harvest intent survey. Respondents received four different versions of the scenario within their survey and were asked whether they intended to harvest in response to each scenario uniquely. The survey questionnaire and procedures were approved by the lead author’s Institutional Review Board (IRB) in accordance with the Human Research Protection Program.
Forests 11 00498 g0a1

Appendix B

Defining and Characterizing Agent Functional Types

Based on the types of responses to our landowner survey (Appendix A), family forest owners were categorized into three agent functional types: Cutter, Responsive Cutter, and Non-cutter. Cutters made up 46% of the respondents (n = 317) and responded they intended to harvest in all of the four FIP scenarios they were presented with. Responsive Cutters made up 42% of the respondents (n = 285) and they responded that they would harvest in at least one of the scenarios presented, but not all. Non-cutters made up 12% of the respondents (n = 83) and they did not intend to harvest in any of the of the scenarios presented [7,17]. For both the Cutters and the Non-cutters, their probability of harvest did not change with different parameters of the FIP invasion. However, for the Responsive Cutters, we used logistic regression within a Bayesian model framework, in which Q, X, Y, and Z represent the four insect impact severity metrics (see Appendix A), to determine important predictors of harvest. Priors on the model coefficients were non-informative. Our logistic regression revealed that that “mortality percent” (percent of trees killed by an insect) and “time to mortality” (time from insect arrival until tree death) are important predictors of harvest response [17]. Therefore, to predict the harvest response for Responsive Cutters, we must use specific characteristics of a FIP invasion.
As described in detail in Holt et al. [17], we then used a combination of a classification and regression tree (CART) and multinomial regression with both geographic and demographic data to create a model for classifying every FFO parcel > 4 ha in the Connecticut River Watershed into an agent functional type. As possible predictors, we used both town-level and parcel-level measures of land cover, derived from the National Land Cover Database (NLCD) 2011 [37], and town-level socio-demographic data from the American Community Survey dataset [38].
Parcels were first split into two spatial factor groups based on size and location (including state as a predictor) of the parcel based on the identification of a spatial trend in the survey responses using a CART analysis. These groups were the large parcel size + New Hampshire group (i.e., “large + NH”) and a small parcel size group (i.e., “small”), where “large” was defined as any parcel with > 20 ha (Figure 2). We then used a multinomial regression to predict agent functional types. Out of the many town- and parcel-level geographic and demographic variables and our spatial factor variable (large + NH or small), three predictors were identified as part of the best model using stepwise AIC model selection: our spatial factor variable, area of forest in the town, and area of forest owned at the parcel-level [17]. We also included an interaction term between the spatial factor variable and the two other predictors (area of forest in the town and area of forest owned). The interaction term revealed that area of forest in the town is significant with respect to the small parcel group, but not for the large + NH group [17].
The model suggests that with increasing area of forest owned, a respondent has an increasing probability of being a Cutter or Responsive Cutter, and lower probability of being a Non-cutter. As forest increases in a town, the probability of being a Cutter increases and the probability of being categorized as a Responsive Cutter or Non-cutter decreases (Figure 2). The McFadden’s pseudo R2 of the model is 0.29 [17].

Appendix C

High Value Species in Our Harvest Regions.

Stumpage reports from MA and CT, NH, and VT were collected for 2017–2019 to calculate average values for each species listed in the stumpage reports. Species were then ranked by their average value and included as “high value” species if they were also found in the list of Preferred species for harvest for this region in Belair and Ducey [14] (Table A1).
Table A1. The most valuable species, listed in order of average value from stumpage reports, for each harvest region. Average values of species are listed in $ per thousand board feet (Mbf) and averaged from the available stumpage reports from each region from 2017–2019, though exact stumpage prices were not used in the model, only ranks. Note that due to its lower abundance, white oak was aggregated with other oak species in some stumpage reports; therefore white oak’s value is more approximate than the other species and its rank in the south was augmented by expert knowledge and Belair and Ducey [14].
North (Northern NH and VT)South
Sugar maple (Acer saccharum) ($315/Mbf)Red oak (Quercus rubra) ($333/Mbf)
Red oak (Quercus rubra) ($310/Mbf)Sugar maple (Acer saccharum) ($284/Mbf)
Black cherry (Prunus serotina) ($212/Mbf)Black cherry (Prunus serotina) ($231/Mbf)
White oak (Quercus alba) ($170/Mbf)White oak (Quercus alba) ($170/Mbf)
Yellow birch (Betula alleghaniensis) ($158/Mbf)Yellow birch (Betula alleghaniensis) ($177/Mbf)
Red spruce (Picea rubens) ($120/Mbf)White pine (Pinus strobus) ($105/Mbf)
White pine (Pinus strobus) ($112/Mbf)
Paper birch (Betula papyrifera) ($99/Mbf)

References

  1. Hicke, J.A.; Allen, C.D.; Desai, A.R.; Dietze, M.C.; Hall, R.J.; Ted Hogg, E.H.; Kashian, D.M.; Moore, D.; Raffa, K.F.; Sturrock, R.N.; et al. Effects of biotic disturbances on forest carbon cycling in the United States and Canada. Glob. Chang. Biol. 2012, 18, 7–34. [Google Scholar] [CrossRef]
  2. Williams, C.A.; Gu, H.; MacLean, R.; Masek, J.G.; Collatz, G.J. Disturbance and the carbon balance of US forests: A quantitative review of impacts from harvests, fires, insects, and droughts. Glob. Planet. Chang. 2016, 143, 66–80. [Google Scholar] [CrossRef]
  3. Boyd, I.L.; Freer-Smith, P.H.; Gilligan, C.A.; Godfray, H.C.J. The consequence of tree pests and diseases for ecosystem services. Science 2013, 342, 1235773. [Google Scholar] [CrossRef] [PubMed]
  4. Lindenmayer, D.B.; Burton, P.J.; Franklin, J.F. Salvage Logging and Its Ecological Consequences; Island Press: Washington, DC, USA, 2008; ISBN 9788578110796. [Google Scholar]
  5. Duveneck, M.J.; Thompson, J.R. Social and biophysical determinants of future forest conditions in New England: Effects of a modern land-use regime. Glob. Environ. Chang. 2019, 55, 115–129. [Google Scholar] [CrossRef]
  6. Lovett, G.M.; Weiss, M.; Liebhold, A.M.; Holmes, T.P.; Leung, B.; Lambert, K.F.; Orwig, D.A.; Campbell, F.T.; Rosenthal, J.; McCullough, D.G.; et al. Nonnative forest insects and pathogens in the United States: Impacts and policy options. Ecol. Appl. 2016, 26, 1437–1455. [Google Scholar] [CrossRef] [PubMed]
  7. Markowski-Lindsay, M.; Borsuk, M.E.; Butler, B.J.; Duveneck, M.J.; Holt, J.; Kittredge, D.B.; Laflower, D.; MacLean, M.G.; Orwig, D.; Thompson, J.R. Compounding the Disturbance: Family Forest Owner Reactions to Invasive Forest Insects. Ecol. Econ. 2020, 167, 106461. [Google Scholar] [CrossRef]
  8. Brown, M.L.; Canham, C.D.; Murphy, L.; Donovan, T.M. Timber harvest as the predominant disturbance regime in northeastern U.S. forests: Effects of harvest intensification. Ecosphere 2018, 9, e02062. [Google Scholar] [CrossRef]
  9. Leverkus, A.B.; Rey Benayas, J.M.; Castro, J.; Boucher, D.; Brewer, S.; Collins, B.M.; Donato, D.; Fraver, S.; Kishchuk, B.E.; Lee, E.-J.; et al. Salvage logging effects on regulating and supporting ecosystem services—A systematic map. Can. J. For. Res. 2018, 48, 1–18. [Google Scholar] [CrossRef]
  10. Waring, K.M.; O’Hara, K.L. Silvicultural strategies in forest ecosystems affected by introduced pests. For. Ecol. Manag. 2005, 209, 27–41. [Google Scholar] [CrossRef]
  11. Irland, L.C.; Dimon, J.B.; Baum, E.; Falk, J.; Stone, J.L. The Spruce Budworm Outbreak in Maine in The 1970’s —Assessment and Directions for the Future; Maine Agricultural Experiment Station: Orono, ME, USA, 1988. [Google Scholar]
  12. Kizlinski, M.L.; Orwig, D.A.; Cobb, R.C.; Foster, D.R. Direct and indirect ecosystem consequences of an invasive pest on forests dominated by eastern hemlock. J. Biogeogr. 2002, 29, 1489–1503. [Google Scholar] [CrossRef]
  13. Butler, B.J.; Hewes, J.H.; Dickinson, B.J.; Andrejczyk, K.; Butler, S.M.; Markowski-Lindsay, M. Family Forest Ownerships of the United States, 2013: Findings from the USDA Forest Service’s National Woodland Owner Survey. J. For. 2016, 114, 638–647. [Google Scholar] [CrossRef]
  14. Belair, E.P.; Ducey, M.J. Patterns in Forest Harvesting in New England and New York: Using FIA Data to Evaluate Silvicultural Outcomes. J. For. 2018, 116, 273–282. [Google Scholar] [CrossRef]
  15. Thompson, J.R.; Canham, C.D.; Morreale, L.; Kittredge, D.B.; Butler, B. Social and biophysical variation in regional timber harvest regimes. Ecol. Appl. 2017, 27, 942–955. [Google Scholar] [CrossRef] [PubMed]
  16. Kittredge, D.B.; Thompson, J.R. Timber Harvesting Behaviour in Massachusetts, USA: Does Price Matter to Private Landowners? Small-Scale For. 2016, 15, 93–108. [Google Scholar] [CrossRef]
  17. Holt, J.R.; Borsuk, M.E.; Butler, B.J.; Kittredge, D.B.; Laflower, D.; MacLean, M.G.; Markowski-Lindsay, M.; Orwig, D.A.; Thompson, J.R. Landowner Functional Types to Characterize Responses to Forest Insects. People Nat. 2019, 2, 204–216. [Google Scholar]
  18. Herms, D.A.; McCullough, D.G. Emerald Ash Borer Invasion of North America: History, Biology, Ecology, Impacts, and Management. Annu. Rev. Entomol. 2014, 59, 13–30. [Google Scholar] [CrossRef] [Green Version]
  19. Aukema, J.E.; Leung, B.; Kovacs, K.; Chivers, C.; Britton, K.O.; Englin, J.; Frankel, S.J.; Haight, R.G.; Holmes, T.P.; Liebhold, A.M.; et al. Economic Impacts of Non-Native Forest Insects in the Continental United States. PLoS ONE 2011, 6, e24587. [Google Scholar] [CrossRef]
  20. Klooster, W.; Gandhi, K.; Long, L.; Perry, K.; Rice, K.; Herms, D.; Klooster, W.S.; Gandhi, K.J.K.; Long, L.C.; Perry, K.I.; et al. Ecological Impacts of Emerald Ash Borer in Forests at the Epicenter of the Invasion in North America. Forests 2018, 9, 250. [Google Scholar] [CrossRef] [Green Version]
  21. Robinett, M.A.; McCullough, D.G. White ash (Fraxinus americana) survival in the core of the emerald ash borer (Agrilus planipennis) invasion. Can. J. For. Res. 2019, 49, 510–520. [Google Scholar] [CrossRef]
  22. Morin, R.S.; Liebhold, A.M.; Pugh, S.A.; Crocker, S.J. Regional assessment of emerald ash borer, Agrilus planipennis, impacts in forests of the Eastern United States. Biol. Invasions 2017, 19, 703–711. [Google Scholar] [CrossRef]
  23. Fei, S.; Morin, R.S.; Oswalt, C.M.; Liebhold, A.M. Biomass losses resulting from insect and disease invasions in US forests. PNAS 2019, 116, 17371–17376. [Google Scholar] [CrossRef] [Green Version]
  24. Flower, C.E.; Knight, K.S.; Gonzalez-Meler, M.A. Impacts of the emerald ash borer (Agrilus planipennis Fairmaire) induced ash (Fraxinus spp.) mortality on forest carbon cycling and successional dynamics in the eastern United States. Biol. Invasions 2013, 15, 931–944. [Google Scholar] [CrossRef]
  25. Klooster, W.S.; Herms, D.A.; Knight, K.S.; Herms, C.P.; McCullough, D.G.; Smith, A.; Gandhi, K.J.K.; Cardina, J. Ash (Fraxinus spp.) mortality, regeneration, and seed bank dynamics in mixed hardwood forests following invasion by emerald ash borer (Agrilus planipennis). Biol. Invasions 2014, 16, 859–873. [Google Scholar] [CrossRef]
  26. Evans, A.M. The speed of invasion: Rates of spread for thirteen exotic forest insects and diseases. Forests 2016, 7, 99. [Google Scholar] [CrossRef] [Green Version]
  27. Siegert, N.W.; Mercader, R.J.; McCullough, D.G. Spread and dispersal of emerald ash borer (Coleoptera: Buprestidae): Estimating the spatial dynamics of a difficult-to-detect invasive forest pest. Can. Entomol. 2015, 147, 338–348. [Google Scholar] [CrossRef]
  28. Forest Health Vermont Executive Summary Ash Management Guidance for Forest Managers. Available online: http://anrmaps.vermont.gov/websites/anra5/ (accessed on 12 September 2019).
  29. Mercader, R.J.; McCullough, D.G.; Storer, A.J.; Bedford, J.M.; Heyd, R.; Poland, T.M.; Katovich, S. Evaluation of the potential use of a systemic insecticide and girdled trees in area wide management of the emerald ash borer. For. Ecol. Manag. 2015, 350, 70–80. [Google Scholar] [CrossRef]
  30. Sadof, C.S.; Hughes, G.P.; Witte, A.R.; Peterson, D.J.; Ginzel, M.D. Tools for staging and managing the emerald ash borer in an urban forest. Arboric. Urban For. 2017, 43, 15–26. [Google Scholar]
  31. Bechtold, W.A.; Patterson, P.L. The Enhanced Forest Inventory and Analysis Program-National Sampling Design and Estimation Procedures; US Department of Agriculture, Forest Service, Southern Research Station: Asheville, NC, USA, 2005.
  32. Duveneck, M.J.; Thompson, J.R.; Wilson, B.T. An imputed forest composition map for New England screened by species range boundaries. For. Ecol. Manag. 2015, 347, 107–115. [Google Scholar] [CrossRef]
  33. MacCallum, R.C.; Zhang, S.; Preacher, K.J.; Rucker, D.D. On the practice of dichotomization of quantiative variables. Psych. Methods 2002, 7, 19–40. [Google Scholar] [CrossRef]
  34. Allik, J. A mixed-binomial model for Likert-type personality measures. Front. Psychol. 2014, 5, 371. [Google Scholar] [CrossRef] [Green Version]
  35. Akaike, H. Information theory and an extension of the maximum likelihood principle. In Second International Symposium on Information Theory; Petrov, B.N., Csaki, B.F., Eds.; Academiai Kiado: Budapest, Hungary, 1973; pp. 267–281. [Google Scholar]
  36. Leung, B.; Springborn, M.R.; Turner, J.A.; Brockerhoff, E.G. Pathway-level risk analysis: The net present value of an invasive species policy in the US. Front. Ecol. Environ. 2014, 12, 273–279. [Google Scholar] [CrossRef]
  37. Homer, C.G.; Dewitz, J.A.; Yang, L.; Jin, S.; Danielson, P.; Xian, G.; Coulston, J.; Herold, N.D.; Wickham, J.D.; Megown, K. Completion of the 2011 National Land Cover Database for the conterminous United States-Representing a decade of land cover change information. Photogramm. Eng. Remote Sens. 2015, 81, 345–354. [Google Scholar]
  38. Manson, S.; Schroeder, J.; Van Riper, D.; Ruggles, S. IPUMS National Historical Geographic Information System: Version 12.0; University of Minnesota: Minneapolis, MN, USA, 2017; p. 50. [Google Scholar] [CrossRef]
Figure 1. Relative abundance of merchantable ash in the Connecticut River Watershed of New England, USA. Overall, 49.5% of the parcels are classified as low relative abundance of ash, 40.8% are classified as medium, and 9.7% are classified as high. Grey areas represent non-family forest owner (FFO) parcels or FFO-parcels without ash. Inset indicates study location within northeastern United States.
Forests 11 00498 g001
Figure 2. (a) Process for assigning agent functional types to FFO parcels in the Connecticut River Watershed. We used the agent functional types, survey response certainty distributions, and specifics from the emerald ash borer (EAB) invasion to calculate harvest probabilities for each parcel. The relationships between probability of being classified as a Cutter landowner type or with higher probability of harvest are shown in parenthesis. (b) An example harvest parcel map where red areas are parcels selected for harvest in one replicate.
Forests 11 00498 g002
Figure 3. The distribution of harvest probabilities for each of the agent functional types for one of the 10 replicates. Other replicates had similar distributions.
Forests 11 00498 g003
Figure 4. The distribution of harvest intensities for each of the regions (N = Northern Vermont and Northern New Hampshire from the FIA state data, S = all other area in the Connecticut River Watershed states) for one of the 10 replicates. Other replicates had similar distributions.
Forests 11 00498 g004
Figure 5. Change in relative abundance due to harvesting for the top 10 most abundant species in the Connecticut River Watershed for all FFO parcels in the watershed.
Forests 11 00498 g005
Table 1. Tree species that most commonly co-occur on parcels with ash (Fraxinus spp.) for all parcels in the Connecticut River Watershed. Total merchantable timber is the total amount of species-specific aboveground biomass (AGB). The percent of total AGB that co-occurs with ash represents the amount of that species that occurs on parcels with ash; e.g., 84% of all black cherry in the Connecticut River Watershed occurs on parcels with ash.
SpeciesTotal Merchantable Timber AGB (Tg)% of Total AGB Co-Occurring with Ash
Black cherry (Prunus serotina Ehrhart, c. 1780)4.484%
American basswood (Tilia americana Linnaeus, c. 1758)1.7 × 10−183%
Sugar maple (Acer saccharum Marshall, c. 1785)26.883%
American beech (Fagus grandifolia Ehrhart, c. 1780)7.282%
Yellow birch (Betula alleghaniensis Britton, c. 1896)8.481%
Paper birch (Betula papyrifera Marshall, c. 1785)4.680%
Bigtooth aspen (Populus grandidentata Michaux, c. 1803)8.0 × 10−180%
Gray birch (Betula populifolia Marshall, c. 1785)2.6 × 10−378%
Quaking aspen (Populus tremuloides Michaux, c. 1803)1.778%
Red maple (Acer rubrum Linnaeus, c. 1753)28.077%
Black birch (Betula lenta Linnaeus, c. 1758)4.176%
Eastern hemlock (Tsuga canadensis Carriere, c. 1862)20.376%
Red spruce (Picea rubens Sargent, c. 1880)3.675%
Table 2. Merchantable timber aboveground biomass (AGB) of the 10 most abundant species and the most abundant ash species* in harvestable FFO parcels in the Connecticut River Watershed and the % harvested in response to EAB for each scenario.
Total AGB
(Tg)
% of Total AGB Harvested
SpeciesScenario A: Host (Ash) Only RemovalScenario B: Typical Intensity, No Species PreferenceScenario C: Typical Antensity, Valuable Species PreferenceScenario D: Any Intensity, All Valuable Species
*White ash (Fraxinus americana)8.354% ± 2.4%54% ± 2.4%54% ± 2.4%54% ± 2.4%
Red maple (Acer rubrum)27.00%11% ± 0.9%0% ± 0%0% ± 0%
White pine (Pinus strobus)26.40%11% ± 1.2%9% ± 1.4%39% ± 3.1%
Sugar maple (Acer saccharum)26.30%13% ± 0.8%22% ± 2.4%45% ± 1.8%
Red oak (Quercus rubra)22.70%10% ± 1.4%25% ± 2.6%39% ± 3.5%
Eastern hemlock (Tsuga canadensis)19.80%11% ± 1.2%0% ± 0%0% ± 0%
Yellow birch (Betula alleghaniensis)8.30%13% ± 1.0%13% ± 1.9%44% ± 2.0%
American beech (Fagus grandifolia)7.00%12% ± 0.9%0% ± 0%0% ± 0%
Paper birch (Betula papyrifera)4.50%12% ± 1.1%3% ± 0.4%12% ± 1.1%
Black cherry (Prunus serotina)4.30%12% ± 0.9%15% ± 1.7%45% ± 2.7%
Black birch (Betula lenta)4.00%10% ± 1.3%0% ± 0%0% ± 0%
Total180.12.4% ± 0.1%13% ± 1.0%12% ± 1.1%24% ± 1.3%

