Identifying Forest Fire Driving Factors and Related Impacts in China Using Random Forest Algorithm


Abstract
:
1. Introduction
2. Materials and Methods
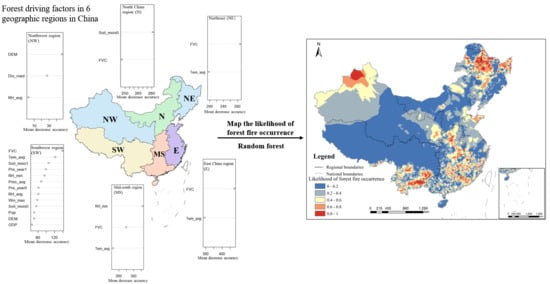
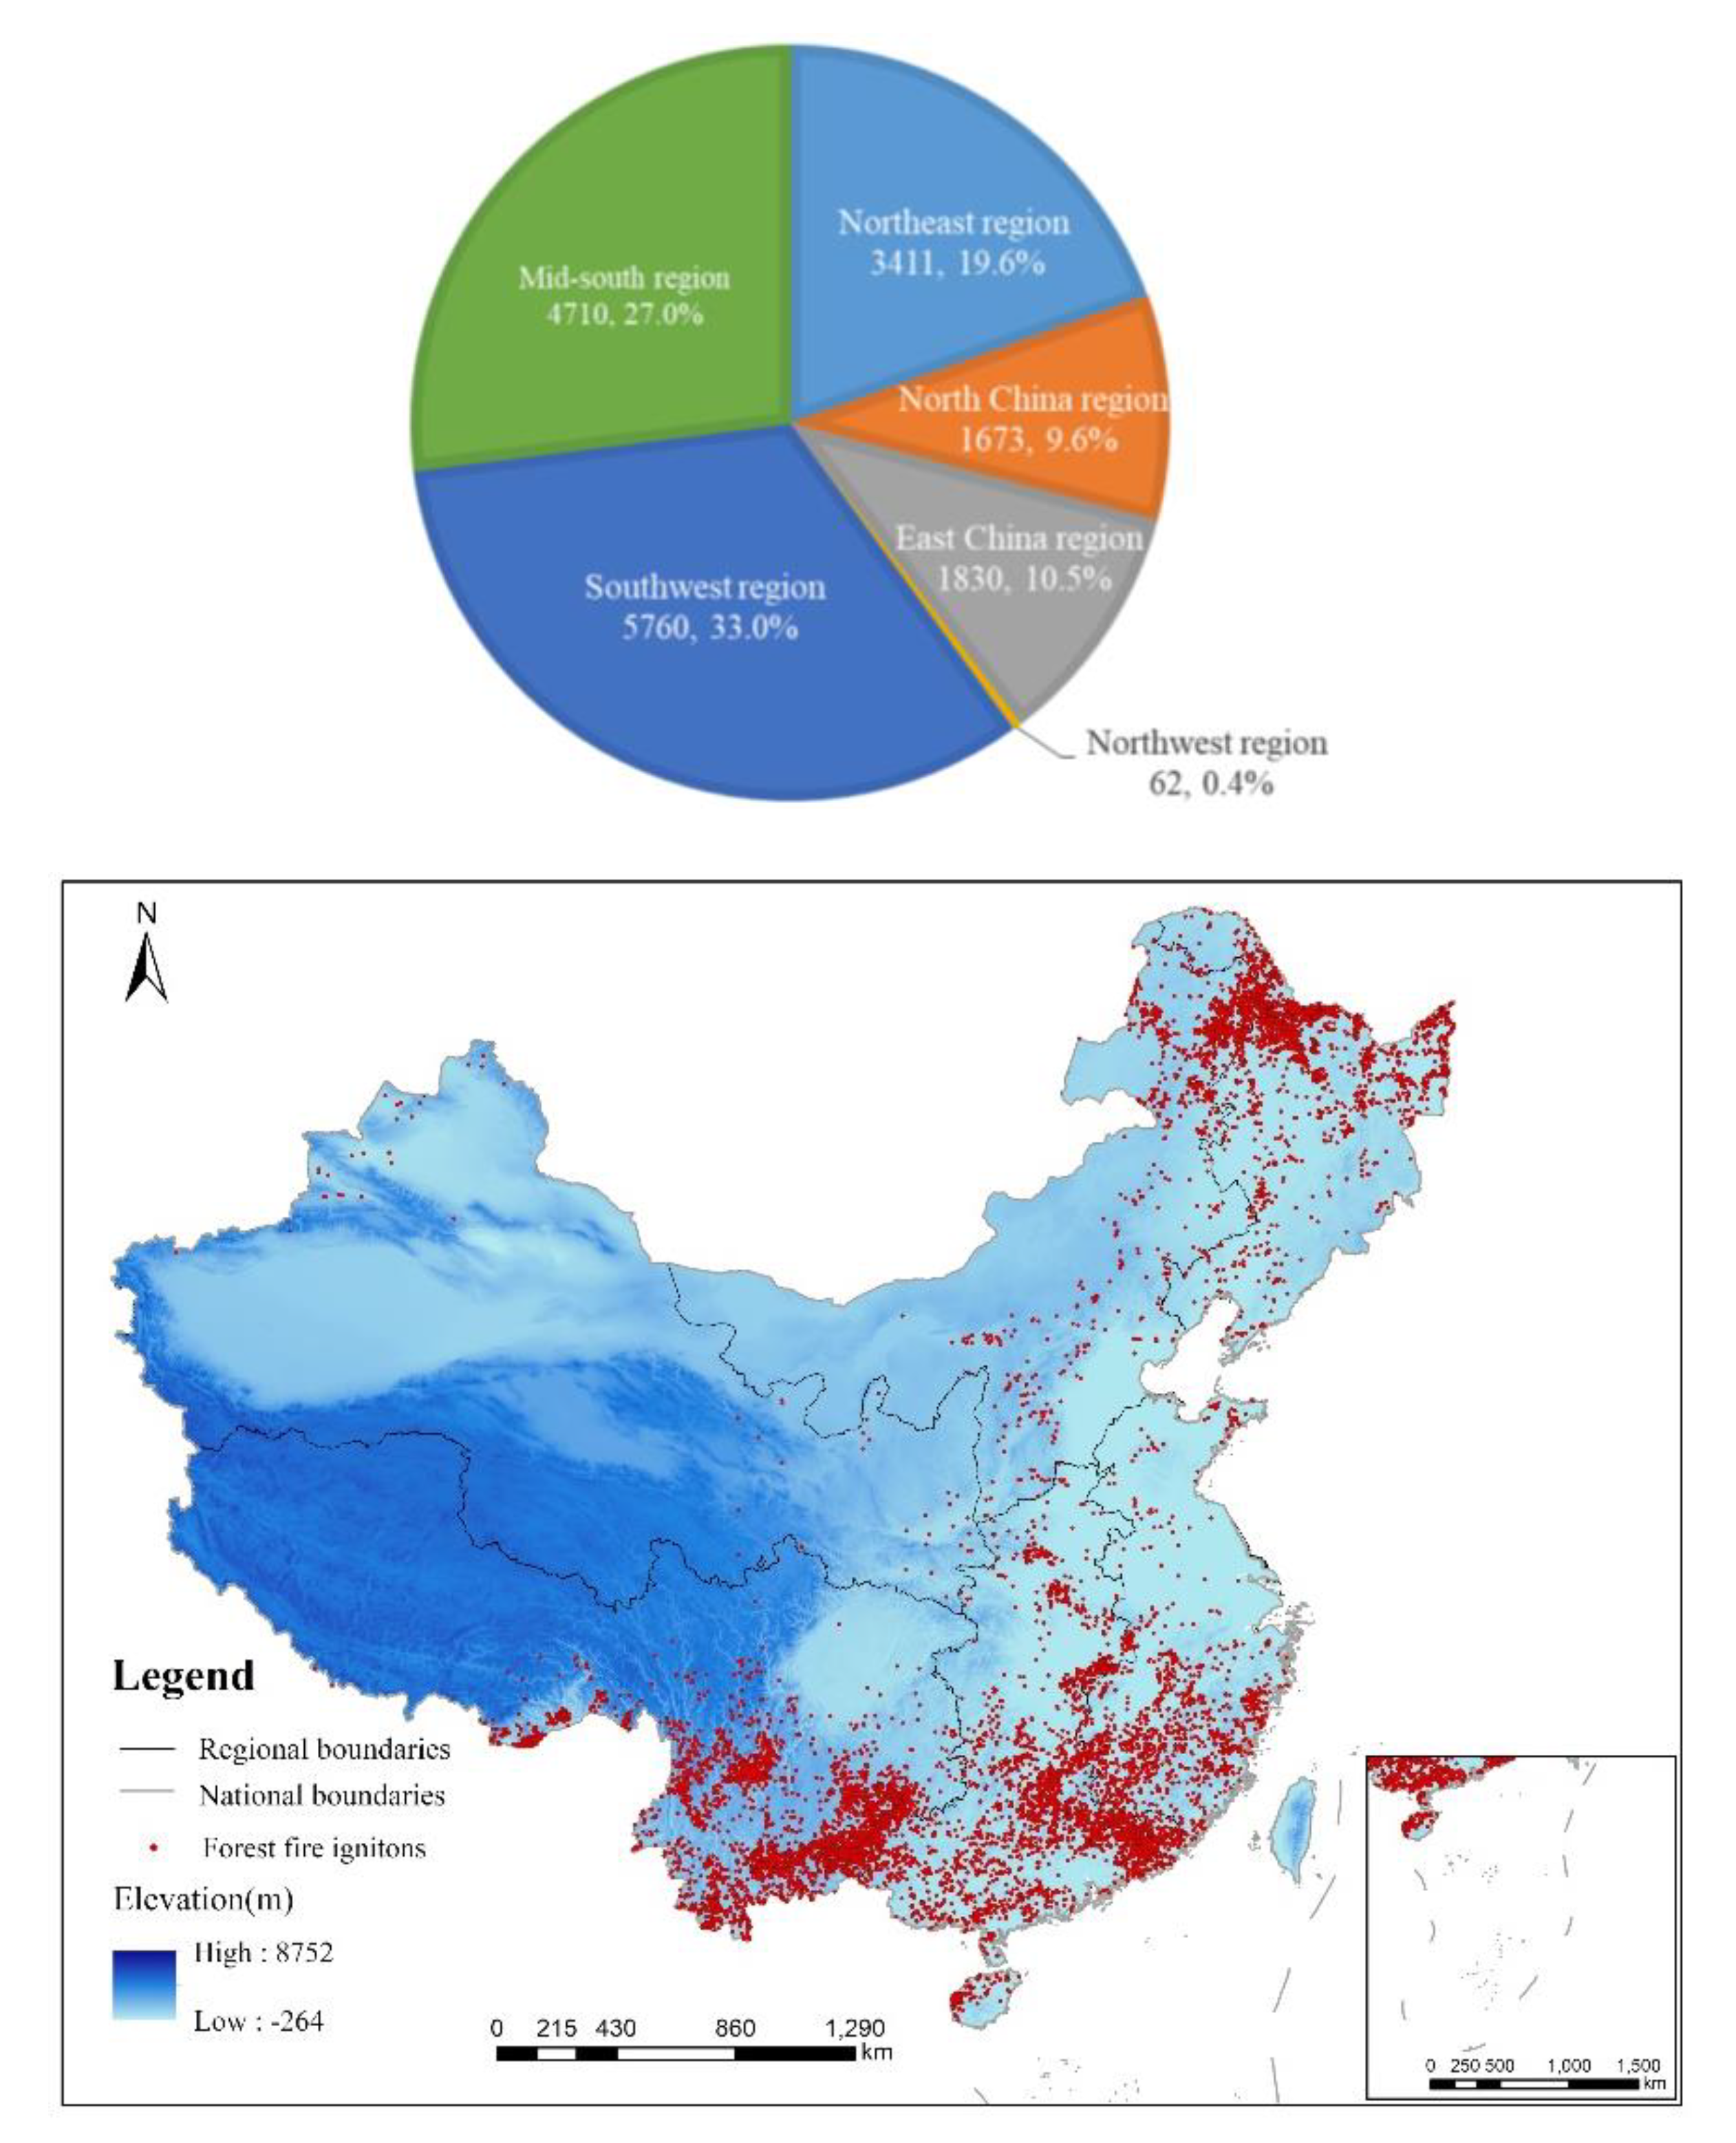
2.1. Study Area
2.2. Data Preparation
2.2.1. Dependent Variables
2.2.2. Explanatory Variables
Climate Variables
Topographic Variables
Vegetation Variable
Socioeconomic Variables
2.3. Model
2.4. Prediction Accuracy of the Models
2.5. Mapping Forest Fire Occurrence Likelihood
3. Results
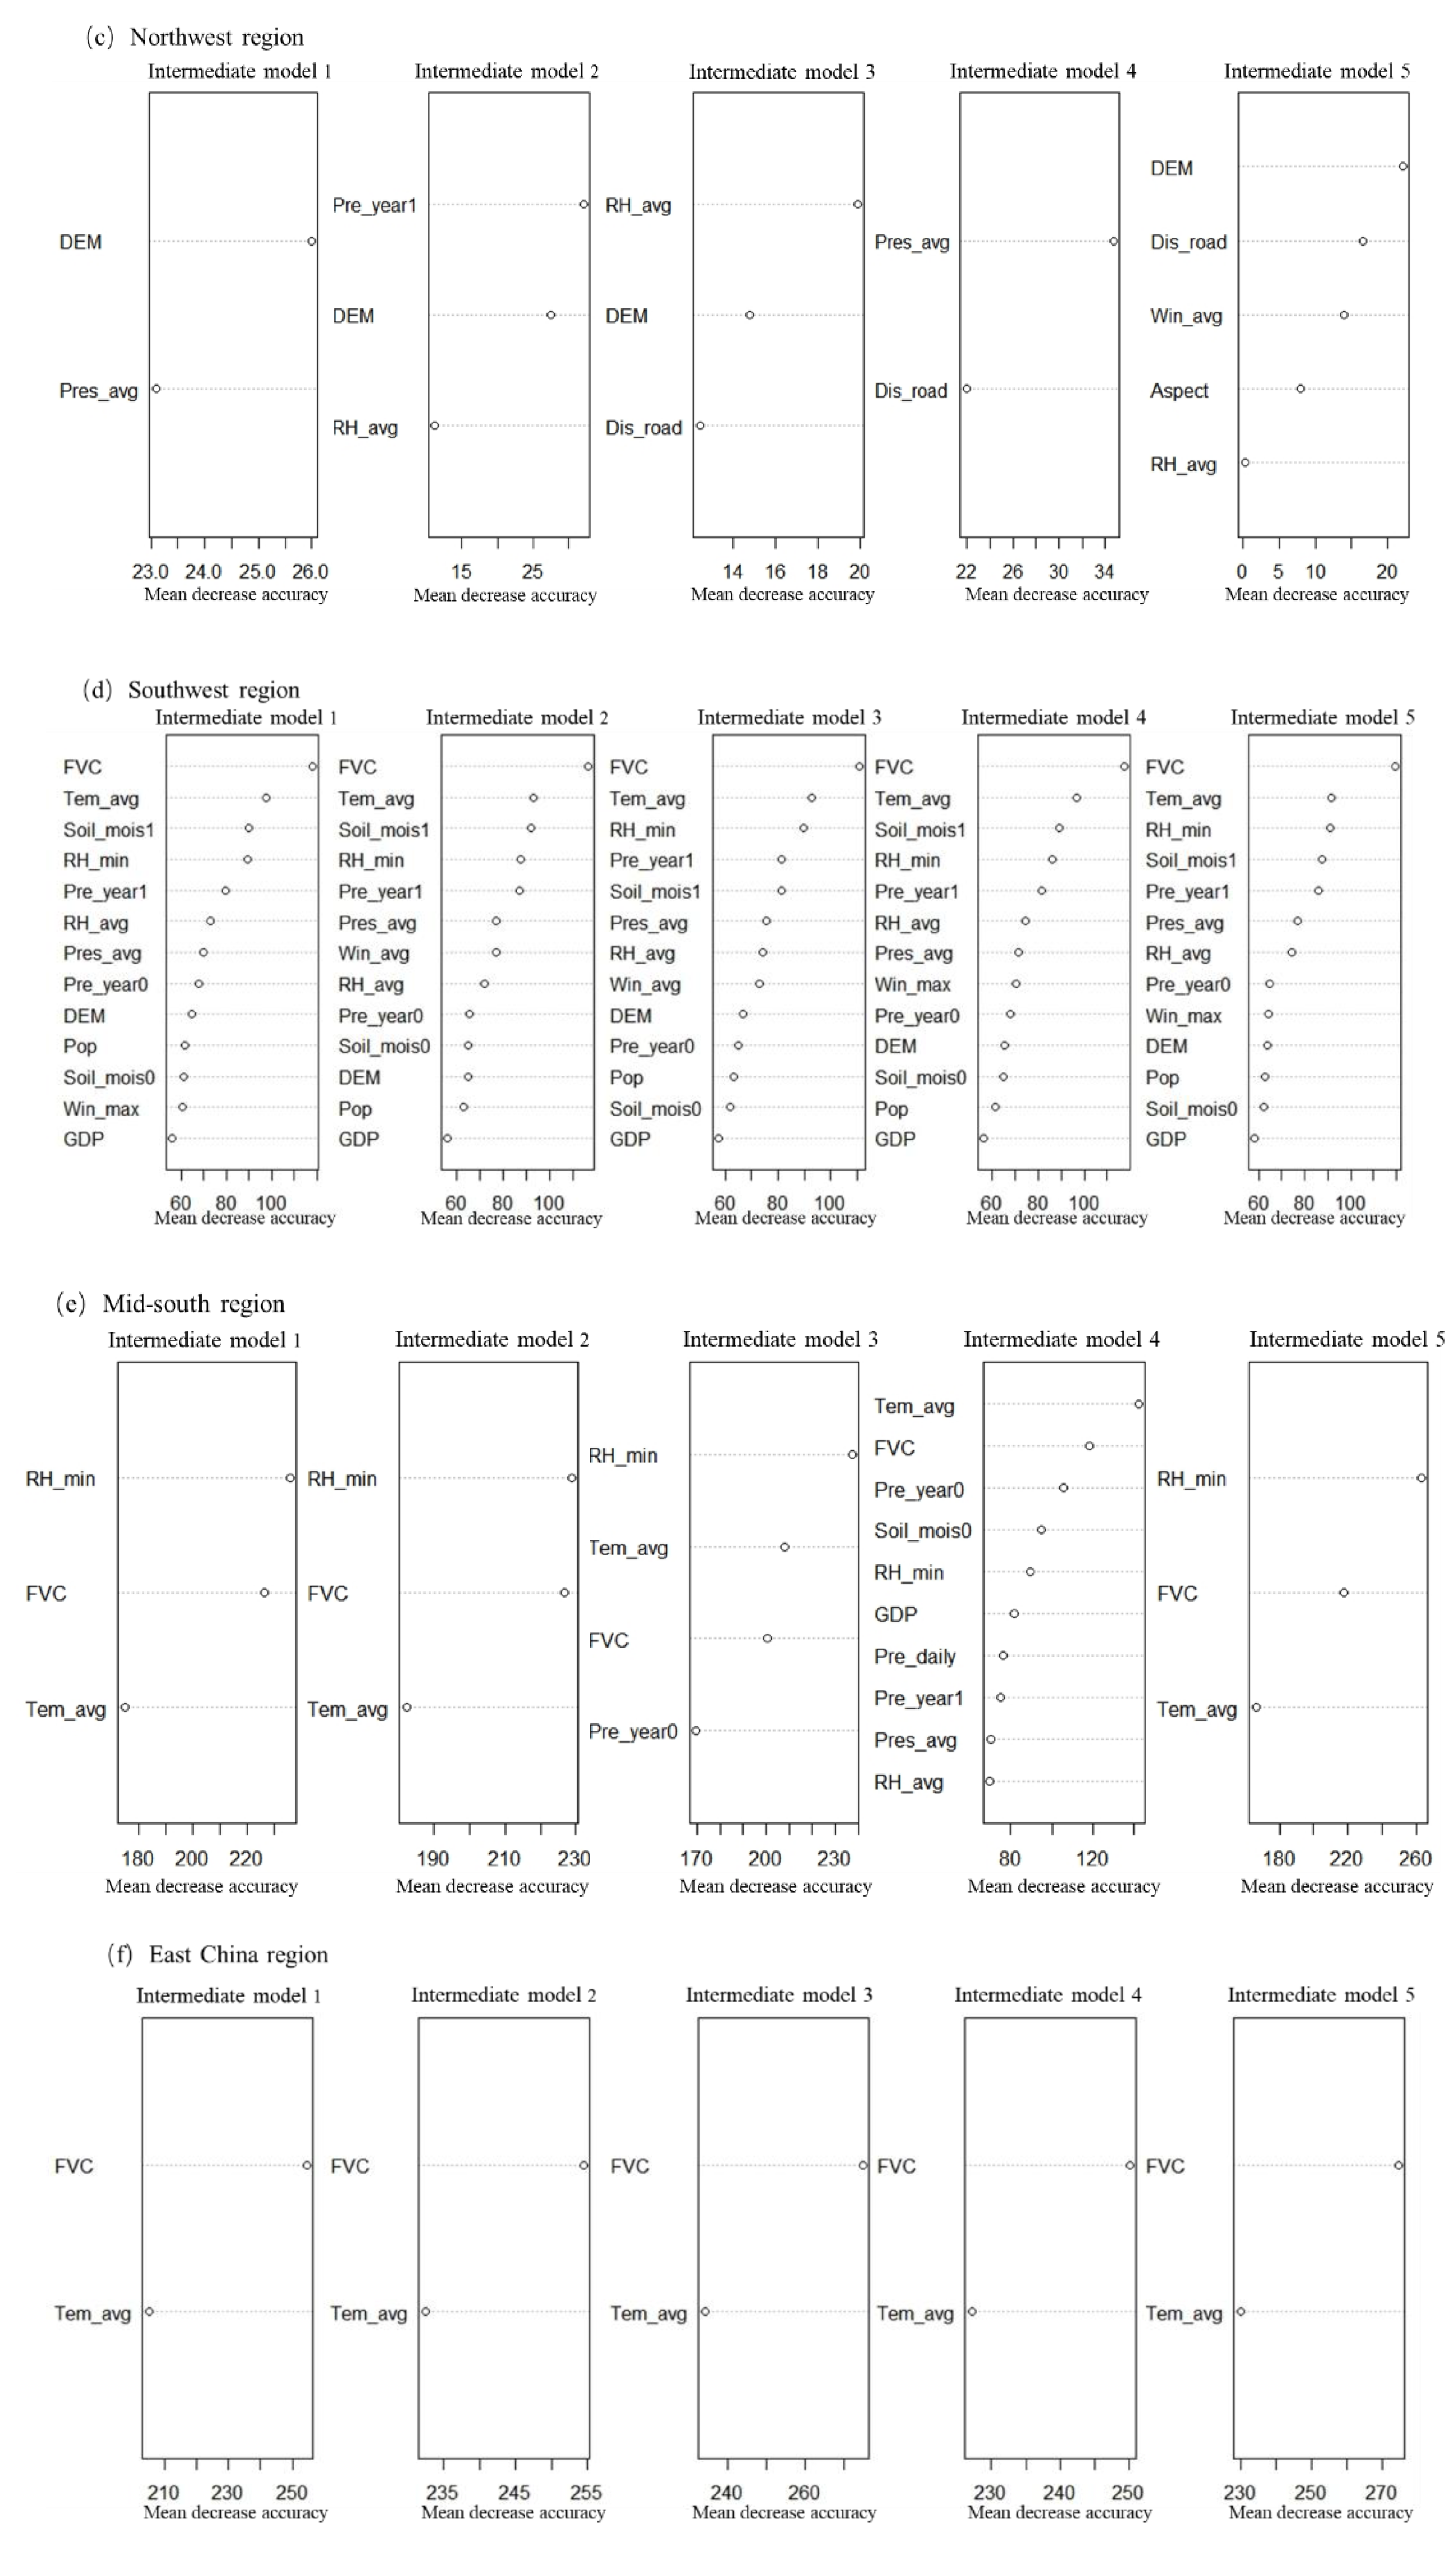
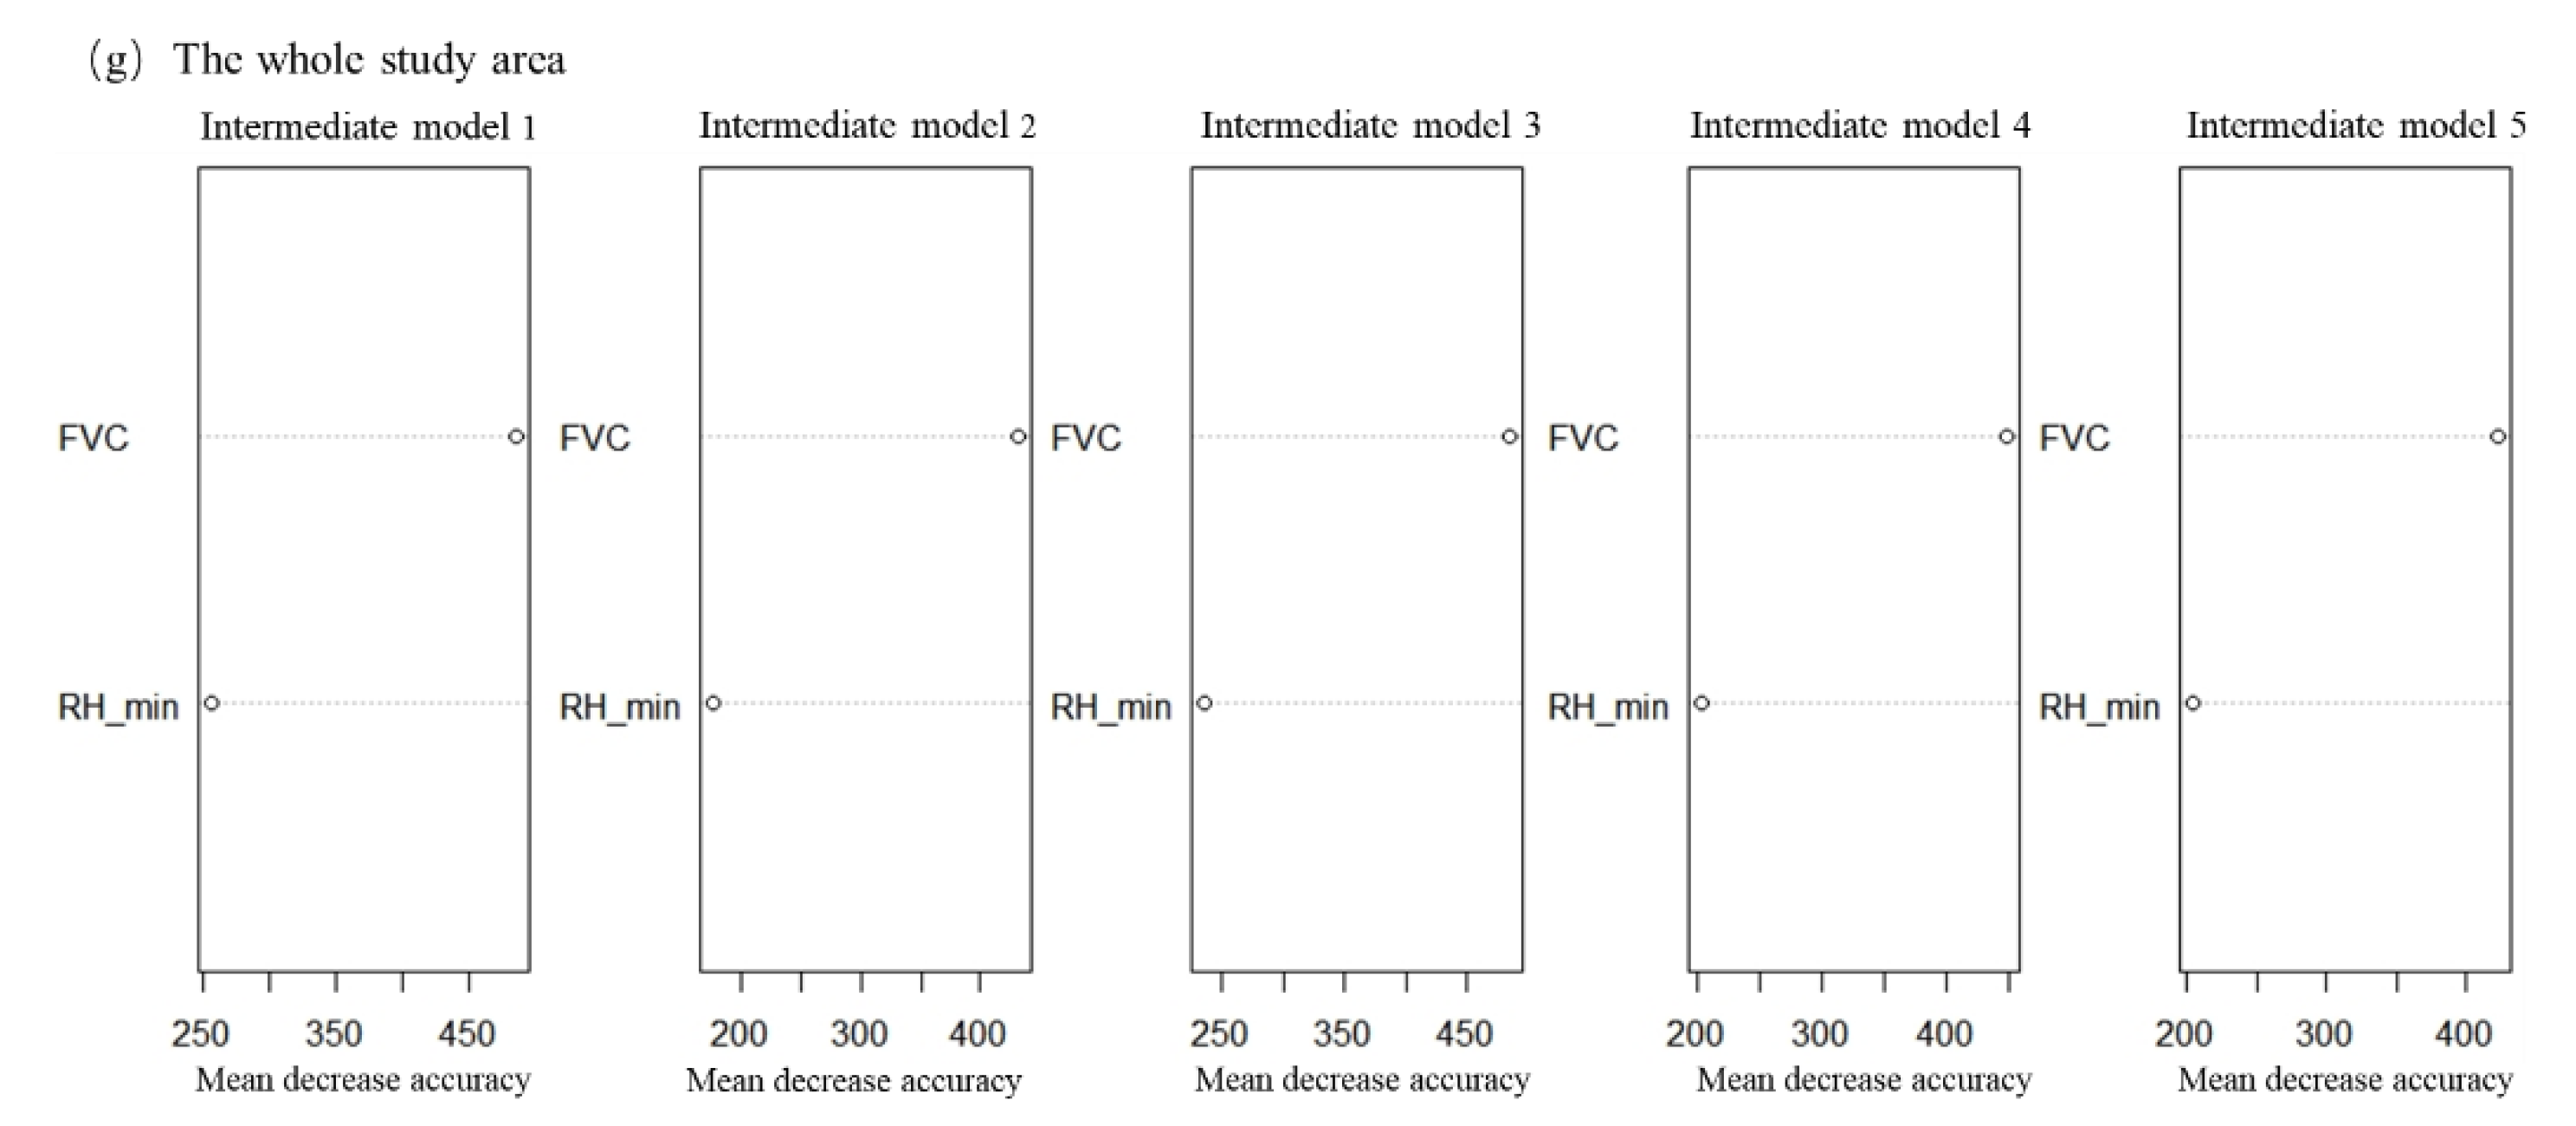
3.1. Identification of Forest Fire Driving Factors and Their Importance Ranks
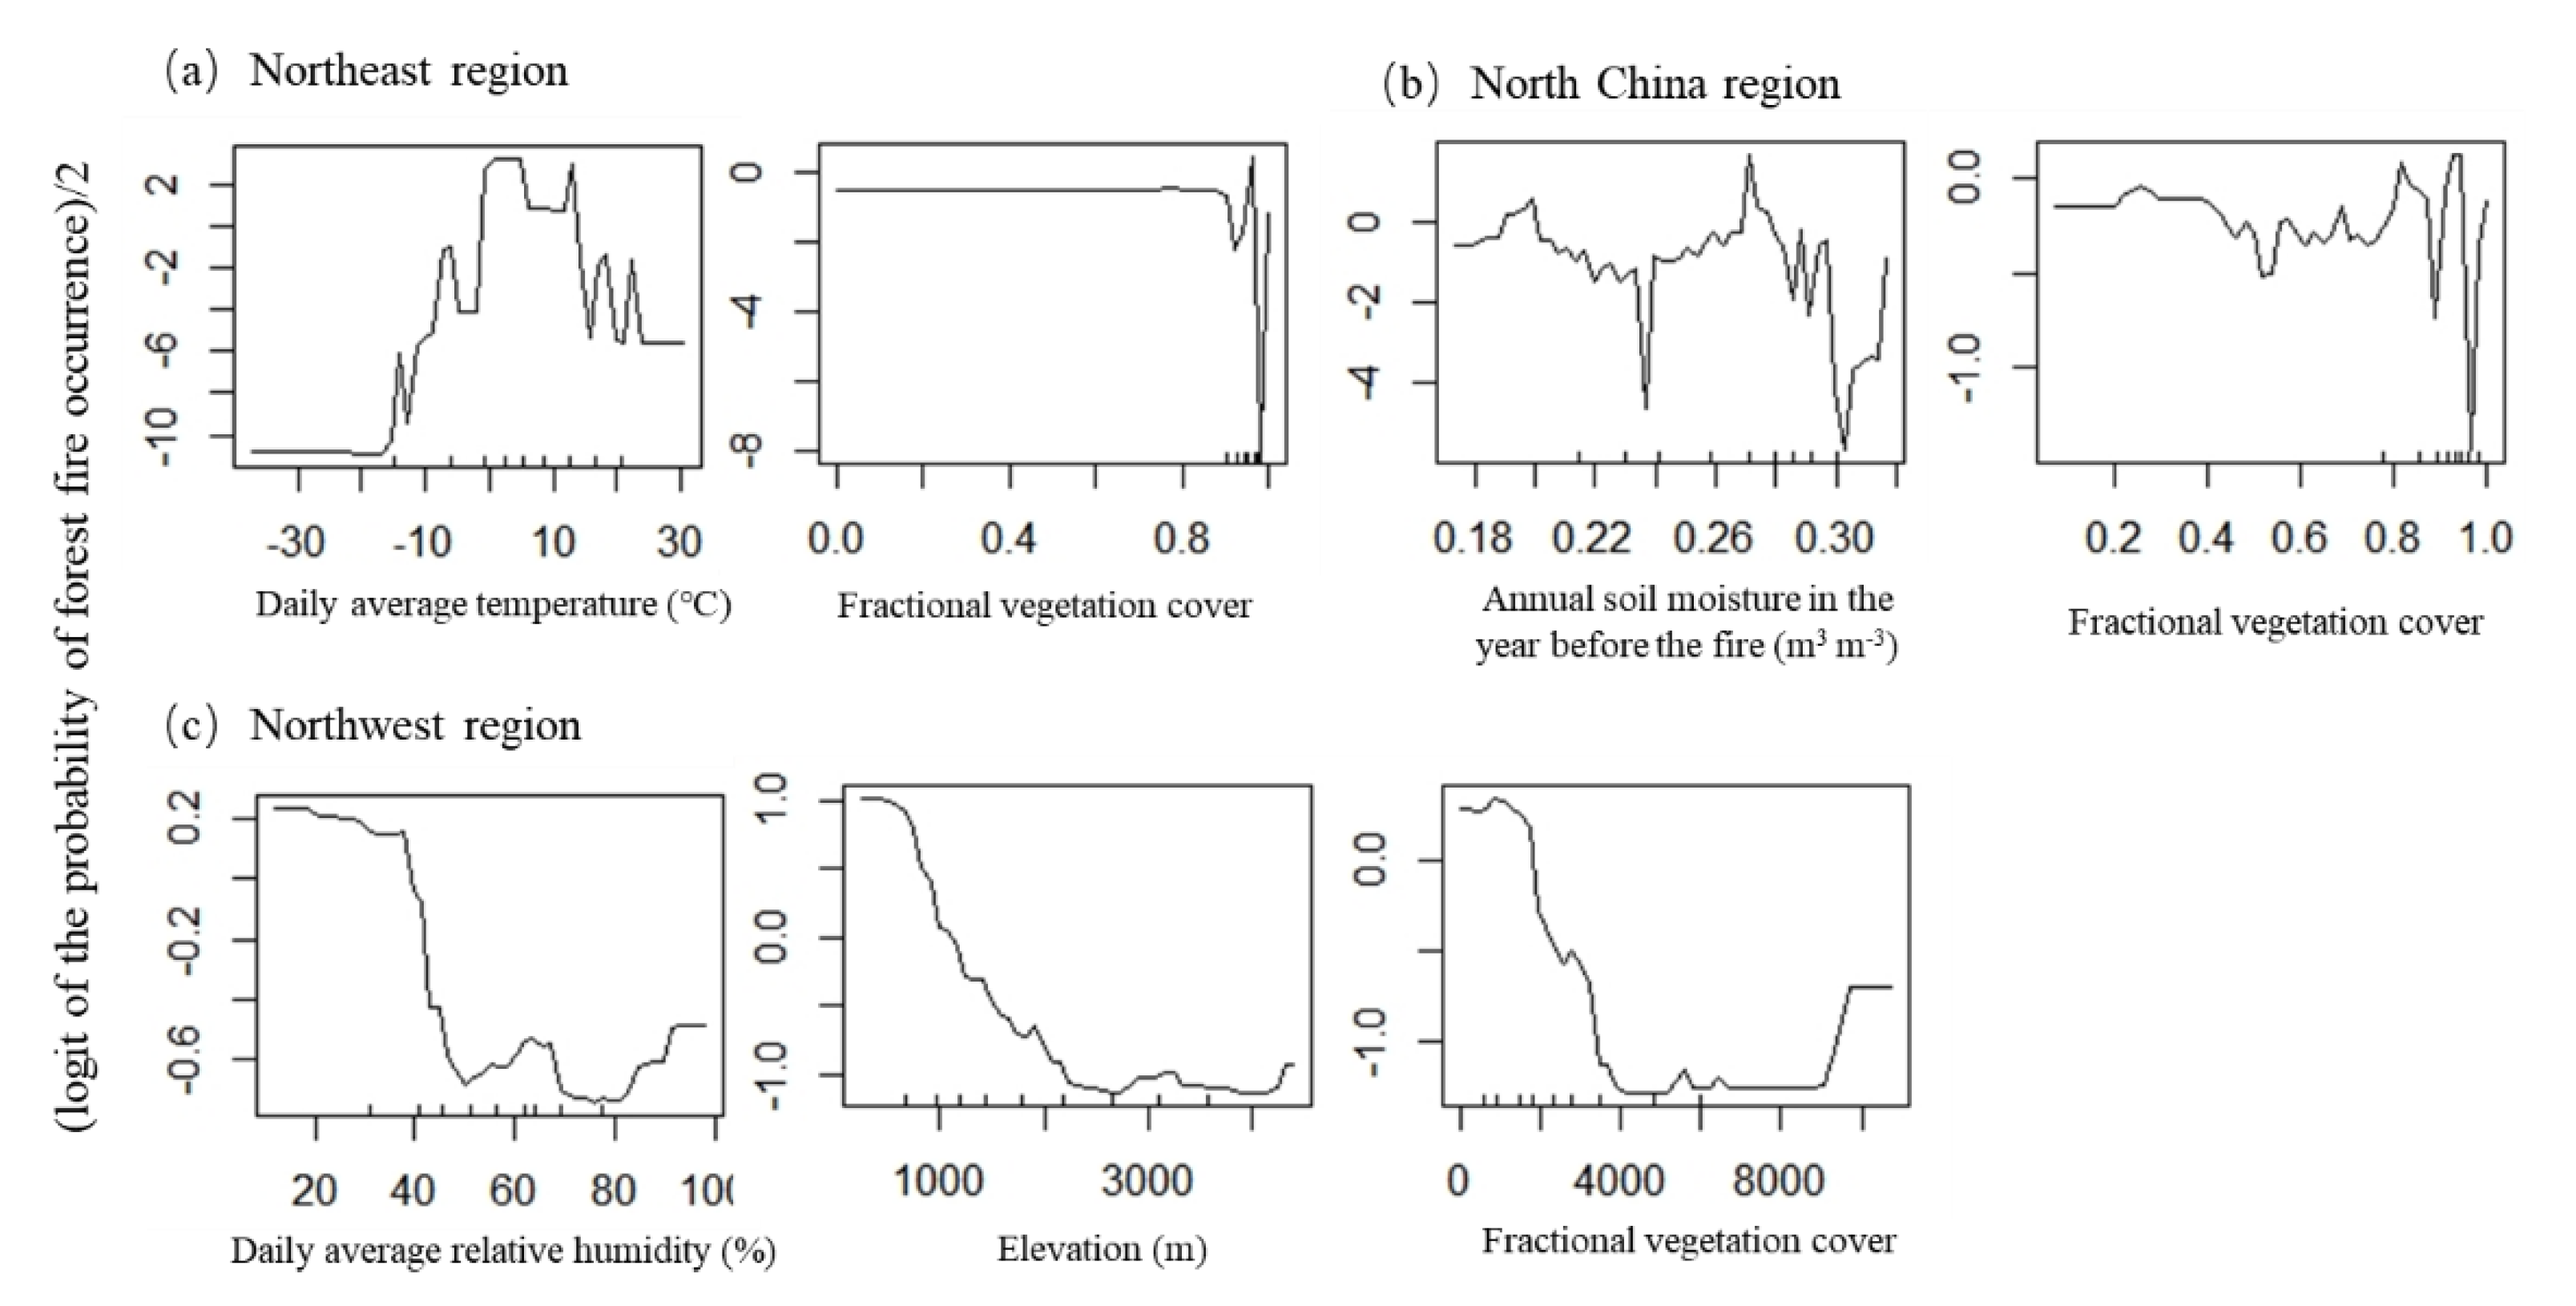
3.2. Influence of the Forest Fire Driving Factors on Forest Fire Occurrence in Different Regions
3.3. Model Prediction Accuracy in Different Regions
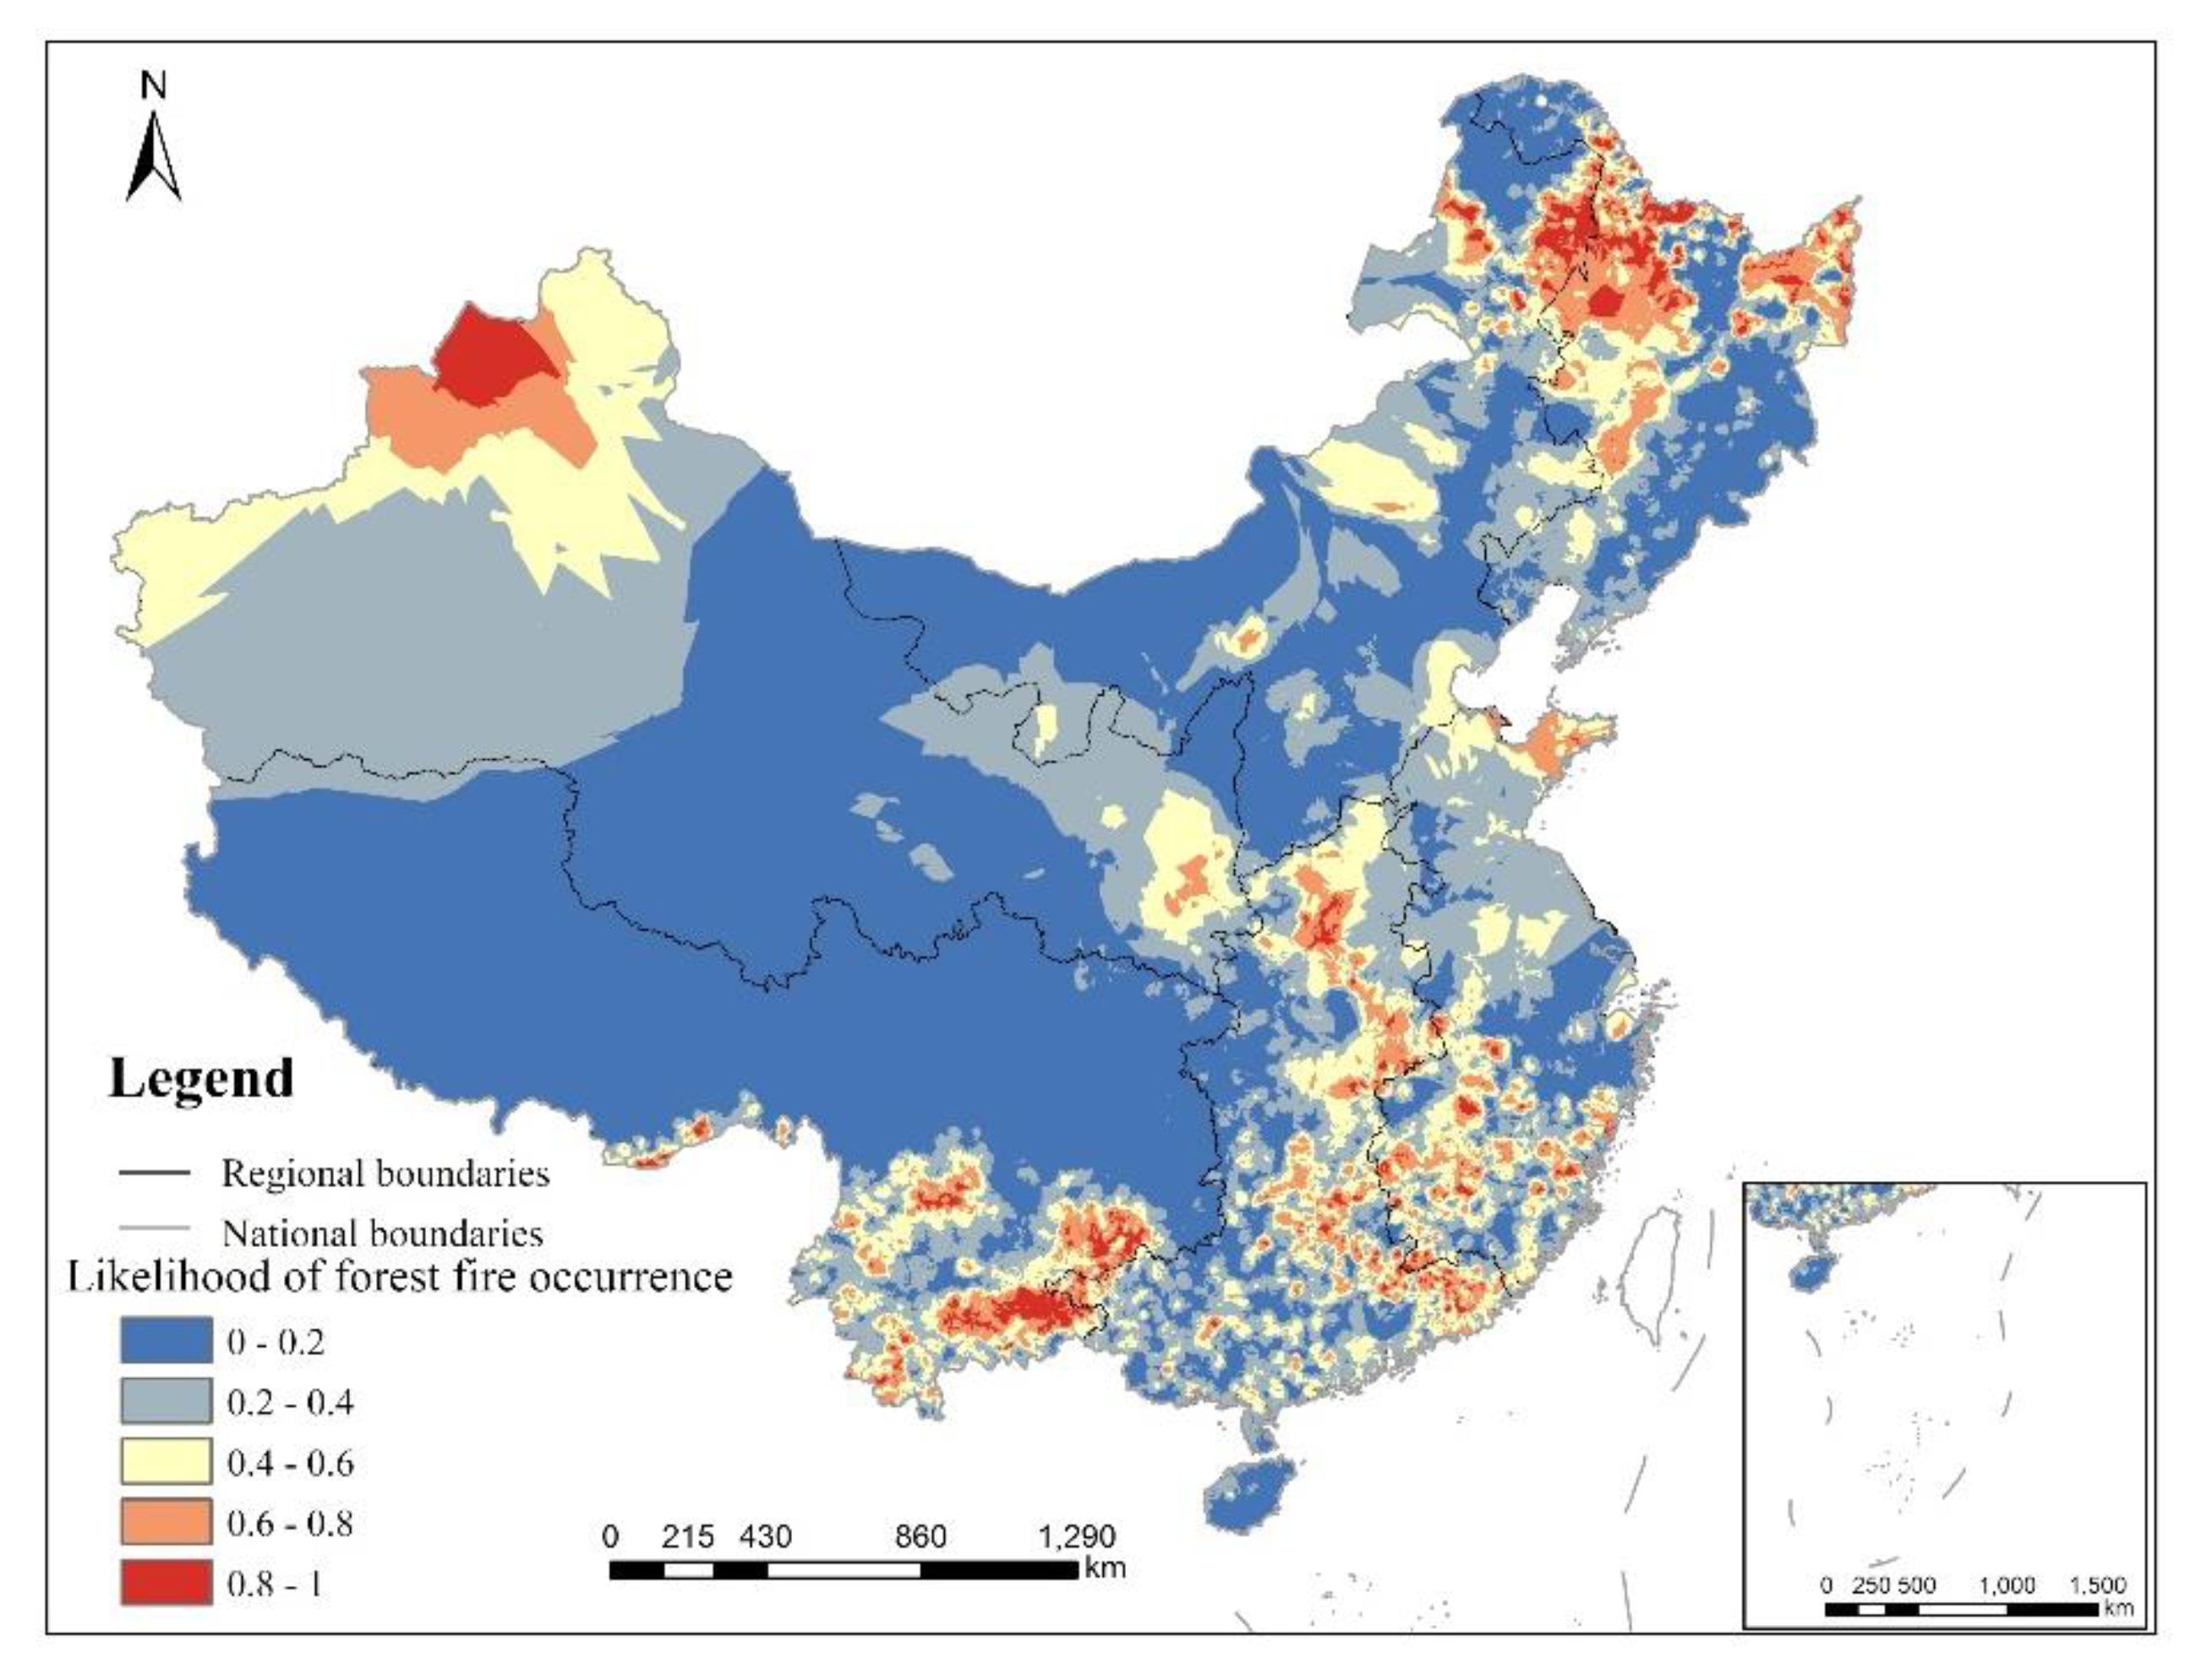
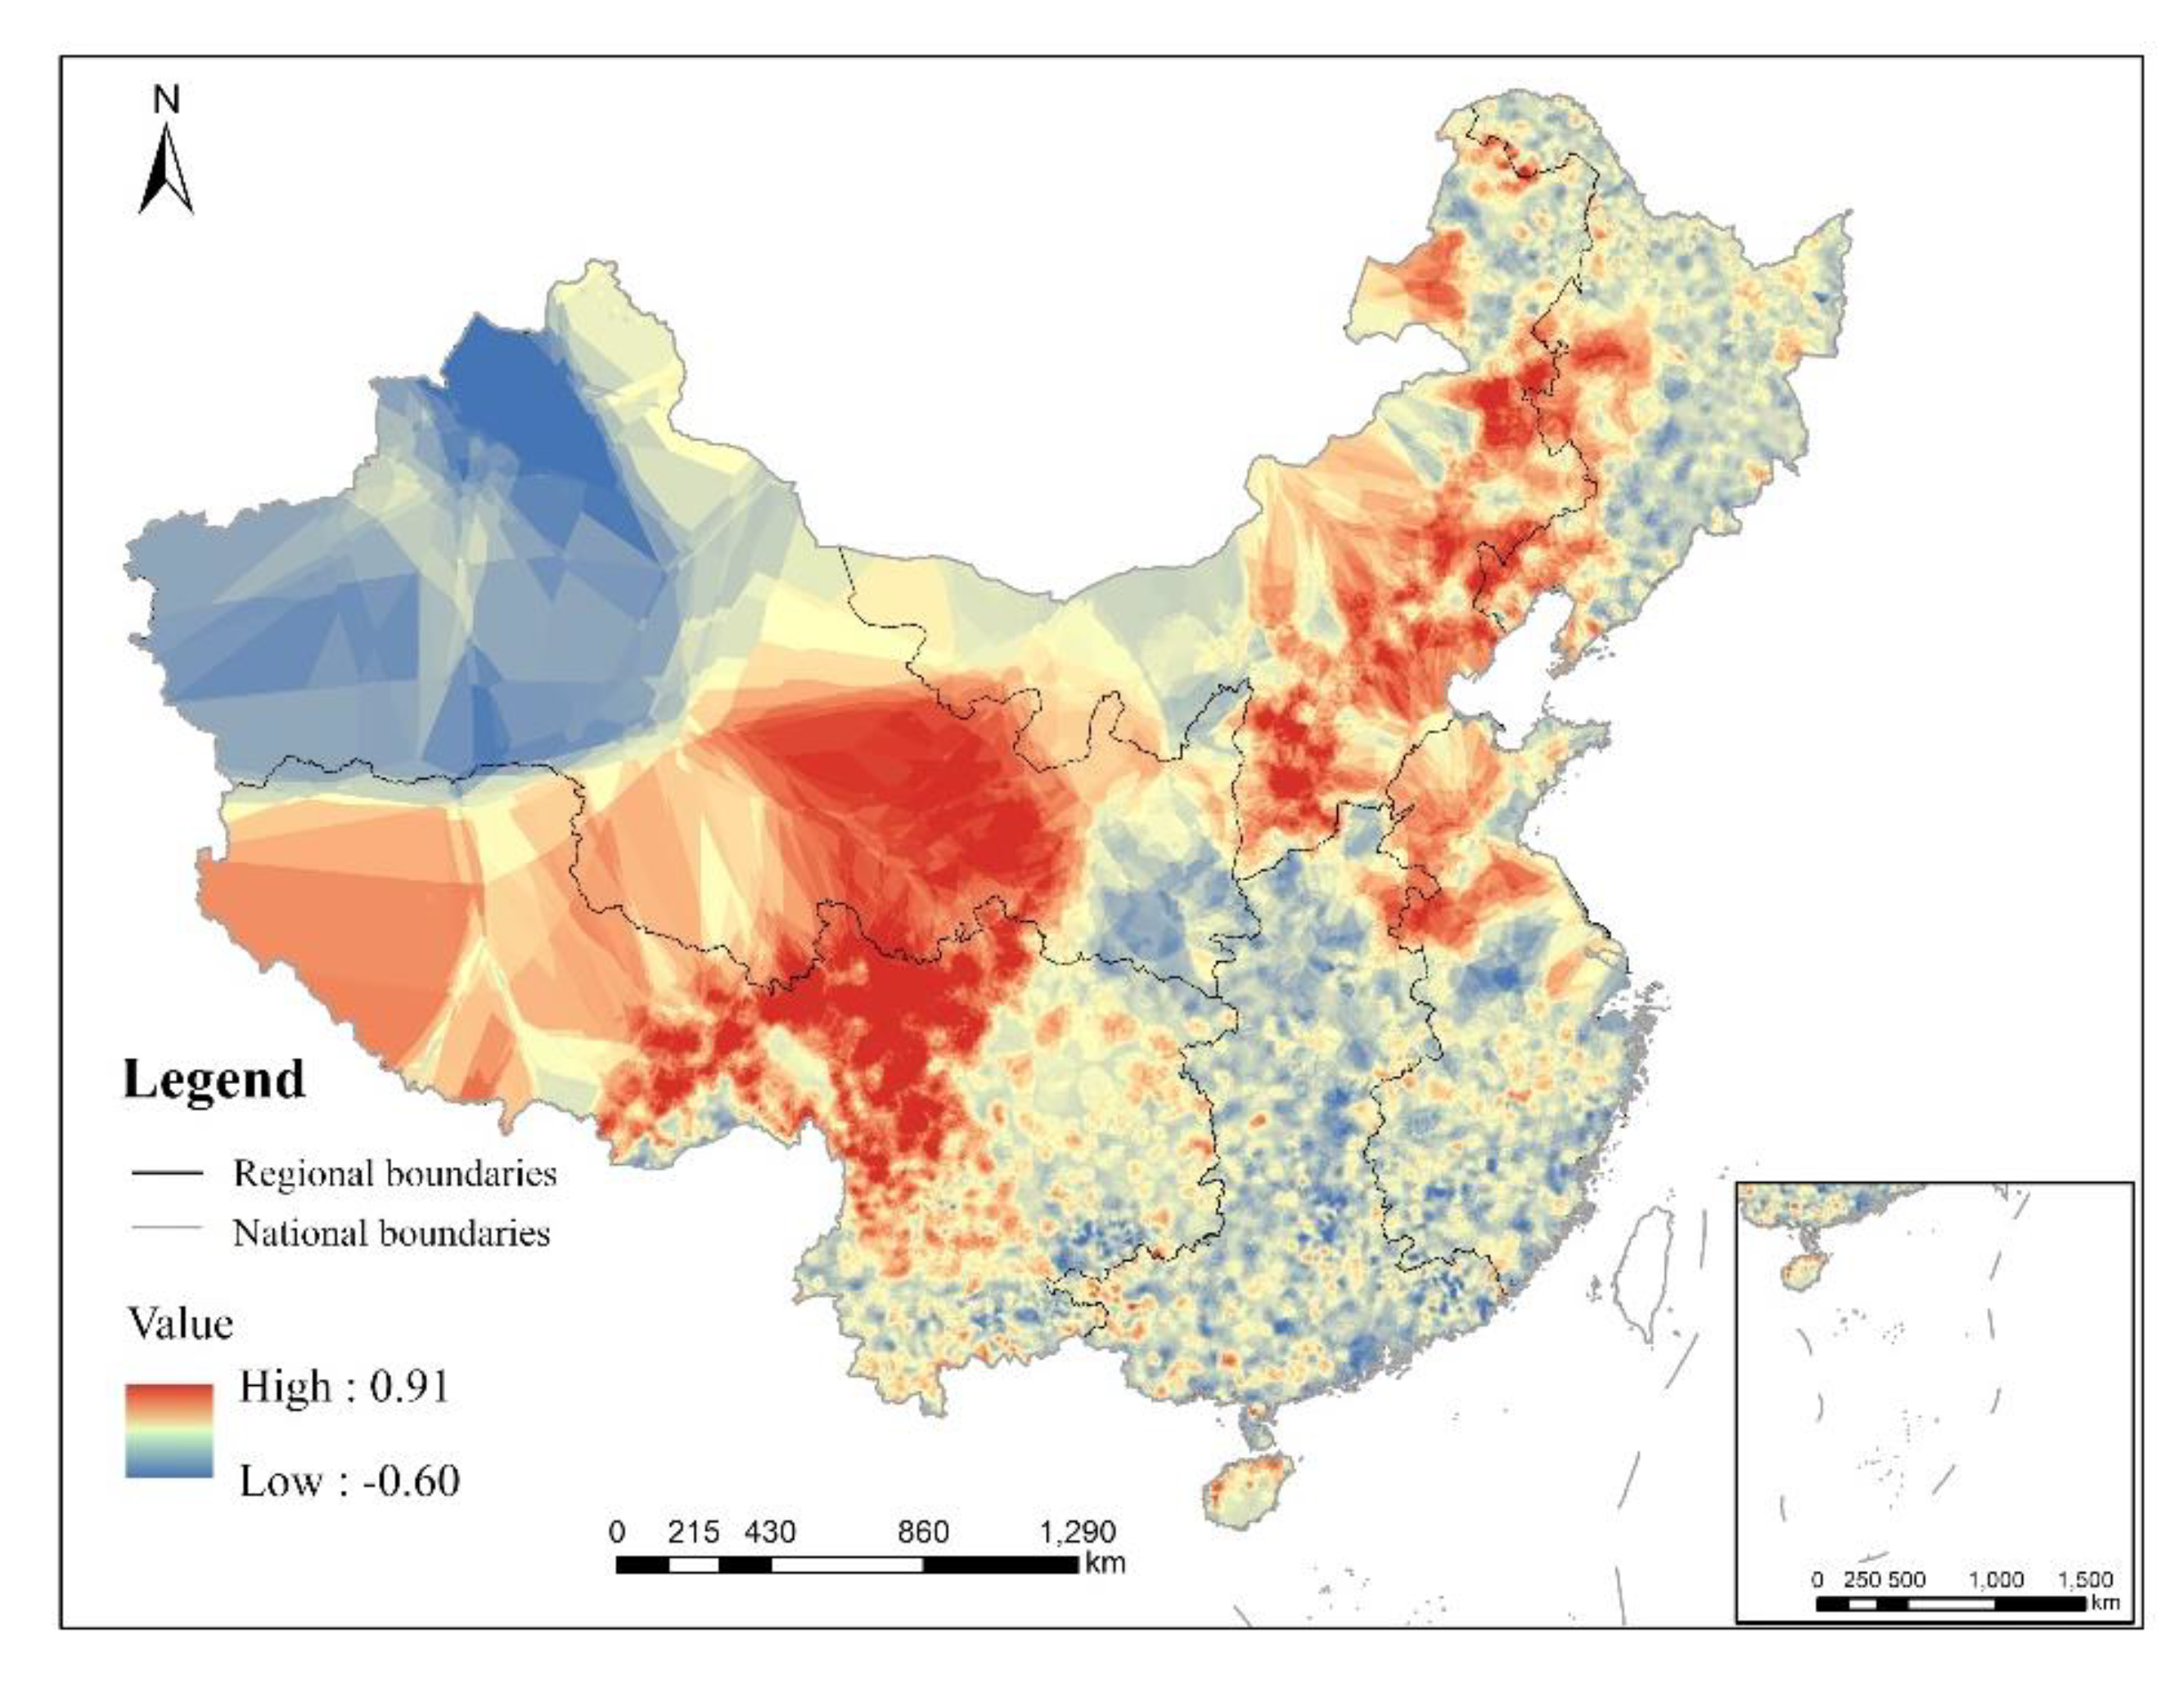
3.4. Likelihood of Forest Fire Occurrence
4. Discussion
4.1. Forest Fire Driving Factors and Their Influence
4.2. Implications for Forest Fire Prevention
4.3. Strengths and Limitations
5. Conclusions
Author Contributions
Funding
Acknowledgments
Conflicts of Interest
Appendix

| Variable Type | Variable | Intermediate Models | Selected Frequency | ||||
|---|---|---|---|---|---|---|---|
| 1 | 2 | 3 | 4 | 5 | |||
| (a) Northeast region | |||||||
| Climatic | Pre_year0 | 0 | |||||
| Pre_year1 | 0 | ||||||
| Soil_mois0 | 0 | ||||||
| Soil_mois1 | / | / | / | / | / | / | |
| Tem_avg | + | + | + | + | + | 5 | |
| GST_avg | / | / | / | / | / | / | |
| RH_avg | 0 | ||||||
| RH_min | 0 | ||||||
| Pre_daily | 0 | ||||||
| Pres_avg | 0 | ||||||
| SSD | 0 | ||||||
| Win_avg | 0 | ||||||
| Win_max | 0 | ||||||
| Topographic | DEM | 0 | |||||
| Aspect | 0 | ||||||
| Slope | 0 | ||||||
| Vegetation | FVC | + | + | + | + | + | 5 |
| Socioeconomic | Dis_road | 0 | |||||
| Dis_sett | 0 | ||||||
| Pop | 0 | ||||||
| GDP | 0 | ||||||
| (b) North China region | |||||||
| Climatic | Pre_year0 | 0 | |||||
| Pre_year1 | 0 | ||||||
| Soil_mois0 | + | + | + | + | 4 | ||
| Soil_mois1 | / | / | / | / | / | / | |
| Tem_avg | + | + | 2 | ||||
| GST_avg | / | / | / | / | / | / | |
| RH_avg | 0 | ||||||
| RH_min | 0 | ||||||
| Pre_daily | 0 | ||||||
| Pres_avg | + | 1 | |||||
| SSD | 0 | ||||||
| Win_avg | 0 | ||||||
| Win_max | 0 | ||||||
| Topographic | DEM | + | 1 | ||||
| Aspect | 0 | ||||||
| Slope | 0 | ||||||
| Vegetation | FVC | + | + | + | + | + | 5 |
| Socioeconomic | Dis_road | 0 | |||||
| Dis_sett | 0 | ||||||
| Pop | + | 1 | |||||
| GDP | 0 | ||||||
| (c) Northwest region | |||||||
| Climatic | Pre_year0 | 0 | |||||
| Pre_year1 | + | 1 | |||||
| Soil_mois0 | 0 | ||||||
| Soil_mois1 | / | / | / | / | / | / | |
| Tem_avg | 0 | ||||||
| GST_avg | / | / | / | / | / | / | |
| RH_avg | + | + | + | 3 | |||
| RH_min | 0 | ||||||
| Pre_daily | 0 | ||||||
| Pres_avg | + | + | 2 | ||||
| SSD | 0 | ||||||
| Win_avg | + | 1 | |||||
| Win_max | 0 | ||||||
| Topographic | DEM | + | + | + | + | 4 | |
| Aspect | + | 1 | |||||
| Slope | 0 | ||||||
| Vegetation | FVC | 0 | |||||
| Socioeconomic | Dis_road | + | + | + | 3 | ||
| Dis_sett | 0 | ||||||
| Pop | 0 | ||||||
| GDP | + | 1 | |||||
| (d) Southwest region | |||||||
| Climatic | Pre_year0 | + | + | + | + | + | 5 |
| Pre_year1 | + | + | + | + | + | 5 | |
| Soil_mois0 | + | + | + | + | + | 5 | |
| Soil_mois1 | + | + | + | + | + | 5 | |
| Tem_avg | + | + | + | + | + | 5 | |
| GST_avg | / | / | / | / | / | / | |
| RH_avg | + | + | + | + | + | 5 | |
| RH_min | + | + | + | + | + | 5 | |
| Pre_daily | 0 | ||||||
| Pres_avg | + | + | + | + | + | 5 | |
| SSD | 0 | ||||||
| Win_avg | + | + | 2 | ||||
| Win_max | + | + | + | 3 | |||
| Topographic | DEM | + | + | + | + | + | 5 |
| Aspect | 0 | ||||||
| Slope | 0 | ||||||
| Vegetation | FVC | + | + | + | + | + | 5 |
| Socioeconomic | Dis_road | 0 | |||||
| Dis_sett | 0 | ||||||
| Pop | + | + | + | + | + | 5 | |
| GDP | + | + | + | + | + | 5 | |
| (e) Mid-south region | |||||||
| Climatic | Pre_year0 | + | + | 2 | |||
| Pre_year1 | + | 1 | |||||
| Soil_mois0 | + | 1 | |||||
| Soil_mois1 | / | / | / | / | / | / | |
| Tem_avg | + | + | + | + | + | 5 | |
| GST_avg | / | / | / | / | / | / | |
| RH_avg | + | 1 | |||||
| RH_min | + | + | + | + | + | 5 | |
| Pre_daily | + | 1 | |||||
| Pres_avg | + | 1 | |||||
| SSD | 0 | ||||||
| Win_avg | 0 | ||||||
| Win_max | 0 | ||||||
| Topographic | DEM | 0 | |||||
| Aspect | 0 | ||||||
| Slope | 0 | ||||||
| Vegetation | FVC | + | + | + | + | + | 5 |
| Socioeconomic | Dis_road | 0 | |||||
| Dis_sett | 0 | ||||||
| Pop | 0 | ||||||
| GDP | + | 1 | |||||
| (f) East China region | |||||||
| Climatic | Pre_year0 | 0 | |||||
| Pre_year1 | 0 | ||||||
| Soil_mois0 | 0 | ||||||
| Soil_mois1 | / | / | / | / | / | / | |
| Tem_avg | + | + | + | + | + | 5 | |
| GST_avg | / | / | / | / | / | / | |
| RH_avg | 0 | ||||||
| RH_min | 0 | ||||||
| Pre_daily | 0 | ||||||
| Pres_avg | 0 | ||||||
| SSD | 0 | ||||||
| Win_avg | 0 | ||||||
| Win_max | 0 | ||||||
| Topographic | DEM | 0 | |||||
| Aspect | 0 | ||||||
| Slope | 0 | ||||||
| Vegetation | FVC | + | + | + | + | + | 5 |
| Socioeconomic | Dis_road | 0 | |||||
| Dis_sett | 0 | ||||||
| Pop | 0 | ||||||
| GDP | 0 | ||||||
| (g) The whole study area | |||||||
| Climatic | Pre_year0 | 0 | |||||
| Pre_year1 | 0 | ||||||
| Soil_mois0 | 0 | ||||||
| Soil_mois1 | / | / | / | / | / | / | |
| Tem_avg | 0 | ||||||
| GST_avg | / | / | / | / | / | / | |
| RH_avg | 0 | ||||||
| RH_min | + | + | + | + | + | 5 | |
| Pre_daily | 0 | ||||||
| Pres_avg | 0 | ||||||
| SSD | 0 | ||||||
| Win_avg | 0 | ||||||
| Win_max | 0 | ||||||
| Topographic | DEM | 0 | |||||
| Aspect | 0 | ||||||
| Slope | 0 | ||||||
| Vegetation | FVC | + | + | + | + | + | 5 |
| Socioeconomic | Dis_road | 0 | |||||
| Dis_sett | 0 | ||||||
| Pop | 0 | ||||||
| GDP | 0 | ||||||

References
- Morales-Hidalgo, D.; Oswalt, S.N.; Somanathan, E. Status and trends in global primary forest, protected areas, and areas designated for conservation of biodiversity from the global forest resources assessment 2015. For. Ecol. Manag. 2015, 352, 68–77. [Google Scholar] [CrossRef] [Green Version]
- Köhl, M.; Lasco, R.; Cifuentes, M.; Jonsson, Ö.; Korhonen, K.T.; Mundhenk, P.; Navar, J.D.J.; Stinson, G. Changes in forest production, biomass and carbon: Results from the 2015 un fao global forest resource assessment. For. Ecol. Manag. 2015, 352, 21–34. [Google Scholar] [CrossRef] [Green Version]
- Keenan, R.J.; Reams, G.A.; Achard, F.; Freitas, J.V.D.; Grainger, A.; Lindquist, E. Dynamics of global forest area: Results from the fao global forest resources assessment 2015. For. Ecol. Manag. 2015, 352, 9–20. [Google Scholar] [CrossRef]
- Bergeron, Y.; Gauthier, S.; Flannigan, M.; Kafka, V. Fire regimes at the transition between mixedwood and coniferous boreal forest in northwestern quebec. Ecology 2004, 85, 1916–1932. [Google Scholar] [CrossRef]
- Piao, S.; Huang, M.; Zhuo, L.; Wang, X.; Ciais, P.; Canadell, J.G.; Kai, W.; Bastos, A.; Friedlingstein, P.; Houghton, R.A. Lower land-use emissions responsible for increased net land carbon sink during the slow warming period. Nat. Geosci. 2018, 11, 739–743. [Google Scholar] [CrossRef] [Green Version]
- Podur, J.; Martell, D.L.; Csillag, F. Spatial patterns of lightning-caused forest fires in Ontario, 1976–1998. Ecol. Model. 2003, 164, 1–20. [Google Scholar] [CrossRef]
- Bond, W.J.; Keeley, J.E. Fire as a global ‘herbivore’: The ecology and evolution of flammable ecosystems. Trends Ecol. Evol. 2005, 20, 387–394. [Google Scholar] [CrossRef]
- Pastro, L.A.; Dickman, C.R.; Letnic, M. Burning for biodiversity or burning biodiversity? Prescribed burn vs. Wildfire impacts on plants, lizards, and mammals. Ecol. Appl. 2011, 21, 3238–3253. [Google Scholar] [CrossRef]
- Thom, D.; Seidl, R. Natural disturbance impacts on ecosystem services and biodiversity in temperate and boreal forests. Biol. Rev. Camb. Philos. Soc. 2016, 91, 760–781. [Google Scholar] [CrossRef]
- Westerling, A.; Bryant, B. Climate change and wildfire in California. Clim. Chang. 2008, 87, 231–249. [Google Scholar] [CrossRef]
- Hering, A.S.; Bell, C.L.; Genton, M.G. Modeling spatio-temporal wildfire ignition point patterns. Environ. Ecol. Stat. 2009, 16, 225–250. [Google Scholar] [CrossRef] [Green Version]
- Mckenzie, D.; Shankar, U.; Keane, R.E.; Stavros, E.N.; Heilman, W.E.; Fox, D.G.; Riebau, A.C. Smoke consequences of new wildfire regimes driven by climate change. Earths Future 2014, 2, 35–59. [Google Scholar] [CrossRef]
- Shun, L.; Zhiwei, W.; Yu, L.; Hongshi, H. A review of fire controlling factors and their dynamics in boreal forest. World For. Res. 2017, 30, 41–45. [Google Scholar] [CrossRef]
- Dimopoulou, M.; Giannikos, I. Towards an integrated framework for forest fire control. Eur. J. Oper. Res. 2004, 152, 476–486. [Google Scholar] [CrossRef]
- Flannigan, M.D.; Krawchuk, M.A.; Groot, W.J.D.; Wotton, B.M.; Gowman, L.M. Implications of changing climate for global wildland fire. Int. J. Wildland Fire 2009, 18, 483–507. [Google Scholar] [CrossRef]
- Moreno, M.V.; Chuvieco, E. Characterising fire regimes in Spain from fire statistics. Int. J. Wildland Fire 2013, 22, 296–305. [Google Scholar] [CrossRef]
- Ganteaume, A.; Camia, A.; Jappiot, M.; San-Miguel-Ayanz, J.; Long-Fournel, M.; Lampin, C. A review of the main driving factors of forest fire ignition over Europe. Environ. Manag. 2013, 51, 651–662. [Google Scholar] [CrossRef] [Green Version]
- Guo, F.; Wang, G.; Su, Z.; Liang, H.; Liu, A. What drives forest fire in Fujian, China? Evidence from logistic regression and random forests. Int. J. Wildland Fire 2016, 25, 505–519. [Google Scholar] [CrossRef]
- Morgan, P.; Hardy, C.C.; Swetnam, T.W.; Rollins, M.G.; Long, D.G. Mapping fire regimes across time and space: Understanding coarse and fine-scale fire patterns. Int. J. Wildland Fire 2001, 10, 329–342. [Google Scholar] [CrossRef] [Green Version]
- Rollins, M.G.; Morgan, P.; Swetnam, T. Landscape-scale controls over 20th century fire occurrence in two large rocky mountain (USA) wilderness areas. Landsc. Ecol. 2002, 17, 539–557. [Google Scholar] [CrossRef]
- Sharples, J. An overview of mountain meteorological effects relevant to fire behaviour and bushfire risk. Int. J. Wildland Fire 2009, 18, 737–754. [Google Scholar] [CrossRef]
- Minnichl, R.A.; Bahrez, C.J. Wildland fire and chaparral succession along the California-Baja California boundary. Int. J. Wildland Fire 1995, 5, 13–24. [Google Scholar] [CrossRef]
- Pew, K.L.; Larsen, C.P.S. Gis analysis of spatial and temporal patterns of human-caused wildfires in the temperate rain forest of vancouver island, Canada. For. Ecol. Manag. 2001, 140, 1–18. [Google Scholar] [CrossRef]
- Pausas, J.G.; Paula, S. Fuel shapes the fire—climate relationship: Evidence from mediterranean ecosystems. Glob. Ecol. Biogeogr. 2012, 21, 1074–1082. [Google Scholar] [CrossRef]
- Maingi, J.K.; Henry, M.C. Factors influencing wildfire occurrence and distribution in eastern kentucky, USA. Int. J. Wildland Fire 2007, 16, 23–33. [Google Scholar] [CrossRef] [Green Version]
- Cardille, J.A.; Ventura, S.J.; Turner, M.G. Environmental and social factors influencing wildfires in the upper midwest, united states. Ecol. Appl. 2001, 11, 111–127. [Google Scholar] [CrossRef]
- Turco, M.; Llasat, M.C.; von Hardenberg, J.; Provenzale, A. Impact of climate variability on summer fires in a mediterranean environment (northeastern iberian peninsula). Clim. Chang. 2013, 116, 665–678. [Google Scholar] [CrossRef]
- Catry, F.X.; Rego, F.C.; Bação, F.; Moreira, F. Modeling and mapping wildfire ignition risk in portugal. Int. J. Wildland Fire 2009, 18, 921–931. [Google Scholar] [CrossRef] [Green Version]
- Guo, F.; Su, Z.; Wang, G.; Sun, L.; Tigabu, M.; Yang, X.; Hu, H. Understanding fire drivers and relative impacts in different chinese forest ecosystems. Sci. Total Environ. 2017, 411, 605–606. [Google Scholar] [CrossRef]
- Su, Z.; Hu, H.; Wang, G.; Ma, Y.; Yang, X.; Guo, F. Using GIS and random forests to identify fire drivers in a forest city, Yichun, China. Geomat. Nat. Hazards Risk 2018, 9, 1207–1229. [Google Scholar] [CrossRef] [Green Version]
- Oliveira, S.; Oehler, F.; San-Miguel-Ayanz, J.; Camia, A.; Pereira, J.M.C. Modeling spatial patterns of fire occurrence in mediterranean europe using multiple regression and random forest. For. Ecol. Manag. 2012, 275, 117–129. [Google Scholar] [CrossRef]
- Tian, X.; Zhao, F.; Shu, L.; Wang, M. Distribution characteristics and the influence factors of forest fires in China. For. Ecol. Manag. 2013, 310, 460–467. [Google Scholar] [CrossRef]
- Chang, Y.; Zhu, Z.; Bu, R.; Li, Y.; Hu, Y. Environmental controls on the characteristics of mean number of forest fires and mean forest area burned (1987–2007) in China. For. Ecol. Manag. 2015, 356, 13–21. [Google Scholar] [CrossRef]
- Zhong, M.; Fan, W.; Liu, T.; Li, P. Statistical analysis on current status of China forest fire safety. Fire Saf. J. 2003, 38, 257–269. [Google Scholar] [CrossRef]
- Aifeng, L.U. Study on the relationship among forest fire, temperature and precipitation and its spatial-temporal variability in China. Agric. Sci. Technol. 2011, 12, 1396–1400. [Google Scholar] [CrossRef]
- Ying, L.; Han, J.; Du, Y.; Shen, Z. Forest fire characteristics in China: Spatial patterns and determinants with thresholds. For. Ecol. Manag. 2018, 424, 345–354. [Google Scholar] [CrossRef]
- Huiling, L. Based on Spatial and Non-Spatial Model and Influence Factors Analysis of the Space-Time Characteristics of Fujian Forest Fires; Fujian Agriculture and Forestry University: Fuzhou, China, 2016. [Google Scholar]
- Ma, W.; Feng, Z.; Cheng, Z.; Wang, F. Study on driving factors and distribution pattern of forest fires in shanxi province. J. Cent. South Univ. For. Technol. 2020. Available online: https://kns.cnki.net/KCMS/detail/43.1470.S.20200115.1043.001.html (accessed on 5 March 2020). [CrossRef]
- State Forestry Administ-Ration. China Forest Resources Inventory Repor; China Forestry Publishing House: Beijing, China, 2014; pp. 80–81. ISBN 978-7-5038-7424-6.
- National Bureau of Statistics. China statistical Yearbook. 2018. Available online: http://www.stats.gov.cn/tjsj/ndsj/ (accessed on 10 July 2019).
- Andela, N.; Morton, D.; Giglio, L.; Paugam, R.; Chen, Y.; Hantson, S.; Werf, G.; Randerson, J. The global fire atlas of individual fire size, duration, speed, and direction. Earth Syst. Sci. Data Discuss. 2018, 11, 1–28. [Google Scholar] [CrossRef] [Green Version]
- Peng, S.; Ding, Y.; Liu, W.; Li, Z. 1 km monthly temperature and precipitation dataset for China from 1901 to 2017. Earth Syst. Sci. Data 2019, 11, 1931–1946. [Google Scholar] [CrossRef] [Green Version]
- Zhang, Z.X.; Zhang, H.Y.; Zhou, D.W. Using GIS spatial analysis and logistic regression to predict the probabilities of human-caused grassland fires. J. Arid Environ. 2010, 74, 386–393. [Google Scholar] [CrossRef]
- Yu, M. The Research of Forest Fire Prediction Model in Fangshan District, Beijing and Sublot Fire Danger Rating Division; Beijing Forestry University: Beijing, China, 2016. [Google Scholar]
- Vilar, L.; Woolford, D.; Martell, D.; Martín, M. A model for predicting human-caused wildfire occurrence in the region of madrid, Spain. Int. J. Wildland Fire 2010, 19, 325–337. [Google Scholar] [CrossRef]
- Prasad, V.K.; Badarinath, K.V.S.; Eaturu, A. Biophysical and anthropogenic controls of forest fires in the deccan plateau, india. J. Environ. Manag. 2008, 86, 1–13. [Google Scholar] [CrossRef] [PubMed]
- Sturtevant, B.; Cleland, D. Human and biophysical factors influencing modern fire disturbance in northern wisconsin. Int. J. Wildland Fire 2007, 16, 398–413. [Google Scholar] [CrossRef] [Green Version]
- Gitelson, A.A.; Kaufman, Y.J.; Stark, R.; Rundquist, D. Novel algorithms for remote estimation of vegetation fraction. Remote Sens. Environ. 2002, 80, 76–87. [Google Scholar] [CrossRef] [Green Version]
- Leprieur, C.; Verstraete, M.M.; Pinty, B. Evaluation of the performance of various vegetation indices to retrieve vegetation cover from avhrr data. Remote Sens. Rev. 1994, 10, 265–284. [Google Scholar] [CrossRef]
- Purevdorj, T.S.; Tateishi, R.; Ishiyama, T.; Honda, Y. Relationships between percent vegetation cover and vegetation indices. Int. J. Remote Sens. 1998, 19, 3519–3535. [Google Scholar] [CrossRef]
- Xu, X. China Quarterly Vegetation Index (ndvi) Spatial Distribution Data Set; Data Registration and Publishing System of Resource and Environment Science Data Center of Chinese Academy of Science: Beijing, China, 2018; Available online: http://www.resdc.cn/10.12078/2018060603 (accessed on 10 January 2019). [CrossRef]
- Rodrigues, M.; Riva, J. An insight into machine-learning algorithms to model human-caused wildfire occurrence. Environ. Model. Softw. 2014, 57, 192–201. [Google Scholar] [CrossRef]
- Duro, D.C.; Franklin, S.E.; Dubé, M.G. Multi-scale object-based image analysis and feature selection of multi-sensor earth observation imagery using random forests. Int. J. Remote Sens. 2012, 33, 4502–4526. [Google Scholar] [CrossRef]
- Marston, C.G.; Danson, F.M.; Armitage, R.P.; Giraudoux, P.; Pleydell, D.R.J.; Wang, Q.; Qui, J.; Craig, P.S. A random forest approach for predicting the presence of echinococcus multilocularis intermediate host ochotona spp. Presence in relation to landscape characteristics in western China. Appl. Geogr. 2014, 55, 176–183. [Google Scholar] [CrossRef] [Green Version]
- Abdel-Rahman, E.M.; Ahmed, F.B.; Ismail, R. Random forest regression and spectral band selection for estimating sugarcane leaf nitrogen concentration using eo-1 hyperion hyperspectral data. Int. J. Remote Sens. 2013, 34, 712–728. [Google Scholar] [CrossRef]
- Liang, H.; Lin, Y.; Yang, G.; Su, Z.; Wang, W.; Guo, F. Application of random forest algorithm on the forest fire prediction in Tahe area based on meteorological factors. Sci. Silvae Sin. 2016, 52, 89–98. [Google Scholar] [CrossRef]
- Liaw, A.; Wiener, M. Classification and regression by randomforest. R News 2002, 2, 18–22. [Google Scholar]
- Jiménez-Valverde, A. Insights into the area under the receiver operating characteristic curve (AUC) as a discrimination measure in species distribution modelling. Glob. Ecol. Biogeogr. 2012, 21, 498–507. [Google Scholar] [CrossRef]
- Chang, Y.; Bu, R.; Chen, H.; Feng, Y.; Li, Y.; Hu, Y.; Wang, Z. Predicting fire occurrence patterns with logistic regression in heilongjiang province, China. Landsc. Ecol. 2013, 28, 1989–2004. [Google Scholar] [CrossRef]
- Vilar, L.; Martín, M.; Martinez-Vega, J. Logistic regression models for human-caused wildfire risk estimation: Analysing the effect of the spatial accuracy in fire occurrence data. Eur. J. For. Res. 2011, 130, 983–996. [Google Scholar] [CrossRef]
- Martínez, J.; Vega-Garcia, C.; Chuvieco, E. Human-caused wildfire risk rating for prevention planning in Spain. J. Environ. Manag. 2009, 90, 1241–1252. [Google Scholar] [CrossRef]
- Vega-Garcia, C.; Woodard, P.M.; Titus, S.J.; Adamowicz, L.; Lee, B.S. A logit model for predicting the daily occurrence of human caused forest-fires. Int. J. Wildland Fire 1995, 5, 101–111. [Google Scholar] [CrossRef]
- Prasad, A.M.; Iverson, L.R.; Liaw, A. Newer classification and regression tree techniques: Bagging and random forests for ecological prediction. Ecosystems 2006, 9, 181–199. [Google Scholar] [CrossRef]
- Zumbrunnen, T.; Pezzatti, G.B.; Menéndez, P.; Bugmann, H.; Bürgi, M.; Conedera, M. Weather and human impacts on forest fires: 100 years of fire history in two climatic regions of switzerland. For. Ecol. Manag. 2011, 261, 2188–2199. [Google Scholar] [CrossRef]
- Wotton, M.; Martell, D.; Logan, K. Climate change and people-caused forest fire occurrence in Ontario. Clim. Chang. 2003, 60, 275–295. [Google Scholar] [CrossRef]
- Varela, V.; Vlachogiannis, D.; Sfetsos, A.; Karozis, S.; Politi, N.; Giroud, F. Projection of forest fire danger due to climate change in the french mediterranean region. Sustainability 2019, 11, 4284. [Google Scholar] [CrossRef] [Green Version]
- Chuvieco, E.; Cocero, D.; Riaño, D.; Martin, P.; Martínez-Vega, J.; de la Riva, J.; Pérez, F. Combining ndvi and surface temperature for the estimation of live fuel moisture content in forest fire danger rating. Remote Sens. Environ. 2004, 92, 322–331. [Google Scholar] [CrossRef]
- Hu, T.; Zhou, G. Drivers of lightning- and human-caused fire regimes in the great xing’an mountains. For. Ecol. Manag. 2014, 329, 49–58. [Google Scholar] [CrossRef]
- Song, Z. Principle and Forecast of Forest Fire, 1st ed.; China Meteorological Press: Beijing, China, 1991; pp. 56–57. ISBN 7502905820. [Google Scholar]
- Sebastian, A.; Salvador, R.; Gonzalo Jimenez, J.; San-Miguel-Ayanz, J. Integration of socio-economic and environmental variables for modelling long-term fire danger in southern europe. Eur. J. For. Res. 2008, 127, 149–163. [Google Scholar] [CrossRef]
- González, J.R.; Palahí, M.; Trasobares, A.; Pukkala, T. A fire probability model for forest stands in Catalonia (north-east Spain). Ann. For. Sci. 2006, 63, 169–176. [Google Scholar] [CrossRef]
- Syphard, A.; Radeloff, V.; Keeley, J.; Hawbaker, T.; Clayton, M.; Stewart, S.; Hammer, R. Human influence on California fire regimes. Ecol. Appl. Publ. Ecol. Soc. Am. 2007, 17, 1388–1402. [Google Scholar] [CrossRef] [PubMed]
- Pereira, M.G.; Malamud, B.D.; Trigo, R.M.; Alves, P.I. The history and characteristics of the 1980–2005 Portuguese rural fire database. Nat. Hazards Earth Syst. Sci. 2011, 11, 3343–3358. [Google Scholar] [CrossRef]
- Saglam, B.; Bilgili, E.; Dincdurmaz, B.; Kadiogulari, A.I.; Kücük, Ö. Spatio-temporal analysis of forest fire risk and danger using landsat imagery. Sensors 2008, 8, 3970–3987. [Google Scholar] [CrossRef] [Green Version]
- Tian, X.; Shu, L.; Zhao, F.; Wang, M. Dynamic characteristics of forest fires in the main ecological geographic districts of China. Sci. Silvae Sin. 2015, 51, 71–77. [Google Scholar] [CrossRef]
- Wu, Z.; He, H.S.; Keane, R.E.; Zhu, Z.; Wang, Y.; Shan, Y. Current and future patterns of forest fire occurrence in China. Int. J. Wildland Fire 2020, 29, 104–119. [Google Scholar] [CrossRef]
- Lu, J.; Feng, Z.; Zhu, Y. Estimation of forest biomass and carbon storage in China based on forest resources inventory data. Forests 2019, 10, 650. [Google Scholar] [CrossRef] [Green Version]
- Qiu, Z.; Feng, Z.; Song, Y.; Li, M.; Zhang, P. Carbon sequestration potential of forest vegetation in China from 2003 to 2050: Predicting forest vegetation growth based on climate and the environment. J. Clean. Prod. 2020, 252, 119715. [Google Scholar] [CrossRef]
- Cutler, D.R.; Edwards, T.C., Jr.; Beard, K.H.; Cutler, A.; Hess, K.T.; Gibson, J.; Lawler, J.J. Random forests for classification in ecology. Ecology 2007, 88, 2783–2792. [Google Scholar] [CrossRef] [PubMed]


| Study Area | Province | Main Climate Types | Topography | Dominant Vegetation Types | Socioeconomic Conditions |
|---|---|---|---|---|---|
| Northeast region | Heilongjiang, Jilin, and Liaoning | Middle temperate monsoon climate | Dominant terrain is plains and mountains. The elevation in most areas is below 500 m. | Temperate coniferous broadleaved mixed forests and cold temperate coniferous forest. Forest coverage is 41.59% [39]. | The total population is 108.75 million. The per capita GDP is ¥49,891 yuan [40]. |
| North China region | Inner Mongolia, Shanxi, Beijing, Tianjin, and Hebei | Middle temperate continental climate and warm temperate monsoon climate | The dominant terrain types are plateaus and hills. The elevation in most areas is below 2000 m. | Warm temperate deciduous broadleaved forest and temperate grassland. Forest coverage is 21.09% [39]. | The total population is 174.79 million. The per capita GDP is ¥64,194 yuan [40]. |
| East China region | Shandong, Jiangsu, Anhui, Zhejiang, Shanghai, Jiangxi, and Fujian | Warm temperate monsoon climate and subtropical monsoon climate | The dominant terrain types are plains and mountains. The elevation in most areas is below 1000 m. | Warm temperate deciduous broadleaved forest and subtropical evergreen broadleaved forest. Forest coverage is 40.64% [39]. | The total population is 408.98 million. The per capita GDP is ¥78,271 yuan [40] (China Statistical Yearbook, 2018). |
| Northwest region | Xinjiang, Gansu, Ningxia, Qinghai, and Shaanxi | Warm temperate continental climate | The dominant terrain types, which fluctuate greatly, are deserts and high mountains. The elevation in most areas is between 500 and 5000 m. | Temperate desert and alpine vegetation on the Qinghai-Tibetan plateau. Forest coverage is 8.21% [39]. | The total population is 101.86 million. The per capita GDP is ¥45,463 yuan [40]. |
| Southwest region | Tibet, Sichuan, Chongqing, Yunnan, and Guizhou | Subtropical monsoon climate and alpine climate | The terrain is complex and consists of basins, plateaus and mountains. The elevation in most areas is between 500 and 6000 m. | Alpine vegetation on the Qinghai-Tibetan plateau, subtropical evergreen broadleaved forest and tropical rainforest. Forest coverage is 25.75% [39]. | The total population is 200.95 million. The per capita GDP is ¥43,609 yuan [40]. |
| Mid-south region | Henan, Hubei, Hunan, Guangxi, Guangdong, and Hainan | Subtropical monsoon climate and tropical monsoon climate | The dominant terrain types are plains and mountains. The elevation in most areas is below 1000 m. | Subtropical evergreen broadleaved forest and tropical rainforest. Forest coverage is 44.63% [39]. | The total population is 393.01 million. The per capita GDP is ¥57,664 yuan [40]. |
| Variable Type | Variable Name | Code | Source | Resolution, Units | References |
|---|---|---|---|---|---|
| Climatic | Annual precipitation in the year before the fire | Pre_year0 | National Earth System Science Data Sharing Infrastructure, National Science & Technology Infrastructure of China (http://www.geodata.cn) | 0.25°, 0.1 mm | [18,31,42] |
| Annual precipitation in the year of the fire | Pre_year1 | 0.25°, 0.1 mm | |||
| Annual soil moisture in the year before the fire | Soil_mois0 | 0.25°, m3 m−3 | |||
| Annual soil moisture in the year of the fire | Soil_mois1 | 0.25°, m3 m−3 | |||
| Daily average ground surface temperature | GST_avg | Daily Data Set of China’s Surface Climate Data (V3.0), National Meteorological Information Centre (http://data.cma.cn) | 0.1 °C | [18,31,37,43,44] | |
| Daily precipitation | Pre_daily | 0.1 mm | |||
| Daily average air pressure | Pres_avg | 0.1 hPa | |||
| Daily average relative humidity | RH_avg | % | |||
| Daily minimum relative humidity | RH_min | % | |||
| Sunshine hours | SSD | 0.1 h | |||
| Daily average temperature | Tem_avg | 0.1 °C | |||
| Daily average wind speed | Win_avg | 0.1 m/s | |||
| Daily maximum wind speed | Win_max | 0.1 m/s | |||
| Topographic | Elevation | Elevation | Geospatial Data Cloud site, Computer Network Information Center, Chinese Academy of Sciences (http://www.gscloud.cn) | 90 m, m | [28,29,45,46] |
| Slope | Slope | 90 m, ° | |||
| Aspect | Aspect | 90 m | |||
| Vegetation | Fractional vegetation cover | FVC | Resource and Environment Data Cloud Platform (http://www.resdc.cn)(Xu,2018) | 1 km | [18] |
| Socioeconomic | The distance to road and railway | Dis_road | National Catalogue Service for Geographic Information website (http://www.webmap.cn) | 1:1,000,000, m | [18,28,29,46,47] |
| The distance to settlement | Dis_sett | 1:1,000,000, m | |||
| Population density | POP | National Earth System Science Data Center (http://www.geodata.cn) | 1 km, number/km2 | ||
| Per capita gross national product | GDP | 1 km, RMB/km2 |
| Aspect | Azimuth (°) |
|---|---|
| North | 337.5~22.5 |
| Northeast | 22.5~67.5 |
| East | 67.5~112.5 |
| Southeast | 112.5~157.5 |
| South | 157.5~202.5 |
| Southwest | 202.5~247.5 |
| Variable Type | Variable | NE | N | NW | SW | MS | E | The Whole Study Area |
|---|---|---|---|---|---|---|---|---|
| Climatic | Pre_year0 | + | ||||||
| Pre_year1 | + | |||||||
| Soil_mois0 | + | + | ||||||
| Soil_mois1 | / | / | / | + | / | / | / | |
| Tem_avg | + | + | + | + | ||||
| GST_avg | / | / | / | / | / | / | / | |
| RH_avg | + | + | ||||||
| RH_min | + | + | + | |||||
| Pre_daily | ||||||||
| Pres_avg | + | |||||||
| SSD | ||||||||
| Win_avg | ||||||||
| Win_max | + | |||||||
| Topographic | DEM | + | + | |||||
| Aspect | ||||||||
| Slope | ||||||||
| Vegetation | FVC | + | + | + | + | + | + | |
| Socioeconomic | Dis_road | + | ||||||
| Dis_sett | ||||||||
| Pop | + | |||||||
| GDP | + |
| Regions | Model | AUC Value | Cut-Off | Prediction Accuracy (%) | |
|---|---|---|---|---|---|
| (Intermediate Model 1/2/3/4/5) | (Intermediate Model 1/2/3/4/5) | Training | Validation | ||
| (Subtraining 1/2/3/4/5) | (Subvalidation 1/2/3/4/5) | ||||
| Northeast region | Intermediate model | 0.978/0.981/0.971/0.969/0.981 | 0.466/0.494/0.488/0.466/0.420 | 92.8/93.0/90.3/89.2/92.5 | 93.2/92.4/89.4/87.5/93.1 |
| Final model | 0.976 | 0.493 | 92 | 91.5 | |
| North China region | Intermediate model | 0.974/0.969/0.969/0.970/0.971 | 0.396/0.426/0.435/0.433/0.390 | 92.7/92.5/92.7/91.8/92.7 | 91.6/92.2/91.5/93.5/91.6 |
| Final model | 0.971 | 0.402 | 92.8 | 92.2 | |
| East China region | Intermediate model | 0.963/0.956/0.963/0.957/0.955 | 0.470/0.397/0.415/0.457/0.462 | 90.9/86.8/89.4/89.5/88.8 | 88.4/86.3/86.7/88.0/89.6 |
| Final model | 0.955 | 0.467 | 89 | 86.2 | |
| Northwest region | Intermediate model | 0.974/0.981/0.959/0.979/0.960 | 0.315/0.414/0.462/0.644/0.238 | 91.0/93.6/91.0/93.6/89.7 | 86.5/84.6/88.5/90.4/90.4 |
| Final model | 0.964 | 0.373 | 91.4 | 90.3 | |
| Southwest region | Intermediate model | 0.971/0.966/0.969/0.968/0.968 | 0.382/0.384/0.379/0.375/0.393 | 91.5/91.0/91.0/90.6/90.6 | 90.1/91.2/90.1/90.3/90.2 |
| Final model | 0.966 | 0.393 | 90.6 | 91 | |
| Mid-south region | Intermediate model | 0.965/0.965/0.953/0.968/0.965 | 0.397/0.391/0.470/0.418/0.451 | 89.1/88.9/88.6/89.2/90.4 | 88.4/88.7/87.4/89.2/90.3 |
| Final model | 0.979 | 0.481 | 90.2 | 87.1 | |
| The whole study area | Intermediate model | 0.949/0.954/0.951/0.912/0.942 | 0.419/0.431/0.448/0.372/0.327 | 86.8/88.2/87.8/83.2/84.4 | 85.9/88.0/87.6/83.0/83.9 |
| Final model | 0.944 | 0.415 | 86 | 85.8 | |
© 2020 by the authors. Licensee MDPI, Basel, Switzerland. This article is an open access article distributed under the terms and conditions of the Creative Commons Attribution (CC BY) license (http://creativecommons.org/licenses/by/4.0/).
Share and Cite
Ma, W.; Feng, Z.; Cheng, Z.; Chen, S.; Wang, F. Identifying Forest Fire Driving Factors and Related Impacts in China Using Random Forest Algorithm. Forests 2020, 11, 507. https://doi.org/10.3390/f11050507
Ma W, Feng Z, Cheng Z, Chen S, Wang F. Identifying Forest Fire Driving Factors and Related Impacts in China Using Random Forest Algorithm. Forests. 2020; 11(5):507. https://doi.org/10.3390/f11050507
Chicago/Turabian StyleMa, Wenyuan, Zhongke Feng, Zhuxin Cheng, Shilin Chen, and Fengge Wang. 2020. "Identifying Forest Fire Driving Factors and Related Impacts in China Using Random Forest Algorithm" Forests 11, no. 5: 507. https://doi.org/10.3390/f11050507
APA StyleMa, W., Feng, Z., Cheng, Z., Chen, S., & Wang, F. (2020). Identifying Forest Fire Driving Factors and Related Impacts in China Using Random Forest Algorithm. Forests, 11(5), 507. https://doi.org/10.3390/f11050507