Article

Current and Future Potential Distribution of the Xerophytic Shrub Candelilla (Euphorbia antisyphilitica) under Two Climate Change Scenarios

by
Gonzalo Vargas-Piedra
1,
Ricardo David Valdez-Cepeda
2,
Armando López-Santos
1,
Arnoldo Flores-Hernández
1,
Nathalie S. Hernández-Quiroz
3 and
Martín Martínez-Salvador
3,*
1
Unidad Regional Universitaria de Zonas Áridas, Universidad Autónoma Chapingo, Apdo. Postal 8, Bermejillo, Durango CP 35230, Mexico
2
Centro Regional Universitario Norte Centro, Universidad Autónoma Chapingo, Apartado Postal 196, Zacatecas 98001, Mexico
3
Facultad de Zootecnia y Ecología, Universidad Autónoma de Chihuahua, Periférico Francisco R. Almada Km 1, Chihuahua CP 31453, Mexico
*
Author to whom correspondence should be addressed.
Forests 2020, 11(5), 530; https://doi.org/10.3390/f11050530
Submission received: 14 January 2020 / Revised: 30 April 2020 / Accepted: 2 May 2020 / Published: 9 May 2020
(This article belongs to the Section Forest Inventory, Modeling and Remote Sensing)

Abstract

:
Candelilla (Euphorbia antisyphilitica Zucc.) is a shrub species distributed throughout the Chihuahuan Desert in northern Mexico and southern of the United States of America. Candelilla has an economic importance due to natural wax it produces. The economic importance and the intense harvest of the wax from candelilla seems to gradually reduce the natural populations of this species. The essence of this research was to project the potential distribution of candelilla populations under different climate change scenarios in its natural distribution area in North America. We created a spatial database with points of candelilla presence, according to the Global Biodiversity Information Facility (GBIF). A spatial analysis to predict the potential distribution of the species using Maxent software was performed. Thirteen of 19 variables from the WorldClim database were used for two scenarios of representative concentration pathways (RCPs) (4.5 as a conservative and 8.5 as extreme). We used climate projections from three global climate models (GCMs) (Max Planck institute, the Geophysical Fluid Dynamics Laboratory and the Met Office Hadley), each simulating the two scenarios. The final predicted distribution areas were classified in five on-site possible candelilla habitat suitability categories: none (< 19%), low (20–38%), medium (39–57%), high (58–76%) and very high (> 77%). According to the area under the curve (0.970), the models and scenarios used showed an adequate fit to project the current and future distribution of candelilla. The variable that contributed the most in the three GCMs and the two RCPs was the mean temperature of the coldest quarter with an influence of 45.7% (Jackknife test). The candelilla’s distribution area for North America was predicted as approximately 19.1 million hectares under the current conditions for the high habitat suitability; however, the projection for the next fifty years is not promising because the GCMs projected a reduction of more than 6.9 million hectares using either the conservative or extreme scenarios. The results are useful for conservation of the species in the area with vulnerable wild populations, as well as for the selection of new sites suitable for the species growth and cultivation while facing climate change.

1. Introduction

Candelilla (Euphorbia antisyphilitica Zucc.) is a shrub distributed from Southern United States to central Mexico [1,2]. This species belongs to the Euphorbiaceae family, which includes 317 genus, 49 tribes and five subfamilies [3]. The Euphorbia genus has approximately 2000 species [4]. It is a perennial shrub that grows in groups of stems that reproduce mainly by rhizomes [5]. Vegetative growth of candelilla occurs mainly in summer, seed production in fall and wax production in winter [5,6]. Results of studies in candelilla’s reproduction and harvest found out that plants around 30 cm height produce more new stems, whereas in taller plants self-shading apparently affects their physiological ability to produce new shoots, therefore they recommend harvesting long stems and leaving shorter in field to promote regeneration [5]. On the other hand, seed production is more common on the largest stems, it is abundant and occurs during fall, at the end of the rainy season [5,6]; however, germination rate is very low, probably due to the adverse conditions of the places where candelilla grows (limestone slopes or associated with igneous rocks, shallow and bare soils, low organic matter content, rainfall less than 250 mm and extreme temperatures) [5,7,8]. Various authors suggest producing plants in nurseries and establishing candelilla plantations to avoid the decrease of wild populations [2,5,9,10]. Meanwhile, current Mexican policies recommend only harvesting plants that measure at least 30 cm height and 20 cm or more in diameter and leaving at least 20% of stems after the harvest event [5,7,9].
Candelilla is characterized for producing a solid wax which reaches its maximum viscosity at 80 °C, is insoluble in water, but highly soluble in acetone, chloroform and some other organic solvents [11,12]. The wax from candelilla is a product of high economic value [13]. This species’ commercial use started early in the twentieth century, where it became of high economic importance in the Chihuahuan Desert [8]. The usage of this species intensified during the first and second World War to make ammunition and as coating for making waterproof tents [5]. Nowadays, the wax from candelilla is used in more than 20 different industries around the world [8]. This wax can also be mixed with different components or materials, either synthetic or natural, to improve its characteristics [11].
The wax from candelilla is produced as a secondary metabolite, which is part of an evolving process known as an adaptive water deficit mechanism [14]. This mechanism allows this species to survive under the typical climate conditions of the Chihuahuan Desert, where winter is dry and cold while summer is extremely hot [4,15]. The prevailing climate in this region is of the desert type BS and BW, which is a climate with precipitation lower than 250 mm and minimum temperatures lower than 0 °C and maximums over 40 °C [16]. For this region, shrub associations grow forming the desert microphilous and rosetophilous scrubs, which prevail in extended areas of this desert [9]. It is estimated that an approximate potential area of 8,526,336 hectares represents the main distribution area of candelilla in northern Mexico [9,17].
The economic importance and the intense harvest of the wax from candelilla seems to gradually reduce the natural populations of this species [7]. In addition, the species face a possible vulnerability due to climate change, based on the scenarios defined for the near future [9,18,19].
The species distribution models (SDMs) and the global climate models (GCMs) are methodologies widely used in ecological and geographic studies of current and future species distribution and abundance [20]. The SDMs provide detailed projections of distributions by relating presence or abundance of the species to environmental predictors [21]. The accuracy of the SDMs is mainly based on the reliability of presence species and scale of the environmental data used for the modeling [22,23]. Meanwhile, the GCMs are methods that allow estimating changes in the habitat suitability over time, given a specific scenario for environmental change [24].
The GCMs commonly use the greenhouse gas concentration scenarios called representative concentration pathways (RCPs) in order to project the possible climate change in the planet [25]. The RCPs include emissions and concentrations of greenhouse gasses and aerosols, as well as land-use/land cover [25,26]. The global average warming and precipitation increases for the last 20 years of the 21st century relative to the period 1986–2005 in +1.1 °C/+2.1% for RCP2.6, +2.4 °C/+4.0% for RCP4.5, +2.5 °C/+3.3% for RCP6.0 and +4.1 °C/+4.6% for RCP8.5, respectively [25].
Based on GCMs and RCPs, it is possible to estimate SDMs for candelilla in North America by using points of presence of the species. In this sense, the Global Biodiversity Information Facility (GBIF) is one of the databases with a large set of species occurrences on the planet, nevertheless; many of these data consist of presence records provided by museum or herbarium collections [27]. In these cases, various authors consider that the methods of collecting the field information are rarely known, so that absences cannot be inferred with certainty [23,28,29,30], there are some methods that may help to reduce bias for noisy data, such as high-resolution satellite images, using information of others members of the community or carrying out field verification [21]. Despite this issue, the GBIF also includes a large number of sites that come from well-documented inventory and monitoring schemes, such as in the case of the National inventory of candelilla in Mexico. This inventory was carried out for northern Mexico during 2016 [31] and the GBIF includes 348 sites of presence of candelilla from it. In addition, the GBIF also includes 248 research observation sites of candelilla from 2016 to 2019 reported from previous research [27]. These data increase the certainty of the presence of candelilla in North America and provides a reliable basis for the development of Eco-geographic models of distribution of the species in this region.
The distribution models are known according to their objectives as bioclimatic models, ecological niche models or habitat models [32,33,34], which consider mathematical algorithms created with variables which allows evaluating the potential geographic distribution of the species [35]. These algorithms are created based on data of habitat presence or absence and its relationship with current conditions and future probabilities of the behavior of some variables, such as the climate variables [35,36].
There are many methods that may be used for species distribution modeling, such as Markov random fields, mixture models or logistic regression [37,38]. One of the most used and reliable methods is the maximum entropy approach (Maxent) [21,39,40]. The models, generated by Maxent, have a natural probabilistic interpretation, giving a smooth transition from most to least suitable conditions, facilitating its interpretation [21,40].
The present research has the main objective of modeling the current and future potential distribution of candelilla (Euphorbia antisyphilitica Zucc.) in North America, based on two RCPs and employing three GCMs [41,42]. These SDMs would be useful to assist in the conservation of vulnerable wild populations or in the cultivation the species in areas where a greater adaptability of the species to climate change may be achieved [32,34].

2. Materials and Methods

The study area comprehends from central Mexico up to the southeast of the United States of America, in the region known as the Chihuahuan Desert (Figure 1).
A total of 406 records of E. antisyphilitica presence were downloaded from the GBIF, 348 were located in Mexico and 58 corresponds to the United States of America (Figure 1) [27]. Furthermore, 27 verification field sites, located in the Mexican states of Durango, Chihuahua and Coahuila, were used to validate occurrence points from the GBIF.
Nearby points were eliminated using a 1.5-km buffer to prevent the distribution bias and overlapping points inside of each cell.
To determine the influence of the environmental variables on the distribution of E. antisyphilitica, we included in the model 19 bioclimatic variables from the period 1950–2000. These variables had a 30-s (ca. 1 km) spatial resolution and were downloaded from the WorldClim dataset [43].
To reduce multi-collinearity among the 19 bioclimatic variables, highly correlated variables (r ≥ 0.85 Pearson correlation) were eliminated. The reduction of predictor variables resulted in the inclusion of 13 variables (Table 1).
The three GCMs used were the MPI-ESM-LR (Max Planck Institute) [44], the GFDL-CM3 (Geophysical Fluid Dynamics Laboratory) [45] and the HADGEM2-ES (Met Office Hadley) [46]. The future climate data of two RCPs for a medium-term projection (1945–1969) were also included [40,47]. These were the RCP of 4.5 W/m2 of low emissions (CO2) with a stable tendency, and the RCP of 8.5 W/m2 of high emissions (CO2) with increasing tendency [48]. The two RCPs and the three GCMs were selected based on the experience in the use of the models by the “Computer Department for the Atmospheric and Environmental Sciences” during the generation of the Weather Atlas for Mexico [49].
A maximum entropy model was used (Maxent software—Version 3.4.1) [50] because it has been shown to perform the SDMs well, relative to other modeling methods [21,39,47]. Maxent also uses presence-only data to predict the distribution of a species based on the theory of maximum entropy [50]; furthermore, Maxent has a natural probabilistic interpretation, giving a smooth transition from most to least suitable conditions, which can be easily interpreted [38,51].
To calibrate the model, a Bootstrap resampling algorithm of Maxent was used [50]. We selected 75% of the data for model training and 25% for model testing [52], keeping other values as default.
Jackknife analysis was performed to determine the variables that reduce the model reliability when omitted [53]. We also used the area under the receiving operator curve (ROC–AUC) to evaluate the model performance. The ROC–AUC ranges from 0 to 1, where values near 1 indicate a good performance of the model and a value of 0.50 indicates the model does not perform better than random [47,54]. Meanwhile, a value of 1.0 indicates perfect discrimination [47,54,55]. The model with the highest UAC value was considered the best for assessing the potential distribution of Candelilla [52].
The jackknife approach excludes one variable at a time when running the model. It provides information on the importance of each variable to the model in terms of how effective each variable is at explaining the species distribution and how much unique information each variable provides [56]; meanwhile, the AUC is a ranked approach for assessing model fit that determines the habitat suitability location will be ranked higher than a random background location [50,56]. These random background locations serve as pseudo-absences for all analyses in Maxent [56].
To display the final reclassification analysis, the results (0–1 range) were imported into Arc GIS 10.3. The six models generated (three GCMs and two RCPs) were re-categorized in the following five classes of potential habitats: none habitat suitability (0–0.19); low (0.2–0.38); medium (0.39–0.57); high (0.58–0.76); very high habitat suitability (0.77–1.0) [57].

3. Results

3.1. Projections of Current Candelilla’s Presence

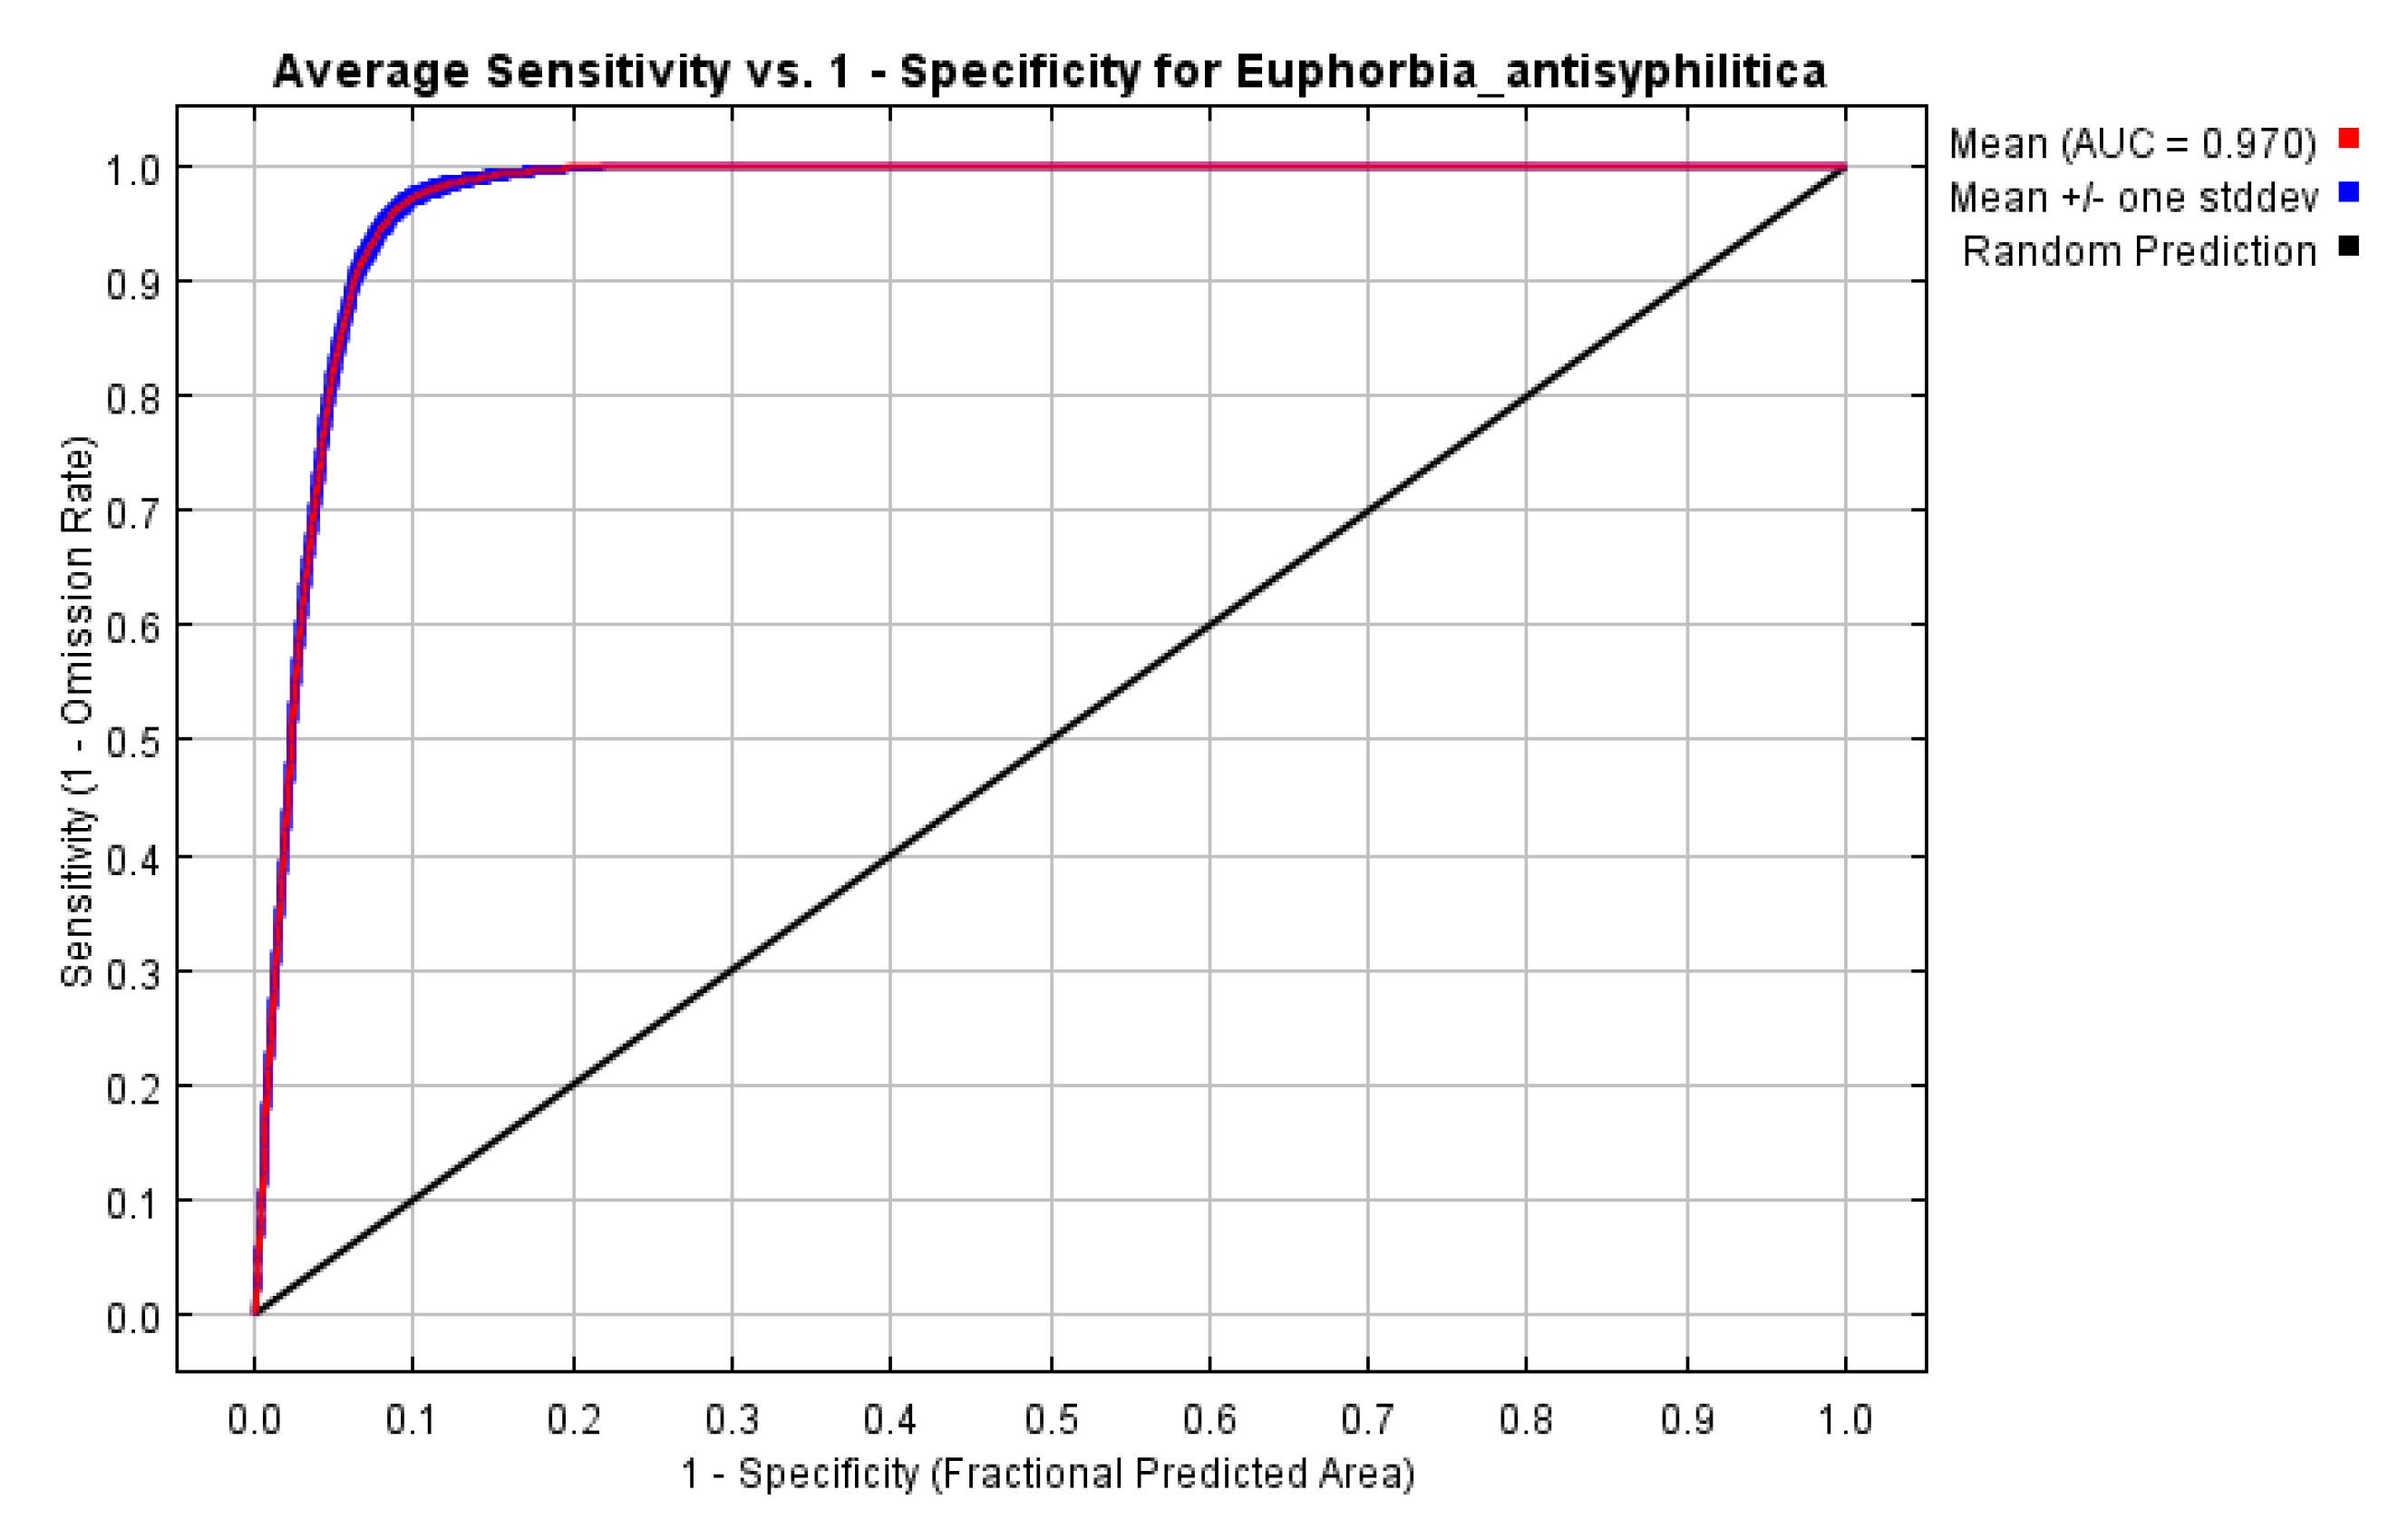
The average value of AUC (0.970) (±0.001) indicated a high discrimination for candelilla’s current distribution model in North America (Figure 2), it performed better than a random model [21,26]. The variables that showed the highest contribution to the SDMs were the mean temperature of coldest quarter (Bio 11) (45.7%), the precipitation seasonality (coefficient of variation) (Bio 15) (13.3%), the precipitation of coldest quarter (Bio 19) (11.6%) and the mean temperature of driest quarter (8.7%) and precipitation of driest month (4.7%). The cumulative contribution of these six variables was of 84%. The 13 variables considered for the model integrated a cumulative value of 99% (Table 1). These results showed that winter temperatures and precipitations have also a high influence in the candelilla’s distribution in the study region.
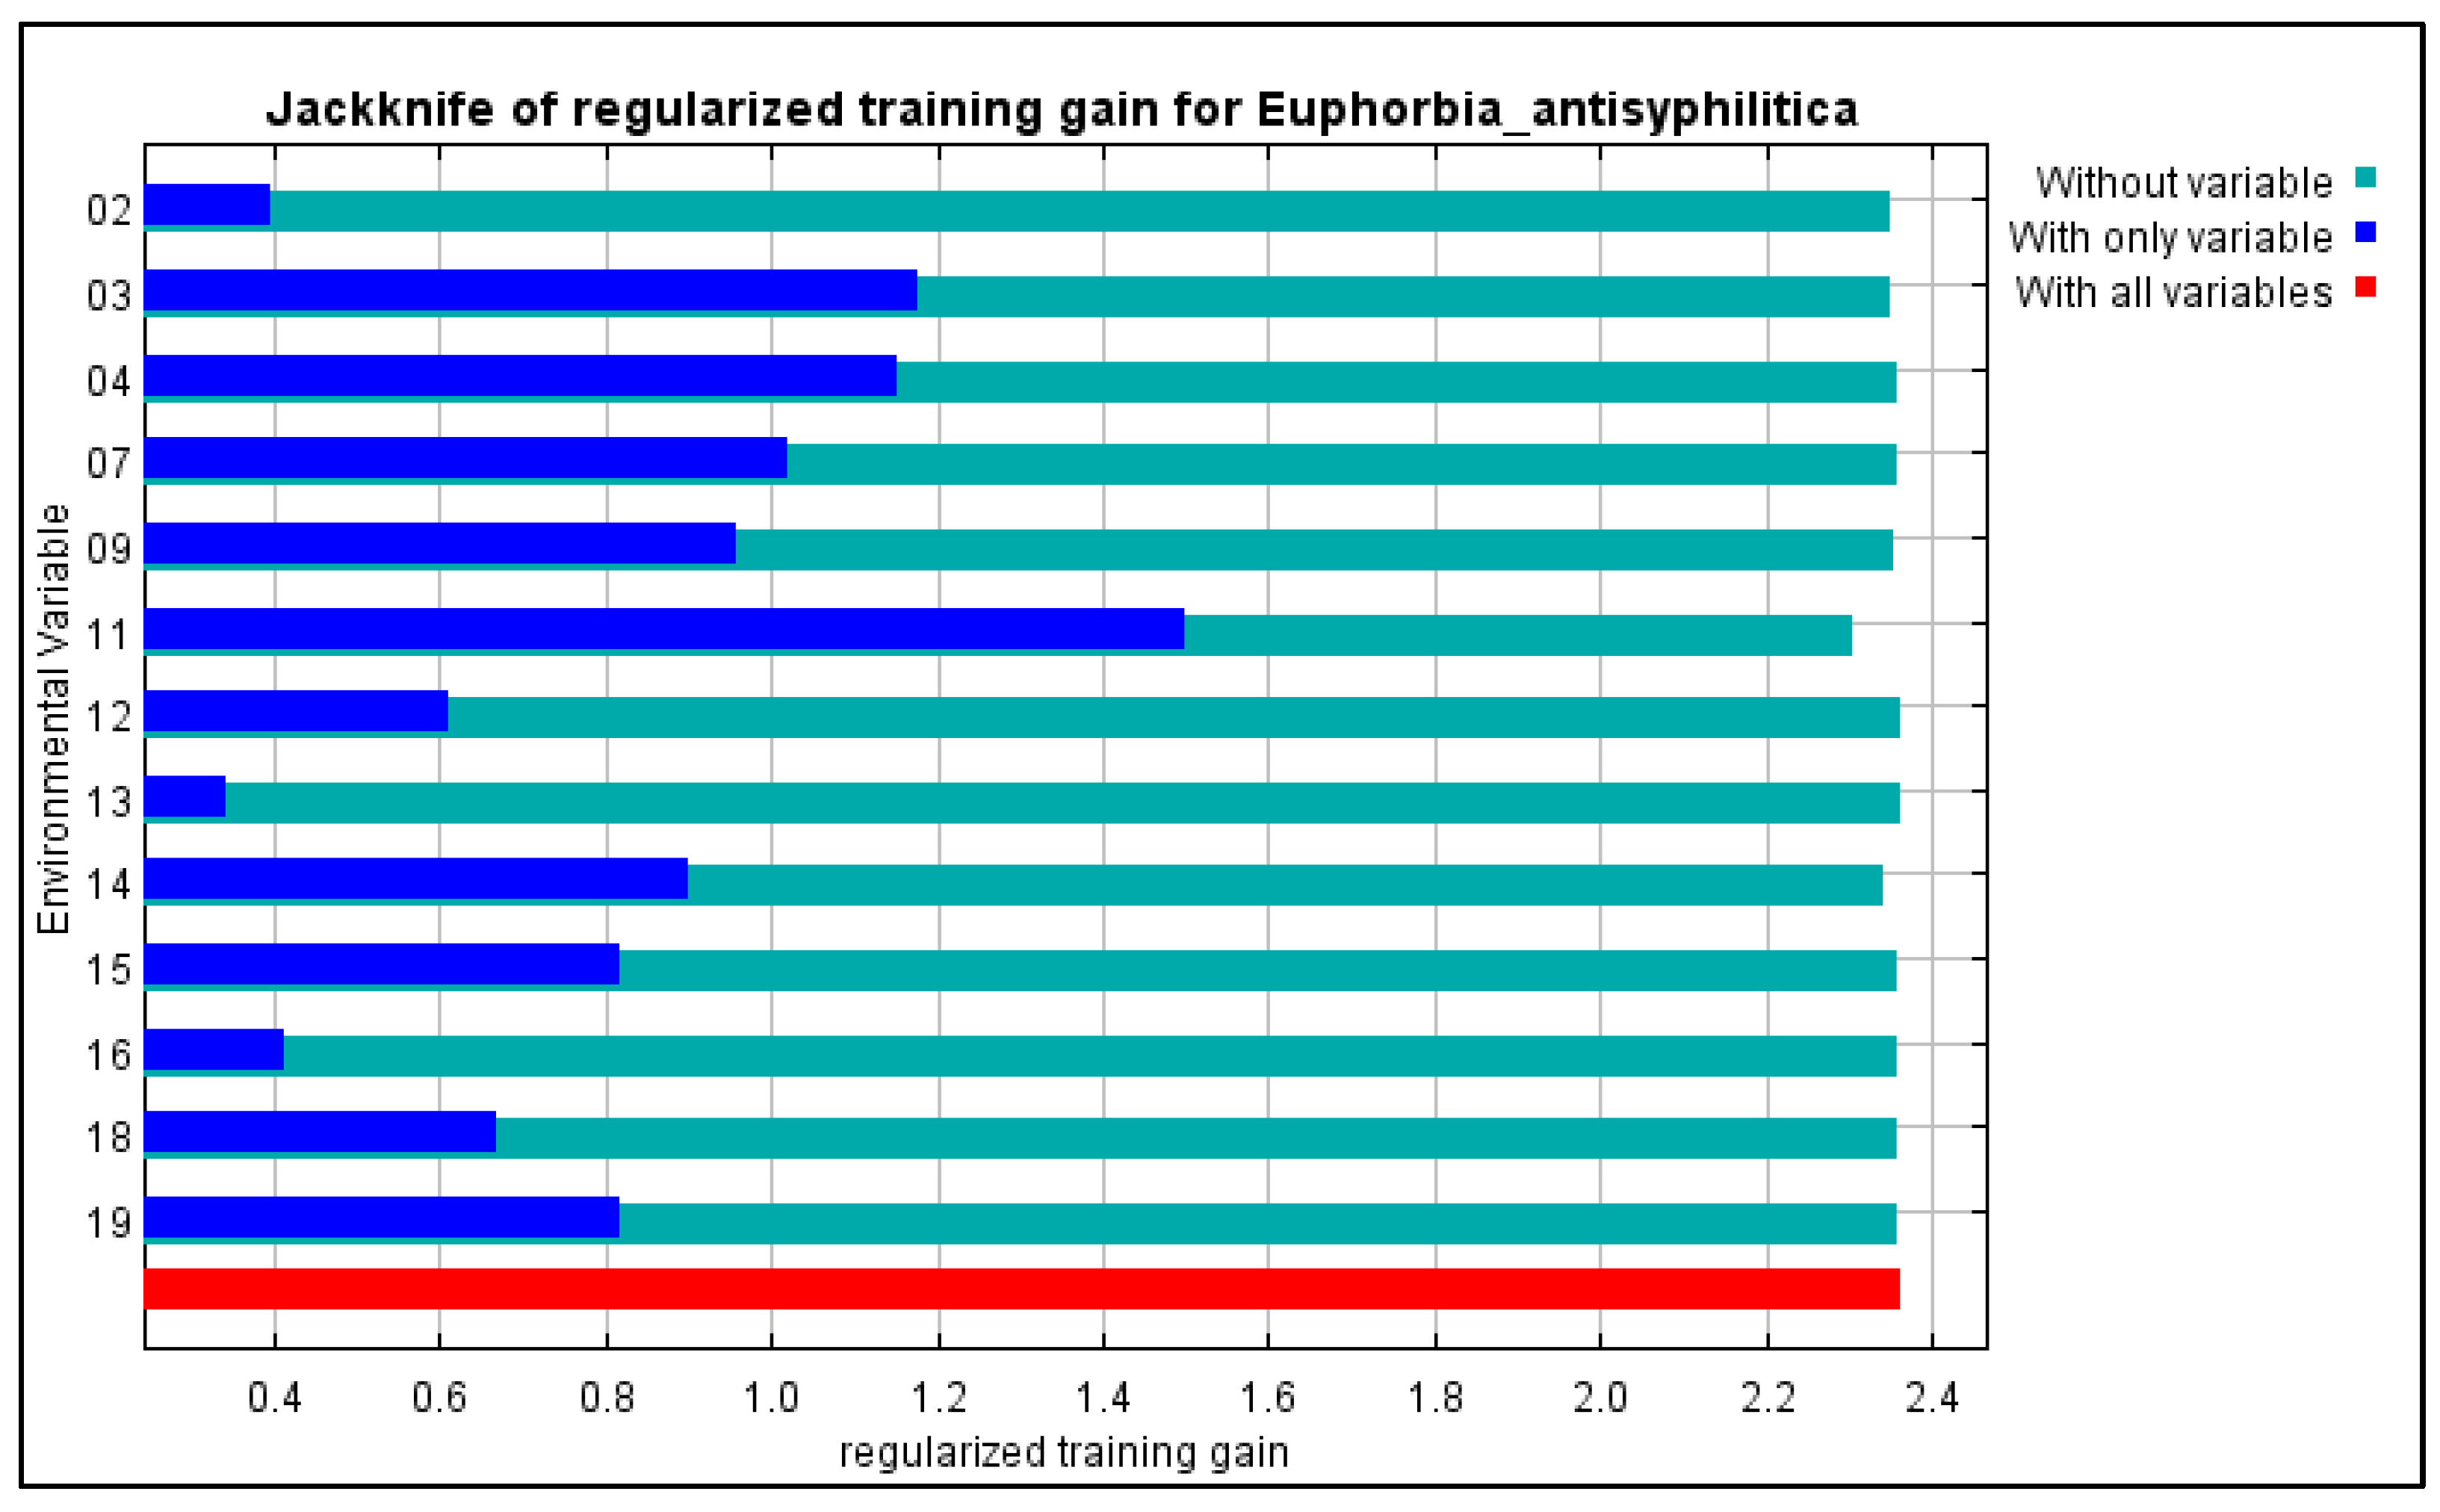
The Jackknife analysis showed that the mean temperature of coldest quarter has the highest relative importance as independent variable over the candelilla distribution model. In addition, it indicated that the environmental variables related to temperature (isothermality (BIO2/BIO7) (×100) and temperature seasonality (standard deviation ×100) are important for the candelilla’s distribution model (Figure 3).
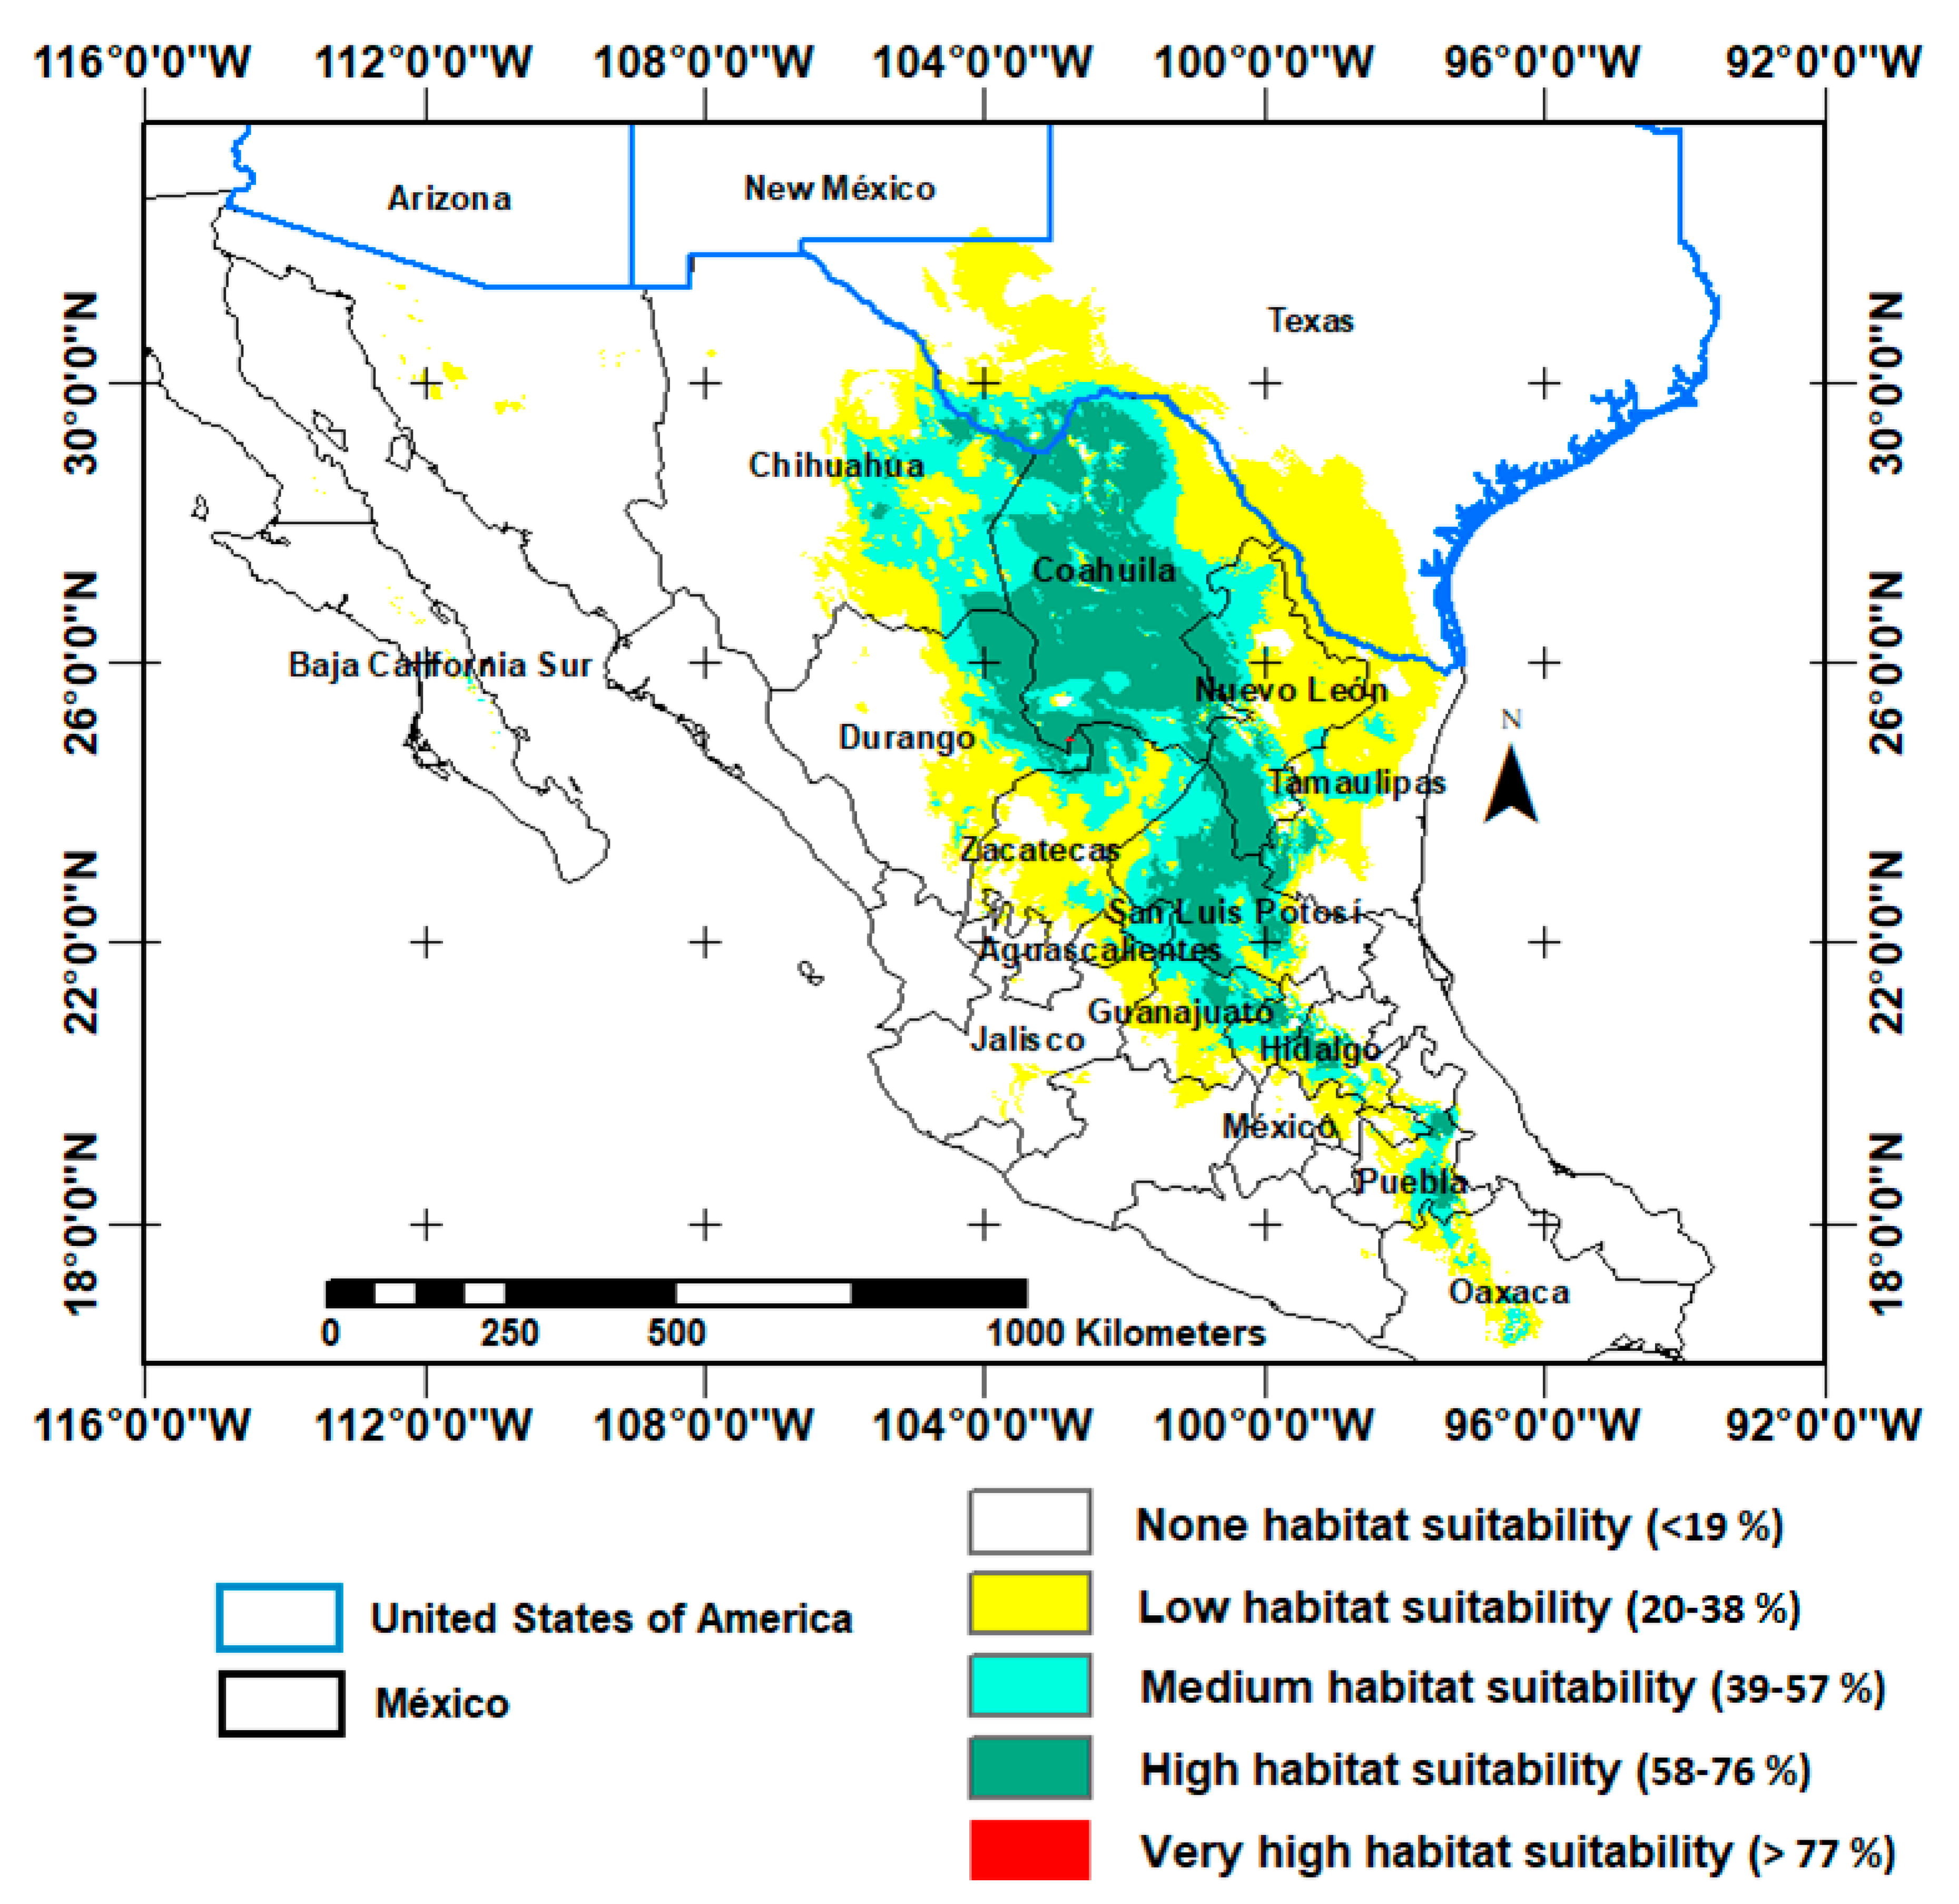
The estimated area for the medium and low habitat suitability classes predicted a large area of potential distribution of candelilla in North America. This area included the states of Tamaulipas, Jalisco, western Zacatecas and western Guanajuato in Mexico, as well as southeastern Texas in the USA. Currently there is no evidence of presence of candelilla in this area [9,27,31,58]. Therefore, the current projection of candelilla’s distribution seems to match better with the high habitat suitability class (19,166,820 ha), which includes the states of Coahuila, northeast Durango, Easter Zacatecas and San Luis Potosi in Mexico and a small area in the south of Texas (Figure 2 and Figure 4) [9,31].

3.2. Future Potential Sites for Distribution of Candelilla

Based on the high habitat suitability, the six models showed that in the future (year 2069) the environmental changes generated by the increase in the concentration of gases such as carbon dioxide may cause a reduction in the habitat suitability of candelilla in North America, compared to the habitat suitability under current conditions. This could happen even under the more conservative scenario RCP4.5 (Table 2). These results suggest that candelilla’s southern populations will reduce their distribution area in the future as a consequence of climate change. Currently, basic aspects of the species are lack of knowledge, such as reproductive physiology, adaptation to cultivation and genetics. Studies that provide this information should be highly useful to provide a better management to candelilla population in the near future.
The six models were consistent in their projections. The GFDL-CM3 model predicted increases in distribution area for the none class and reductions for the low, medium and high habitat suitability classes for the two scenarios (Table 2). The HADGEM2 model predicted reductions in the candelilla’s distribution area for the none and high classes and increments in the distribution for the low and medium classes for the two scenarios, as well. Meanwhile, the MPI-ESM-LR model projected reductions in the none and high classes for the RCP4.5 scenarios and reductions in the low and high classes for the RCP8.5 scenario. The very high habitat suitability class seems to sub-estimate the candelilla distribution area, based on technical and scientific reports [8,9,31,58].
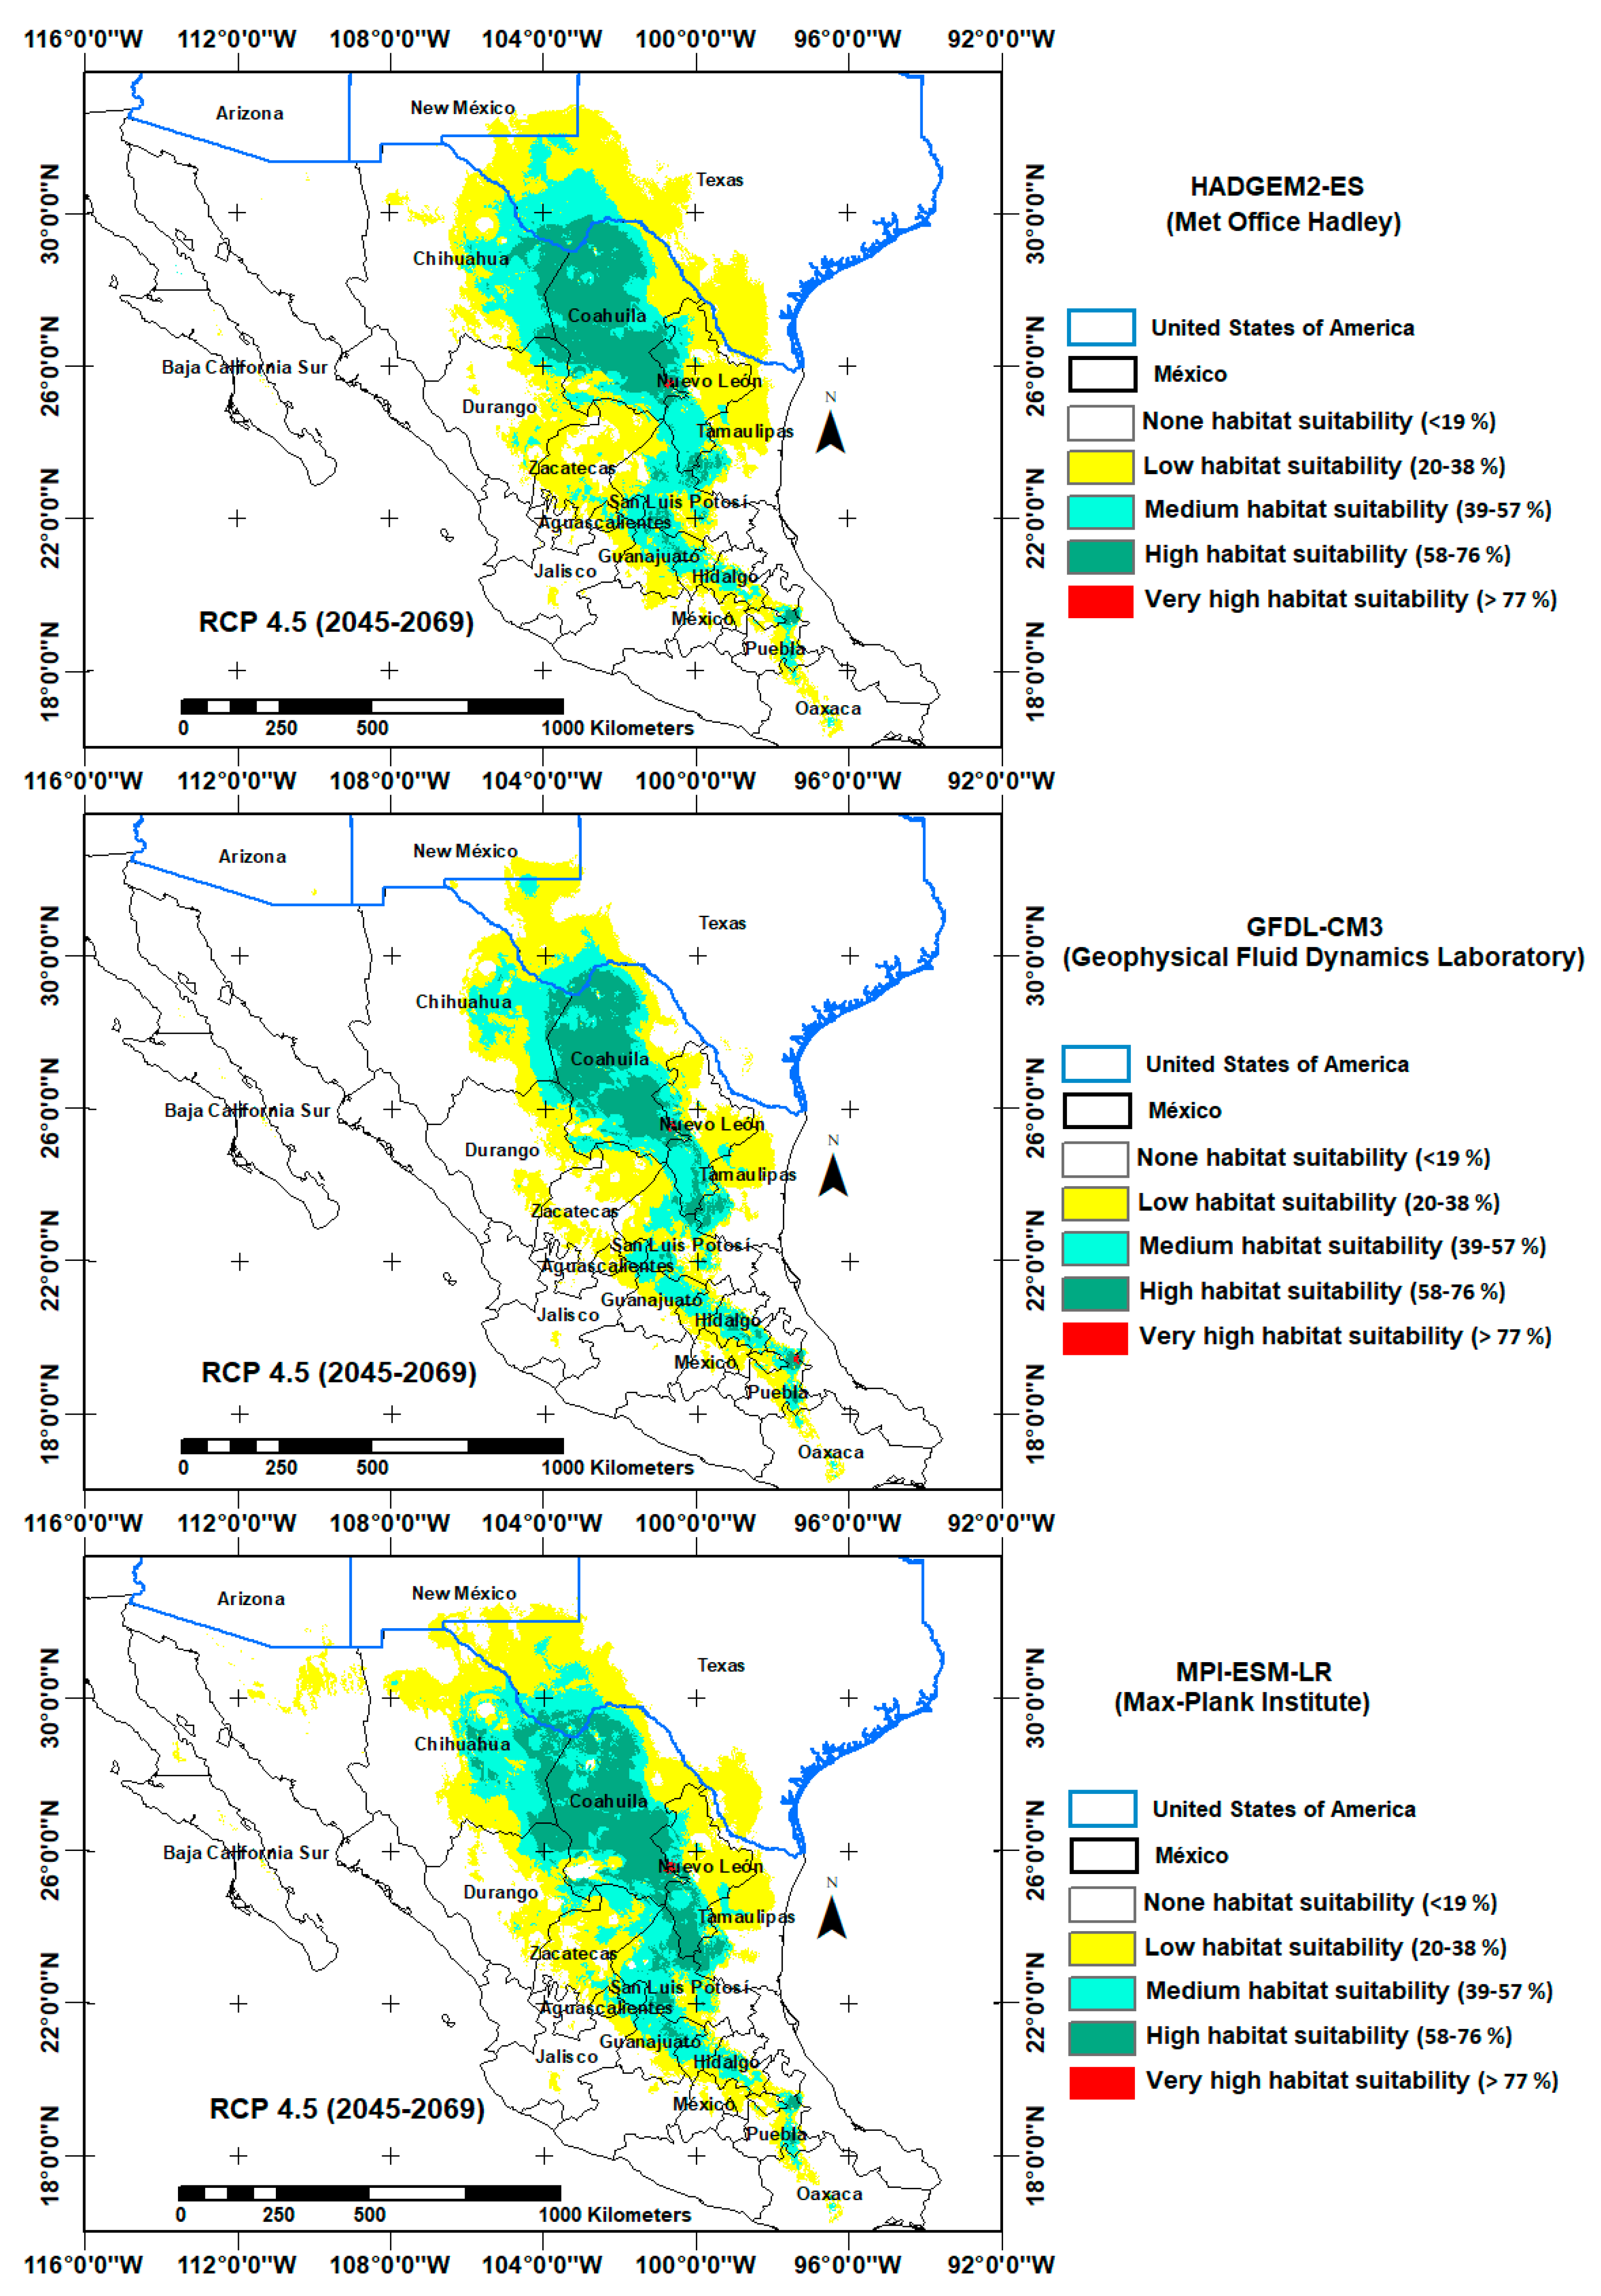
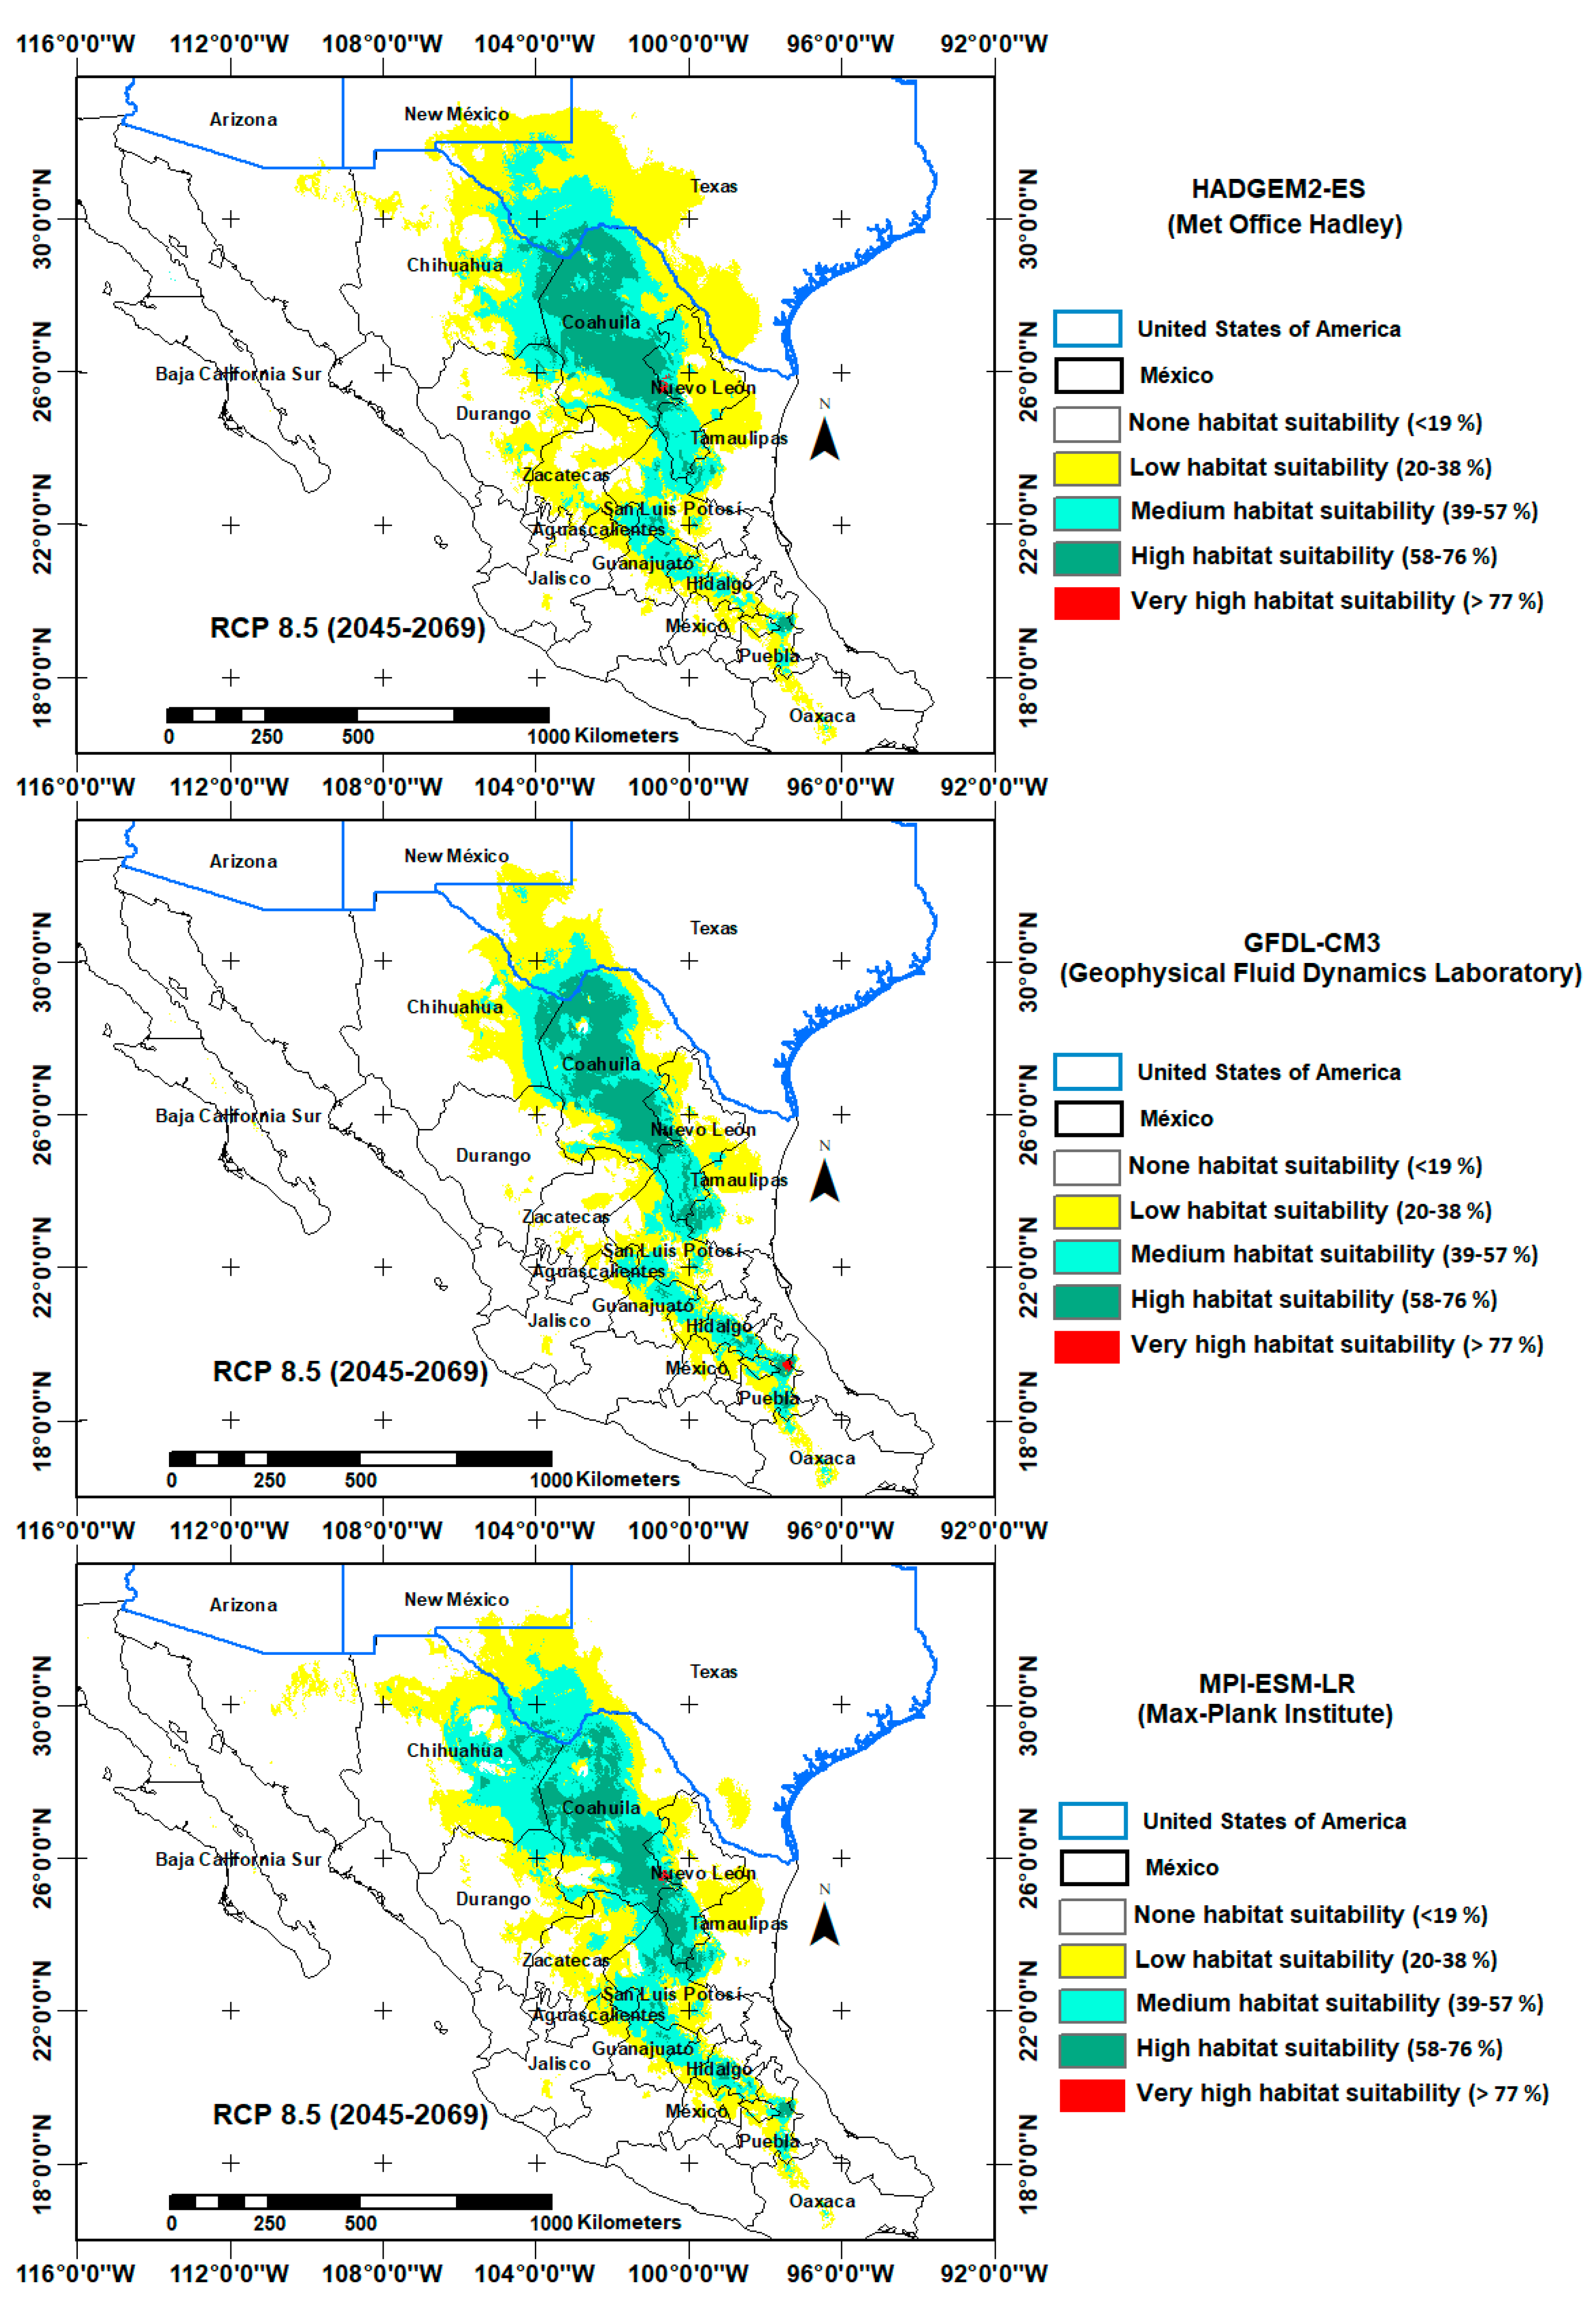
According to the projection obtained with the GCMs and the RCP4.5, the increase in the area caused by climate change in the future (Year 2069) for the none, low and medium classes would occupy lands beyond the north and west portion of the current distribution, mainly in the states of Chihuahua and Sonora in Mexico and Texas in the USA. This behavior could be related to the warming that will probably occur in lower latitudes as a consequence of climate change. The distribution of candelilla seems to be higher in colder areas (Figure 5). For the high habitat suitability class, the GFDL-CM3, HADGEM2 and MPI-ESM-LR models predicted a reduction of 39.2, 20.8 and 10.7 in the candelilla’s distribution area, respectively. The states where candelilla populations could be negatively affected are Coahuila and San Luis Potosí in Mexico. Currently, the largest harvest of the species is carried out in these states [8,9].
According to these results, the effect of climate changes for the next fifty years could generate a significate reduction of lands were candelilla is currently harvested. In this sense, the climate change could also affect the percentage of wax produced by candelilla’s plant as a consequence of changes in winter temperatures and precipitation.
For the scenario RCP8.5, the HADGEM2 model projected increments up to 33.3% in the candelilla’s distribution area for the low class and 13.7% for the medium class. Meanwhile, the MPI-ESM-LR model predicted an increment of 23.5% in the area for the middle class and 2.3% for the none class. Regarding the GFDL-CM3, it projected a reduction of 23.7%, 19.7% and 45% for the low, medium and high classes, respectively. Furthermore, the three models predicted reductions between 36% to 45% in the high class. The increments in the candelilla’s distribution area could occur in the north and west area, according to the current candelilla’s distribution as well as the RCP4.5. Meanwhile, the states with reductions of candelilla’s distribution, as a result of the climate change under the RCP8.5, are Coahuila, San Luis Potosí and Zacatecas, Mexico (Figure 6).
Scenario 8.5 shows reductions up to 45% of candelilla’s distribution areas for the next 50 years. Under this scenario, projected changes will continue beyond fifty years, which could dramatically reduce the distribution area of the species over the next 100 or more years. Genetic studies and adaptability of the candelilla to extreme scenarios could generate the necessary information to establish conservation strategies for the species in the face of possible environmental changes in the long term.
According to the classes of low and medium habitat suitability, the two scenarios projected an increment in the candelilla’s distribution areas, including areas with no current conditions for its growth [9]. These areas are located in southern Mexico and include the states of Veracruz, Oaxaca, Puebla and Estado de México, where the temperature and precipitation are higher than the climate conditions currently needed for the natural candelilla´s distribution [2,3,35,48]. Conversely, the southern presence for candelilla was reported in the Tehuacán–Cuicatlan Valley, which is located in the semiarid region between Puebla and Oaxaca, Mexico [59].

4. Discussion

The six models of E antisyphilitica potential distribution in North America showed a very well accurate ROC-UAC value [22,47]. For the current conditions E. antisyphilitica occupies a great distribution area (191,616 km2) over the arid lands of northern Mexico and a small portion of southern Texas. The three GCMs projected a reduction in the distribution area for the high habitat suitability as a consequence of climate change for the next fifty years (2069). Even the more conservative scenario of carbon dioxide emissions RCP4.5 predicted a reduction area ranging from 10% to 39%; meanwhile, the extreme scenario RPC8.5 projected a reduction area from 36% to 45%, compared to the current distribution. In the Mexican states of Coahuila, Chihuahua, Zacatecas and San Luis Potosi, the harvest of candelilla for the commercial extraction of wax is constantly increasing due to the increasing demand of organic wax [2,8,9]. Even though the current use of candelilla cannot be regarded as extremely threatening for the species, given its vast distribution area, local to regional wild growing stocks are reduced or have disappeared. Thus, the species exploitation without controlled management leads to the decline of populations [2,60].
Our results would allow stablishing better candelilla’s management, including protection or cultivation based on the vulnerability of wild populations or on the location of suitable areas for candelilla’s growth [8,9,61]. In this regard, we identified that thirteen environmental variables influence (99%) the current and future distribution of candelilla in North America. Four of those variables accumulated almost 80% of the influence on the GCMs (temperature of coldest quarter (Bio 11) (45.7%), the precipitation seasonality (coefficient of variation) (Bio 15) (13.3%), the precipitation of coldest quarter (Bio 19) (11.6%) and the%), the mean temperature of driest quarter (Bio9) (8.7%)). These environmental variables showed that the candelilla’s distribution is mostly affected by low temperatures and dry seasons. According to the literature, this species grows in areas of semi-desert climate and is highly adapted to drought conditions with erratic rainfall regimes with an annual precipitation of 150–500 mm and extreme temperatures of 44 °C and −2 °C [2,8,61].
The three models were consistent in their projections for the two scenarios (RPC4.5 and RPC8.5). The GFDL-CM3 model predicted more conservative changes compared to the HADGEM2 and the MPI-ESM-LR models. Both of the scenarios predicted possible increments in the candelilla’s distribution area for the lower and middle habitat suitability classes, mainly towards the north area of the current distribution [62,63,64]. The models also predicted a considerable reduction in the area for the high habitat suitability class for the next fifty years. The projections of increments or reduction of the candelilla’s distribution areas were higher for the RPC8.5 scenarios compared to the RPC4.5 scenarios. Thus, candelilla may be sensitive to warming changes generated as a consequence of an increment in the emissions of greenhouse gases in the future [65]. In order to conserve candelilla’s populations, this behavior suggests that plantations of candelilla could be established in the northern area of its current distribution, mainly in north Coahuila and northwest Chihuahua in México [7,10,18,19]. In contrast, the southern populations appear to be more vulnerable as a consequence of global warming with the presence of warmer winters during the next fifty years.

5. Conclusions

The six potential distribution models generated for candelilla (E antisyphilitica) in North America showed a very well accurate ROC-UAC value. The three GCMs used in this studio were consistent in their projections for the two scenarios evaluated (RPC4.5 and RPC8.5); however, the GFDL-CM3 model predicted more conservative changes compared to the HADGEM2 and MPI-ESM-LR models.
The estimated candelilla’s distribution area for North America is approximately 19.1 million of hectares under the current conditions; however, the projection for the next fifty years (Year 2069) is not promising because there could be a reduction of 4.5 million hectares considering the conservative scenario (RCP 4.5) or an average of 8.1 million hectares in the case of the extreme scenario (RCP 8.5).
The climate variables with the greatest influence in the candelilla’s distribution models were the temperature of coldest quarter, precipitation seasonality (coefficient of variation), the precipitation of coldest quarter, mean temperature of driest quarter and precipitation of driest month. therefore, the species distribution could be strongly conditioned by the low temperatures and precipitation occurring during the winter season.
The projections of increments or reductions in the distribution area of candelilla were higher for the extreme scenario (RPC8.5) compared to the conservative one (RPC4.5). This behavior shows that candelilla is sensitive to warming; thus, southern populations could be more vulnerable compared to northern ones. In this sense, plantations of this species could be established in the northern area of candelilla’s current distribution, mainly in the north of Coahuila and northwest of Chihuahua states in México.

Author Contributions

The conceptualization was done by N.S.H.-Q. and M.M.-S.; preparation of methodology by G.V.-P.; formal analysis by G.V.-P., N.S.H.-Q. and M.M.-S.; data curation by R.D.V.-C. and G.V.-P.; writing—original draft preparation by G.V.-P., M.M.-S and N.S.H.-Q., review and editing by A.L.-S. and A.F.-H.; supervision by A.F.-H. and A.L.-S. All authors have read and agreed to the published version of the manuscript.

Funding

This research was funded by PRODEP-SEP, Mexico. Grant number UACH-PTC-351.

Acknowledgments

We would like to thank CONACYT, which provided a Doctoral fellowship to the first author at URUZA-Chapingo, México. We are grateful to Laili Cervantes of Oregon State University, Sandra Rodríguez-Piñeros, and especially Federico Villarreal-Guerrero for their reviewing and editing of this manuscript.

Conflicts of Interest

The authors declare no conflict of interest.

References

  1. Scora, G.A.; Ahmed, M.; Scora, R.W. Epicuticular hydrocarbons of candelilla (Euphorbia antisiphylitica) from three different geographical areas. Ind. Crop. Prod. 1995, 4, 179–184. [Google Scholar] [CrossRef]
  2. Barsch, F. Candelilla (Euphorbia antisyphilitica): Utilization in Mexico and international trade. Med. Plant. Conserv. 2004, 9, 46–50. [Google Scholar]
  3. Webster, G.L. Synopsis of the genera and suprageneric taxa of Euphorbiaceae. Ann. Missour Ibot. Gard. 1994, 81, 33–144. [Google Scholar] [CrossRef]
  4. Horn, J.W.; van Ee, B.W.; Morawetz, J.J.; Riina, R.; Steinmann, V.W.; Berry, P.E.; Wurdack, K.J. Phylogenetics and the evolution of major structural characters in the giant genus Euphorbia L. (Euphorbiaceae). Mol. Phylogenet. Evol. 2012, 63, 305–326. [Google Scholar] [CrossRef]
  5. Martínez-Ballesté, A.; Mandujano, M.C. The consequences of harvesting on regeneration of a non-timber wax producing species (Euphorbia antisyphilitica Zucc.) of the Chihuahuan Desert. Econ. Bot. 2013, 67, 124–136. [Google Scholar] [CrossRef]
  6. Flores-del Ángel, M.; Foroughbakhch, R.; Rocha-Estrada, A.; Cárdenas-Ávila, M.; Guzmán-Lucio, M.; Hernández-Aguilar, Y.; Alvarado-Vázquez, M. Morfología, viabilidad y germinación de semillas de candelilla (Euphorbia antisyphilitica Zucc.). Phyton 2013, 82, 161–167. [Google Scholar]
  7. Ochoa-Reyes, E.; Saucedo-Pompa, S.; De La Garza, H.; Martínez, D.G.; Rodríguez, R.; Aguilar-Gonzalez, C.N. Extracción tradicional de cera de Euphorbia antysiphilitica. Rev. Científica De La Univ. Autónoma De Coahuila 2010, 2, 1–13. [Google Scholar]
  8. Rojas Molina, R.; Saucedo Pompa, S.; De León Zapata, M.A.; Jasso Cantú, D.; Aguilar, C.N. Pasado, presente y futuro de la candelilla. Rev. Mex. Cienc. For. 2011, 2, 7–18. [Google Scholar] [CrossRef] [Green Version]
  9. Martínez-Salvador, M.; Hermosillo-Rojas, D.E.; Mojica-Guerrero, A.; Prieto-Amparan, J.A. Potencial Productivo y Zonificación Para el uso y Manejo de Especies Forestales de Zonas Áridas; INIFAP: Chihuahua, México, 2015; Volume 1, p. 119. [Google Scholar]
  10. Resendez, A.M.; Hernández-Herrera, J.A.; Va0lenzuela-Núñez, L.M.; Martínez-Salvador, M. Modelación de la presencia de Euphorbia antisyphilitica Zucc mediante propiedades físicas y químicas del suelo. Ecosistemas Y Recur. Agropecu. 2019, 6, 499–511. [Google Scholar]
  11. Alvarado, C.J.C.; Galindo, A.S.; Bermúdez, L.B.; Berumen, C.P.; Orta, C.Á.; Garza, J.A.V. Cera de Candelilla y sus aplicaciones. Av. En Química 2013, 8, 105–110. [Google Scholar]
  12. Rojas-Molina, R.; De León-Zapata, M.; Saucedo-Pompa, S.; Aguilar-Gonzalez, M.; Aguilar, C. Chemical and structural characterization of Candelilla (Euphorbia antisyphilitica Zucc.). J. Med. Plants Res. 2013, 7, 702–705. [Google Scholar]
  13. Tapia-Tapia, E.D.C.; Reyes-Chilpa, R. Productos forestales no maderables en México: Aspectos económicos para el desarrollo sustentable. Madera Y Bosques 2008, 14, 95–112. [Google Scholar] [CrossRef]
  14. Luna, E.V.; Barriada-Bernal, L.G.; Lopez-Diaz, S.; Villa, F.C.; Medrano, J.R.M. Effect of abiotic stress conditions on the wax production in candelilla (Euphorbia antisyphilitica zucc.). Rev. Latinoam. De Química 2016, 44, 7. [Google Scholar]
  15. Villarreal-Quintanilla, J.A.; Bartolomé-Hernández, J.A.; Estrada-Castillón, E.; Ramírez-Rodríguez, H.; Martínez-Amador, S.J. El elemento endémico de la flora vascular del Desierto Chihuahuense. Acta Botánica Mex. 2017, 118, 65–96. [Google Scholar] [CrossRef]
  16. García, E. Modificaciones al Sistema de Clasificación Climática de Köppen, Para Adaptarlo a los Climas de la República Mexicana, 4th ed.; UNAM: Mexico City, Mexico; Instituto de Geografía: Mexico City, Mexico, 2004; Volume 1, 90p. [Google Scholar]
  17. Granados-Sánchez, D.; Sánchez-González, A.; Victorino, R.L.G.; Rosa, A.B.D.L. Ecología de la vegetación del Desierto Chihuahuense. Rev. Chapingo Ser. Cienc. For. Y Del Ambiente 2011, 17, 111–130. [Google Scholar] [CrossRef]
  18. Cortes, L.; Dominguez, I.; Lebgue, T.; Viramontes, O.; Melgoza, A.; Pinedo, C.; Camarillo, J. Variation in the distribution of four cacti species due to climate change in Chihuahua, Mexico. Int J. Environ. Res. Public Health 2013, 11, 390–402. [Google Scholar] [CrossRef] [Green Version]
  19. Maciel-Mata, C.A.; Manríquez-Morán, N.; Octavio-Aguilar, P.; Sánchez-Rojas, G. El área de distribución de las especies: Revisión del concepto. Acta Univ. 2015, 25, 3–19. [Google Scholar]
  20. Grotch, S.L.; MacCracken, M.C. The use of general circulation models to predict regional climatic change. J. Clim. 1991, 4, 286–303. [Google Scholar] [CrossRef] [Green Version]
  21. Elith, J.; Graham, C.H.; Anderson, R.P.; Dudík, M.; Ferrier, S.; Guisan, A.; Hijmans, R.J.; Huettmann, F.; Leathwick, J.R.; Lehmann, A.; et al. Novel methods improve prediction of species’ distributions from occurrence data. Ecography 2006, 29, 129–151. [Google Scholar] [CrossRef] [Green Version]
  22. Seo, C.; Thorne, J.H.; Hannah, L.; Thuiller, W. Scale effects in species distribution models: Implications for conservation planning under climate change. Biol. Lett. 2009, 5, 39–43. [Google Scholar] [CrossRef] [Green Version]
  23. Hernandez, P.A.; Graham, C.H.; Master, L.L.; Albert, D.L. The effect of sample size and species characteristics on performance of different species distribution modeling methods. Ecography 2006, 29, 773–785. [Google Scholar] [CrossRef]
  24. Warren, D.L.; Seifert, S.N. Ecological niche modeling in Maxent: The importance of model complexity and the performance of model selection criteria. Ecol. Appl. 2011, 21, 335–342. [Google Scholar] [CrossRef] [PubMed] [Green Version]
  25. Baek, H.; Lee, J.; Lee, H.; Hyun, Y.; Cho, C.; Kwon, W.; Marzin, C.; Gan, S.; Kim, M.; Choi, D. Climate change in the 21st century simulated by HadGEM2-AO under representative concentration pathways. Asia-Pac. J. Atmos. Sci. 2013, 49, 603–618. [Google Scholar] [CrossRef]
  26. Wei, B.; Wang, R.; Hou, K.; Wang, X.; Wu, W. Predicting the current and future cultivation regions of Carthamus tinctorius L. using MaxEnt model under climate change in China. Glob. Ecol. Conserv. 2018, 16, e00477. [Google Scholar]
  27. GBIF.org, Occurrence Download; GBIF: Copenhagen, Denmark, 2019; Available online: https://www.gbif.org (accessed on 8 July 2019).
  28. Huettmann, F. Databases and science-based management in the context of wildlife and habitat: Toward a certified ISO standard for objective decision-making for the global community by using the internet. J. Wildl. Manag. 2005, 69, 466–472. [Google Scholar] [CrossRef]
  29. Hijmans, R.; Garrett, K.; Huaman, Z.; Zhang, D.; Schreuder, M.; Bonierbale, M. Assessing the geographic representativeness of genebank collections: The case of Bolivian wild potatoes. Conserv. Biol. 2000, 14, 1755–1765. [Google Scholar] [CrossRef]
  30. Reese, G.C.; Wilson, K.R.; Hoeting, J.A.; Flather, C.H. Factors affecting species distribution predictions: A simulation modeling experiment. Ecol. Appl. 2005, 15, 554–564. [Google Scholar] [CrossRef] [Green Version]
  31. INIFAP-CONABIO. Inventario Nacional de Candelilla (Euphorbia antisyphilitica) Fase I Version 1.5. Occurrence dataset. In Inventario Nacional de Candelilla (Euphorbia antisyphilitica); CONABIO: Mexico City, Mexico, 2018. [Google Scholar]
  32. Elith, J.; Leathwick, J.R. Species distribution models: Ecological Explanation and Prediction Across Space and Time. Annu. Rev. Ecol. Evol. Syst. 2009, 40, 677–697. [Google Scholar] [CrossRef]
  33. Guisan, A.; Thuiller, W. Predicting species distribution: Offering more than simple habitat models. Ecol. Lett. 2005, 10, 993–1009. [Google Scholar] [CrossRef]
  34. Li, G.Q.; Liu, C.C.; Liu, Y.G.; Yang, J.; Zhang, X.S.; Guo, K. Advances in theoretical issues of species distributionmodels. Acta Ecol. Sin. 2013, 36, 4827–4835. [Google Scholar]
  35. Wang, R.; Li, Q.; He, S.; Liu, Y.; Wang, M.; Jiang, G. Modeling and mapping the current and future distribution of Pseudomonas syringae pv. actinidiae under climate change in China. PLoS ONE 2018, 13, e0192153. [Google Scholar] [CrossRef] [PubMed] [Green Version]
  36. Soberón, J.; Osorio-Olvera, L.; Peterson, T. Diferencias conceptuales entre modelación de nichos y modelación de áreas de distribución. Rev. Mex. De Biodivers. 2017, 88, 437–441. [Google Scholar] [CrossRef]
  37. Gastón, A.; García-Viñas, J.I. Modelling species distributions with penalised logistic regressions: A comparison with maximum entropy models. Ecol. Model. 2011, 222, 2037–2041. [Google Scholar] [CrossRef]
  38. Phillips, S.J.; Dudík, M.; Schapire, R.E. A Maximum entropy approach to species distribution modeling. In Proceedings of the Twenty-First International Conference on Machine Learning, Banff, AB, Canada, 4–8 July 2004; Volume 83, pp. 655–662. [Google Scholar]
  39. Elith, J.; Phillips, S.J.; Hastie, T.; Dudík, M.; Chee, Y.E.; Yates, C.J. A statistical explanation of MaxEnt for ecologists. Divers. Distrib. 2011, 17, 43–57. [Google Scholar] [CrossRef]
  40. Ortíz-Yusty, C.; Restrepo, A.; Páez, V.P. Distribución potencial de Podocnemis lewyana (Reptilia: Podocnemididae) y su posible fluctuación bajo escenarios de cambio climático global. Acta Biol. Colomb. 2014, 13, 471–481. [Google Scholar] [CrossRef]
  41. Martin, G.; Bellouin, N.; Collins, W.; Culverwell, I.; Halloran, P.; Hardiman, S.; Hinton, T.; Jones, C.; McDonald, R.; McLaren, A. The HadGEM2 family of Met Office Unified Model climate configurations. Geosci. Model. Dev. 2011, 4, 723–757. [Google Scholar]
  42. Taylor, K.E.; Stouffer, R.J.; Meehl, G.A. An overview of CMIP5 and the experiment design. Bull. Am. Meteorol. Soc. 2012, 93, 485–498. [Google Scholar] [CrossRef] [Green Version]
  43. Hijmans, R.J.; Cameron, S.; Parra, J.; Jones, P.; Jarvis, A.; Richardson, K. World Clim-Global Climate Data. Free Climate Data for Ecological Modeling and GIS. 2015, Volume 2.0. Available online: www.worldclim.org (accessed on 8 July 2019).
  44. Giorgetta, M.A.; Jungclaus, J.; Reick, C.H.; Legutke, S.; Bader, J.; Böttinger, M.; Brovkin, V.; Crueger, T.; Esch, M.; Fieg, K. Climate and carbon cycle changes from 1850 to 2100 in MPI-ESM simulations for the Coupled Model Intercomparison Project phase 5. J. Adv. Model. Earth Syst. 2013, 5, 572–597. [Google Scholar] [CrossRef]
  45. Griffies, S.M.; Winton, M.; Donner, L.J.; Horowitz, L.W.; Downes, S.M.; Farneti, R.; Gnanadesikan, A.; Hurlin, W.J.; Lee, H.-C.; Liang, Z. The GFDL CM3 coupled climate model: Characteristics of the ocean and sea ice simulations. J. Clim. 2011, 24, 3520–3544. [Google Scholar] [CrossRef]
  46. Good, P.; Jones, C.; Lowe, J.; Betts, R.; Gedney, N. Comparing tropical forest projections from two generations of Hadley Centre Earth System models, HadGEM2-ES and HadCM3LC. J. Clim. 2013, 26, 495–511. [Google Scholar] [CrossRef]
  47. Qin, A.; Liu, B.; Guo, Q.; Bussmann, R.W.; Ma, F.; Jian, Z.; Xu, G.; Pei, S. Maxent modeling for predicting impacts of climate change on the potential distribution of Thuja sutchuenensis Franch., an extremely endangered conifer from southwestern China. Glob. Ecol. Conserv. 2017, 10, 139–146. [Google Scholar] [CrossRef]
  48. Cook, B.I.; Ault, T.R.; Smerdon, J.E. Unprecedented 21st century drought risk in the American Southwest and Central Plains. Sci. Adv. 2015, 1, e1400082. [Google Scholar] [CrossRef] [PubMed] [Green Version]
  49. Fernández-Eguiarte, A.; Zavala-Hidalgo, J.; Romero-Centeno, R. Atlas Climático Digital de México. Centro de Ciencias de la Atmósfera; UNAM Centro de Ciencias de la Atmosfera: Mexico City, Mexico, 2010; Volume 1, p. 2. [Google Scholar]
  50. Phillips, S.J.; Anderson, R.P.; Schapire, R.E. Maximum entropy modeling of species geographic distributions. Ecol. Model. 2006, 190, 231–259. [Google Scholar] [CrossRef] [Green Version]
  51. Jaynes, E.T. Information theory and statistical mechanics. Phys. Rev. 1957, 106, 620. [Google Scholar] [CrossRef]
  52. Phillips, S.J.; Dudík, M. Modeling of species distributions with Maxent: New extensions and a comprehensive evaluation. Ecography 2008, 31, 161–175. [Google Scholar] [CrossRef]
  53. Torres-Olave, M.E. Aproximación espacio-temporal de sus scrofa en Chihuahua, México. Inst. De Arquit. Diseño Y Arte 2018. [Google Scholar]
  54. Fielding, A.H.; Bell, J.F. A review of methods for the assessment of prediction errors in conservation presence/absence models. Environ. Conserv. 1997, 24, 38–49. [Google Scholar] [CrossRef]
  55. Swets, J.A. Measuring the accuracy of diagnostic systems. Science 1988, 240, 1285–1293. [Google Scholar] [CrossRef] [Green Version]
  56. Baldwin, R.A. Use of maximum entropy modeling in wildlife research. J. Entropy 2009, 11, 854–866. [Google Scholar] [CrossRef]
  57. Yang, X.-Q.; Kushwaha, S.; Saran, S.; Xu, J.; Roy, P. Maxent modeling for predicting the potential distribution of medicinal plant, Justicia adhatoda L. in Lesser Himalayan foothills. Ecol. Eng. 2013, 51, 83–87. [Google Scholar] [CrossRef]
  58. SEMARNAT (Ed.) Secretaría del Medio Ambiente y Recursos Naturales-Avisos de Aprovechamiento de la Dirección General de Gestión Forestal y de Suelos, 1st ed.; SEMARNAT: Mexico City, Mexico, 2018. [Google Scholar]
  59. Giordani, L. The Role of Goats in Germination and Dispersal of Mimosa Luisana Brandegee (Leguminosae-Mimosoideae) Seeds in Tehuacan-Cuicatlan Valley, Peubla State, Mexico; Norwegan University of Life Science: As, Norway, 2008; Volume 1, p. 24. [Google Scholar]
  60. Saucedo-Pompa, S.; Rojas-Molina, R.; Aguilera-Carbó, A.F.; Saenz-Galindo, A.; De La Garza, H.; Jasso-Cantú, D.; Aguilar, C.N. Edible film based on candelilla wax to improve the shelf life and quality of avocado. Food Res. Int. 2009, 42, 511–515. [Google Scholar] [CrossRef] [Green Version]
  61. Bañuelos-Revilla, J.E.; Palacio-Núñez, J.; Martínez-Montoya, J.F.; Olmos-Oropeza, G.; Flores-Cano, J.A. Distribución potencial y abundancia de candelilla (Euphorbia antisyphilitica) en el norte de Zacatecas, México. Madera Y Bosques 2019, 25, e2511657. [Google Scholar] [CrossRef] [Green Version]
  62. Quesada-Quirós, M.; Acosta-Vargas, L.G.; Arias-Aguilar, D.; Rodríguez-González, A. Modelación de nichos ecológicos basado en tres escenarios de cambio climático para cinco especies de plantas en zonas altas de Costa Rica. Rev. For. Mesoam. Kurú 2017, 14, 1–12. [Google Scholar] [CrossRef] [Green Version]
  63. Varela, S.; Terribile, L.C.; De Oliveira, G.; Diniz-Filho, J.A.F.; González-Hernández, J.; Lima-Ribeiro, M.S. ecoClimate vs. Worldclim: Variables climáticas SIG para trabajar en biogeografía. Rev. Ecosistemas 2015, 24, 88–92. [Google Scholar] [CrossRef]
  64. IPCC. Impactos, Adaptación y Vulnerabilidad. Resúmenes, Preguntas Frecuentes y Recuadros Multicapítulos. Contribución del Grupo de Trabajo II al Quinto Informe de Evaluación del Grupo Intergubernamental de Expertos Sobre el Cambio Climático, 1st ed.; OMM PNUMA: Ginebra, Suiza, 2014; p. 200. [Google Scholar]
  65. Uribe Botero, E. El Cambio Climático y Sus Efectos en la Biodiversidad en América Latina, 1st ed.; United Nations CEPAL: Santiago, Chile, 2015; Volume 1, p. 84. [Google Scholar]
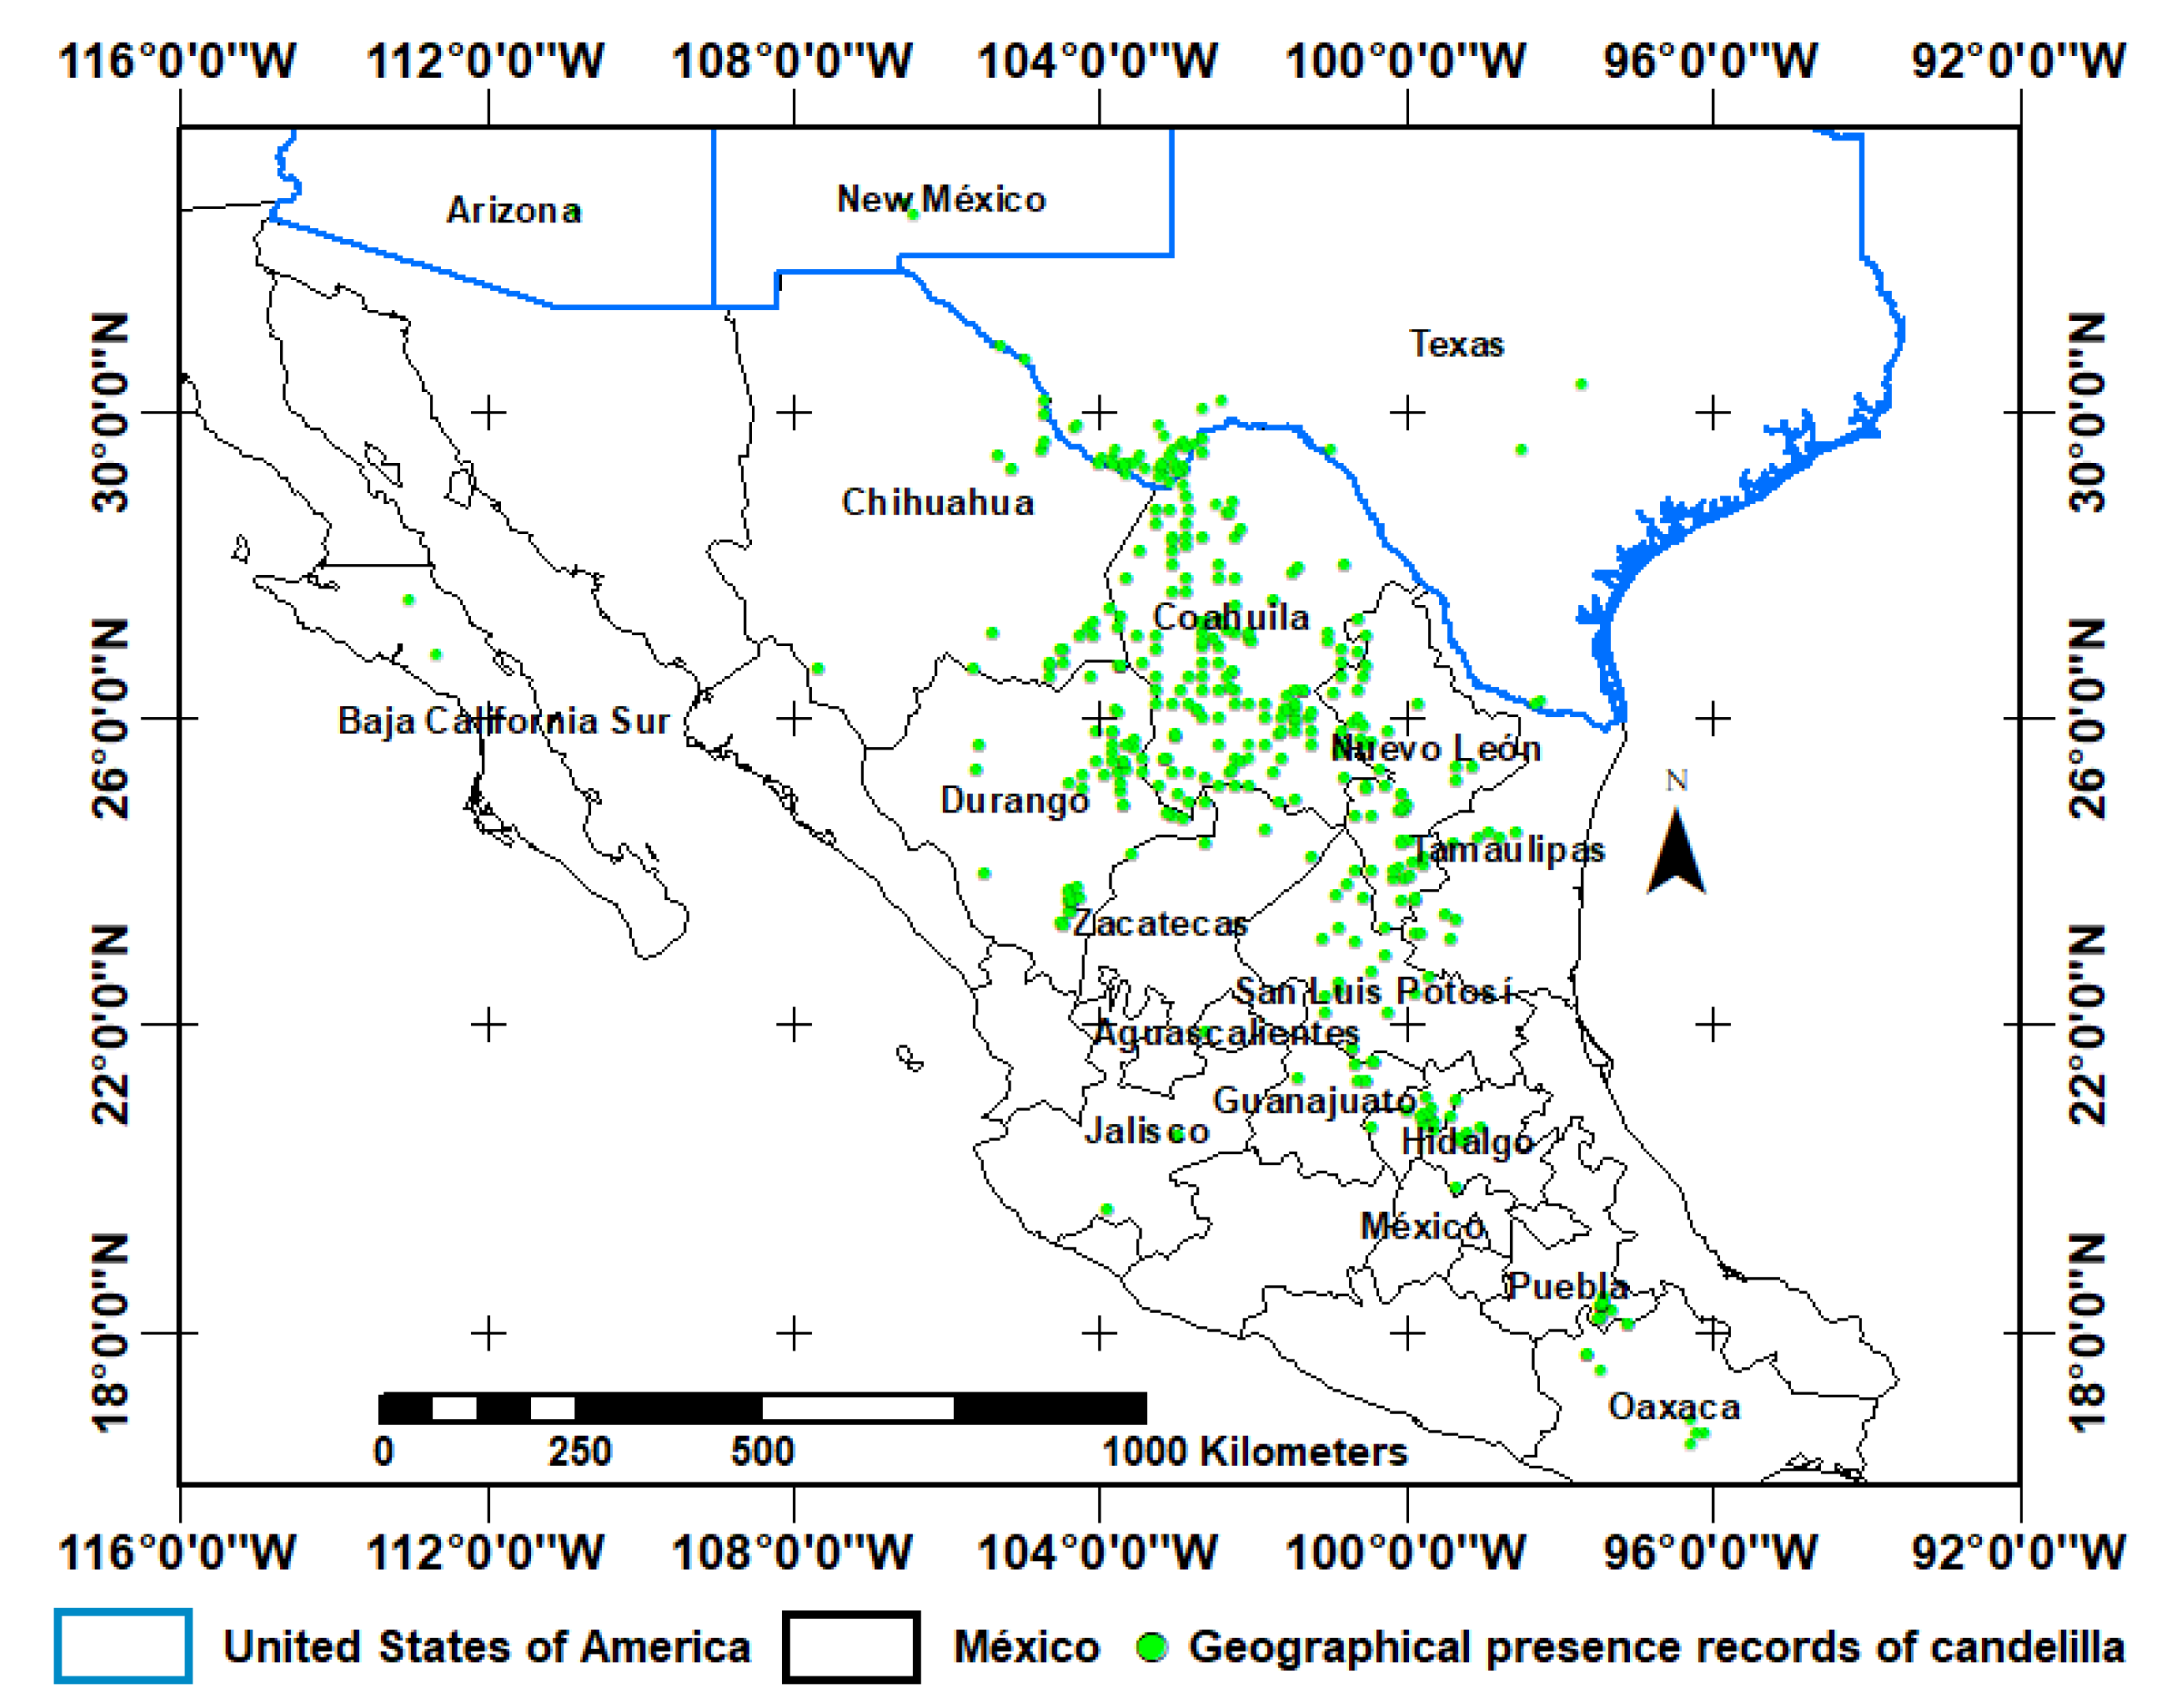
Figure 1. Presence sites of candelilla in North America, extracted from the Global Biodiversity Information Facility (GBIF).
Forests 11 00530 g001
Figure 2. Mean value for the area under the curve (AUC) with 50 reproductions planned to a medium-term future (2050).
Forests 11 00530 g002
Figure 3. Jackknife regularized test of gaining for candelilla.
Forests 11 00530 g003
Figure 4. Current habitat suitability of candelilla in Mexico and the USA.
Forests 11 00530 g004
Figure 5. Candelilla’s potential distribution areas with a representative concentration pathway (RCP) of 4.5, under three global climate models (GCMs) for Mexico and the USA.
Forests 11 00530 g005
Figure 6. Candelilla’s potential distribution areas with a RCP of 8.5, under three GCMs for Mexico and the USA.
Forests 11 00530 g006
Table 1. Environmental variables and contribution percentage.
CodeEnvironmental VariableUnitContribution
Bio1Annual Mean Temperature°C
Bio2Mean Diurnal Range (Mean of monthly (max temp—min temp))°C1.9
Bio3Isothermality (BIO2/BIO7) (×100) 1.4
Bio4temperature seasonality (standard deviation ×100)C of V1.0
Bio5Max Temperature of Warmest Month°C
Bio6Min Temperature of Coldest Month°C
Bio7Temperature Annual Range (BIO5-BIO6)°C1.7
Bio8Mean Temperature of Wettest Quarter°C
Bio9mean temperature of driest quarter°C8.7
Bio10Mean Temperature of Warmest Quarter°C
Bio11Mean temperature of coldest quarter°C45.7
Bio12Annual Precipitationmm4.5
Bio13Precipitation of Wettest Monthmm0.9
Bio14precipitation of driest monthmm4.7
Bio15precipitation seasonality (coefficient of variation)mm13.3
Bio16Precipitation of Wettest Quartermm3.0
Bio17Precipitation of Driest Quartermm
Bio18Precipitation of Warmest Quartermm1.5
Bio19precipitation of coldest quartermm11.6
The highlighted variables were selected in the multi-collinearity test, and used in modeling.
Table 2. Habitat suitability of candelilla in Mexico and the USA.
ModelHabitat Suitability
NoneLowMediumHighVery High
(< 19%)(20%–38%)(39%–57%)(58%–76%)(>77%)
Current conditions258,239,85435,762,24020,472,21419,166,820430
GFDL-CM3 4.5271,611,22031,420,53018,923,52611,661,34224,940
HADGEM2 4.5249,190,93446,029,35023,239,17815,173,4968600
MPI-ESM-LR 4.5251,931,66840,811,73023,755,17817,110,21632,766
GFDL-CM3 8.5279,306,32827,304,39816,429,78410,545,66455,384
HADGEM2 8.5250,376,27247,687,08623,284,15612,262,39631,648
MPI-ESM-LR 8.5264,142,89433,837,81825,283,74210,375,5561548