Article

Homogenization of Temperate Mixed Deciduous Forests in Białowieża Forest: Similar Communities Are Becoming More Similar

by
Olga Cholewińska
*,
Wojciech Adamowski
and
Bogdan Jaroszewicz
Białowieża Geobotanical Station, Faculty of Biology, University of Warsaw, 17-230 Białowieża, Poland
*
Author to whom correspondence should be addressed.
Forests 2020, 11(5), 545; https://doi.org/10.3390/f11050545
Submission received: 7 April 2020 / Revised: 29 April 2020 / Accepted: 11 May 2020 / Published: 12 May 2020
(This article belongs to the Section Forest Ecology and Management)

Abstract

:
Many studies show the significant impact of direct and indirect human activity on the functioning of terrestrial ecosystems, including forests. The increase in the number of invasive species, changes caused by climate change, or eutrophication of habitats resulting from air pollution can irrevocably affect biodiversity, species composition, or species interactions. Many of these effects cannot be seen in commercial forests due to the significant impact of direct human use of the forest and the high degree of transformation of forest ecosystems. In this work, we ask: how have forest communities changed over the past 70 years? What was the reason for these changes? To answer the above questions, we conducted research on repeated observations in the core area of the Białowieża National Park, which is characterized by one of the highest degrees of naturalness in Europe, where ecological processes have occurred without direct human intervention since the last glaciation. Studies have shown directional changes in species composition and biotic homogenization of three forest communities. Directional changes were found to be associated with both eutrophication of habitats as well as with changes in humidity and temperature. However, the observed changes in species composition were opposite to the hypotheses based on the observed global change. In contrast, changes in the species composition of the stand and the ability to shade and buffer the temperature and humidity under the canopy caused changes in the species composition of forest communities. In the mixed deciduous forest, homogenization occurred along with the simultaneous change of species composition of forest communities. This was caused by an increase in fertility caused by increased nitrogen deposition and changes in environmental conditions prevailing under the canopy of trees, which, however, were caused by changes in the species composition of the stand.

1. Introduction

Global change is the main factor causing changes in plant communities [1,2]. Its most important components are (1) climate change, and especially increase in mean annual temperature, changes in the amount, character and seasonality of precipitation, and the resulting increase in frequency of droughts [3,4,5]; (2) an increase in the atmospheric deposition of nitrogen, which leads to eutrophication of habitats and changes in the proportion of nitrogen-demanding species to non-demanding species or even to a decrease in species diversity [6,7,8]; (3) biological invasions resulting in the displacement of native species and modification of local environmental conditions [9,10,11,12]; and (4) fragmentation and loss of habitats caused by land use change and overexploitation [13]. The effects of each of these factors, both separately and cumulative at the same time, are often difficult to predict and model [14], and can lead to many serious consequences such as changes in phenology, species ranges, physiology of organisms, or changes in entire communities, including changes in species assemblages [15]. Recent studies have focused on the most serious consequences of global change, which is biodiversity decline and species extinction, which may lead to irreversible changes in the functioning of ecosystems. Another phenomenon often associated with global change is homogenization of species compositions of various types of plant communities such as meadows, forests, or peat bogs [16], reported by the studies based on repeated observations (resurveys). The number of articles reporting biotic homogenization has increased several times over the last 15 years. Olden et al. [17] even use the term “homogocene” to describe the coming times. Biotic homogenization is observed at various levels of life organization, beginning with genetic homogenization and ending with homogenization of species composition of communities [18] and homogenization of ecosystems on the landscape scale [19,20]. This phenomenon is observed both on local [21] and continental [22] scales. A large number of articles related to biotic homogenization of plant communities indicate the expansion of invasive species as its main driver [23,24,25]. Others, in turn, show that it takes place due to the expansion of native species, which in changing conditions, especially increase in nitrogen deposition, increase in average temperature or human disturbances, displacing other, less adapted species [16,21,26,27]. Biotic homogenization may take the form of replacement of ecological specialists by generalists, which may lead to a loss of functional diversity, which in far-reaching consequences may disrupt the functioning of the entire ecosystem, and reduce the stability, resilience, and resistance of communities to disturbances [19,28]. When discussing the reasons for change in species compositions, it is also worth keeping in mind local factors such as the history of the area where the research is conducted, changes in the abundance of ungulates, and frequency and severity of natural disturbances that, with a greater or lower frequency and intensity, may affect ecosystems, causing permanent or temporary changes in the composition of species in forest communities.
The purpose of our work was to determine the direction of changes in the species composition of the Central European oak–lime–hornbeam mixed deciduous forests of the Tilio-Carpinetum type that took place during the last 70 years, and to determine the drivers of these changes. In accordance with the observed global change, and based on reports of Czerepko [29] from hydrogenic forest ecosystems of northeastern Poland, we hypothesized that (1) share of species with higher thermal and nutrient requirements will increase, and (2) the global change will cause homogenization (melting into one common vegetation type) of diverse oak–lime–hornbeam forest subcommunity types due to unification of the following environmental conditions: increase in fertility due to relatively high nitrogen deposition [30], increase in temperature [31], and decrease in ground water levels [32]. Due to the nature of the site where the research was conducted, we did not expect a significant impact of non-native species on the studied communities [33], nor land use change effect (after establishing a National Park in this area with strict protection), which took place for the last time close to 100 years ago [34].

2. Materials and Methods
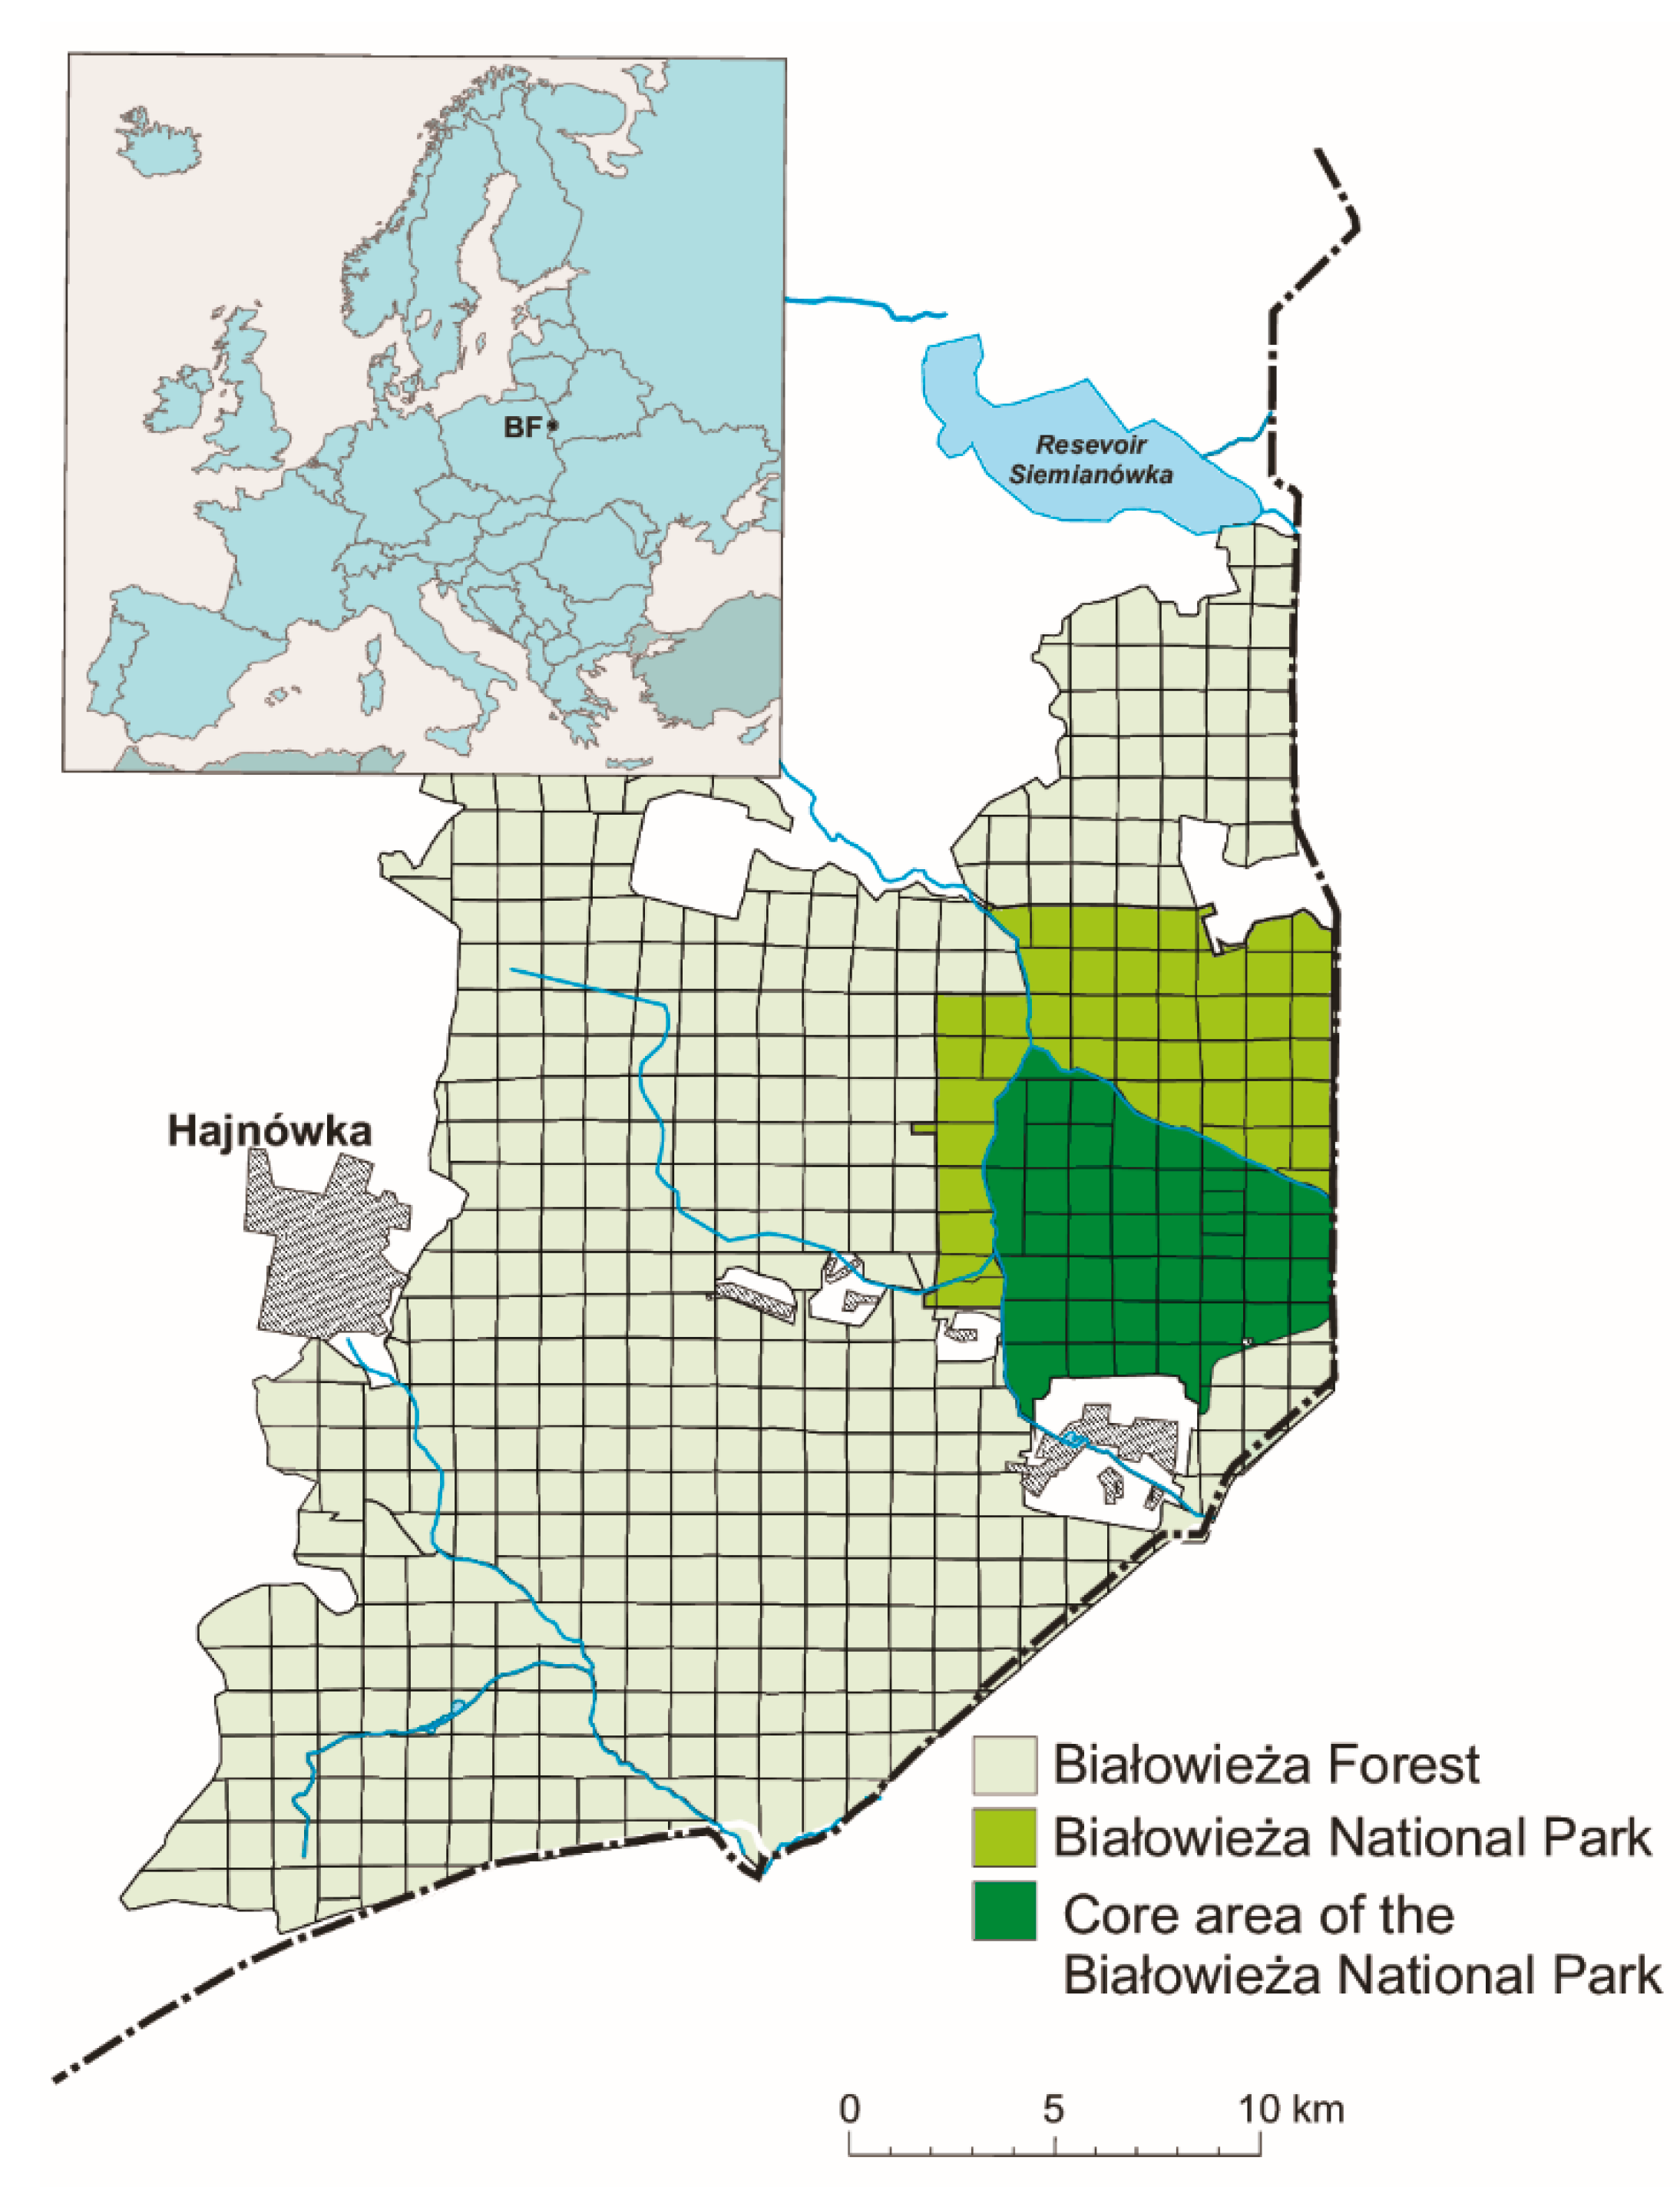
2.1. Study Area

Our study was conducted in Białowieża Forest (BF), which is the transboundary forest complex (52.74 N; 23.87 E) with an area of approximately 1450 km2–600 km2 belonging to Poland and 850 km2 to Belarus. BF is one of the best preserved temperate forests in Europe, with continuous tree cover and a course of ecological processes not significantly modulated by man during the last 12 thousands years [34,35,36]. Substantial fragments of BF’s ecosystems have preserved the natural character, expressed in diverse stand structure, species composition, and large amounts of deadwood [37,38], which is an effect of the late introduction of modern silviculture, including large scale wood extraction, which started there as late as the First World War [39]. The most common type of forest community in BF is oak–lime–hornbeam forest of the Tilio-Carpinetum type, which covers over 60% of the area [40]. This type of community develops on various types of eutrophic soils: typical eutrophic brown soils, typical clay-illuvial soils, and stagnogleyic clay-illuvial soils [41], with these English soil names based on [42]. In effect, species composition in different patches of vegetation is diverse, and consequently this plant community has been typically divided into three subcommunities [43], although it has also been divided up to seven subcommunities [37,40].
Since 1921, the best preserved part of BF has been strictly protected (i.e., no intervention approach), which recently has become the core area of the Białowieża National Park (BNP), where human activity is limited to tourism on a few restricted paths, for scientific exploration, and for maintenance of a few roads and touristic trails. Such a strict approach to nature conservation allows the study of long-term changes and dynamics of forest ecosystems without the need to take into account direct human interference in their course. The boundaries of the core area of BNP, in its original shape, were delimited by the rivers Hwoźna (northern border) and Narewka (western border), the state border between Poland and Belarus (eastern border), and the open habitats of the Białowieża village glade (southern border; Figure 1).
Most of the core area (98%) is covered with forest communities, and 53% of forests are oak–lime–hornbeam forests, which we chose for our study. Matuszkiewicz, in the baseline vegetation survey carried out in 1949, distinguished three types of oak–lime–hornbeam forest subcommunities [43]: Querceto-Carpinetum caricetosum pilosae (QCCaricetosum) (n = 25), Querceto-Carpinetum typicum (QCTypicum) (n = 22), and Querceto-Carpinetum stachyetosum silvaticae (QCStachyetosum) (n = 29). These plant communities in 1949 clearly differed by species composition (Figure 2) and co-occurred in the following gradient of soil fertility: QCStachyetosum occupied the most fertile and humid habitats, whereas the poorer and drier habitats of this type were covered by QCTypicum and QCCaricetosum. The dominance of European hornbeam (Carpinus betulus L.) and Norway maple (Acer platanoides L.), with an admixture of common ash (Fraxinus excelsior L.) in the stands, distinguished QCStachyetosum forest from the other two types. The herb layer in this type of forest was inhomogeneous, often combining species typical to QCTypicum or ash–alder riparian forest Fraxineto-Alnetum, with large abundances of Asarum europaeum L. and Stellaria nemorum L. As indicator species of QCStachyetosum, Matuszkiewicz pointed out Impatiens noli-tangere L., Festuca gigantea L. Vill., and Carex remota L. QCTypicum was a community in which the hornbeam dominated in the tree stand, creating strong shading of the forest floor. The herb layer was homogenous, with high cover of Galium odoratum L., Galeobdolon luteum Huds, Stellaria holostea L., and Oxalis acetosella L. Querceto-Carpinetum caricetosum pilosae was a community very similar in structure to QCTypicum, but QCCaricetosum occupied the least moist habitats among the oak–lime–hornbeam forests. QCCaricetosum was a very homogeneous community with a small number of enclaves enabling the development of plants with various requirements for the habitat [43]. Despite the great importance of hornbeam in the stand layer, the presence of pedunculate oak (Quercus robur L.) and Norway maple as an admixture species of great importance made QCCaricetosum the most open type of oak–lime–hornbeam forest in Białowieża National Park, with the lowest crown cover. The understory can be considered grassy with a high proportion of Carex pilosa Scop. Matuszkiewicz mentioned Anemone nemorosa L., Daphne mezereum L., Carex digitata L., and Sorbus aucuparia L. as indicator species [43].

2.2. Data Sampling

In 2018, we resurveyed 76 semi-permanent vegetation plots sensu Kapfer et al. [44] with an area of 100 m2 (10 m × 10 m), representing three types of the studied oak–lime–hornbeam forest, sampled originally by the team of Professor Matuszkiewicz in 1949. The plots were located by Professor Matuszkiewicz arbitrarily on the territory of the Strict Reserve of BNP, “in the homogeneous vegetation patches, representative of the plant community” [43]. Both vegetation surveys (baseline and resurvey) were carried out with the use of the six-step Braun–Blanquet scale for estimating plant species cover [45]. Three forest layers were defined, following the original survey: (1) understorey (all herbaceous plants regardless of their height, and trees and shrubs <0.5 m high), (2) shrub layer (trees 0.5–6.0 m high, and all shrubs higher than 0.5 m), and (3) canopy layer (trees over 6 m high). However, due to the inaccurate nature of historical data on the shrub layer, we omitted this layer in our analysis. We relocated the plots using exact descriptions of their location given by Matuszkiewicz [43]. BF is divided into numbered square compartments (1066 × 1066 m), with borders maintained since the end of the 19th century. Descriptions presented the location of the research plots relative to the four cardinal directions, the corner of compartment (marked with concrete poles with the numbers of compartments), or the distance from the road or characteristic point (e.g., an old, well known oak). To maximize the accuracy of plot relocation and make it more objective, we used ArcGIS 10.3 software to determine the geographic coordinates of their central point, on the basis of their distance from the permanent field marks (usually corners of a forest compartment). To locate a plot in the field, we used the QField application for smartphones (ver. 1.1.0 Matterhorn), which is compatible with the ArcGIS program and in optimal conditions allows accuracy down to a few centimetres. Both series of observations—original (1949) and resurvey (2018)—were carried out in July and August of the respective years, so as to stay in the timeframe of a similar phenological period.

2.3. Data Analyses

Ellenberg’s Indicator Values (cwmEIV) for light (EV_L), temperature (EV_T), moisture (EV_M), pH (EV_pH), nutrient availability (EV_N), and shade casting ability index (SCAI) (following Verheyen [46]) were calculated as the weighted means of the species composition (percentage cover) of the understorey and stand. The Shannon–Wiener Index was calculated by percentage cover. All statistical analyses were carried out in R 3.4.2 using Rstudio 1.1.383. The “ggplot2” [47] and “vegan” [48] packages were used to generate graphical results. The Mahalanobis distance was calculated using the mahalanobis function of R. Student’s paired t-test was used for analysis differences between two series of observations for forest layer covers, community weighted means of Ellenberg’s Indicator Values (cwmEIV), species richness (SR), Shannon–Wiener Index, and SCAI. Change in Mahalanobis distance was tested by Student’s unpaired t-test. Principal component analysis (PCA) was prepared on the basis of species cover expressed by the Braun–Blanquet scale. PCA was selected to present data on the basis of the length of the PC1 axis gradient. Differences between frequencies (the number of plots where the species occurred) of understorey and stand species on plots were analysed with the use of the chi-squared test. To identify indicator species of the oak–lime–hornbeam forest types for both series of observations, we used the “indicspecies” [49] package and the “multipatt” function.

3. Results

There were 135 species of understorey vascular plants recorded at 76 plots in total—100 species in 1949 (the baseline survey) and 109 in 2018 (the resurvey). In contrast to the increase in total species richness, the mean species richness (SR) on all plots decreased by two species per plot (from 30.8 (±7.35) to 28.5 (±6.78); t = −2.1605, p = 0.033), but when it comes to particular type of forest community, the decrease in SR was significant only in QCStachyetosum (by 5.36 species; Table 1). The mean value of the Shannon–Wiener index on all plots decreased from 3.3 (±0.25) to 2.7 (±0.26) (t = −17.11, p < 0.001), and differences were similar among all types of studied forest.
The frequency of species on all plots increased significantly for 15 species and decreased for 19 species (Table S1). Geophytes were among the species that showed a tendency to decline: Adoxa moschatellina L., Anemone nemorosa L., Asarum europaeum L., Hepatica nobilis L., and Dentaria bulbifera L. At the same time, graminoids were among those increasing in frequency: Brachypodium sylvaticum Huds., Calamagrostis arundinacea L., Dactylis glomerata L., Poa nemoralis L., and Carex remota L. (Table S1). This pattern was similar in all three types of studied forest community (Table S2).
The changes in species composition and frequencies resulted in a significant decrease in cwmEIV for temperature and an increase in cwmEIV for moisture and nutrients in all studied communities. The cwmEIV for pH decreased in QCStachyetosum and QCTypicum, whereas light cwmEIV decreased only in QCCaricetosum (Table 1).
Principal component analysis (PCA) revealed directional changes along the PC1 (Figure 2). Points representing both surveys were concentrated in clearly separated clouds on the PCA scatter plot. Simultaneously, distances between points representing resurveyed plots (year 2018) decreased significantly in comparison to their distribution in the original survey (1949), expressing their higher species composition similarity, both in total as well as inside each type of studied forest (mean Mahalanobis distance for 1949 was 0.259 and for 2018 was 0.012; t = 8.612, p < 0.001). The shift between the surveys was driven by pairs of the cwmEIV: pH and temperature vs. moisture and nutrients. Additionally, the cwmEIV for light separated QCCaricetosum from two other types of oak–linden–hornbeam forest along PC2 (Figure 2) in 1949, but not in 2018. The first two PCA axes explained 39% of variance (25% (PC1) and 14% (PC2)).
The indicator species analysis, based on the relationship between the species occurrence and abundance values from the set of sampled sites and the classification of the same sites into site groups, revealed a substantial decrease in the number of indicator species. Many plant species lost their diagnostic value—their number decreased from 25 to 7 in QCStachyetosum, from 9 to 2 in QCCaricetosum, and from 1 to 0 in QCTypicum. Only a few species gained the status of indicator species—three species in QCStachyetosum and one species in QCCaricetosum (Table 2).
There were 11 species of tree recorded in the stand: Acer platanoides L., Betula pendula Roth., Carpinus betulus L., Fraxinus excelsior L., Picea abies H.Karst., Populus tremula L., Quercus robur L., Sorbus aucuparia L., Ulmus glabra Huds., Tilia cordata Mill., and Alnus glutinosa Gaertn. (the latter was not recorded in the baseline survey). The frequencies of four species in the stand—A. platanoides, F. excelsior, P. abies, and Q. robur—significantly decreased by 40 (χ2 = 20.51, p < 0.0001), 16 (χ2 = 9.84, p = 0.002), 25 (χ2 = 5.08, p = 0.024), and 21 (χ2 = 9.38, p = 0.002), respectively. Only the frequency of alder (A. glutinosa) increased, by 5 (χ2 = 5, p = 0.025) (Table S3). The direction and significance of changes in frequencies and mean coverages for each species were consistent. Only lime (T. cordata), despite a lack of significant changes in attendance (p = 0.07), increased coverage significantly from 10.03% to 20.43% (t = −4.29, p < 0.001). The changes in frequency and cover were reflected in the mean shade-casting ability index (SCAI), which increased significantly in all studied communities (Table 1). The average cover of all forest strata (tree, shrub, and understorey layer) in oak–lime–hornbeam mixed deciduous forest decreased significantly between the surveys by 12% (t = −6.791, p < 0.001), 23% (t = 6.9811, p < 0.001), and 14% (t = −5.284, p < 0.001), respectively (Table 1).

4. Discussion

We revealed a strong homogenization of the studied types of mixed deciduous forests on two ecological levels. On the community level, their species composition became less heterogeneous inside each of them separately, and on the ecosystem level these three communities melted down into one quite homogenous set of species. This was well expressed on the PCA scatter (Figure 2), where the dispersion of the points representing the year 2018 was significantly lower than in the baseline survey. The homogenization among the studied communities was manifested by a complete overlapping in 2018 of the clouds of points representing the species composition of all communities, in contrast to 1949, when communities were clearly separated from each other on the scatter plot space and overlap only to a small extent.
There were several mechanisms leading to the homogenization of the studied oak–lime–hornbeam communities. One of them is change in the frequency of species that were indicator species in 1949 and lost their status or gained indicator species status in 2018. Some indicator species expanded and increased frequency in all three communities, which resulted in a decrease of their specificity. This was the case of Carex remota L. and Circea lutetiana L. Both were indicator species for QCStachyetosum in 1949, but due to their recent expansion and increased frequency in all studied communities (Table S2), they lost their status of indicator species (Table 2). Another example are species that were indicator species in the past, but reduced their frequency in the community for which they were specific, and this way lost their status as indicator species. An example of such a species was Carex digitata L., which in the past was the indicator species of QCCaricetosum, but its frequency decreased in this community in the period between the surveys, which resulted in the species being dropped from the list of indicator species in 2018. A special case was Galium odoratum Scop, which was the only indicator species for QCTypicum in 1949, where it occurred with the highest abundance; however, between the surveys, its frequency decreased to a level similar for all studied communities. In effect, from an analytical point of view, QCTypicum ceased to exist as a separate plant community due to the lack of indicator species. Four species that did not have a diagnostic value in 1949 became indicator species in 2018. This also took place via two paths. Lathyrus vernus Bernh. and Polygonatum multiflorum All., which were similarly abundant everywhere, reduced in frequency in two out of the three studied communities, becoming indicator species for the third community (QCStachyetosum and QCCaricetosum, respectively), where change was not significant. Another two species—Rumex obtusifolius L. and Euonymus europaea L.—became indicator species for QCStachyetosum by the significant increase of their frequency in this community, but not in the other two. The range of functional characteristics of these species is so wide that it is not possible to explain what the reasons were for the observed changes.
Another mechanism leading to homogenization were changes in the frequency of certain functional groups of species. In our case, it was caused by an increase in the frequency of graminoids in all types of studied communities: grasses (Brachypodium sylvaticum, Calamagrostis arundinacea, Dactylis glomerata, Deschampsia caespitosa, Milium effusum) and sedges (Carex remota, Carex sylvatica). An increase in the share of graminoids is often associated with two causes: increased grazing pressure or intensive eutrophication [50]. The impact of herbivores, in our opinion, was not the main reason for these changes due to their nature. With the high impact of herbivores, we would expect an increase in graminoid coverage but without major changes in attendance, because grazing by herbivores causes graminoids to compensate for their rapid growth [51,52]. The graminoids may also benefit from seed dispersal by large herbivores, as they account for 32% of plant species dispersed endozoochorically by the guild of ungulates in BF (Poaceae 19%, Cyperaceae 9%, and Juncaceae 4%). However, their share in the number of dispersed seeds is much lower [53], and the colonization success of endozoochorically dispersed seeds in the studied oak–lime–hornbeam forest communities is negligible [54], which again argues against their importance. Many publications suggest that the expansion of graminoids in forest ecosystems is caused by eutrophication, especially by increased nitrogen deposition [55,56,57]. Van der Wal et al. [50] pointed out that these two factors (herbivore pressure and nitrogen deposition) can propel each other on the basis of a positive feedback loop. The increase in fertility due to nitrogen deposition causes an increase in the share of grasses and sedges, which attract herbivores, and results in even greater fertilization of the soil by the depositing of faeces and the further increase in the share of graminoids [50]. The combined positive influence of these two factors on the graminoids was also possible in our study. However, the separation of their effects was not possible due to the fact that both factors in Białowieża Forest have shown increasing tendencies during the last half-century, and they provide feedback to each other [50]. The increasing densities of ungulates since the 1950s [58] are accompanied by an increase in nitrogen deposition since at least the 1980s, when direct measurement of pollutant deposition started [30]. These effects were also expressed in our study in the increase in the share of nitrogen-demanding species, which caused directional changes in the species composition of the studied forest communities. This observation is consistent with reports from all over Europe, where such directional changes in species composition are observed in forests [7,8,46]. Usually, eutrophication of habitats caused by increased nitrogen deposition is quoted as the main explanation for such changes [59].
Gilliam [60], in his work on the understorey plant response to an increase in nitrogen deposition, discussed many effects of eutrophication, including changes in the degree of herbivory, mycorrhizae, and the impact on plant diseases. He put forward the hypothesis that homogenization of forest communities is caused by an increase in nitrogen deposition in communities where nitrogen is a limiting factor. This causes a decrease in the spatial heterogeneity of nitrogen availability and drives homogenization of vegetation due to homogenization of soil fertility, which was also confirmed by Keith et al. [61]. In our study, homogenization of plant communities increased along with the increase in the original fertility of forest habitats, which was manifested by a significant increase in the share of species with a high Ellenberg’s ecological indicator value for nutrients. The great importance of the increasing nitrogen deposition for explaining changes in the species composition of understorey plants and epiphytic lichens in Białowieża Forest was also reported by several other authors carrying out part of their research in Białowieża Forest [7,62,63,64].
Another important process influencing the results of our study was the decrease in the frequency of early-spring species, especially geophytes Anemone nemorosa, Adoxa moschatellina, and Dentaria bulbifera. This change may be related to severe droughts during several years in the last decade, taking place from late spring and continuing till autumn in the studied area. Especially in April and May of the year of the resurvey (2018), very high temperatures and a very low amount of precipitation were recorded in the area of Białowieża Forest [65]. This brought serious consequences for geophytes, because their life cycle closes before the observation period (July/August) [40], and this year they were exposed to earlier senescence due to adverse conditions (drought and high temperatures). This probably happened with A. nemorosa, which in 1949 was one of the indicator species of QCCaricetosum, and thus its low detectability in the resurvey could have contributed to the homogenization of communities. However, this result could be biased by the ability of geophytes to survive unfavourable environmental conditions in the form of bulbs and rhizoms, among others [66], which may still be present in the community but were not recorded by us due to the shortening of their vegetation period. Shortening the vegetation period could be a consequence of severe environmental conditions (drought) or acceleration of phenology as it happens with flowering [67]. We were not able to verify this biasing effect because control resampling, planned for the following year (2019), was not possible due to even more severe weather conditions. The annual precipitation in 2019 was extremely low (459 mm), at the level of 73% of long-term mean annual precipitation (625 mm for the period 1985-2015 [31]) and extremely high temperatures (annual mean temperature 9.0 °C vs. 6.9 °C for the period 1950–2015 [31]).
Another factor that could also have had an impact on changes in the species composition of the studied communities involves changes in the stand, both in species frequency and average plot coverage. Over the past 70 years, many large-scale disturbances of the forest canopy took place in Białowieża Forest [34]. Dutch elm disease affected all native elm species (Ulmus glabra, Ulmus minor Mill., Ulmus laevis Pall.), ash dieback caused a significant reduction in the population of Fraxinus excelsior, and spruce bark beetle (Ips typographus L.) outbreaks significantly reduced the share of Norway spruce (P. abies), which resulted in a reduction in the frequency of these tree species on the studied plots. The declining species have been replaced mainly by small-leaved lime (T. cordata), a species with higher shade-casting ability than the replaced species [46]. As a result, the average shade-casting ability index of the forest canopy increased in each of the communities studied in contrast to the declined canopy cover. However, the reduction in the stand cover, oscillating around 10%, could be related to observer error, which, according to Morrison [68], is a common and acceptable value in this type of research. Similarly, the decrease in the cover of the understorey, although statistically significant (change by about 10%), cannot be explained by the changes in the environment, and is probably caused by the observer effect associated with its biased estimation. Usually, lower stand density, as well as an increase in nitrogen deposition and hence eutrophication of habitats, causes an increase in the cover of the understorey vegetation. In our case, the average coverage of the understorey decreased by approximately 10%, despite the parallel decrease in the coverage of shrub and canopy layers, which should result in better light access to the forest floor. The analysis of Ellenberg’s ecological indicator values for light revealed the opposite—an increase in the shading of the forest floor, which had the highest impact on QCCaricetosum. The share of species with high Ellenberg’s indicator value for light significantly decreased in this community (Table 1), which corresponds well with the increase in the shade-casting ability index of the canopy trees, which was the most open canopy in the past. This led to homogenization with the other studied types of communities (Figure 2).
It is surprising that changes in species composition towards an increase in the share of cold-resistant and high moisture requirements species were contradictory with physical measurements of the climatic conditions. Both global [69] and local [31] climate characteristics indicate an increase in the mean annual temperature, as well as the more frequent occurrence of droughts and decreasing groundwater levels [31,32]. Thus, explanations for changes in species composition towards cooler and wetter conditions should be sought in the increase in SCAI. The increase in the mean shade-casting ability index of the stand is one of the factors increasing the ability of the forest to buffer temperatures under the canopy [70]. The lack of influence of climate warming on the species composition of epiphytic lichens, explained by the strong buffering effect of the tree canopy, was reported by Łubek et al. [62]. On the other hand, the increase in the mean shade-casting ability index clearly explains the decrease in the proportion of light-demanding species, such as Fragaria vesca L. and Plathantera bifolia Rich., which are usually associated with more open and relatively warmer forest communities [71].

5. Conclusions

The homogenization of forest communities is a poorly studied process, and the knowledge about its possible effects on biodiversity is limited. The number of publications on the homogenization of vegetation has increased with the increasing interest in global change effects [15]. According to the latest trends, most of the works related to the homogenization of plant communities concern the negative impact of alien species [20,21,22]. Only a small part of the homogenization works is associated with homogenization caused by the spread of native species [14,18,24].
The vegetation of the oak–lime–hornbeam forests of the Białowieża National Park has changed significantly during the 70 years that have passed since the baseline survey. The most visible change in the oak–lime–hornbeam forest communities was the homogenization of their species composition, and the melting of all three studied communities into one supercommunity. We consider the eutrophication of habitats and the expansion of native nitrophilic species as the reason for such changes. In addition, we conclude that changes in the stand could have contributed to changes in climatic conditions under the canopy of the stand, which results in changes in the species compositions of the understorey.

Supplementary Materials

The following are available online at https://www.mdpi.com/1999-4907/11/5/545/s1, Table S1: Changes in frequencies of species in all studied plots (number of occurrences, Nmax = 76). Table S2: Changes in frequencies (% of plots occupied) of plant species in three studied types of oak–lime–hornbeam forest in the Białowieża Forest, Eastern Poland. Table S3: Changes in frequencies of tree species in stand in all studied plots (number of occurrences, N = 76).

Author Contributions

Conceptualization, O.C. and B.J.; investigation, O.C., W.A., and B.J.; methodology, O.C. and B.J.; writing—original draft, O.C. and B.J.; writing—review and editing, O.C., W.A., and B.J. All authors have read and agreed to the published version of the manuscript.

Funding

This research received no external funding.

Conflicts of Interest

The authors declare no conflicts of interest.

References

  1. Nadeau, C.P.; Urban, M.C.; Bridle, J.R. Climates Past, Present, and Yet-to-Come Shape Climate Change Vulnerabilities. TREE 2017, 32, 786–800. [Google Scholar] [CrossRef] [PubMed] [Green Version]
  2. Hisano, M.; Searle, E.B.; Chen, H.Y.H. Biodiversity as a solution to mitigate climate change impacts on the functioning of forest ecosystems. Biol. Rev. 2018, 93, 439–456. [Google Scholar] [CrossRef] [PubMed]
  3. Peñuelas, J.; Lloret, F.; Montoya, R. Severe Drought Effects on Mediterranean Woody Flora in Spain. For. Sci. 2001, 47, 214–218. [Google Scholar]
  4. Vittoz, P.; Randin, C.; Dutoit, A.; Bonnet, F.; Hegg, O. Low impact of climate change on subalpine grasslands in the Swiss Northern Alps. Glob. Chang. Biol. 2009, 15, 209–220. [Google Scholar] [CrossRef]
  5. Becker-Scarpitta, A.; Vissault, S.; Vellend, M. Four decades of plant community change along a continental gradient of warming. Glob. Chang. Biol. 2018, 25, 1629–1641. [Google Scholar] [CrossRef] [PubMed]
  6. Diekmann, M.; Dupré, C. Acidification and eutrophication of deciduous forests in northwestern Germany demonstrated by indicator species analysis. J. Veg. Sci. 1997, 8, 855–864. [Google Scholar] [CrossRef]
  7. Bernhardt-Römermann, M.; Baeten, L.; Craven, D.; De Frenne, P.; Hédl, R.; Lenoir, J.; Bert, D.; Brunet, J.; Chudomelová, M.; Decocq, G.; et al. Drivers of temporal changes in temperate forest plant diversity vary across spatial scales. Glob. Chang. Biol. 2015, 21, 3726–3737. [Google Scholar] [CrossRef]
  8. Becker, T.; Spanka, J.; Schröder, L.; Leuschner, C. Forty years of vegetation change in former coppice-with-standards woodlands as a result of management change and N deposition. Appl. Veg. Sci. 2017, 20, 304–313. [Google Scholar] [CrossRef]
  9. Hejda, M.; Pyšek, P.; Jarošík, V. Impact of invasive plants on the species richness, diversity and composition of invaded communities. J. Ecol. 2009, 97, 393–403. [Google Scholar] [CrossRef]
  10. Vilà, M.; Espinar, J.L.; Hejda, M.; Hulme, P.E.; Jarošík, V.; Maron, J.L.; Pergl, J.; Schaffner, U.; Sun, Y.; Pyšek, P. Ecological impacts of invasive alien plants: A meta-analysis of their effects on species, communities and ecosystems. Ecol. Lett. 2011, 14, 702–708. [Google Scholar] [CrossRef]
  11. Slabejová, D.; Bacigál, T.; Hegedüšová, K.; Májeková, J.; Medvecká, J.; Mikulová, K.; Šibíková, M.; Škodová, I.; Zaliberová, M.; Jarolímek, I. Comparison of the understory vegetation of native forests and adjacent Robinia pseudoacacia plantations in the Carpathian-Pannonian region. For. Ecol. Manag. 2019, 439, 28–40. [Google Scholar] [CrossRef]
  12. Mikulová, K.; Jarolímek, I.; Bacigál, T.; Hegedüšová, K.; Májeková, J.; Medvecká, J.; Slabejová, D.; Šibík, J.; Škodová, I.; Zaliberová, M.; et al. The Effect of Non-Native Black Pine (Pinus nigra J. F. Arnold) Plantations on Environmental Conditions and Undergrowth Diversity. Forests 2019, 10, 548. [Google Scholar] [CrossRef] [Green Version]
  13. McGill, B.J.; Dornelas, M.; Gotelli, N.J.; Magurran, A.E. Fifteen forms of biodiversity trend in the Anthropocene. TREE 2015, 30, 104–113. [Google Scholar] [CrossRef] [PubMed]
  14. Heijmans, M.M.P.D.; Mauquoy, D.; van Geel, B.; Berendse, F. Long-term effects of climate change on vegetation and carbon dynamics in peat bogs. J. Veg. Sci. 2008, 19, 307–320. [Google Scholar] [CrossRef] [Green Version]
  15. Hughes, L. Biological consequences of global warming: Is the signal already apparent? TREE 2000, 15, 56–61. [Google Scholar] [CrossRef]
  16. Ross, L.C.; Woodin, S.J.; Hester, A.J.; Thompson, D.B.A.; Birks, H.J.B. Biotic homogenization of upland vegetation: Patterns and drivers at multiple spatial scales over five decades. J. Veg. Sci. 2012, 23, 755–770. [Google Scholar] [CrossRef]
  17. Olden, J.D.; Comte, L.; Giam, X. The Homogocene: A research prospectus for the study of biotic homogenisation. NeoBiota 2018, 37, 23–36. [Google Scholar] [CrossRef] [Green Version]
  18. Olden, J.D.; Rooney, T.P. On defining and quantifying biotic homogenization. Glob. Ecol. Biogeog. 2006, 15, 113–120. [Google Scholar] [CrossRef]
  19. van der Plas, F.; Manning, P.; Soliveres, S.; Allan, E.; Scherer-Lorenzen, M.; Verheyen, K.; Wirth, C.; Zavala, M.A.; Ampoorter, E.; Baeten, L.; et al. Biotic homogenization can decrease landscape-scale forest multifunctionality. Proc. Natl. Acad. Sci. USA 2016, 113, 3557–3562. [Google Scholar] [CrossRef] [Green Version]
  20. Šibíková, M.; Jarolímek, I.; Hegedüšová, K.; Májeková, J.; Mikulová, K.; Slabejová, D.; Škodová, I.; Zaliberová, M.; Medvecká, J. Effect of planting alien Robinia pseudoacacia trees on homogenization of Central European forest vegetation. Sci. Total Environ. 2019, 687, 1164–1175. [Google Scholar] [CrossRef]
  21. Bühler, C.; Roth, T. Spread of common species results in local-scale floristic homogenization in grassland of Switzerland. Div. Distr. 2011, 17, 1089–1098. [Google Scholar] [CrossRef]
  22. Qian, H.; Ricklefs, R.E. The role of exotic species in homogenizing the North American flora. Ecol. Lett. 2006, 9, 1293–1298. [Google Scholar] [CrossRef] [PubMed]
  23. Schwartz, M.W.; Thorne, J.H.; Viers, J.H. Biotic homogenization of the California flora in urban and urbanizing regions. Biol. Cons. 2006, 127, 282–291. [Google Scholar] [CrossRef]
  24. Gong, C.F.; Chen, J.; Yu, S. Biotic homogenization and differentiation of the flora in artificial and near-natural habitats across urban green spaces. Land. Urb. Plan. 2013, 120, 158–169. [Google Scholar] [CrossRef]
  25. Stotz, G.C.; Gianoli, E.; Cahill, J.F., Jr. Biotic homogenization within and across eight widely distributed grasslands following invasion by Bromus inermis. Ecology 2019, 100, e02717. [Google Scholar] [CrossRef] [PubMed]
  26. Lôbo, D.; Leão, T.; Melo, F.P.L.; Santos, A.M.M.; Tabarelli, M. Forest fragmentation drives Atlantic forest of northeastern Brazil to biotic homogenization. Div. Distr. 2011, 17, 287–296. [Google Scholar] [CrossRef]
  27. McCune, J.L.; Vellend, M.; Fridley, J. Gains in native species promote biotic homogenization over four decades in a human-dominated landscape. J. Ecol. 2013, 101, 1542–1551. [Google Scholar] [CrossRef]
  28. Olden, J.D.; Poff, N.L.; Douglas, M.R.; Douglas, M.E.; Fausch, K.D. Ecological and evolutionary consequences of biotic homogenization. TREE 2004, 19, 18–24. [Google Scholar] [CrossRef]
  29. Czerepko, J. Długookresowe zmiany roślinności w zespole sosnowego boru bagiennego Vaccinio uliginosi-Pinetum Kleist 1929. Leśn. Pr. Bad. 2011, 72, 21–29. [Google Scholar]
  30. Malzahn, E. Monitoring zagrożeń i zanieczyszczenia środowiska leśnego Puszczy Białowieskiej. Kosmos 2002, 51, 435–441. [Google Scholar]
  31. Boczoń, A.; Kowalska, A.; Ksepko, M.; Sokołowski, K. Climate Warming and Drought in the Bialowieza Forest from 1950–2015 and Their Impact on the Dieback of Norway Spruce Stands. Water 2018, 10, 1502. [Google Scholar] [CrossRef] [Green Version]
  32. Pierzgalski, E.; Boczoń, A.; Tyszka, J. Zmienność opadów i położenia wód gruntowych w Białowieskim Parku Narodowym. Kosmos 2002, 51, 415–425. [Google Scholar]
  33. Adamowski, W. The flora of vascular plants. In Białowieża National Park. Know It—Understand It—Protect It; Okołów, C., Karaś, M., Bołbot, A., Eds.; Białowieski Park Narodowy: Białowieża, Poland, 2009; pp. 59–72. [Google Scholar]
  34. Jaroszewicz, B.; Cholewińska, O.; Gutowski, J.M.; Zimny, M.; Samojlik, T.; Latałowa, M. Białowieża Forest—A Relic of the High Naturalness of European Forests. Forests 2019, 10, 849. [Google Scholar] [CrossRef] [Green Version]
  35. Latałowa, M.; Zimny, M.; Pędziszewska, A.; Kupryjanowicz, M. Postglacjalna historia puszczy Białowieskiej—Roślinność, klimat i działalność człowieka. Parki Nar. Rez. Przyr. 2016, 35, 3–49. [Google Scholar]
  36. Sabatini, F.; Sabatini, M.; Burrascano, S.; Keeton, W.S.; Levers, C.; Lindner, M.; Pötzschner, F.; Verkerk, P.J.; Bauhus, J.; Buchwald, E.; et al. Where are Europe’s last primary forests? Div. Distr. 2018, 24, 1426–1439. [Google Scholar] [CrossRef] [Green Version]
  37. Sokołowski, A.W. Lasy Puszczy Białowieskiej; Centrum Informacyjne Lasów Państwowych: Warszawa, Poland, 2004. [Google Scholar]
  38. Wesołowski, T.; Gutowski, J.M.; Jaroszewicz, B.; Kowalczyk, R.; Niedziałkowski, K.; Rok, J.; Wójcik, J.M. Park Narodowy Puszczy Białowieskiej—Ochrona Przyrody i Rozwój Lokalnych Społeczności. Article 2. 2018, pp. 1–28. Available online: www.forestbiology.org (accessed on 7 April 2020).
  39. Więcko, E. Puszcza Białowieska [The Białowieża Forest]; PWN: Warszawa, Poland, 1984. [Google Scholar]
  40. Faliński, J.B. Vegetation Dynamics in Temperate Lowland Primeval Forests: Ecological Studies in Białowieża Forest; Dr. W. Junk Publishers: Dordrecht, The Netherlands, 1986. [Google Scholar]
  41. Prusinkiewicz, Z.; Michalczuk, C. Gleby Białowieskiego Parku Narodowego (z mapą 1:20 000). Phytocoenosis 1998, 10 (Suppl. 10), 1–40. [Google Scholar]
  42. Świtoniak, M.; Kabała, C.; Charzyński, P. Proposal of English equivalents for the soil taxa names in the Polish Soils Classification. Soil Sci. Ann. 2016, 67, 103–116. [Google Scholar] [CrossRef] [Green Version]
  43. Matuszkiewicz, W. Zespoły leśne Białowieskiego Parku Narodowego. Die Waldassoziationen von Białowieża-Nationalpark. Ann. UMCS 1952, (Suppl. 6), 1–218. [Google Scholar]
  44. Kapfer, J.; Hédl, R.; Jurasinski, G.; Kopecký, M.; Schei, F.H.; Grytnes, J.-A. Resurveying historical vegetation data—Opportunities and challenges. Appl. Veg. Sci. 2017, 20, 164–171. [Google Scholar] [CrossRef]
  45. Braun-Blanquet, J. Pflanzensoziologie; Biologische Studienbücher: Berlin, Germany, 1928. [Google Scholar]
  46. Verheyen, K.; Baeten, L.; De Frenne, P.; Bernhardt-Römermann, M.; Brunet, J.; Cornelis, J.; Decocq, G.; Dierschke, H.; Eriksson, O.; Hédl, R.; et al. Driving factors behind the eutrophication signal in understorey plant communities of deciduous temperate forests. J. Ecol. 2012, 100, 352–365. [Google Scholar] [CrossRef]
  47. Wickham, H. ggplot2: Elegant Graphics for Data Analysis; Springer: New York, NY, USA, 2016. [Google Scholar]
  48. Oksanen, F.J.; Blanchet, G.; Friendly, M.; Kindt, R.; Legendre, P.; McGlinn, D.; Minchin, P.R.; O’Hara, R.B.; Simpson, G.L.; Solymos, P.; et al. vegan: Community Ecology Package, R Package Version 2.5-1; Available online: https://www.researchgate.net/publication/324693493_vegan_Community_Ecology_Package_Ordination_methods_diversity_analysis_and_other_functions_for_community_and_vegetation_ecologists_Version_25-1_URL_httpsCRANR-projectorgpackagevegan (accessed on 12 May 2020).
  49. De Caceres, M.; Legendre, P. Associations between Species and Groups of Sites: Indices and Statistical Inference. Ecology 2009, 90. [Google Scholar] [CrossRef] [PubMed]
  50. Van Der Wal, R.; Pearce, I.; Brooker, R.; Scott, D.; Welch, D.; Woodin, S. Interplay between nitrogen deposition and grazing causes habitat degradation. Ecol. Lett. 2003, 6, 141–146. [Google Scholar] [CrossRef]
  51. Jacobs, B.F.; Kingston, J.D.; Jacobs, L.L. The Origin of Grass-Dominated Ecosystems. Ann. Miss. Bot. Gard. 1999, 86, 590–643. [Google Scholar] [CrossRef]
  52. Gross, N.; Suding, K.N.; Lavorel, S. Leaf dry matter content and lateral spread predict response to land use change for six subalpine grassland species. J. Veg. Sci. 2007, 18, 289–300. [Google Scholar] [CrossRef]
  53. Jaroszewicz, B.; Pirożnikow, E.; Sondej, I. Endozoochory by the guild of ungulates in Europe’s primeval forest. Forest Eco. Manag. 2013, 305, 21–28. [Google Scholar] [CrossRef]
  54. Jaroszewicz, B.; Pirożnikow, E. Dung longevity influences the fate of endozoochorically dispersed seeds in forest ecosystems. Botany 2011, 89, 779–785. [Google Scholar] [CrossRef]
  55. Bobbink, R.; Hicks, K.; Galloway, J.; Spranger, T.; Alkemade, R.; Ashmore, M.; Bustamante, M.; Cinderby, S.; Davidson, E.; Dentener, F.; et al. Global assessment of nitrogen deposition effects on terrestrial plant diversity: A synthesis. Ecol. Appl. 2010, 20, 30–59. [Google Scholar] [CrossRef] [Green Version]
  56. Wang, Z.; Fan, Z.; Zhao, Q.; Wang, M.; Ran, J.; Huang, H.; Niklas, K.J. Global Data Analysis Shows That Soil Nutrient Levels Dominate Foliar Nutrient Resorption Efficiency in Herbaceous Species. Front. Plant. Sci. 2018, 9, 1431. [Google Scholar] [CrossRef]
  57. Xing, A.; Xu, L.; Shen, H.; Du, E.; Liu, X.; Fang, Y. Long term effect of nitrogen addition on understory community in a Chinese boreal forest. Sci. Tot. Env. 2019, 646, 989–995. [Google Scholar] [CrossRef]
  58. Jędrzejewska, B.; Jędrzejewski, W.; Bunevich, A.N.; Miłkowski, L.; Krasiński, Z.A. Factors shaping population densities and increase rates of ungulates in Białowieża Primeval Forest (Poland and Belarus) in the 19th and 20th centuries. Acta Theriol. 1997, 42, 399–451. [Google Scholar] [CrossRef] [Green Version]
  59. Holland, E.A.; Braswell, B.H.; Sulzman, J.; Lamarque, J.-F. Nitrogen deposition onto the United States and Western Europe: Synthesis of observations and models. Ecol. Appl. 2005, 15, 38–57. [Google Scholar] [CrossRef] [Green Version]
  60. Gilliam, F.S. Response of the herbaceous layer of forest ecosystems to excess nitrogen deposition. J. Ecol. 2006, 94, 1176–1191. [Google Scholar] [CrossRef] [Green Version]
  61. Keith, S.A.; Newton, A.C.; Morecroft, M.D.; Bealey, C.E.; Bullock, J.M. Taxonomic homogenization of woodland plant communities over 70 years. Proc. R. Soc. B 2009, 276, 3539–3544. [Google Scholar] [CrossRef] [PubMed] [Green Version]
  62. Łubek, A.; Kukwa, M.; Jaroszewicz, B.; Czortek, P. Changes in the epiphytic lichen biota of Białowieża Primeval Forest are not explained by climate warming. Sci. Tot. Env. 2018, 643, 468–478. [Google Scholar] [CrossRef] [PubMed]
  63. Landuyt, D.; Maes, S.; Depauw, L.; Ampoorter, E.; Blondeel, H.; Perring, M.; Brūmelis, G.; Brunet, J.; Decocq, G.; van Ouden, J.; et al. Drivers of aboveground understorey biomass and nutrient stocks in temperate deciduous forests. J. Ecol. 2019. [Google Scholar] [CrossRef]
  64. Maes, S.L.; Blondeel, H.; Perring, M.P.; Depauw, L.; Brümelis, G.; Brunet, J.; Decocq, G.; den Ouden, J.; Härdtle, W.; Hédl, R.; et al. Litter quality, land-use history, and nitrogen deposition effects on topsoil conditions across European temperate forests. Forest Ecol. Manag. 2019, 433, 405–418. [Google Scholar] [CrossRef] [Green Version]
  65. Toreti, A.; Belward, A.; Perez-Dominguez, I.; Naumann, G.; Luterbacher, J.; Cronie, O.; Seguini, L.; Manfron, G.; Lopez-Lozano, R.; Baruth, B.; et al. The exceptional 2018 European water seesaw calls for action on adaptation. Earth’s Future 2019, 7, 652–663. [Google Scholar] [CrossRef]
  66. Raunkiaer, C. The Life Forms of Plants and Statistical Plant Geography; Clarendon Press: Oxford, UK, 1934. [Google Scholar]
  67. Morrison, L.W. Observer error in vegetation surveys: A review. J. Plant. Ecol. 2016, 9, 367–379. [Google Scholar] [CrossRef]
  68. Sparks, T.H.; Jaroszewicz, B.; Krawczyk, M.; Tryjanowski, P. Advancing phenology in Europe’s last lowland primeval forest: Non-linear temperature response. Clim. Res. 2009, 39, 221–226. [Google Scholar] [CrossRef] [Green Version]
  69. 69. Shukla, P.R.; Skea, J.; Calvo Buendia, E.; Masson-Delmotte, V.; Pörtner, H.-O.; Roberts, D.C.; Zhai, P.; Slade, R.; Connors, S.; van Diemen, R.; et al. (Eds.) Climate Change and Land: An IPCC special report on Climate Change, Desertification, Land Degradation, Sustainable Land Management, Food Security, and Greenhouse Gas Fluxes in Terrestrial Ecosystems. IPCC. 2019. Available online: https://www.ipcc.ch/report/SRCCL/ (accessed on 7 April 2020).
  70. Zellweger, F.; Coomes, D.; Lenoir, J.; Depauw, L.; Maes, S.L.; Wulf, M.; Kirby, K.J.; Brunet, J.; Kopecký, M.; Máliš, F.; et al. Seasonal drivers of understorey temperature buffering in temperate deciduous forests across Europe. Glob. Ecol. Biogeog. 2019, 28, 1774–1786. [Google Scholar] [CrossRef] [Green Version]
  71. Matuszkiewicz, J.M.; Kozłowska, A.B. Przegląd fitosocjologiczny zbiorowisk leśnych Polski—Ciepłolubne dąbrowy. Fragm. Flor. Geobot. 1991, 36, 203–256. [Google Scholar]
Figure 1. The study site—core area of the Białowieża National Park in Eastern Poland.
Forests 11 00545 g001
Figure 2. The principal component analysis (PCA) of species composition of the oak–lime–hornbeam forest communities in 1949 (triangles) and 2018 (dots), with passively fitted community-weighted means of Ellenberg’s Indicator Values for moisture (EV_M), pH (EV_pH), temperature (EV_T), light (EV_L), and nutrients (EV_N). Green: Querceto-Carpinetum caricetosum pilosae, orange: Querceto-Carpinetum typicum, and blue: Querceto-Carpinetum stachyetosum silvaticae.
Forests 11 00545 g002
Table 1. Mean differences between 1949 and 2018 in Tree_cov—tree crown cover, Shrub_cov—shrub layer cover, Undersorey_cov—understorey cover, EV_L—mean light Ellenberg Index Value, EV_T—mean temperature Ellenberg Index Value, EV_M—mean soil moisture Ellenberg Index Value, EV_N—mean nutrient Ellenberg Index Value, EV_pH—mean acidity Ellenberg Index Value, SCAI—Shade Casting Ability Index, species richness—number species per plot.
FactorQuerceto-Carpinetum CaricetosumPilosaeQuerceto-Carpinetum TypicumQuerceto-Carpinetum Stachyetosum Silvaticae
Mean DiffSDtp-ValueMean DiffSDtp-ValueMean DiffSDtp-Value
Tree_cov (%)11.613.444.320.000213.89619.194.8455<0.000111.1313.842.7280.013
Shrub_cov (%)19.5231.393.110.00526.624.715.7981<0.000122.0931.053.33690.0031
Understorey_cov (%)11.824.322.430.0211.3722.322.74590.0104219.9522.664.130.0004
EV_L0.260.433.050.0055−0.07600.45−0.90330.374−0.030.42−0.330.743
EV_T0.1840.233.930.00060.08370.231.93600.0630.0810.182.08550.049
EV_M−0.31470.41−3.8170.00083−0.17870.33−2.93220.006638−0.15210.332.13920.0443
EV_N−0.460.49−4.75<0.0001−0.35510.66−2.87770.00758−0.22360.44−2.39180.0262
EV_pH0.160.501.590.12430.24130.552.36770.025040.29750.443.17790.0045
SCAI−0.3010.42−3.590.00146−0.48290.403−6.45<0.0001−0.51390.76−3.18490.0044
Species richness0.9610.260.470.6441.55178.650.966010.34235.36410.932.30250.035
Shannon–Wiener Index0.490.308.22<0.00010.6560.2912.204<0.00010.66850.329.83<0.0001
Table 2. List of indicator species for three types of oak–lime–hornbeam forest: Querceto-Carpinetum stachyetosum silvaticae, Querceto-Carpinetum caricetosum pilosae, and Querceto-Carpinetum typicum in two observation periods 1949 and 2018 (based on analysis of indicator species from the “indicspecies” R package). Stat-value—association value based on [49]; boldface—species that were indicators in 1949 and 2018.
1949 2018
Querceto-Carpinetum Stachyetosum Silvaticae
Indicator SpeciesStat-Valuep-ValueIndicator SpeciesStat-Valuep-Value
Stellaria nemorum0.7280.001Geranium robertianum0.6080.035
Impatiens noli tangere0.7010.001Fraxinus excelsior0.5660.039
Urtica dioica0.6890.001Equisetum sylvaticum0.5200.004
Stachys sylvatica0.6850.001Lathyrus vernus0.4890.029
Circea lutetiana0.6580.001Rumex obtusifolius0.4280.021
Fraxinus excelsior0.6410.001Euonymus europaea0.3860.035
Dryopteris carthusiana0.6360.006Crepis paludosa0.3690.023
Geranium robertianum0.6250.007---
Chrysosplenium alternifolium0.6220.001---
Asarum europaeum0.6160.003---
Geum urbanum0.6150.003---
Festuca gigantea0.5990.006---
Glechoma hederacea0.5640.002---
Carex remota0.5420.001---
Brachypodium sylvaticum0.5270.002---
Circea alpina0.5020.002---
Lapsana communis0.5000.003---
Deschampsia caespitosa0.4950.014---
Ranunculus repens0.4770.004---
Equisetum sylvaticum0.4330.024---
Mercurialis perennis0.4260.010---
Ranunculus cassubicus0.3890.043---
Crepis paludosa0.3690.019---
Elymus europaeus0.3690.029---
Padus avium0.3690.015---
Querceto-Carpinetum caricetosum pilosae
SpeciesStat-Valuep-ValueSpeciesStat-Valuep-Value
Carex pilosa0.9480.001Carex pilosa0.7150.002
Anemone nemorosa0.6540.019Polygonatum multiflorum0.5630.032
Maiantheum bifolium0.6180.004---
Sorbus aucuparia0.5450.014---
Carex digitata0.5180.048---
Calamagrostis arundinacea0.5060.003---
Phegopteris connectilis0.4890.006---
Luzula pilosa0.4350.010---
Plathantera bifolia0.3460.038---
Querceto-Carpinetum typicum
SpeciesStat-Valuep-ValueSpeciesStat-Valuep-Value
Galium odoratum0.7380.019---

