Author Contributions
Conceptualization and methodology, J.-P.B., K.L.O., N.E.K.; formal analysis, J.-P.B., N.E.K.; resources, K.L.O.; writing—original draft preparation and writing—review and editing, J.-P.B., K.L.O., N.E.K.; funding acquisition, J.-P.B., K.L.O. All authors have read and agreed to the published version of the manuscript.
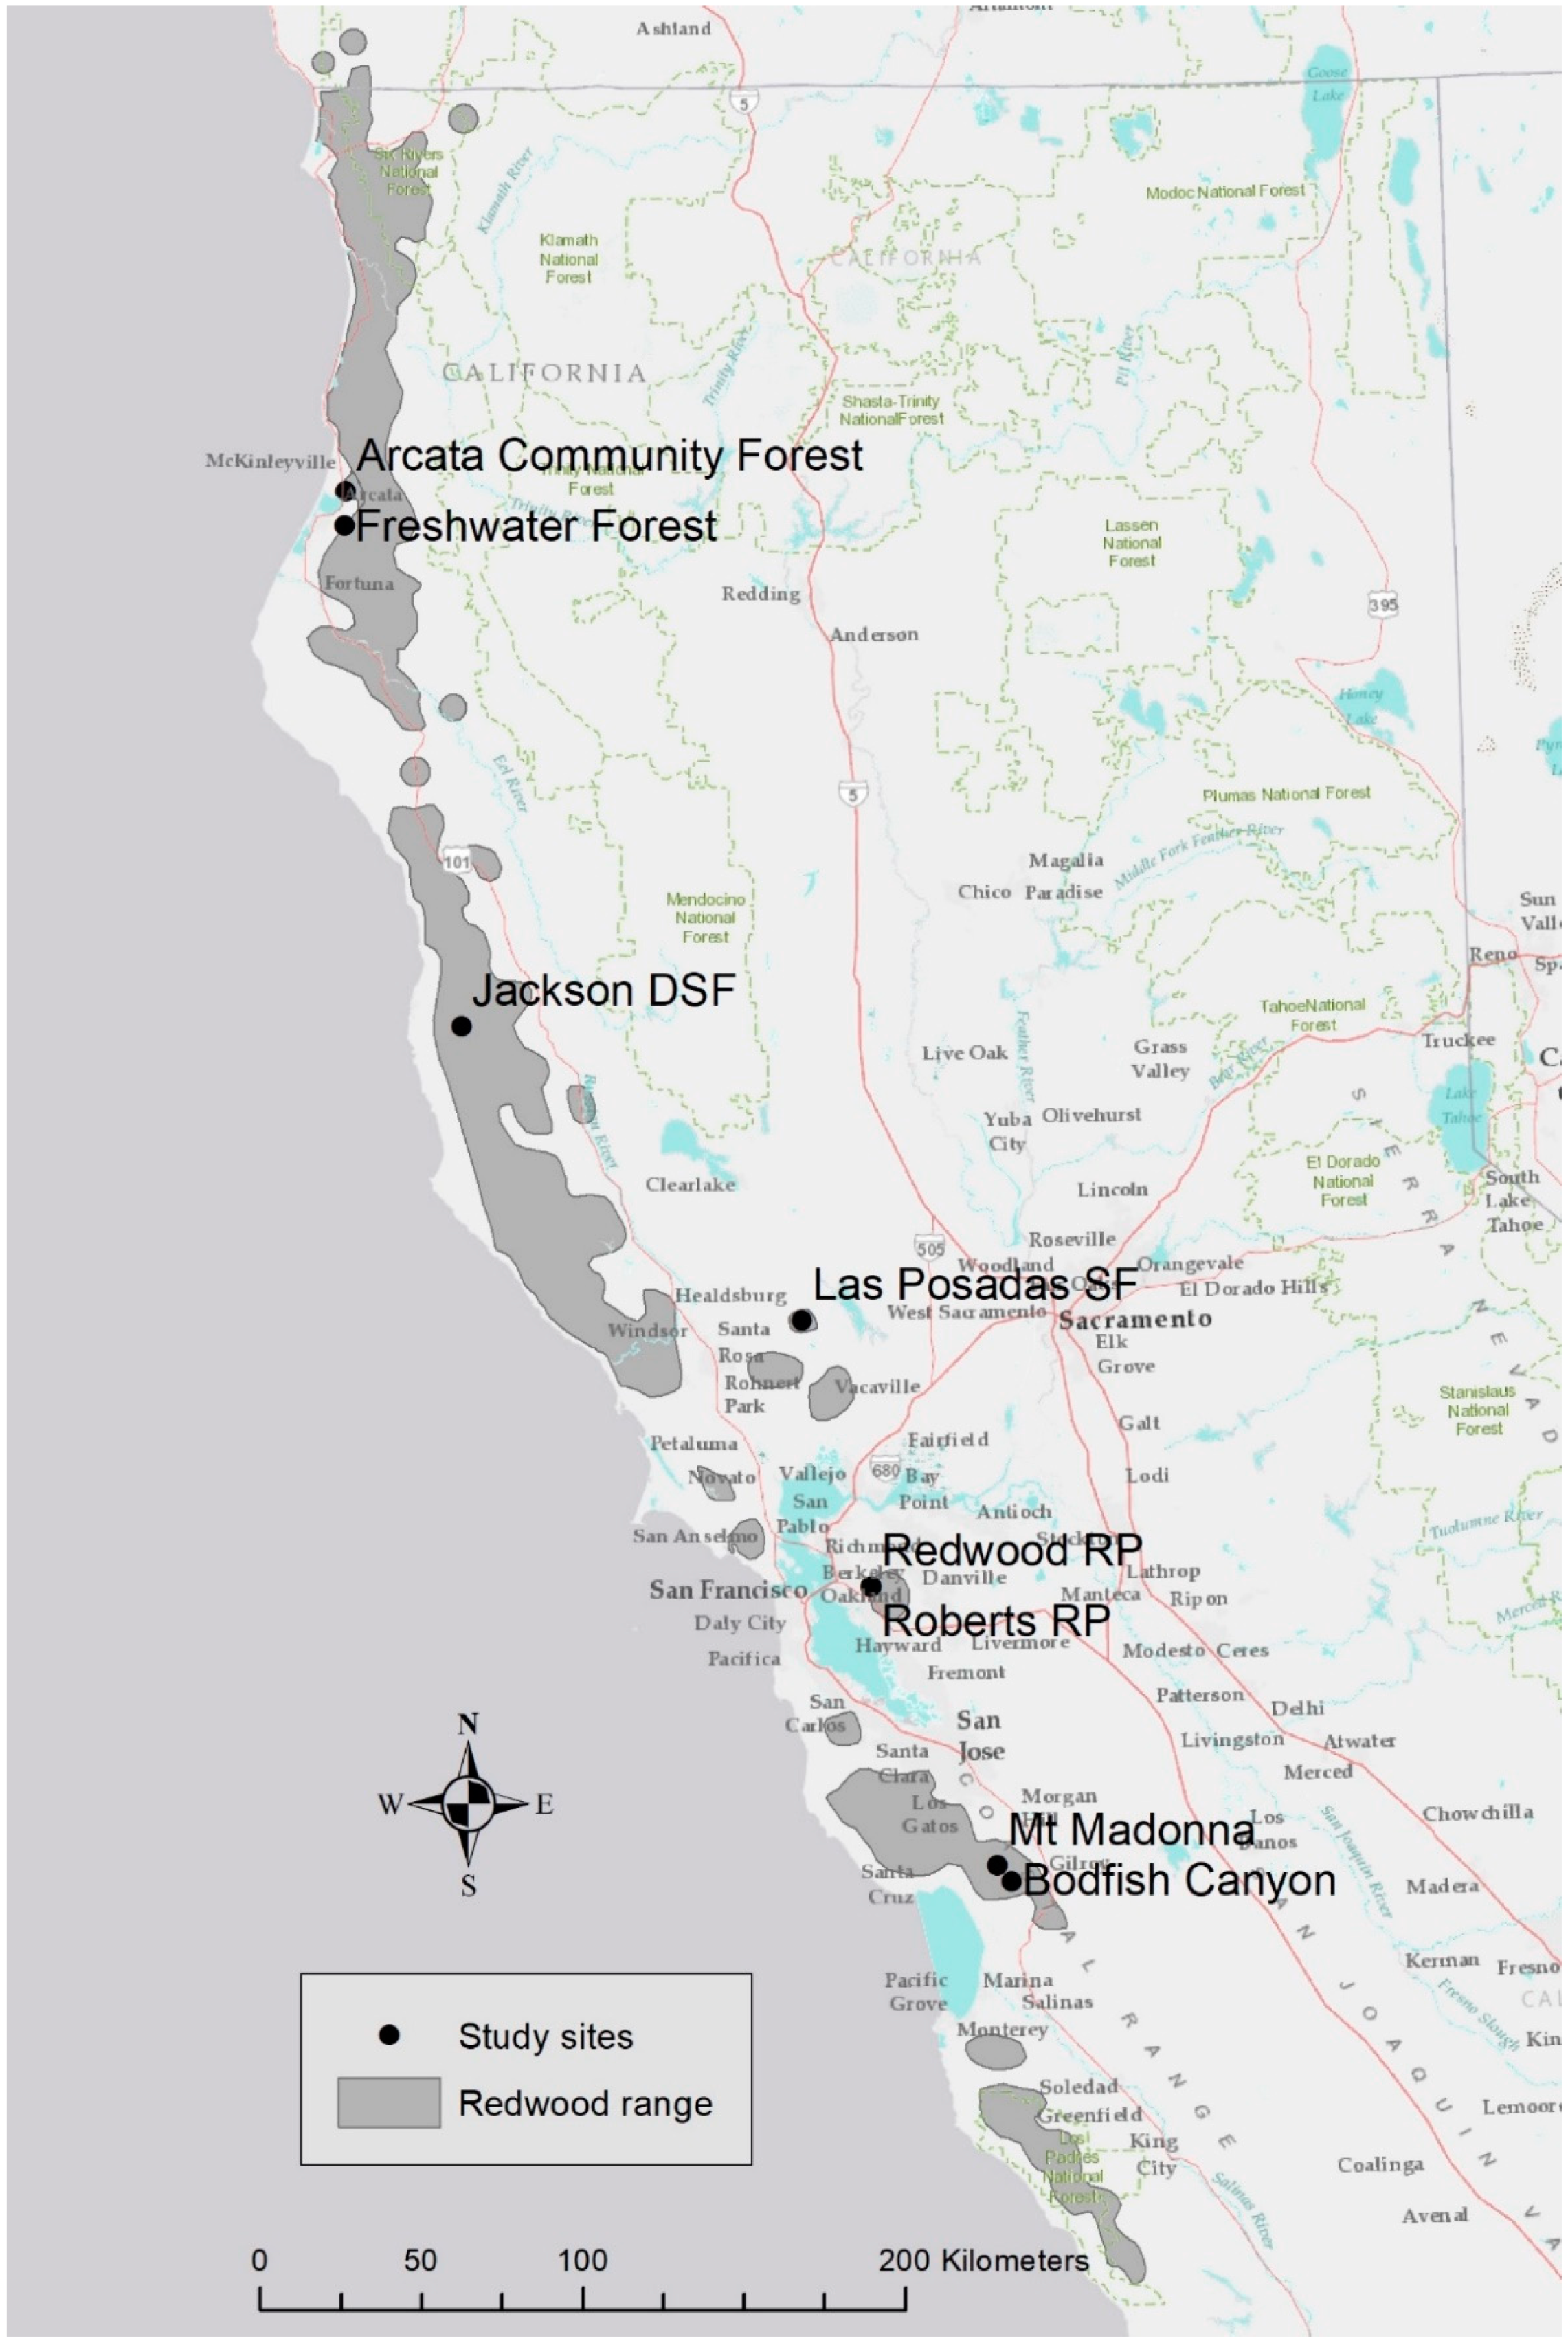
Figure 1.
Study sites and approximate range of redwood in northern California and southern Oregon.
Figure 1.
Study sites and approximate range of redwood in northern California and southern Oregon.
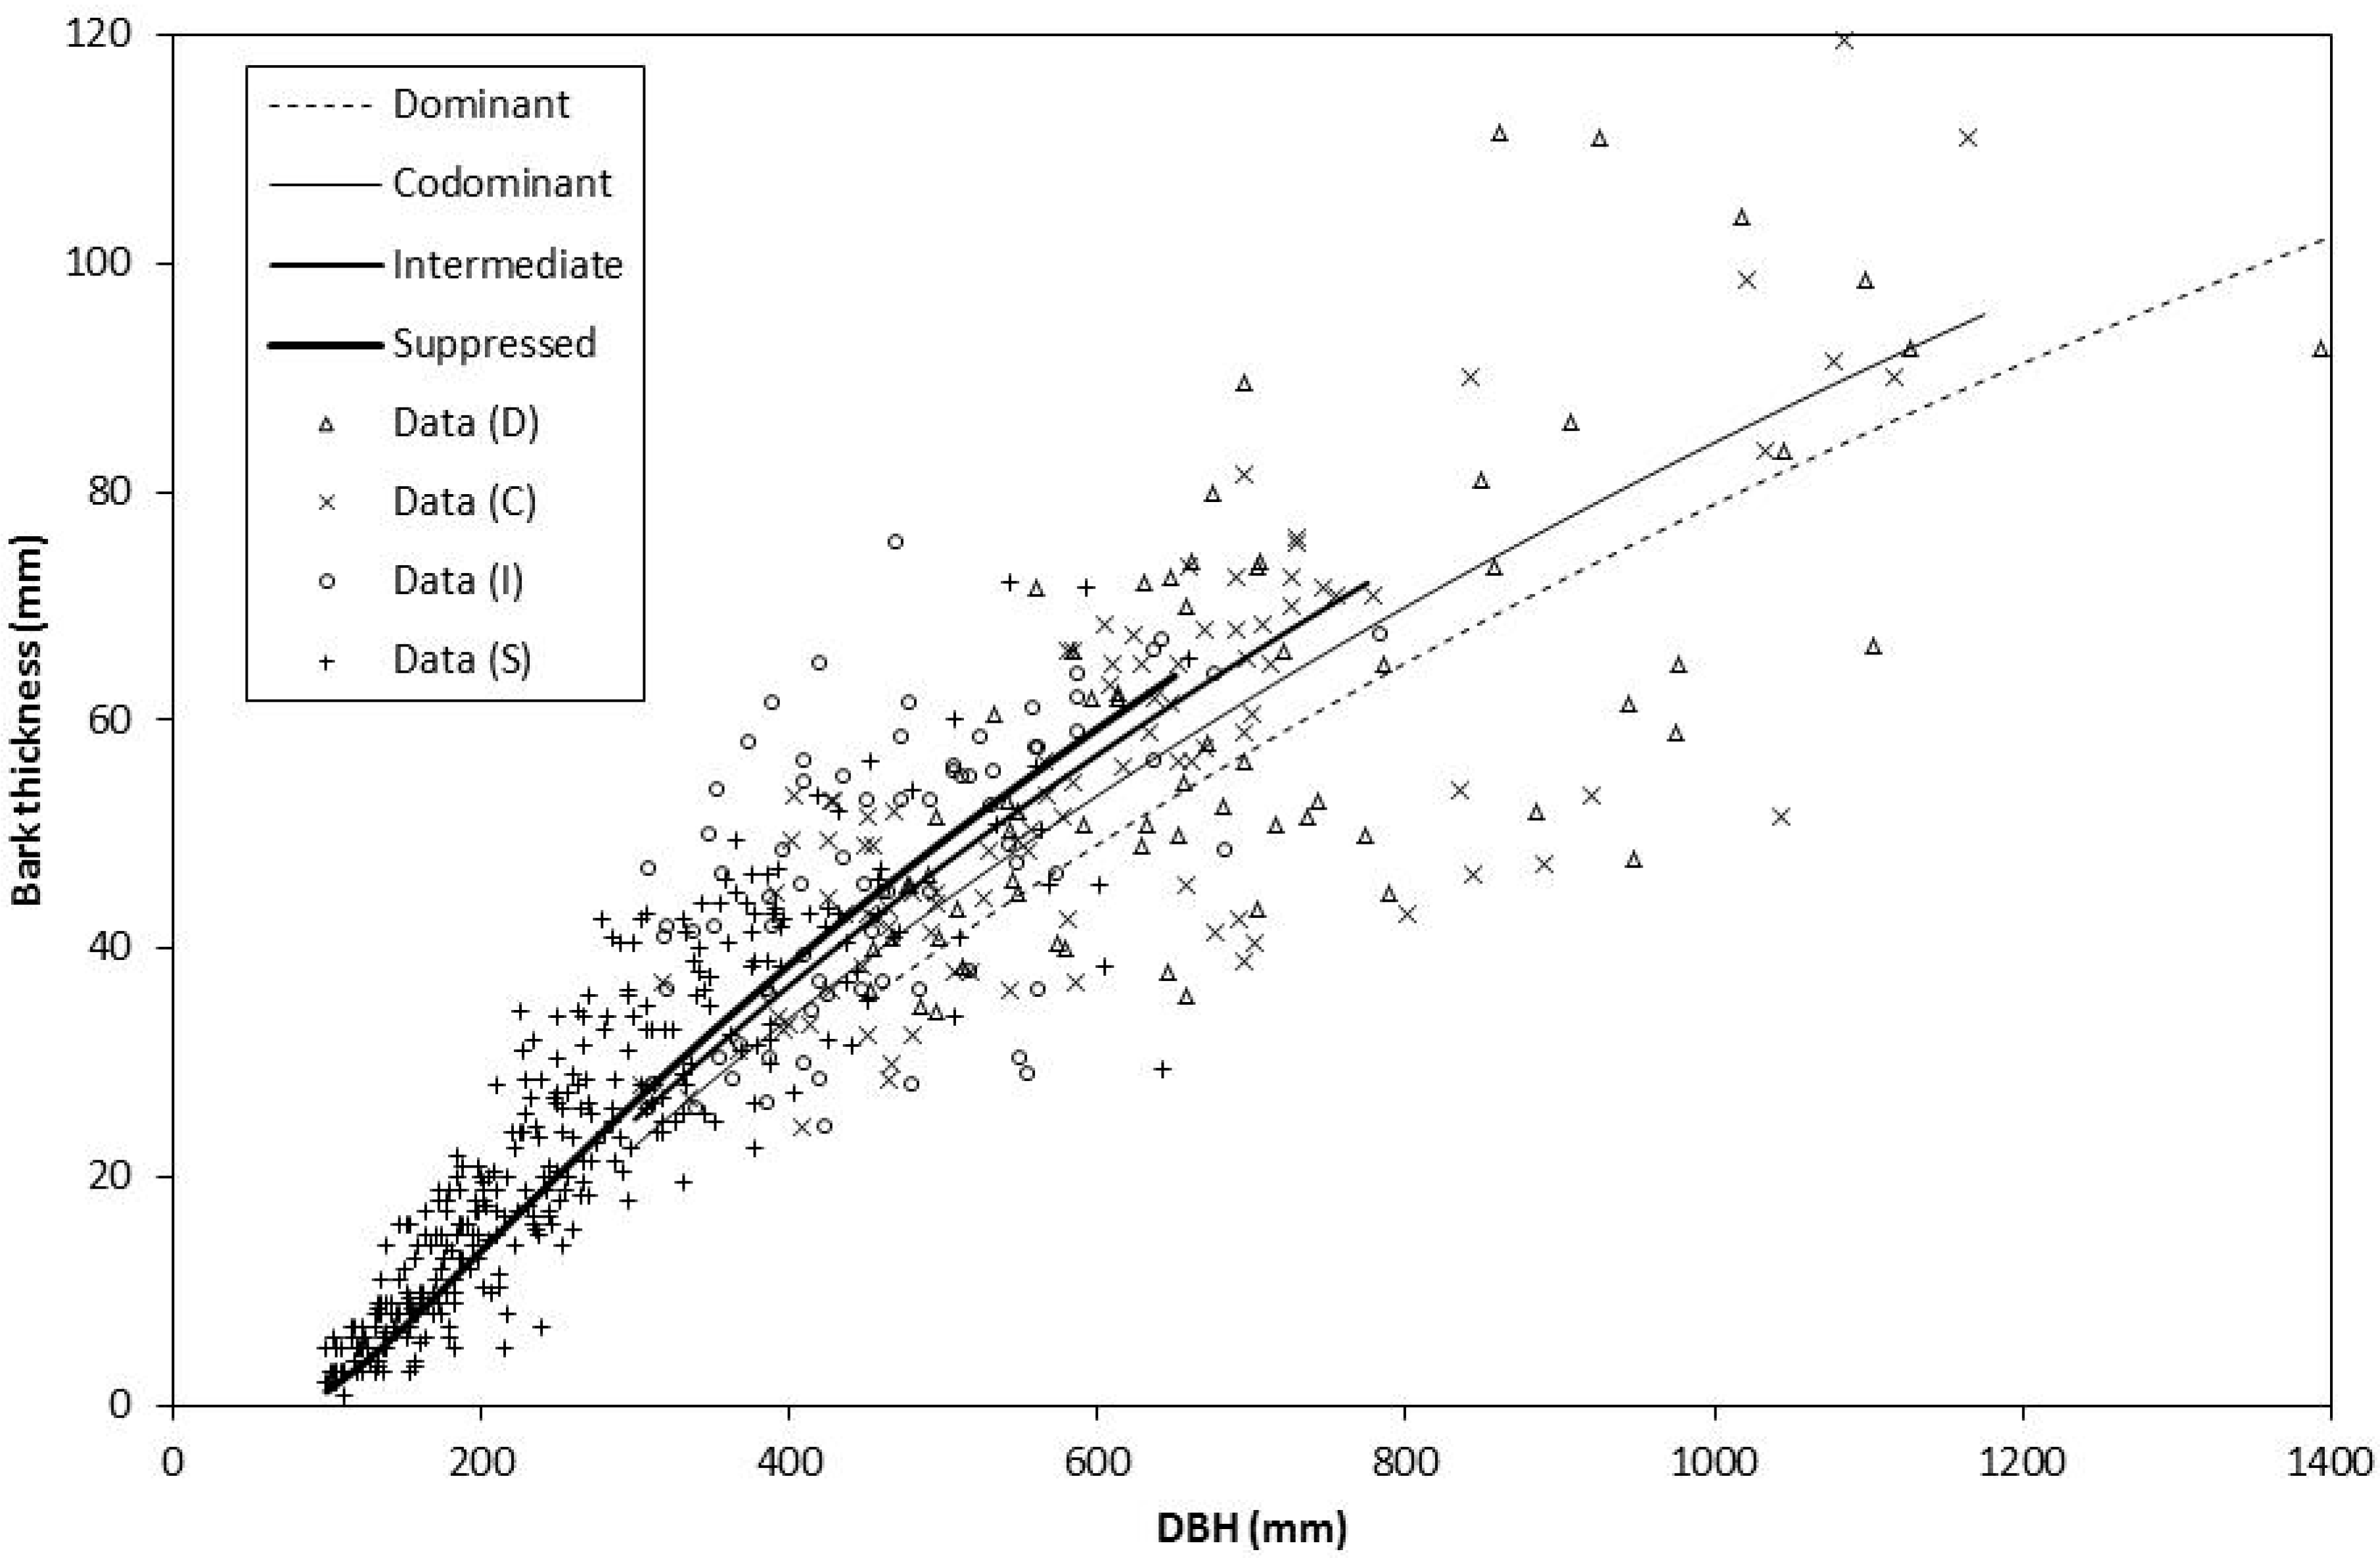
Figure 2.
Redwood bark thickness data and linear mixed-effects model predictions for each crown class at age 85 years in three even-aged stands in Jackson Demonstration State Forest.
Figure 2.
Redwood bark thickness data and linear mixed-effects model predictions for each crown class at age 85 years in three even-aged stands in Jackson Demonstration State Forest.
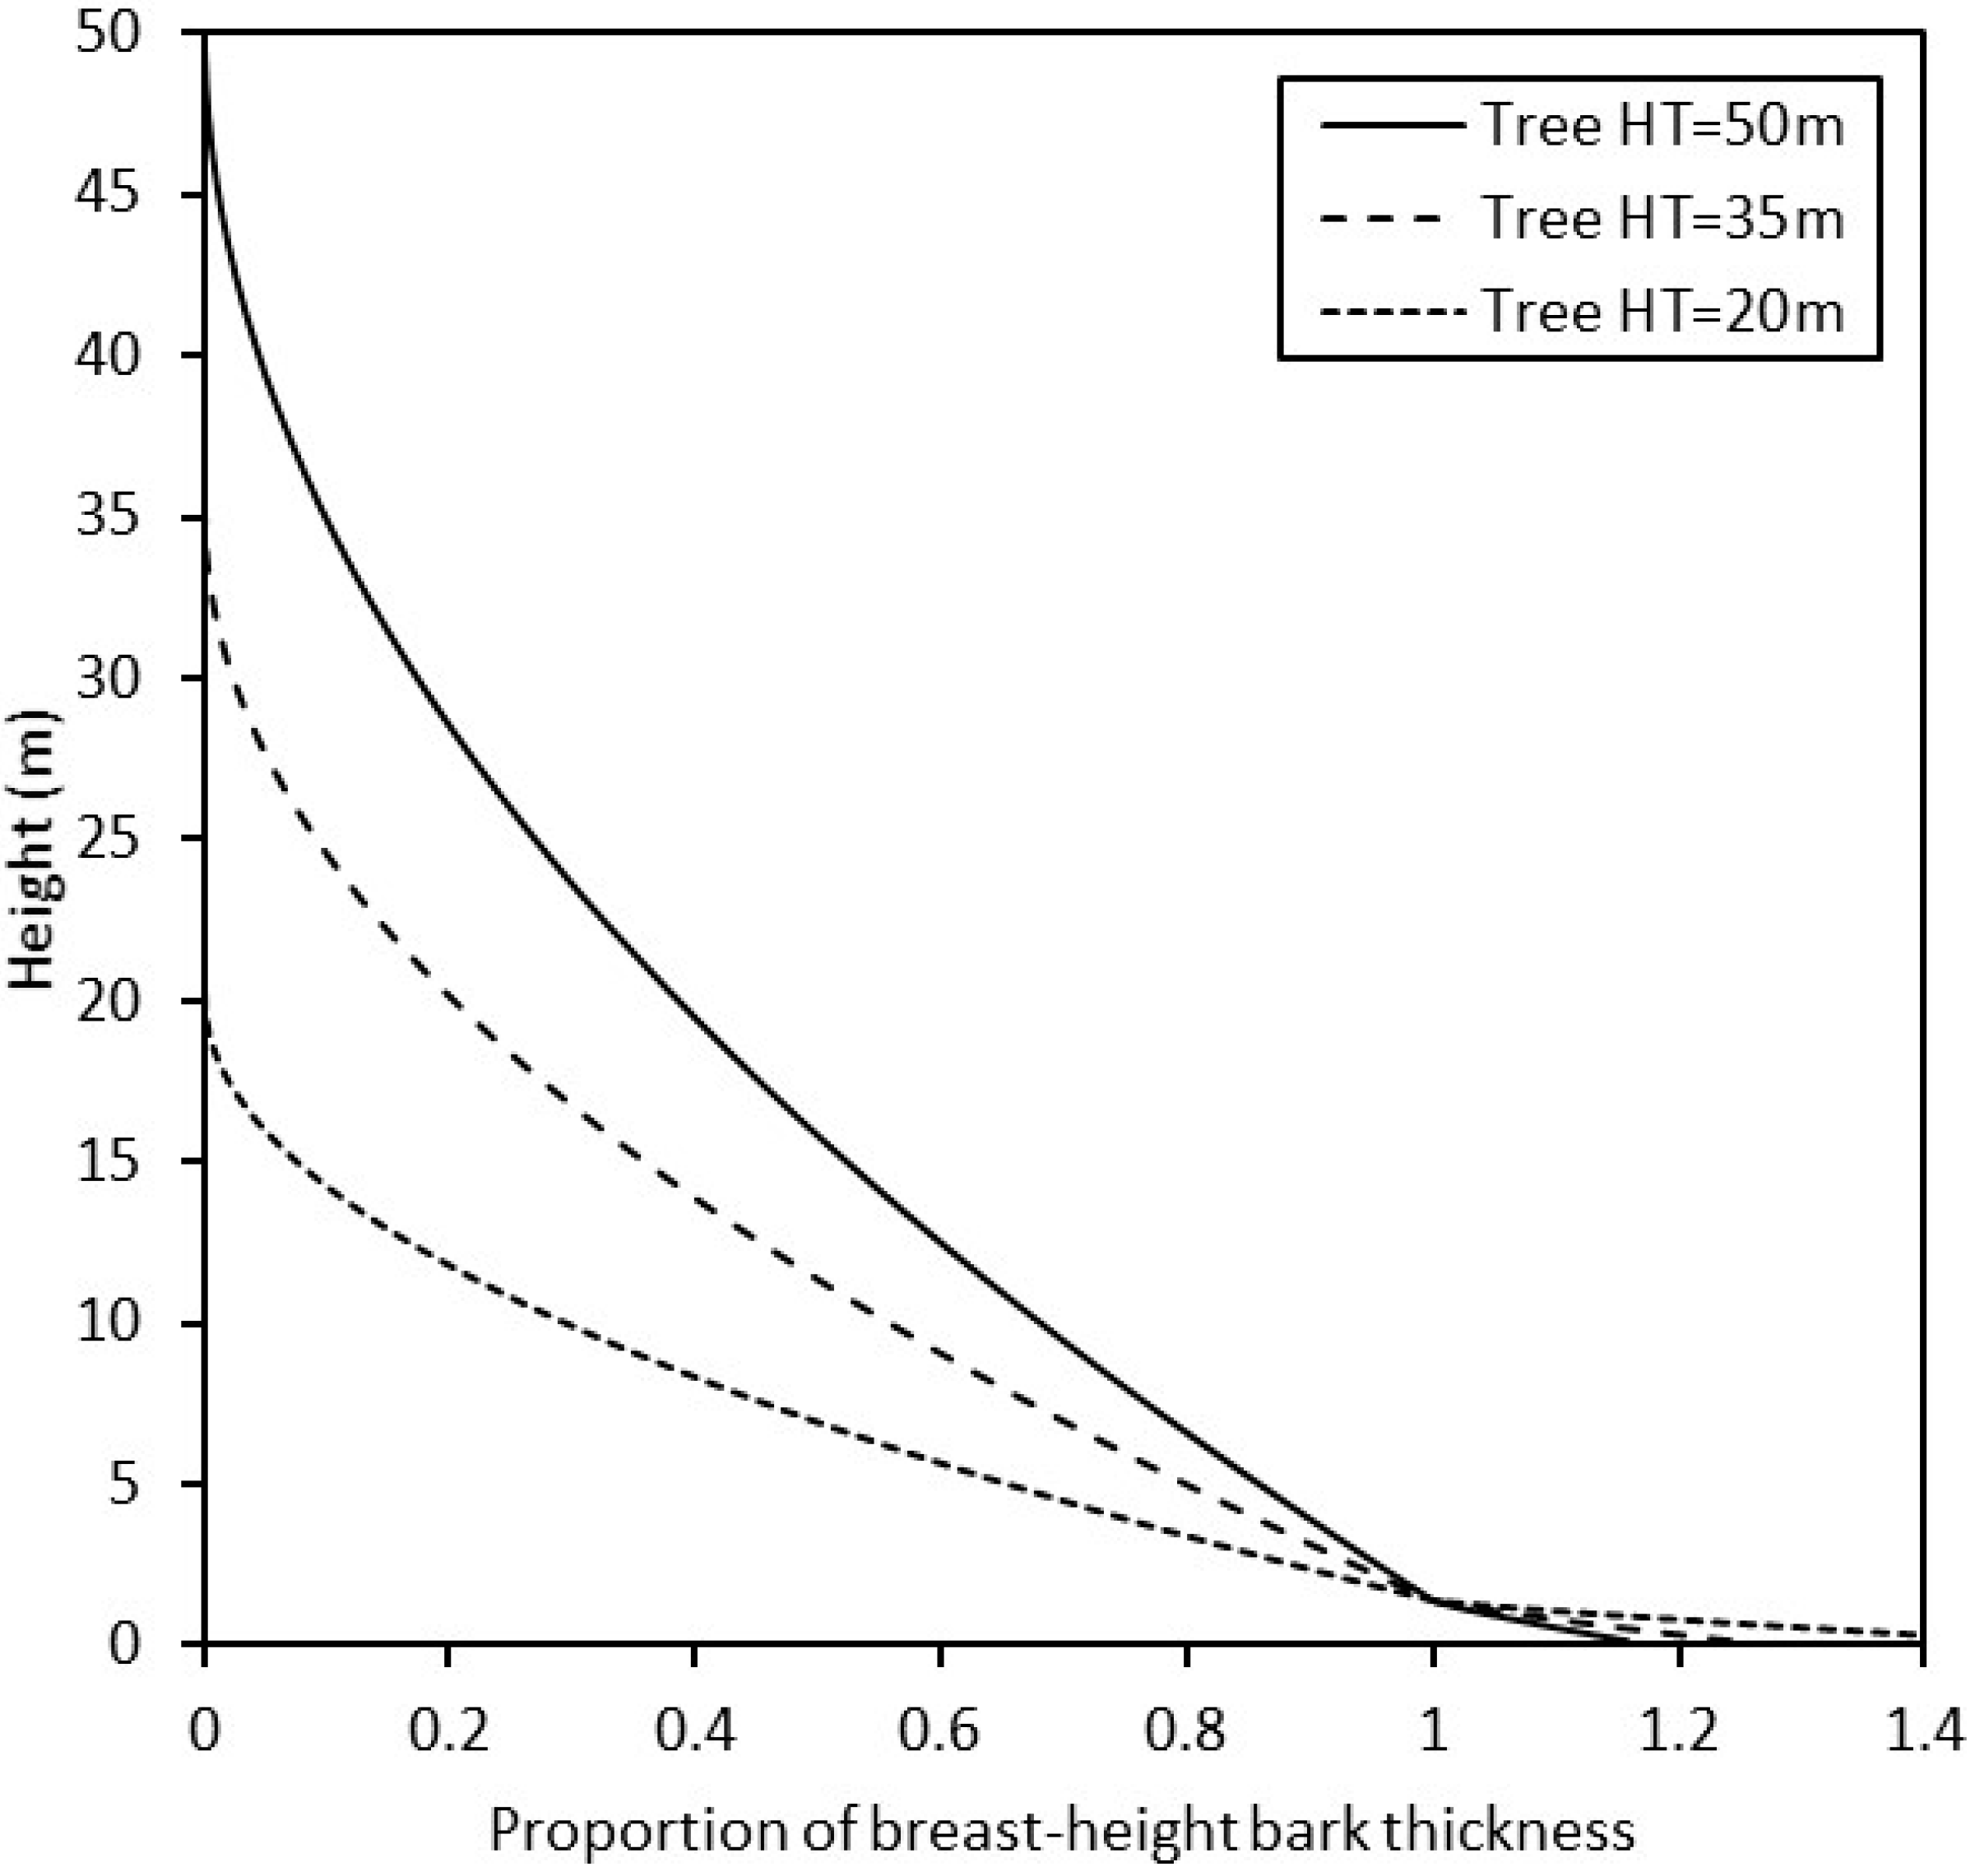
Figure 3.
Modeled bark thickness (BT) tapering above and below the breast height (1.37 m) for three redwood trees of different heights: 50 m, 35 m, and 20 m total height.
Figure 3.
Modeled bark thickness (BT) tapering above and below the breast height (1.37 m) for three redwood trees of different heights: 50 m, 35 m, and 20 m total height.
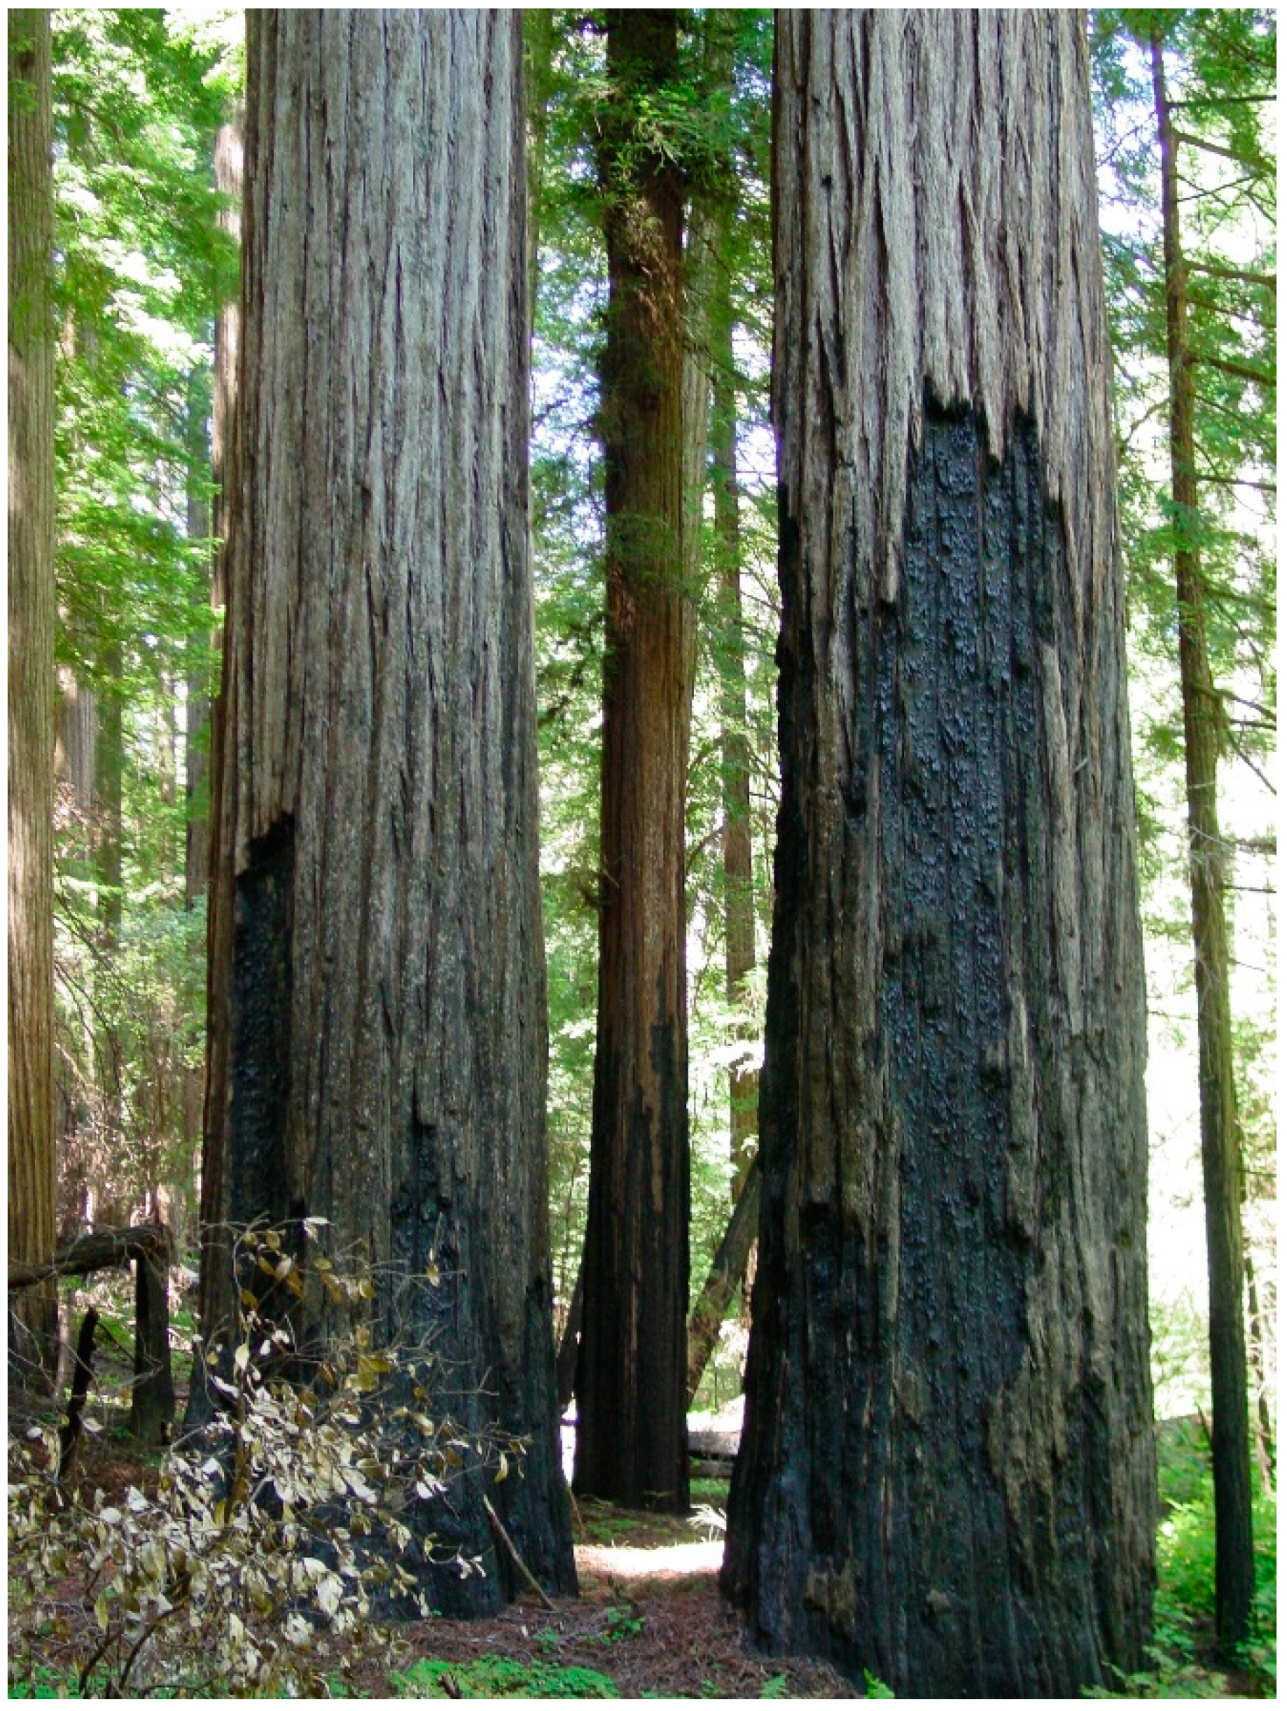
Figure 4.
Bark of old redwood trees partially consumed by wildfire.
Figure 4.
Bark of old redwood trees partially consumed by wildfire.
Table 1.
Redwood bark thickness study site location information.
Table 1.
Redwood bark thickness study site location information.
| Site | County | Latitude | Longitude | Elevation (m) |
|---|
| Arcata Community Forest | Humboldt | 40.872169 | −124.070013 | 100 |
| Freshwater Forest | Humboldt | 40.776107 | −124.072185 | 27 |
| Jackson Demonstration State F. | Mendocino | 39.380276 | −123.631004 | 229 |
| Las Posadas State Forest | Napa | 38.559367 | −122.410412 | 404 |
| Roberts Regional Park | Alameda | 37.813329 | −122.175263 | 444 |
| Redwood Regional Park | Alameda | 37.814919 | −122.171610 | 447 |
| Mt. Madonna | Santa Clara | 37.030449 | −121.740942 | 618 |
| Bodfish Canyon | Santa Clara | 36.984844 | −121.692426 | 399 |
Table 2.
Summary data for 0.2 ha plot in three even-aged stands at age 85–100 years in the Jackson Demonstration State Forest.
Table 2.
Summary data for 0.2 ha plot in three even-aged stands at age 85–100 years in the Jackson Demonstration State Forest.
| | Stand 1 | Stand 2 | Stand 3 |
|---|
| Position on slope | Ridge | Gully | Upslope |
| Age | 85 | 100 | 85 |
| Area (ha) | 0.2 | 0.2 | 0.2 |
| Number of trees sampled | 263 | 78 | 230 |
| Density (stems/ha) | 1315 | 390 | 1150 |
| Average DBH (mm) | 332 | 610 | 398 |
| Maximum DBH (mm) | 926 | 1394 | 1127 |
| Maximum height (m) | 44.6 | 63.8 | 50.1 |
| Basal area (m2 ha−1) | 144.7 | 142.0 | 179.0 |
| Stemwood volume (m3 ha−1) | 1286 | 2126 | 1961 |
Table 3.
Summary data for redwood trees in each crown class in three even-aged stands at age 85–100 years in Jackson Demonstration State Forest.
Table 3.
Summary data for redwood trees in each crown class in three even-aged stands at age 85–100 years in Jackson Demonstration State Forest.
| Variable | Crown Class | n | Mean | s.d. | Min. | Max. |
|---|
| Bark thickness (mm) | All trees | 571 | 35.59 | 22.06 | 1.00 | 119.50 |
| Dominant | 67 | 60.05 | 18.87 | 34.50 | 111.50 |
| Codominant | 100 | 54.34 | 17.90 | 24.50 | 119.50 |
| Intermediate | 78 | 46.40 | 12.32 | 24.50 | 75.50 |
| Suppressed | 326 | 22.23 | 14.47 | 1.00 | 72.00 |
| DBH (mm) | All trees | 571 | 396.69 | 224.55 | 100.00 | 1394.00 |
| Dominant | 67 | 700.90 | 196.33 | 453.00 | 1394.00 |
| Codominant | 100 | 609.56 | 185.89 | 305.00 | 1165.00 |
| Intermediate | 78 | 461.92 | 99.55 | 310.00 | 784.00 |
| Suppressed | 326 | 253.26 | 114.26 | 100.00 | 660.00 |
| Crown ratio | All trees | 571 | 0.31 | 0.10 | 0.01 | 0.69 |
| Dominant | 67 | 0.38 | 0.08 | 0.19 | 0.60 |
| Codominant | 100 | 0.37 | 0.08 | 0.20 | 0.64 |
| Intermediate | 78 | 0.31 | 0.08 | 0.15 | 0.53 |
| Suppressed | 326 | 0.28 | 0.10 | 0.01 | 0.69 |
| Height:diameter ratio | All trees | 571 | 0.83 | 0.19 | 0.32 | 1.45 |
| Dominant | 67 | 0.66 | 0.11 | 0.35 | 0.87 |
| Codominant | 100 | 0.70 | 0.11 | 0.49 | 1.05 |
| Intermediate | 78 | 0.79 | 0.11 | 0.44 | 1.05 |
| Suppressed | 326 | 0.91 | 0.19 | 0.32 | 1.45 |
Table 4.
Comparing candidate even-aged redwood bark thickness (BT) models. Generalized linear mixed-effects models for square-root transformed BT (mm) as a function of candidate fixed effects: DBH, height:diameter ratio (HD), crown ratio (CR), crown class (CC), and a unique sprout clump identifier (CloneID) included in every model as either a fixed or a random effect. Models fitted to redwood tree data (n = 571) for three even-aged stands at age 85 years in Jackson Demonstration State Forest.
| Candidate Models | AIC | ΔAIC |
|---|
| BT0.5 = β0 + β1LnDBH + β2CClass + β3CloneID | 980.04 | - |
| BT0.5 = β0 + β1LnDBH + β2CR + β3LnDBH × CR+ β4CC | 1121.42 | 141.38 |
| BT0.5 = β0 + β1LnDBH + β2CClass | 1121.69 | 141.65 |
| BT0.5 = β0 + β1LnDBH + β2CR + β3CClass | 1121.73 | 141.69 |
| BT0.5 = β0 + β1LnDBH + β2HD + β3CClass | 1121.97 | 141.93 |
| BT0.5 = β0 + β1LnDBH + β2HD + β3LnDBH × HD + β4CC | 1123.00 | 142.96 |
| BT0.5 = β0 + β1LnDBH + β2CR + β3LnDBH × CR | 1146.24 | 166.20 |
| BT0.5 = β0 + β1LnDBH + β2HD + β3LnDBH × HD | 1146.44 | 166.40 |
| BT0.5 = β0 + β1LnDBH | 1149.83 | 169.79 |
Table 5.
Even-aged redwood bark thickness (BT) model. Linear mixed-effects model for square-root transformed BT (mm) in each crown class as a function of DBH (mm) at age 85 years in three even-aged stands in Jackson Demonstration State Forest.
Table 5.
Even-aged redwood bark thickness (BT) model. Linear mixed-effects model for square-root transformed BT (mm) in each crown class as a function of DBH (mm) at age 85 years in three even-aged stands in Jackson Demonstration State Forest.
| Effect | Variable | Estimate | s.e. | DF | t Value | Pr > |t| |
|---|
| Fixed | Intercept | −15.6668 | 0.5105 | 2 | −30.69 | 0.0011 |
| LnDBH | 3.6526 | 0.0806 | 490 | 45.30 | <0.0001 |
| Dominant | −0.6847 | 0.1170 | 490 | −5.85 | <0.0001 |
| Codominant | −0.3876 | 0.1007 | 490 | −3.85 | 0.0001 |
| Intermediate | −0.1497 | 0.0938 | 490 | −1.60 | 0.1110 |
| Suppressed | 0 | - | - | - | - |
| Random | Plot | 0.1471 | 0.1520 | | | |
| CloneID | 0.2327 | 0.0589 | | | |
| Residual | 0.3442 | 0.0219 | | | |
Table 6.
Summary data for redwood trees in the northern, central, and southern parts of redwood’s natural range.
Table 6.
Summary data for redwood trees in the northern, central, and southern parts of redwood’s natural range.
| Variable | Region | n | Mean | s.d. | Min. | Max. |
|---|
| DBH (mm) | North | 40 | 791.65 | 211.43 | 487.70 | 1342.00 |
| Central | 195 | 684.03 | 187.81 | 471.00 | 1562.10 |
| South | 25 | 745.24 | 167.58 | 471.00 | 1103.00 |
| Crown ratio | North | 40 | 0.66 | 0.11 | 0.46 | 0.91 |
| Central | 195 | 0.52 | 0.16 | 0.15 | 1.00 |
| South | 25 | 0.58 | 0.14 | 0.36 | 0.89 |
| Bark thickness (mm) | North | 40 | 57.36 | 20.13 | 31.80 | 117.50 |
| Central | 195 | 57.39 | 17.31 | 22.00 | 117.00 |
| South | 25 | 80.58 | 28.79 | 31.50 | 164.00 |
Table 7.
Bark thickness (BT) model for dominant and codominant redwoods in the northern, central, and southern parts of redwood’s natural range (regional model) and for all the data combined (range-wide model). Generalized linear model for the natural log (Ln)-transformed BT (mm) as a function of DBH (mm).
| Model | Variable | Estimate | s.e. | DF | t Value | Pr > |t| | AIC |
|---|
| Regional | Intercept | −0.1846 | 0.418 | 0 | −0.44 | <0.0001 | 31.71 |
| LnDBH | 0.6855 | 0.063 | 256 | 10.88 | <0.0001 | |
| North | −0.3704 | 0.064 | 256 | −5.83 | <0.0001 | |
| Central | −0.2608 | 0.053 | 256 | −4.90 | <0.0001 | |
| South | 0 | - | - | - | - | |
| Range wide | Intercept | −0.4013 | 0.4261 | 0 | −0.94 | <0.0001 | 56.19 |
| LnDBH | 0.6800 | 0.06524 | 258 | 10.42 | <0.0001 | |
Table 8.
Summary data for the redwood trees in even-aged stands versus understory trees in multiaged stands. Data for trees < 400 mm DBH (n = 279) collected in 32 plots sampling even-aged and multiaged stands in Jackson Demonstration State Forest.
Table 8.
Summary data for the redwood trees in even-aged stands versus understory trees in multiaged stands. Data for trees < 400 mm DBH (n = 279) collected in 32 plots sampling even-aged and multiaged stands in Jackson Demonstration State Forest.
| Variable | Stand Structure | n | Mean | s.d. | Min. | Max. |
|---|
| DBH (mm) | Even-aged | 41 | 170.43 | 79.59 | 73.66 | 398.78 |
| Multiaged | 238 | 153.86 | 74.82 | 50.00 | 370.00 |
| Crown ratio | Even-aged | 41 | 0.54 | 0.17 | 0.19 | 0.85 |
| Multiaged | 238 | 0.72 | 0.18 | 0.25 | 0.99 |
| Bark thickness (mm) | Even-aged | 41 | 11.76 | 9.04 | 2.00 | 36.50 |
| Multiaged | 238 | 12.28 | 9.67 | 1.00 | 58.00 |
Table 9.
Comparing candidate redwood bark thickness (BT) models. Generalized linear models for natural log (Ln)-transformed BT (mm) as a function of the candidate predictor variables: DBH, crown ratio (CR), and a dummy variable for redwood trees in even-aged stands versus understory trees in multiaged stands in Jackson Demonstration State Forest.
| Candidate Models | AIC | ΔAIC |
|---|
| LnBT = β0 + β1LnDBH + β2CR + β3Even-aged | 376.13 | - |
| LnBT = β0 + β1LnDBH + β2Even-aged | 381.52 | 5.39 |
| LnBT = β0 + β1LnDBH + β2CR | 383.15 | 7.02 |
| LnBT = β0 + β1LnDBH | 384.16 | 8.03 |
Table 10.
Bark thickness (BT) model for redwood trees in even-aged stands and understory trees in multiaged stands. Generalized linear model for natural log (Ln)-transformed BT (mm) as a function of DBH (mm) and crown ratio.
Table 10.
Bark thickness (BT) model for redwood trees in even-aged stands and understory trees in multiaged stands. Generalized linear model for natural log (Ln)-transformed BT (mm) as a function of DBH (mm) and crown ratio.
| Variable | Estimate | s.e. | DF | t Value | Pr > |t| |
|---|
| Intercept | −4.9977 | 0.2988 | 0 | −16.73 | <0.0001 |
| LnDBH | 1.5192 | 0.0583 | 275 | 26.08 | <0.0001 |
| Crown ratio | −0.4170 | 0.1536 | 275 | −2.72 | 0.0070 |
| Even-aged | −0.2669 | 0.0831 | 275 | −3.21 | 0.0015 |
| Multiaged | 0 | - | - | - | - |
Table 11.
Summary data for redwood trees separated into three canopy layers (strata) in even-aged and multiaged stands. Data for trees with breast-height age data (n = 565) collected in 48 plots sampling even-aged and multiaged stands in Jackson Demonstration State Forest.
Table 11.
Summary data for redwood trees separated into three canopy layers (strata) in even-aged and multiaged stands. Data for trees with breast-height age data (n = 565) collected in 48 plots sampling even-aged and multiaged stands in Jackson Demonstration State Forest.
| Variable | Canopy Stratum | n | Mean | s.d. | Min. | Max. |
|---|
| DBH (mm) | Emergent | 38 | 973.92 | 240.78 | 625.00 | 1562.10 |
| Main canopy | 336 | 442.80 | 206.70 | 58.42 | 1130.30 |
| Understory | 191 | 154.85 | 72.75 | 51.00 | 357.00 |
| Crown ratio | Emergent | 38 | 0.54 | 0.11 | 0.37 | 0.80 |
| Main canopy | 336 | 0.51 | 0.18 | 0.14 | 1.00 |
| Understory | 191 | 0.70 | 0.19 | 0.21 | 0.99 |
| Tree age (years) | Emergent | 38 | 98.08 | 12.45 | 60.00 | 131.00 |
| Main canopy | 336 | 61.51 | 23.98 | 13.00 | 130.00 |
| Understory | 191 | 28.83 | 17.42 | 6.00 | 100.00 |
| Bark thickness (mm) | Emergent | 38 | 67.89 | 15.85 | 36.00 | 117.00 |
| Main canopy | 336 | 40.22 | 19.19 | 3.00 | 109.00 |
| Understory | 191 | 12.36 | 9.90 | 1.00 | 58.00 |
Table 12.
Comparing candidate multiaged redwood bark thickness (BT) models. Generalized linear models for square root-transformed BT (mm) as a function of the candidate predictor variables: DBH, crown ratio (CR), breast-height age (years) and the categorical variables for redwood trees in the different canopy strata and in even-aged stands versus multiaged stands in Jackson Demonstration State Forest.
| Candidate Models | AIC | ΔAIC |
|---|
| BT0.5 = β0 + β1LnDBH + β2CR + β3Age0.5 | 1337.60 | - |
| BT0.5 = β0 + β1LnDBH + β2CR | 1337.90 | 0.30 |
| BT0.5 = β0 + β1LnDBH + β2CR + β3Age0.5 + β4Stratum | 1338.85 | 1.25 |
| BT0.5 = β0 + β1LnDBH + β2CR + β3Stratum | 1340.26 | 2.66 |
| BT0.5 = β0 + β1LnDBH | 1361.80 | 24.20 |
Table 13.
Bark thickness (BT) models for redwood trees in multiaged stands. Generalized linear model for the square root-transformed BT (mm) as a function of DBH (mm) and crown ratio, with and without breast-height age (years).
Table 13.
Bark thickness (BT) models for redwood trees in multiaged stands. Generalized linear model for the square root-transformed BT (mm) as a function of DBH (mm) and crown ratio, with and without breast-height age (years).
| Model | Variable | Estimate | s.e. | DF | t Value | Pr > |t| | AIC |
|---|
| Age effect | Intercept | −8.6640 | 0.3059 | 0 | −28.32 | <0.0001 | 1337.60 |
| LnDBH | 2.4423 | 0.0713 | 561 | 34.26 | <0.0001 | |
| CR | −0.6628 | 0.1919 | 561 | −3.45 | 0.0006 | |
| Age0.5 | 0.0675 | 0.0285 | 561 | 2.36 | 0.0184 | |
| Without age | Intercept | −8.8130 | 0.3005 | 0 | −29.32 | <0.0001 | 1337.90 |
| LnDBH | 2.5726 | 0.0454 | 562 | 56.68 | <0.0001 | |
| CR | −0.8729 | 0.1707 | 562 | −5.11 | <0.0001 | |
Table 14.
Summary data for DBH and the breast-height bark thickness (BT) of redwood trees sampled for bark tapering (BT at various heights) at Arcata Community Forest, Humboldt County, California.
Table 14.
Summary data for DBH and the breast-height bark thickness (BT) of redwood trees sampled for bark tapering (BT at various heights) at Arcata Community Forest, Humboldt County, California.
| Variable | n | Mean | s.d. | Min. | Max. |
|---|
| DBH (mm) | 31 | 703.79 | 288.27 | 182.90 | 1342.00 |
| Bark thickness (mm) | 31 | 48.86 | 24.15 | 10.20 | 110.50 |


