Article

Predicting the Potential Global Geographical Distribution of Two Icerya Species under Climate Change

Sino-France Joint Laboratory for Invasive Forest Pests in Eurasia, Beijing Forestry University, Beijing 100083, China
*
Author to whom correspondence should be addressed.
Forests 2020, 11(6), 684; https://doi.org/10.3390/f11060684
Submission received: 28 April 2020 / Revised: 13 June 2020 / Accepted: 14 June 2020 / Published: 17 June 2020
(This article belongs to the Special Issue Control and Management of Invasive Species in Forest Ecosystems)

Abstract

:
Climate change is predicted to alter the geographic distribution of a wide variety of taxa, including insects. Icerya aegyptiaca (Douglas) and I. purchasi Maskell are two polyphagous and invasive pests in the genus Icerya Signoret (Hemiptera: Monophlebidae) and cause serious damage to many landscape and economic trees. However, the global habitats suitable for these two Icerya species are unclear. The purpose of this study is to determine the potentially suitable habitats of these two species, then to provide scientific management strategies. Using MaxEnt software, the potential risk maps of I. aegyptiaca and I. purchasi were created based on their occurrence data under different climatic conditions and topology factors. The results suggested that under current climate conditions, the potentially habitable area of I. aegyptiaca would be much larger than the current distribution and there would be small changes for I. purchasi. In the future climate change scenarios, the suitable habitats of these two insect species will display an increasing trend. Africa, South America and Asia would be more suitable for I. aegyptiaca. South America, Asia and Europe would be more suitable for I. purchasi. Moreover, most of the highly habitat suitability areas of I. aegyptiaca will become concentrated in Southern Asia. The results also suggested that “min temperature of coldest month” was the most important environmental factor affecting the prediction models of these two insects. This research provides a theoretical reference framework for developing policies to manage and control these two invasive pests of the genus Icerya.

1. Introduction

Due to human activities and globalization, the speed of biologic invasion has been accelerated, leading to the homogenization of biodiversity [1]. Invasive species threaten local ecosystems by competing with native species and endangering local species and human management systems such as those related to agriculture, animal health and forestry [2,3,4,5]. Despite efforts to prevent new intrusions over the past few decades, the record data collected from the 16th century to the present day has not shown any signs of stopping. On the contrary, the invasion speed of most taxa groups increases with time. Insects illustrate this worldwide pattern of biologic invasion [6]. From the 20th century, the first, recorded rate of insect invasions has been steadily rising and remained at a high level, probably due to the global trade and the spread of host plants [7]. Global cost associated with invasive insects was estimated at US$77 billion per year equivalent to the combined cost for all goods and services and health [8].
To date, the increase in yearly invasive rates indicates the need for additional preventive measures, especially for highly invasive groups [9]. Identifying species with high transmission potential, determining their significant environmental and economic damages and predicting their potential distributions are the necessary steps for the development of prevention policies [6].
Climate is the main factor affecting the distribution of insects [10,11]. In recent years, the impact of climate on pests and host species has been significant [12], which greatly correlates with distribution, physiology, phenology, genetics and behavior of many invasive species [13]. The “climate change” refers to both global and regional climate changes over time. This is an important concept in the study of organism distribution, especially in the case of insects, which are classified as ectotherms [14]. As certain areas become warm, cold, humid or dry, they may be more suitable for specific pests and hosts. For example, rising temperatures can significantly accelerate the maturation of many insect species, affecting their life cycle length, reproductive capacity and ability to migrate [13]. Therefore, the geographical distribution of a species depends mainly on the climate. Defining the potential distribution changes caused by climate change is an important reference for the management and control of alien species [15].
The genus Icerya Signoret (Hemiptera: Monophlebidae) includes 37 species widely distributed in the world [16]. The main feature of these insects is that the female adult secretes an egg bag when it matures [17]. Many Icerya species are polyphagous and feed on economically important fruit trees and landscape plants across the world [18]. These make them potential invaders with a high risk of causing economic damage in the invaded areas. Icerya species mainly suck plant juice with the piercing sucking mouthparts of female adults and nymphs, causing yellow leaves, withered shoots, deciduous leaves and fruits and weakening tree vigor. They also excrete honeydew which induces sooty blotch, covers leaf surface and affects photosynthesis and ornamental value [19].
The Egyptian icerya Icerya aegyptiaca (Douglas) and the cottony cushion scale I. purchasi Maskell are among most important Icerya species with powerful invasiveness. They are pests of several ornamentals and crops, such as Citrus reticulata, Artocarpus heterophyllus, Magnolia denudate, Ficus altissima and Pittosporum tobira. In the 1980s, I. aegyptiaca was listed as one of the dangerous garden pests in Guangzhou, China [20,21,22,23]. Unruh & Gullan suggested that I. aegyptiaca is native to either the Australasian or the Indo–Malayan biogeographic regions [24]. I. aegyptiaca invaded Taiwan, China in 1908 and subsequently invaded mainland China. It is now a pest of garden plants and widely distributed in tropical and subtropical regions [25,26]. I. purchasi is native to Australia or New Zealand [27]. It has been accidentally introduced into other countries and is now distributed in 126 countries around the world [16]. I. purchasi was introduced into California (US) on Acacia plants around 1868 or 1869, and has since caused enormous damages to citrus groves in southern California, to the Rosmarinus officinalis plants in Greece and to the Pittosporum tobira in China [25,28].
In recent years, the ecological niche models (ENMs) have been widely used to simulate the distribution of insect species [29]. The main concept is to use known distribution data, relevant environmental variables and certain algorithms to estimate the ecological needs and the distribution of the species, and then project the results to different spatial and temporal ranges to predict potential distribution of the species [30]. These models include ANUCLIM/BIOCLIM, CLIMATE, CLIMEX, DOMAIN, GARP, HABITAT [31,32,33] and MaxEnt. The MaxEnt model has been identified as the best predictive method when only presence data are available [34] and shown to work well even when the amount of training data are limited [33,34,35]. It has been widely used to predict the potential distribution of invasive species. Ramos et al. used MaxEnt software to predict the global potential habitats of the whitefly Bemisia tabaci in current climate and future climate, and showed that the range of the whitefly in the future climate was larger than that in the current climate [36]. In the study on the suitable area of scale insects, Wei et al. used MaxEnt software to predict the suitable areas of the cycad aulacaspis scale insect (CAS), Aulacaspis yasumatsui under global scale, and showed that the highly suitable area of CAS was concentrated in southern Asia [37]. These studies have demonstrated the feasibility and accuracy of MaxEnt software in predicting the potential areas of invasive insects.
The aim of this study was to improve the monitoring of the outbreak and spread of I. aegyptiaca and I. purchasi for early control. Thus, the current and future potential distributions of I. aegyptiaca and I. purchasi were estimated based on available occurrence data using the MaxEnt software. We identified the main climatic variables that limit the potential distribution of these two scale insects and predicted the trends of their suitable habitat range under different climatic change scenarios. Our results provide a theoretical reference framework for the development of policies to manage and control these two invasive pests.

2. Materials and Methods

2.1. Application Software

MaxEnt software (Version 3.4.1) was downloaded from https://biodiversityinformatics.amnh.org/opensource/maxent/. ArcGIS software (Version 10.2) was from ESRI, Redlands, CA, USA. (http://www.esri.com/). Java software (Version 10.0.1) was installed from http://www.oracle.com/technetwork/java/javase/overview/index.html. DIVA-GIS (Version 7.5.0.0) was from https://www.java.com/zh_CN/. niche analyst (Version 3.0) was from http://nichea.sourceforge.net/. R (Version 3.6.1) was from https://www.r-project.org/.

2.2. Species Occurrence Data

The occurrence data of I. aegyptiaca and I. purchasi were compiled from three sources: (1) The occurrence data recorded in the globally published papers (I. aegyptiaca [22,27,38,39,40], I. purchasi [41,42,43]). Google Earth was used to obtain the geographic coordinates of the records when the locality names were provided in the literature; (2) The distribution data recorded by Global Biodiversity Information Facility (GBIF, https://www.gbif.org/), the Center for Agriculture and Bioscience International (CABI, https://www.cabi.org/), Taiwan Biodiversity Information Facility (http://taibif.tw/en), China Forestry Network (http://www.forestry.gov.cn/); (3) Occurrence data provided by the Forestry Department of China and on-the-spot investigation by our research group. We preliminarily screened the collected occurrence data to remove the occurrence data from greenhouse environment and enclosed buildings, only outdoor occurrence data were retained. Occurrence records tend to be in the areas that are easy to aggregate, such as near cities or other areas with high population density [44], so occurrence data can significantly affect the modeling results [45]. In order to reduce sampling deviation and eliminate spatial autocorrelation, a coarse resolution (9 km × 9 km) was created using the workflow of Li, Du & Guo [46] and a single point was randomly selected from each grid containing one or more sampling points. This part of work was completed by ArcGIS 10.2 software [47]. Overall, 46 and 167 unique presence records of I. aegyptiaca and I. purchasi were collected, respectively.

2.3. Environmental Variables

In this study, 19 bioclimatic environmental variables with effects on the growth and distribution of plants and animals were downloaded from the WorldClim Global Climate Database (http://www.worldclim.org) (Table 1). Too many environmental variables tend to increase the dimension of the ecological space, which is not conducive to the prediction of a given model. Thus, we first used the multivariate tool in spatial analyst tools from the ArcToolbox of ArcGIS software and executed the band collection statistics command to perform the multi-collinearity analysis on each bioclimatic environmental variable layer. Then, the correlation matrix was obtained. The correlation matrix shows the values of the correlation coefficients that depict the relationship between two dataset layers and range from +1 to −1. A positive correlation indicates a direct relationship between two layers, such as when the cell values of one-layer increase, the cell values of another layer are also likely to increase. A negative correlation means that one variable inversely influences the other. A correlation of zero means that two layers are independent of each other. In this study, if the absolute value of the correlation between two variables is >0.8, then only one of the variables was selected. Second, the relative importance of each variable’s contribution was assessed by sequential variable removal using Jack’s knife of the MaxEnt software. In order to avoid the inaccuracy caused by the spatial autocorrelation between the training data and the testing data, we selected 25% of the occurrence data as independent data for model accuracy test. Finally, five bioclimatic environmental variables for I. aegyptiaca were selected, namely bio2, bio6, bio8, bio13 and bio18; and five bioclimatic environmental variables for I. purchasi were selected as bio5, bio6, bio8, bio13 and bio19 (Table 1).
Given the uncertainties of future climate scenarios, impact assessments were incorporated with the data from a range of climate models that can effectively simulate the historical climate of various regions of the world [48]. Therefore, to predict the future potential geographical distribution of I. aegyptiaca and I. purchasi on a global scale, the community climate system model 4 (CCSM4) [49] and the model for interdisciplinary research on climate 5 (MIROC5) [50,51] for 2050 (average for 2041–2060) and 2070 (average for 2061–2080) were obtained from the global climate models (GCM) to climate projections of the International Panel on Climate Change (IPPC) (http://www.worldclim.org). For each of these two GCMs, we considered two different representative concentration pathways (RCPs) [52,53,54,55,56], which are two cumulative measures of human emissions of greenhouse gases from all sources in Watts per square meter. These pathways were developed for the Fifth Assessment Report of the Intergovernmental Panel on Climate Change [53] and corresponded to a total anthropogenic radiative forcing of RCP = 4.5 W/m2 (low) and RCP = 8.5 W/m2 (high). Finally, there are eight future climate scenarios (2050RCP4.5-CCSM, 2050RCP8.5-CCSM, 2070RCP4.5-CCSM, 2070RCP8.5-MIROC, 2050RCP4.5-MIROC, 2050RCP8.5-MIROC, 2070RCP4.5-MIROC and 2070RCP8.5-MIROC) for each species’ habitat prediction model. All future environmental variables were downloaded from the WorldClim Database (http://www.worldclim.org). All data of current and future bioclimate variables had 5-min (of a longitude/latitude degree) spatial resolution (this is about 9 km at the equator) [55,56].

2.4. Setting of MaxEnt Software Parameters

The MaxEnt parameter settings in this study were: the “random test percentage” of the Basic part was 25 (representing randomly selecting 75% of the distribution points as the training dataset to build the model, leaving 25% of the distribution points as the test dataset); the “replicates” was 10 for the model to run repeatedly for ten times under the same setting, “subsample” was selected as the “replicated run type”, and the final result taken 10 repetitions (avg). In 2017, Phillips et al. compared the “Cloglog” output with the previous “raw”, “logistic” and “cumulative” output methods, and finally proved that the “Cloglog” output was the optimal output mode for predicting the suitable area [41]. Therefore, we used “Cloglog” as the output format in this study. Because I. aegyptiaca is naturally distributed in Asia and Africa, we set MaxEnt to generate background points for I. aegyptiaca in Asia and Africa, and set the projection layers to global (excluding Antarctica); (I) purchasi is distributed in six continents, so the background points generation and the projection layers were set to global (excluding Antarctica).
In addition, the complexity and performance of the models can be affected by two main settings of the software: (1) feature classes (i.e., a function of an environmental predictor), (2) the regularization multiplier [57,58,59,60,61]. In our study, the R package “ENMeval” was used to avoid overfitting and to optimize model parameters [62]. Thus, we tested 8 different combinations of feature classes ((1) linear (L); (2) linear (L) and quadratic (Q) as LQ; (3) linear (L), quadratic (Q) and hinge (H) as LQH; (4) linear (L), quadratic (Q), hinge (H) and product (P) as LQHP; (5) linear (L), quadratic (Q), hinge (H), product (P) and threshold (T) as LQHPT; (6) quadratic (Q), hinge (H) and product (P) as QHP; (7) quadratic(Q), hinge (H), product (P) and threshold (T) as QHPT; and (8) hinge (H), product (P) and threshold (T) as HPT) and regularization multiplier values (0.5, 1, 1.5, 2, 2.5, 3, 3.5 and 4). The “checkerboard2” approach was used to calculate the Akaike information criterion coefficient (AICc) and the lowest delta AICc scores were selected to run the final MaxEnt models [57]. The results are shown in Figure 1 and Table 2. Finally, the regularization multiplier of 0.5 and 1.0, and the feature combinations of LQP and LQHPT were selected for I. aegyptiaca and I. purchase, respectively.

2.5. GIS Analysis

We used ArcGIS software to divide the suitable area and visualize the layers. The range of probability of species’ existence was set between 0 and 1, the lowest presence threshold (LPT) was used to define the suitable and unsuitable habitats [63]. The range of suitable habitats was divided into 4 categories as unsuitable habitat area (0.00–LPT), low suitability habitat area (LPT–4), moderate suitability habitat area (0.4–0.6), high suitability habitat area (0.6–1.00). A world vector map from Natural Earth Dataset (http://www.naturalearthdata.com/) was superimposed on the layer processed above. We used DIVA-GIS to combine CCSM and MIROC layers for each of the climate change scenario/year combinations (2050RCP4.5, 2050RCP8.5, 2070RCP4.5 and 2070RCP8.5) when plotting the map of the suitability habitat areas for the future climate. We also generated a potential distribution map based on “maximum training sensitivity plus specificity Cloglog threshold” using the threshold of 0.2888 and 0.2763, respectively, for I. aegyptiaca and I. purchasi. The potential distribution of I. aegyptiaca is shown in Figure S1 under the current climate, and in Figure S2 in the future climate. Figures S3 and S4 show the potential distribution of I. purchasi under the current climate and in the future climate, respectively.

2.6. Model Result Evaluation

The accuracy test of the MaxEnt prediction was judged by the area under the curve (AUC) of the receiver operating characteristic (ROC) curve and the partial receiver operating characteristic (pROC) metric approach [64,65]. Considering that indoor or greenhouse data may be stored at the selected occurrence point, we used 5% error rate (E = 0.05) to judge the model results, and calculated the AUC ratios (AUC ratios = AUCE/AUC0.5) with E = 0.05 through niche analyst platform [65]. The evaluation criteria are: a AUC of 0.5–0.6 indicates failure model performance; a AUC of 0.6–0.7 indicates poor model performance; a AUC of 0.7–0.8 indicates general model performance; a AUC of 0.8–0.9 indicates good model performance and a AUC of 0.9–1.0 indicates very good model performance [66,67,68,69]. The AUC ratios >1 indicates that the model has a good random prediction [66].

3. Results

3.1. Model Assessment

The mean AUC and AUC ratios of I. aegyptiaca are 0.883 and 1.4828. For I. purchasi, the mean AUC and AUC ratios are 0.849 and 1.3813, respectively. The LPTs are 0.0757 and 0.0507 for I. aegyptiaca and I. purchasi, respectively (Table 2). The AUCs for all modeling results are greater than 0.8 and the AUC ratios are greater than 1, indicating that the prediction result of this experiment is particularly good and has a high credibility. Figure 2 shows the ROC curve when E = 0.05, the ROC curve under the model extends to the upper left side, indicating that the omission rate of the test sample is low.

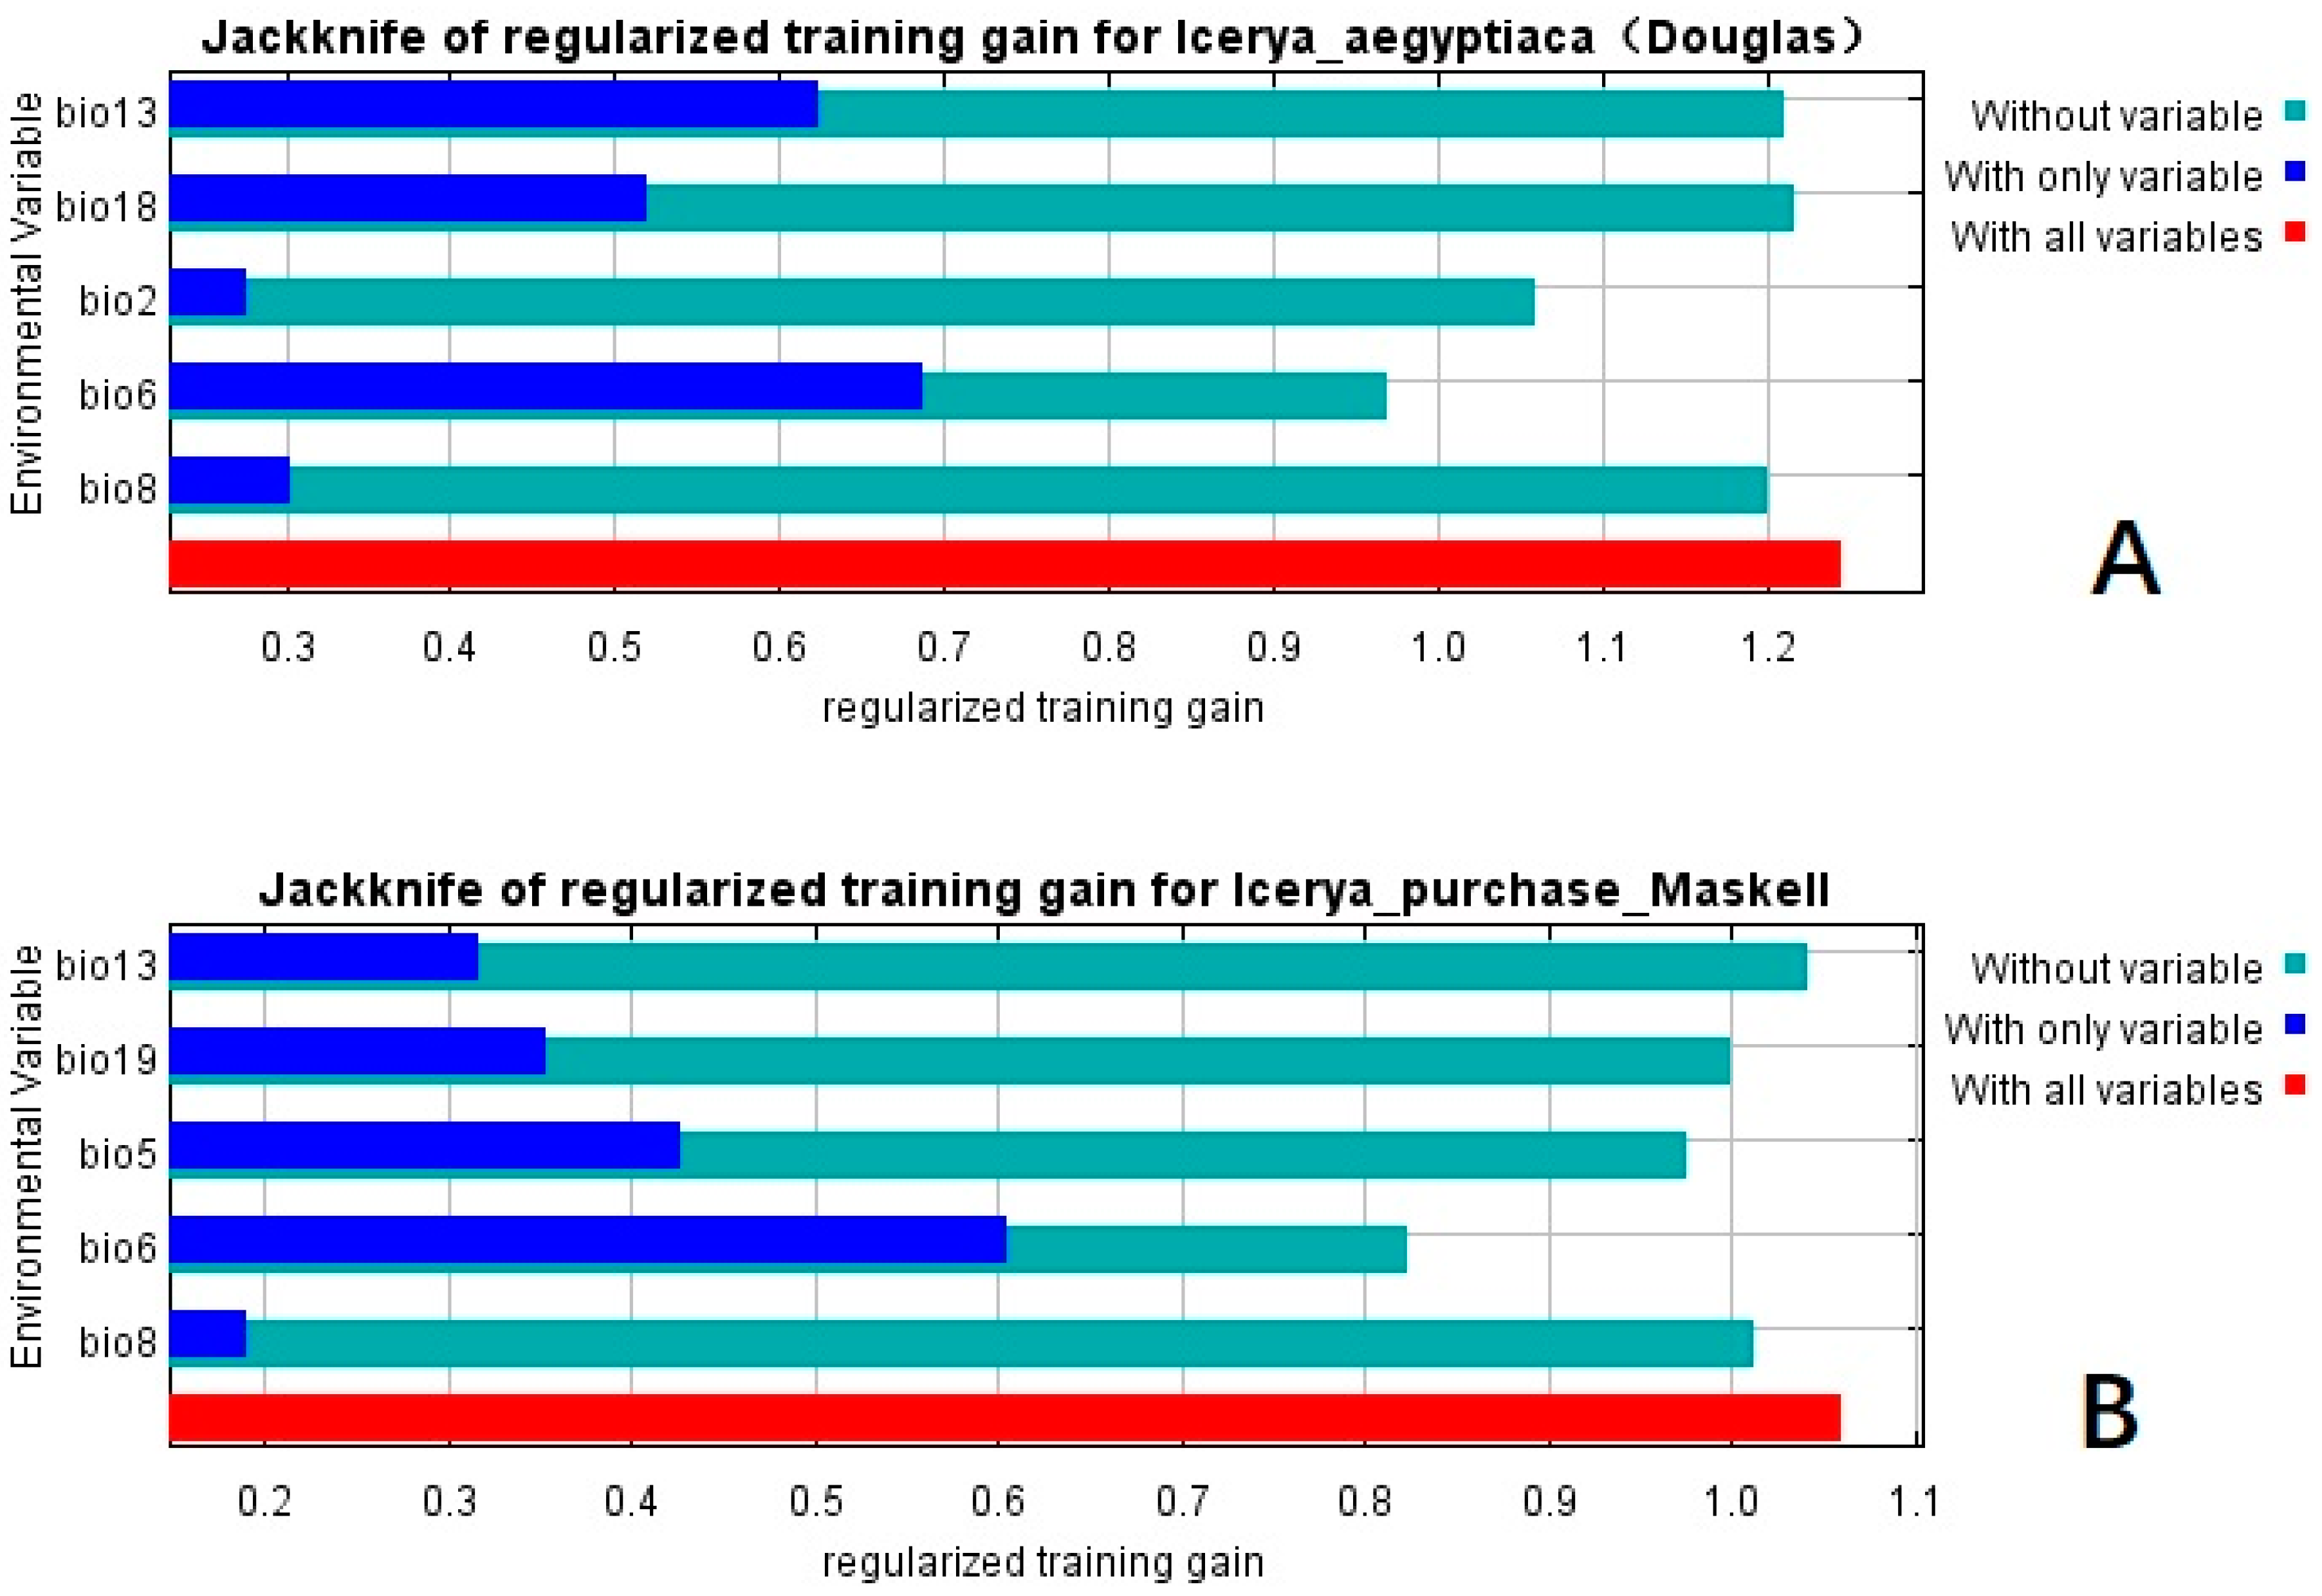
3.2. Important Environmental Variables

Five climatic variables were selected from the previous experiments which affected the distribution of two Icerya species, and their importance was verified by Jack’s knife-cutting method. The result is shown in Figure 3. The longer the blue band of a variable is, the closer between the predicted model result with the variable and the result of model prediction with all variables is, indicating that the effect of this climatic variable on the species distribution is more important. Three environmental variables of bio6, bio13 and bio18 had the greatest influence on I. aegyptiaca distribution and those of bio6, bio5 and bio19 had the greatest influence on I. purchasi distribution. The shorter the green band of a variable is, the more information and the greater the impact of this variable is on the species distribution than the other variables. The environmental variable bio6 had more specific information on the predictions of the I. aegyptiaca and I. purchasi distributions and was the most important variable to the prediction models. It can be seen that the min temperature of coldest month had the greatest influence on the distribution of these two Icerya species.
Combining the bioclimate variables with narrow adaptive ranges to the distribution of I. aegyptiaca and I. purchasi, the partial variables were selected to plot the response curve with the existence probability: bio6 and bio13 were selected for I. aegyptiaca; bio5 and bio8 were selected for I. purchasi. Based on the response curves (Figure 4), the climatic conditions associated with high habitat suitability were >5 °C for bio6, 200–1300 mm for bio13 for I. aegyptiaca and 25–35 °C for bio5, 7–28 °C for bio8 for I. purchasi.

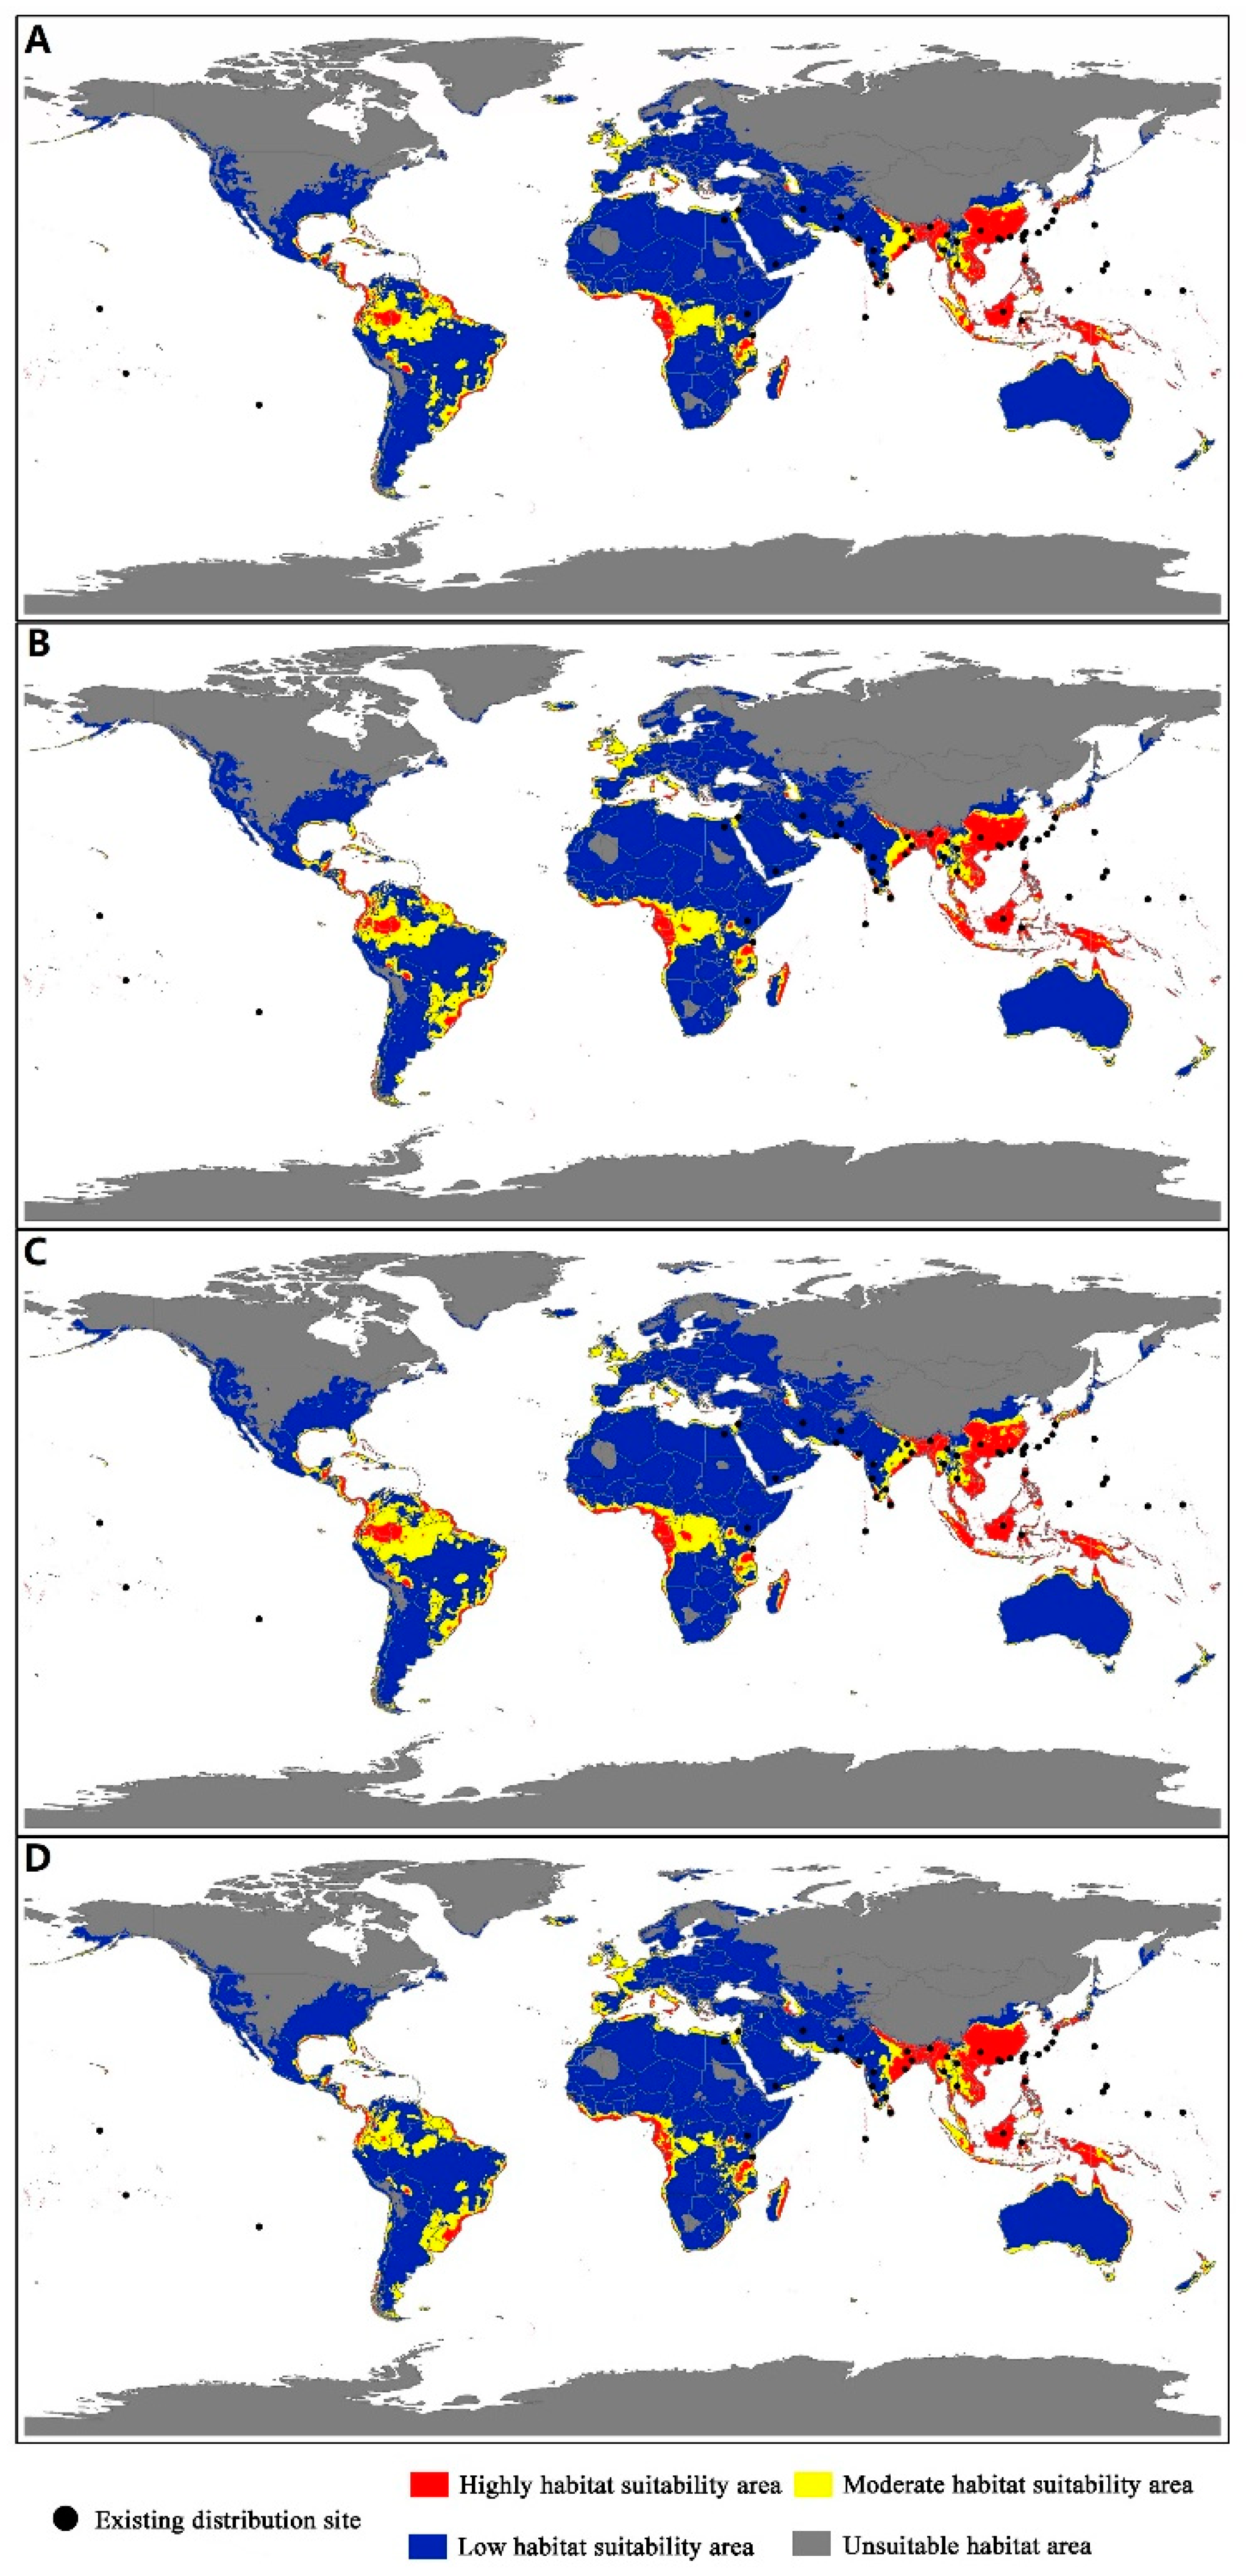
3.3. Predicted Distribution of Icerya Species

The predicted distribution of I. aegyptiaca based on the current bioclimate variables and occurrence records is shown in Figure 5. The potential distribution areas of I. aegyptiaca included a wide range of tropical and subtropical regions, mainly concentrated between 35° S–35° N. The main areas included southern Asia, Africa, south of North America, South America, Oceania and tropical Pacific. Based on current climatic variables, the total potential habitat suitability area for I. aegyptiaca was approximately 6533.31 × 104 km2, of which 809.14 × 10⁴ km2 had a high habitat suitability (high risk), 1102.09 × 104 km2 had a moderate habitat suitability, and 4622.07 × 104 km2 had a low habitat suitability (Figure 6). The three continents with the largest habitat area were Africa, South America and Asia. The high and moderate habitat suitable areas concentrated in the south of Asia, the north of South America and the central of Africa.
The current predicted distribution of I. purchasi is different from that of I. aegyptiaca and shown in Figure 7. The potential distribution areas of I. purchasi occupied a large part of the region on global scale, mainly included Oceania, most of South America, most of Africa, most of Europe, the southern of North America, and the central and southern parts of Asia. Based on current climatic variables, the total potential habitat suitability area for I. purchasi was approximately 7238.83 × 104 km2, of which 1455.89 × 104 km2 had a high habitat suitability (high risk), 1404.72 × 104 km2 had a moderate habitat suitability and 4378.22 × 104 km2 had a low habitat suitability (Figure 8). The high and moderate habitat suitable areas concentrated in the most of South America, southern North America, southwestern Europe, southeast Asia, central and southern Africa and southern Oceania.

3.4. Future Invasion Risk

The MaxEnt models based on two different representative concentration pathways (RCP4.5 and RCP8.5) for the potential distribution of I. aegyptiaca in 2050 and 2070 are presented in Figure 9. The position of the potentially suitable habitat on the global scale of I. aegyptiaca was not changed much from that of the current climate, but the total suitable area was increased. The area change of the suitable habitat of I. aegyptiaca under different climate scenarios is shown in Figure 6. The order of the total suitable habitat area of different climate models on the global scale was as follows: 2070RCP4.5 (7358.26 × 104 km2) > 2070RCP8.5 (7349.601 × 104 km2) > 2050RCP8.5(7164.39 × 104 km2) > 2050RCP4.5(6985.82 × 104 km2) > Current (6533.31 × 104 km2). On the global scale, compared with the area of suitable habitats predicted under the current climate (Figure 8), the area of suitable habitats in the future was generally increased. It can be seen from Figure 6 and Figure 9 that the area of highly suitable habitat increased significantly under future climate conditions, and concentrated in southern Asia, mainly including southern China, Vietnam, Thailand, Laos, Myanmar, northeastern India, Malaysia, Indonesia, the Philippines and Ryukyu in Japan.
The future potential distribution of I. purchasi is presented in Figure 10. Compared with the current climate model, the total area of suitable habitats would increase in the future, but the area of suitable habitats in 2070 would become larger than that in 2050. The area change of the suitable habitat of I. purchasi under different climate scenarios is shown in Figure 8. The order of the total suitable habitat area of different climate models on the global scale is as follows: 2070RCP4.5 (7896.80 × 104 km2) > 2070RCP8.5 (7736.82 × 104 km2) > 2050RCP 8.5 (7690.74 × 104 km2) > 2050RCP4.5 (7559.50 × 104 km2) > Current (7238.83 × 104 km2). Furthermore, the total areas of suitable habitat would increase in the future, but the areas of high habitat would decrease considerably in the future. The area of the high habitat area would reach a minimum of 869.32 × 10⁴ km2 under the 2050 RCP85 model, a reduction of 40.30% compared to the current climate.

4. Discussion

In this study, we used MaxEnt niche models to estimate the global invasion risk of two important forestry Iceryas species. Based on recent recommendations published in the literature [60,64,70,71], we selected the best models for each species using different MaxEnt settings and statistical criteria. Our results support the findings by other studies and demonstrate that the model performance is significantly affected by changing feature classes and regularization multiplier values [70,71].
We used Jack’s knife-cut method to measure the importance of environmental factors in the prediction models. The results showed that “min temperature of coldest month” (bio6) had the greatest impact on the distribution of these two species. The model predicted a wider tolerance range of I. purchasi than that of I. aegyptiaca under the optimum range of each bioclimate factor for the survival of the two pests. It is also predicted that I. purchasi would occupy a larger and more invasive area in the world than I. aegyptiaca. Combining with a practical example indicated that the natural distribution area of I. purchasi in China would be in the south, and the distribution area would be bounded by the line of Qinling Mountains and Huaihe River, where is the boundary between the South and the North of China. However, the distribution area of I. aegyptiaca in China would concentrate in the tropics and adjacent areas, mainly in Yunnan, Guangdong and Taiwan [27]. Therefore, in this respect, I. purchasi would occupy a larger and more invasive area in the world than I. aegyptiaca.
From the geographical distribution map of I. aegyptiaca (Figure 5), the potential distribution area concentrated between 35° S–35° N, which is the distribution characteristics of most insects according to latitude zones, while the distribution of I. purchasi did not have this characteristic. We can also see that Asia was the origin of I. aegyptiaca [22] and the region with the largest number of highly habitat suitability areas, suggesting Asia would be more suitable for its survival. South America, North America and Oceania had no records of the existence of the scale insects but would have a large portion of suitable areas. Once the insect invades, it may cause serious harm, so these areas should have strict inspection and quarantine to prevent the invasion of the insect. The results of future suitable habitats of I. aegyptiaca showed that environmental changes would have a greater impact on the pest distribution, and the suitable area in 2070 would change more than in 2050, and the area of suitable habitats on the global scale would increase with the drastic environmental changes (Figure 6). Previous studies had also suggested that some invasive species were likely to experience increase due to climate change [72,73].
The global distribution point of I. purchasi indicated that the insect had successfully invaded Africa, Asia, South America, North America and Europe from its origin in Australia [20], which may be related to its polyphagism and wide environmental adaptability. The highly suitable area of I. purchasi was large, accounting for 20.11% of the total suitable area, and all six continents had highly suitable areas, while the area of the moderate suitable area and the highly suitable area accounted for 35.37% of the total suitable area, which indicates that the region suitable for the pest’s survival in the world was large. The map of future suitable habitats of I. purchasi, predicts that the total suitable habitats would increase in the future, and the change in 2070 would be greater than in 2050. This shows that the changing trend of the suitable area is consistent with the change of the climate variable. Although the area of suitable habitat would increase in the future, the high suitable area could have a decreasing trend in the future. This phenomenon may indicate that the damage level by the pest may decrease with environmental changes. Previous studies have also suggested that some invasive species are likely to experience reductions due to climate change [37,72]. The retreat by invasive pests could lead to opportunities for the restoration of currently invaded landscapes, but further research is needed to identify these opportunities and to provide sound guidance for ecological restoration.
An interesting feature was found from the distribution characteristics of the suitable areas in different grades and the invasion records of these two Icerya species. The highly suitable areas had the first successful invasion record, the moderately suitable areas had the second record, and the lowly suitable areas had the third record. This phenomenon could be explained from the following viewpoints. Each species needs a certain population density to colonize in a new environment, i.e., minimum viable population [74], which is related to the fitness of the insects. The higher the fitness the insect has, the easier it is for the insect to colonize, thus fewer minimum viable population is needed for the colonization. Therefore, it is possible that these species have been carried to many new areas along with seedling transports [26], the new areas with low adaptability cannot be colonized under low population density, but with the accumulation of time and the increase of seedling transports, once the minimum viable population of these species required for colonization is reached, they will colonize the area. Thus, there is a situation in which the diffusion trend and the suitable range are consistent. This phenomenon can also be explained by propagule pressure, which is the concept of invasive biology and used to measure the population base of an alien species and its relationship with colonization success [75]. The propagule pressure affects not only the colonization of alien species, but also the stage of population growth and diffusion after colonization. When the propagule pressure is high, the population latency is relatively short, the number and spatial expansion are relatively fast, which promotes invasion. Warren et al. quantitatively described the relationship between propagule pressure and colonization. The colonization possibility of alien species was regarded as a probability event. In addition to the initial number of introduced reproductive bodies, individual reproductive viability was also considered in the analysis. The formula [76] was as follows: P(n) = 1 − (d/b) n = 1 − (1 − r/b)n, where P(n) is the colonization probability; B is the birth rate, D is the mortality rate, assuming b > d; R is the initial growth rate of alien species, r = b − d; n is the initial propagule number of alien species.
The above formula suggests that: (1) when the birth rate and mortality remain unchanged, the colonization probability is higher if the initial propagator number (n) of alien species is larger. Otherwise, the colonization probability is lower; (2) when the mortality rate of alien species is lower (i.e., high R value), the dependence of colonization on the number of initial propagules is smaller; (3) when the mortality rate is higher (i.e., small R value), a higher number of propagules is required to colonize successfully. In other words, it is easier for invasive species to colonize successfully in the areas with high suitability because these areas have low mortality rates and high R values, where the colonization is less dependent on the number of initial propagators. In areas with low suitability, the mortality rate of invasive species is higher, the R value is smaller, the number of reproductive bodies needed for colonization is higher, and multiple invasions are needed to colonize successfully. Thus, the tend to spread for some invasive species and the range of suitability is consistent.
The ecological niche models (ENMs) have been used in several studies to identify suitable areas for the occurrence of different species. These studies relied primarily on abiotic factors to generate models, but historical and biologic interactions as well as dispersal constraints also play an important role in species distribution [67,77]. Although these factors may limit the geographical range of a given species in its native region, in new invasion areas they may not be a constraint [78]. We consider the important influence of host plants on these two Icerya species. These two scale insects are polyphagous insects. The host plants of I. aegyptiaca are from 113 genera of 59 families [16]. The host plants of I. purchasi are from 167 genera of 68 families [16]. The distribution range of host plants is much larger than that of the suitable habitats of the two Icerya species, so we did not overlap the layers of host plant distribution with that of the suitable habitats of these two species. The existence of natural enemies will also have a greater impact on the establishment of alien insects. Previous studies suggested that the Rodolia pumila was the main natural enemy of I. aegyptiaca, but the natural distribution of R. pumila only existed in southern China, Philippines, Guam, Japan and some tropical areas of the Pacific Ocean [79]. Therefore, most of the suitable areas are at risk of being invaded by the I. aegyptiaca because they are not protected by the main natural enemies. As the main natural enemy of I. purchasi, Rodolia cardinalis has been introduced into many regions around the world to control I. purchase [80], so the natural enemy has little influence on the next invasion of I. purchasi. Due to many adaptation mechanisms of insects, different environmental factors have different strength limits for different insects. Different environmental factors act on the distribution of species at different spatial scales. On large scales, interactions between species are often being weakened, in which climate variables play a major role [81]. Therefore, our research on the prediction of the suitable area of species based on bioclimate variables can provide accurate prediction results.
The MaxEnt software has a high simulation accuracy, but it has some shortcomings; (1) There is no unified and complete evaluation system for parameter settings. Further research is needed to determine the effectiveness of parameter settings to avoid overfitting; (2) The prediction results use a probability index model with no fixed upper limit, which can increase the predicted value beyond the climatic conditions of the study area. Therefore, special attention is required when extrapolating to another research area or future (past) climatic conditions. This experiment predicts the potential distribution area on a large scale in the world, some special factors in local areas may make the two Icerya species unable to survive even when the result is expressed the local areas as the suitable area, under these special circumstances, a comprehensive analysis on a small scale is needed in subsequent experiments. Despite these limitations, MaxEnt is still an essential tool to identify suitable areas for invasive species, which ultimately represents regions more vulnerable to invasion than those with unsuitable conditions [78].

5. Conclusions

With the increase of global trade, logistics and transportation provide a good way of transmission for biologic invasion. Invasive species are considered as a major threat to ecosystem functions and local biodiversity. Climate change can affect the invasion process from the initial introduction to the establishment and dissemination, and thus has a profound impact on the ecosystem. I. aegyptiaca and I. purchasi are two species of polyphagous and sucking pests with strong invasiveness in the world. This study provides the first potential distribution map based on current and future climate scenarios. The results show that under current climate conditions, the potentially suitable habitat area of I. aegyptiaca will be much larger than the current suitable habitat area, and there will be little change in the habitat area of I. purchasi. In the future climate change scenarios tested, the suitable habitats of the two scale insect species will increase. This study provides a reference and a starting point for forecasting, managing and controlling two invasive species of the genus Icerya, which are seriously harmful.

Supplementary Materials

The following materials are available online at https://www.mdpi.com/1999-4907/11/6/684/s1. Figure S1: Potential geographical distribution of Icerya purchasi on global scale in current climate modeling base on “Maximum training sensitivity plus specificity Cloglog threshold”, Figure S2: Future species distribution models of Icerya aegyptiaca on global scale under different climate scenarios base on “Maximum training sensitivity plus specificity Cloglog threshold”, Figure S3: Potential geographical distribution of I. purchasi on global scale in current climate modeling base on “Maximum training sensitivity plus specificity Cloglog threshold”, Figure S4: Future species distribution models of I. purchasi on global scale under different climate scenarios base on “Maximum training sensitivity plus specificity Cloglog threshold”, Table S1: Correlation matrix of 19 bioclimatic environmental variables.

Author Contributions

Conceptualization, Y.L. and J.S.; funding acquisition, J.S.; investigation, Y.L.; methodology, Y.L. and J.S.; resources, Y.L. and J.S.; software, Y.L.; writing—original draft, Y.L.; writing—review & editing, Y.L. and J.S. All authors have read and agreed to the published version of the manuscript.

Funding

This study was supported by the National Key Research and Development Program of China (2016YFC1202102).

Conflicts of Interest

The authors declare no conflict of interest.

References

  1. Winter, M.; Schweiger, O.; Klotz, S.; Nentwig, W.; Andriopoulos, P.; Arianoutsou, M.; Basnou, C.; Delipetrou, P.; Didžiulis, V.; Hejda, M.; et al. Plant extinctions and introductions lead to phylogenetic and taxonomic homogenization of the European flora. Proc. Natl. Acad. Sci. USA 2009, 106, 21721–21725. [Google Scholar] [CrossRef] [PubMed] [Green Version]
  2. Simberloff, D.; Martin, J.-L.; Genovesi, P.; Maris, V.; Wardle, D.A.; Aronson, J.; Courchamp, F.; Galil, B.; García-Berthou, E.; Pascal, M.; et al. Impacts of biological invasions: What\”s what and the way forward. Trends Ecol. Evol. 2013, 28, 58–66. [Google Scholar] [CrossRef] [PubMed] [Green Version]
  3. Hulme, P.E. Trade, transport and trouble: Managing invasive species pathways in an era of globalization. J. Appl. Ecol. 2009, 46, 10–18. [Google Scholar] [CrossRef]
  4. Pyšek, P.; Richardson, D.M. Invasive species, environmental change and management, and health. Annu. Rev. Environ. Resour. 2010, 35, 25–55. [Google Scholar] [CrossRef] [Green Version]
  5. Paini, D.R.; Sheppard, A.W.; Cook, D.C.; De Barro, P.J.; Worner, S.P.; Thomas, M.B. Global threat to agriculture from invasive species. Proc. Natl. Acad. Sci. USA 2016, 113, 7575–7579. [Google Scholar] [CrossRef] [Green Version]
  6. Seebens, H.; Blackburn, T.M.; Dyer, E.E.; Genovesi, P.; Hulme, P.E.; Jeschke, J.M.; Pagad, S.; Pyšek, P.; Winter, M.; Arianoutsou, M.; et al. No saturation in the accumulation of alien species worldwide. Nat. Commun. 2017, 8, 14435. [Google Scholar] [CrossRef]
  7. Seebens, H.; Essl, F.; Dawson, W.; Fuentes, N.; Moser, D.; Pergl, J.; Pyšek, P.; Van Kleunen, M.; Weber, E.; Winter, M.; et al. Global trade will accelerate plant invasions in emerging economies under climate change. Glob. Chang. Biol. 2015, 21, 4128–4140. [Google Scholar] [CrossRef] [Green Version]
  8. Bradshaw, C.J.A.; Leroy, B.; Bellard, C.; Roiz, D.; Albert, C.; Fournier, A.; Barbet-Massin, M.; Salles, J.-M.; Simard, F.; Courchamp, F. Massive yet grossly underestimated global costs of invasive insects. Nat. Commun. 2016, 7, 12986. [Google Scholar] [CrossRef]
  9. McGeoch, M.A.; Genovesi, P.; Bellingham, P.J.; Costello, M.J.; McGrannachan, C.; Sheppard, A.W. Prioritizing species, pathways, and sites to achieve conservation targets for biological invasion. Biol. Invasions 2016, 18, 299–314. [Google Scholar] [CrossRef] [Green Version]
  10. Biber-Freudenberger, L.; Ziemacki, J.; Tonnang, H.E.Z.; Borgemeister, C. Future risks of pest species under changing climatic conditions. PLoS ONE 2016, 11, e153237. [Google Scholar] [CrossRef]
  11. Shabani, F.; Kumar, L.; Ahmadi, M. A comparison of absolute performance of different correlative and mechanistic species distribution models in an independent area. Ecol. Evol. 2016, 6, 5973–5986. [Google Scholar] [CrossRef] [PubMed] [Green Version]
  12. Wells, C.N.; Tonkyn, D. Changes in the geographic distribution of the diana fritillary (speyeria diana: Nymphalidae) under forecasted predictions of climate change. Insects 2018, 9, 94. [Google Scholar] [CrossRef] [PubMed] [Green Version]
  13. Parmesan, C. Ecological and evolutionary responses to recent climate change. Annu. Rev. Ecol. Evol. Syst. 2006, 37, 637–669. [Google Scholar] [CrossRef] [Green Version]
  14. Deutsch, C.A.; Tewksbury, J.J.; Huey, R.B.; Sheldon, K.S.; Ghalambor, C.K.; Haak, D.; Martin, P.R. Impacts of climate warming on terrestrial ectotherms across latitude. Proc. Natl. Acad. Sci. USA 2008, 105, 6668–6672. [Google Scholar] [CrossRef] [Green Version]
  15. Barbet-Massin, M.; Rome, Q.; Muller, F.; Perrard, A.; Villemant, C.; Jiguet, F. Climate change increases the risk of invasion by the yellow-legged hornet. Biol. Conserv. 2013, 157, 4–10. [Google Scholar] [CrossRef]
  16. García Morales, M.; Denno, B.D.; Miller, D.R.; Miller, G.L.; Ben-Dov, Y.; Hardy, N.B. ScaleNet: A Literature-Based Model of Scale Insect Biology and Systematics. Database 2016, 2016. Available online: http://scalenet.info/catalogue/ (accessed on 15 February 2020).
  17. Signoret, V. ESLC, Essai sur les cochenilles ou gallinsectes (Homoptères—Coccides), 16e partie. Essay on gall-forming scale insects (Homoptera—Coccidae), 16th part. Ann. de la Société Entomol. de Fr. 1876, 5, 346–373. [Google Scholar]
  18. Yu, Y.H. Study on Biology and Control of Icerya aegyptiaca. Dissertation; South China Agricultural University: Guangdong, China, 2005. [Google Scholar]
  19. Singh, S.; Kaur, G. Biodiversity of insect and mite pests infesting fig in the Indian Punjab. Acta Hortic. 2017, 1173, 257–262. [Google Scholar] [CrossRef]
  20. Fuller, C. XIV. Notes and descriptions of some species of western Australian Coccidae. Trans. R. Entomol. Soc. Lond. 1899, 47, 435–473. [Google Scholar] [CrossRef]
  21. Hall, W.J. Observations on the Coccidae of Egypt. Bulletin, ministry of agriculture, Egypt. Tech. Sci. Serv. 1922, 22, 1–54. [Google Scholar]
  22. Uesato, T.; Kondo, T.; Unruh, C.; Williams, D.J. Establishment and host records of Icerya aegyptiaca (Douglas) (Hemiptera: Coccoidea: Monophlebidae) in the Sakishima islands of the Ryukyu archipelago, Japan, with notes on its worldwide distribution. Entomol. Sci. 2011, 14, 49–55. [Google Scholar] [CrossRef]
  23. Zhang, W. Primary Investigation of Host Plants and Damage Extent for Icerya aegyptiaca (Douglas). Master’s Thesis, Anhui Agricultural Science Bulletin, Anhui, China, 2011. [Google Scholar]
  24. Prasad, Y.K. The role of natural enemies in controlling Icerya purchasi in South Australia. Entomophaga 1989, 34, 391–395. [Google Scholar] [CrossRef]
  25. Tang, F.T.; Hao, J.J. The Margarodidae and Others of China; Chinese Agricultural Science and Technology Press: Beijing, China, 1995; p. 157. [Google Scholar]
  26. Papadopoulou, S.; Chryssohoides, C. Icerya purchasi (Homoptera: Margarodidae) on Rosmarinus officinalis (Lamiaceae), a new host plant record for Greece. EPPO Bull. 2012, 42, 148–149. [Google Scholar] [CrossRef]
  27. Unruh, C.M.; Gullan, P.J. Molecular data reveal convergent reproductive strategies in Iceryine scale insects (Hemiptera: Coccoidea: Monophlebidae), allowing the re-interpretation of morphology and a revised generic classification. Syst. Entomol. 2008, 33, 8–50. [Google Scholar] [CrossRef]
  28. Zhao, G.S.; Zhou, W.C. Exotic pests and diseases of plants in Taiwan. Taiwan Agric. Res. 1994, 2, 25–27. [Google Scholar]
  29. Peterson, A.T. Ecological niche conservatism: A time-structured review of evidence. J. Biogeogr. 2011, 38, 817–827. [Google Scholar] [CrossRef]
  30. Venette, R.C.; Kriticos, D.J.; Magarey, R.D.; Koch, F.H.; Baker, R.H.A.; Worner, S.P.; Raboteaux, N.N.G.; McKenney, D.W.; Dobesberger, E.J.; Yemshanov, D.; et al. Pest risk maps for invasive alien species: A roadmap for improvement. Bioscience 2010, 60, 349–362. [Google Scholar] [CrossRef]
  31. Carpenter, G.; Gillison, A.N.; Winter, J. Domain: A flexible modelling procedure for mapping potential distributions of plants and animals. Biodivers. Conserv. 1993, 2, 667–680. [Google Scholar] [CrossRef]
  32. Chejara, V.K.; Kriticos, D.J.; Kristiansen, P.; Sindel, B.M.; Whalley, R.D.B.; Nadolny, C. The current and future potential geographical distribution of Hyparrhenia. Hirta. Weed Res. 2010, 50, 174–184. [Google Scholar] [CrossRef]
  33. Phillips, S.J.; Anderson, R.P.; Schapire, R.E. Maximum entropy modeling of species geographic distributions. Ecol. Model. 2006, 190, 231–259. [Google Scholar] [CrossRef] [Green Version]
  34. Elith, J.; Graham, C.H.; Anderson, R.P.; Dudík, M.; Ferrier, S.; Guisan, A.; Hijmans, R.J.; Huettmann, F.; Leathwick, J.R.; Lehmann, A.; et al. Novel methods improve prediction of species’ distributions from occurrence data. Ecography 2006, 29, 129–151. [Google Scholar] [CrossRef] [Green Version]
  35. Zhu, G.P.; Liu, Q.; Gao, Y.B. Improving ecological niche model transferability to predict the potential distribution of invasive exotic species. Biodivers. Sci. 2014, 22, 223–230. [Google Scholar] [CrossRef]
  36. Ramos, R.S.; Kumar, L.; Shabani, F.; Picanço, M.C. Mapping global risk levels of Bemisia tabaci in areas of suitability for open field tomato cultivation under current and future climates. PLoS ONE 2018, 13, e198925. [Google Scholar] [CrossRef] [PubMed]
  37. Wei, J.; Zhao, Q.; Zhao, W.; Zhang, H. Predicting the potential distributions of the invasive cycad scale Aulacaspis yasumatsui (Hemiptera: Diaspididae) under different climate change scenarios and the implications for management. Peerj 2018, 6, e4832. [Google Scholar] [CrossRef] [PubMed]
  38. Rao, V.P. Iceryine Scale Insects Recorded from the Orient. Indian J. Entomol. 1951, 12, 39–158. Available online: https://www.cabdirect.org/cabdirect/abstract/20057007519 (accessed on 10 February 2020).
  39. Beardsley, J.W. Insects of Micronesia Homoptera: Coccoidea. Insects Micrones. 1966, 6, 377–562. Available online: http://hbs.bishopmuseum.org/pubs-online/pdf/iom6-9cocc.pdf (accessed on 10 February 2020).
  40. Ben-Dov, Y. The scale insects (Hemiptera: Coccoidea) of Israel-checklist, host plants, zoogeographical considerations and annotations on species. Isr. J. Entomol. 2012, 41, 21–48. [Google Scholar]
  41. Williams, D.J.; Watson, G.W. The Scale Insects of the Tropical South Pacific Region. Part 1: The Armoured Scales (Diaspididae). CAB International 1990. Available online: https://www.cabdirect.org/cabdirect/abstract/19901143648 (accessed on 10 February 2020).
  42. Malumphy, C.; Badmin, J.S. Scale Insects and Whiteflies (Hemiptera: Coccoidea and Aleyrodoidea) of Watsonian Kent; with a Discussion on the Impact of Naturalised Non-Native Species. Br. J. Entomol. Nat. Hist. 2012, 25, 15. Available online: https://www.researchgate.net/profile/Chris_Malumphy2/publication/311344460_Scale_insects_and_whiteflies_Hemiptera_Coccoidea_and_Aleyrodoidea_of_Watsonian_Kent_with_a_discussion_on_the_impact_of_naturalised_non-native_species/links/5864fab008ae6eb871adadf6.pdf (accessed on 20 February 2020).
  43. Kim, D.H.; Yang, J.Y.; Jang, Y.S.; Choi, K.S.; Hyun, H.N.; Kim, D.-S. Stage-specific population dynamics of cottony cushion scale, Icerya purchasi (Hemiptera: Monophlebidae), in citrus orchards in Jeju, Korea. J. Asia-Pac. Entomol. 2011, 14, 305–309. [Google Scholar] [CrossRef]
  44. Kadmon, R.; Farber, O.; Danin, A. Effect of roadside bias on the accuracy of predictive maps produced by bioclimatic models. Ecol. Appl. 2004, 14, 401–413. [Google Scholar] [CrossRef]
  45. Elith, J.; Phillips, S.J.; Hastie, T.; Dudík, M.; Chee, Y.E.; Yates, C.J. A statistical explanation of MaxEnt for ecologists. Divers. Distrib. 2011, 17, 43–57. [Google Scholar] [CrossRef]
  46. Li, G.; Du, S.; Guo, K. Evaluation of limiting climatic factors and simulation of a climatically suitable habitat for Chinese sea buckthorn. PLoS ONE 2015, 10, e131659. [Google Scholar] [CrossRef]
  47. Brown, J.L.; Bennett, J.R.; French, C.M. SDMtoolbox 2.0: The next generation Python-based GIS toolkit for landscape genetic, biogeographic and species distribution model analyses. PeerJ 2017, 5, e4095. [Google Scholar] [CrossRef] [PubMed] [Green Version]
  48. Guisan, A.; Tingley, R.; Baumgartner, J.B.; Naujokaitis-Lewis, I.; Sutcliffe, P.R.; Tulloch, A.I.; Regan, T.J.; Brotons, L.; McDonald-Madden, E.; Mantyka-Pringle, C.; et al. Predicting species distributions for conservation decisions. Ecol. Lett. 2014, 16, 1424–1435. [Google Scholar] [CrossRef]
  49. Bitz, C.M.; Shell, K.; Gent, P.R.; Bailey, D.A.; Danabasoglu, G.; Armour, K.C.; Holland, M.M.; Kiehl, J.T. Climate sensitivity of the community climate system model, version 4. J. Clim. 2012, 25, 3053–3070. [Google Scholar] [CrossRef] [Green Version]
  50. Watanabe, S.; Hajima, T.; Sudo, K.; Nagashima, T.; Takemura, T.; Okajima, H.; Nozawa, T.; Kawase, H.; Abe, M.; Yokohata, T.; et al. MIROC-ESM 2010: Model description and basic results of CMIP5-20c3m experiments. Geosci. Model Dev. 2011, 4, 845. [Google Scholar] [CrossRef] [Green Version]
  51. Nozawa, T.; Nagashima, T.; Shiogama, H.; Crooks, S.A. Detecting natural influence on surface air temperature change in the early twentieth century. Geophys. Res. Lett. 2005, 32. [Google Scholar] [CrossRef] [Green Version]
  52. Moss, R.-H.; Edmonds, J.A.; Hibbard, K.A.; Manning, M.R.; Rose, S.K.; Van Vuuren, D.; Carter, T.R.; Emori, S.; Kainuma, M.; Kram, T.; et al. The next generation of scenarios for climate change research and assessment. Nature 2010, 463, 747–756. [Google Scholar] [CrossRef] [PubMed]
  53. Van Vuuren, D.; Edmonds, J.; Kainuma, M.; Riahi, K.; Thomson, A.; Hibbard, K.; Hurtt, G.C.; Kram, T.; Krey, V.; Lamarque, J.-F.; et al. The representative concentration pathways: An overview. Clim. Chang. 2011, 109, 5. [Google Scholar] [CrossRef]
  54. Moss, R.; Babiker, W.; Brinkman, S.; Calvo, E.; Carter, T.; Edmonds, J.; Elgizouli, I.; Emori, S.; Erda, L.; Hibbard, K.; et al. Towards new scenarios for the analysis of emissions: Climate change, impacts and response strategies. Environ. Policy Collect. 2008, 5, 399–406. [Google Scholar] [CrossRef]
  55. Riahi, K.; Rao, S.; Krey, V.; Cho, C.; Chirkov, V.; Fischer, G.; Kindermann, G.; Nakicenovic, N.; Rafaj, P. Rcp 8.5: A scenario of comparatively high greenhouse gas emissions. Clim. Chang. 2011, 109, 33. [Google Scholar] [CrossRef] [Green Version]
  56. Thomson, A.M.; Calvin, K.; Smith, S.J.; Kyle, P.; Volke, A.; Patel, P.; Delgado-Arias, S.; Bond-Lamberty, B.; Wise, M.A.; Clarke, L.E.; et al. Rcp4.5: A pathway for stabilization of radiative forcing by 2100. Clim. Chang. 2011, 109, 77. [Google Scholar] [CrossRef] [Green Version]
  57. Phillips, S.J.; Anderson, R.P.; Dudík, M.; Schapire, R.E.; Blair, M.E. Opening the black box: An open-source release of Maxent. Ecography 2017, 40, 887–893. [Google Scholar] [CrossRef]
  58. Morales, N.S.; Fernández, I.C.; Baca-González, V. Maxent’s parameter configuration and small samples: Are we paying attention to recommendations? A systematic review. Peerj 2017, 5, e3093. [Google Scholar] [CrossRef]
  59. Merow, C.; Smith, M.; Silander, J.A. A practical guide to maxent for modeling species’ distributions: What it does, and why inputs and settings matter. Ecography 2013, 36, 1058–1069. [Google Scholar] [CrossRef]
  60. Radosavljevic, A.; Anderson, R.P. Making better Maxent models of species distributions: Complexity, overfitting and evaluation. J. Biogeogr. 2014, 41, 629–643. [Google Scholar] [CrossRef]
  61. Kumar, S.; Neven, L.G.; Zhu, H.; Zhang, R. Assessing the global risk of establishment of Cydia pomonella (Lepidoptera: Tortricidae) using Climex and Maxent niche models. J. Econ. Entomol. 2015, 108, 1708–1719. [Google Scholar] [CrossRef]
  62. Muscarella, R.; Galante, P.J.; Soley-Guardia, M.; Boria, R.A.; Kass, J.M.; Uriarte, M.; Anderson, R.P. ENMeval: An R package for conducting spatially independent evaluations and estimating optimal model complexity for Maxent ecological niche models. Methods Ecol. Evol. 2014, 5, 1198–1205. [Google Scholar] [CrossRef]
  63. Pearson, R.G.; Raxworthy, C.J.; Nakamura, M.; Peterson, A.T. Original article: Predicting species distributions from small numbers of occurrence records: A test case using cryptic geckos in Madagascar. J. Biogeogr. 2007, 34, 102–117. [Google Scholar] [CrossRef]
  64. Shcheglovitova, M.; Anderson, R.P. Estimating optimal complexity for ecological niche models: A jackknife approach for species with small sample sizes. Ecol. Model. 2013, 269, 9–17. [Google Scholar] [CrossRef]
  65. Peterson, A.T.; Papeş, M.; Soberón, J. Rethinking receiver operating characteristic analysis applications in ecological niche modeling. Ecol. Model. 2008, 213, 63–72. [Google Scholar] [CrossRef]
  66. Swets, J.A. Measuring the accuracy of diagnostic systems. Science 1988, 240, 1285–1293. [Google Scholar] [CrossRef] [PubMed] [Green Version]
  67. Peterson, A.T.; Soberón, J.; Pearson, R.G.; Anderson, R.P.; Martínez-Meyer, E.; Nakamura, M.; Araújo, M.B. Ecological Niches and Geographic Distributions (MPB-49); Princeton University Press: Princeton, NJ, USA, 2011. [Google Scholar]
  68. Zhu, G.P.; Fan, J.Y.; Wang, M.L.; Chen, M.; Qiao, H. The importance of the shape of receiver operating characteristic (ROC) curve in ecological niche model evaluation: Case study of Hlyphantria Cunea. J. Biosaf. 2017, 3, 184–190. [Google Scholar] [CrossRef]
  69. Jiménez-Valverde, A. Insights into the area under the receiver operating characteristic curve (AUC) as a discrimination measure in species distribution modelling. Glob. Ecol. Biogeogr. 2012, 21, 498–507. [Google Scholar] [CrossRef]
  70. Marchioro, C.A.; Krechemer, F.S. Potential global distribution of Diabrotica species and the risks for agricultural production. Pest Manag. Sci. 2018, 74, 2100–2109. [Google Scholar] [CrossRef]
  71. Hill, M.P.; Terblanche, J.S. Niche overlap of congeneric invaders supports a single-species hypothesis and provides insight into future invasion risk: Implications for global management of the Bactrocera dorsalis complex. PLoS ONE 2014, 9, e90121. [Google Scholar] [CrossRef] [Green Version]
  72. Bradley, B.A.; Blumenthal, D.M.; Wilcove, D.S.; Ziska, L.H. Predicting plant invasions in an era of global change. Trends Ecol. Evol. 2010, 25, 310–318. [Google Scholar] [CrossRef]
  73. Wei, J.; Li, X.; Lu, Y.; Zhao, L.; Zhang, H.; Zhao, Q. Modeling the potential global distribution of Phenacoccus madeirensis green under various climate change scenarios. Forests 2019, 10, 773. [Google Scholar] [CrossRef] [Green Version]
  74. Xu, H.F.; Lu, H.J. Minimum viable population: A basic theory of conservation biology. Chin. J. Ecol. 1996, 15, 25–30. [Google Scholar]
  75. Williamson, M. Biological Invasions; Chapman & Hall: London, UK, 1996; pp. 8–10. [Google Scholar]
  76. Cadotte, M.W.; Mcmahon, S.M.; Fukami, T. Conceptual Ecology and Invasion Biology: Reciprocal Approaches to Nature; Springer: Dordrecht, The Netherlands, 2006; pp. 343–367. [Google Scholar]
  77. Webber, B.L.; Yates, C.J.; Le Maitre, D.C.; Scott, J.; Kriticos, D.J.; Ota, N.; McNeill, A.; Le Roux, J.J.; Midgley, G.F. Modelling horses for novel climate courses: Insights from projecting potential distributions of native and alien Australian acacias with correlative and mechanistic models. Divers. Distrib. 2011, 17, 978–1000. [Google Scholar] [CrossRef]
  78. Aragón, P.; Baselga, A.; Lobo, J.M. Global estimation of invasion risk zones for the western corn rootworm Diabrotica virgifera virgifera: Integrating distribution models and physiological thresholds to assess climatic favourability. J. Appl. Ecol. 2010, 47, 1026–1035. [Google Scholar] [CrossRef]
  79. An, X.-C.; Guo, Q.; Jiang, L.; Zhang, W.-P. The study of predation of Icerya aegyptiaca by Rodolia Pumila. J. Hunan Agric. Univ. 2011, 34, 407–410. [Google Scholar] [CrossRef]
  80. Caltagirone, L.E.; Doutt, R.L. The history of the vedalia beetle importation to California and its impact on the development of biological control. Annu. Rev. Entomol. 1989, 34, 1–16. [Google Scholar] [CrossRef]
  81. Hortal, J.; Roura-Pascual, N.; Sanders, N.J.; Rahbek, C. Understanding (insect) species distributions across spatial scales. Ecography 2010, 33, 51–53. [Google Scholar] [CrossRef]
Figure 1. The results of ENMeval of R package for (A) I. aegyptiaca and (B) I. purchase.
Forests 11 00684 g001
Figure 2. Illustration of receiver operating characteristic (ROC) curves at E = 0.05, the user-defined error tolerance.
Forests 11 00684 g002
Figure 3. Importance of environmental variables in predicting the distribution of Icerya Signoret. (A) I. aegyptiaca; (B) I. purchasi. “Without variable” represents the regularized training gain of the model without this variable, “With only variable” represents the regularized training gain of the model with only this variable.
Forests 11 00684 g003
Figure 4. Response curves between probability of presence and environmental variables (Values shown are average over 10 replicate runs: blue margins show ± SD calculated over 10 replicates).(A) bio6; (B) bio13; (C) bio5; (D) bio8.
Forests 11 00684 g004
Figure 5. Potential geographical distribution of Icerya aegyptiaca on global scale in current climate modeling.
Forests 11 00684 g005
Figure 6. MaxEnt models predicting suitability areas of Icerya aegyptiaca on global scale under different climate scenarios.
Forests 11 00684 g006
Figure 7. Potential geographical distribution of Icerya purchasi on global scale in current climate modeling.
Forests 11 00684 g007
Figure 8. MaxEnt models predicting suitability areas of Icerya purchasi on global scale under different climate scenarios.
Forests 11 00684 g008
Figure 9. Future species distribution models of Icerya aegyptiaca on global scale under different climate scenarios predicted by MaxEnt. (A) 2050RCP4.5 (habitat suitability areas for the projected future distribution under the community climate system model (CCMA) and model for interdisciplinary research on climate (MIROC) representative concentration pathways (RCP) 4.5 climate change scenarios); (B) 2050RCP8.5; (C) 2070RCP4.5; (D) 2070RCP8.5.
Forests 11 00684 g009
Figure 10. Future species distribution models of Icerya purchasi on global scale under different climate scenarios predicted by MaxEnt. (A) 2050RCP4.5; (B) 2050RCP8.5; (C) 2070RCP4.5; (D) 2070RCP8.
Forests 11 00684 g010
Table 1. List of meteorological factors.
AbbreviationBioclimate VariablesAbbreviationBioclimate Variables
bio01Annual mean temperaturebio11Mean temperature of coldest quarter
bio02Mean diurnal rangebio12Annual precipitation
bio03Isothermalitybio13Precipitation of wettest month
bio04Temperature seasonalitybio14Precipitation of driest month
bio05Max temperature of warmest monthbio15Precipitation seasonality
bio06Min temperature of coldest monthbio16Precipitation of wettest quarter
bio07Temperature annual rangebio17Precipitation of driest quarter
bio08Mean temperature of wettest quarterbio18Precipitation of warmest quarter
bio09Mean temperature of driest quarterbio19Precipitation of coldest quarter
bio10Mean temperature of warmest quarter
Table 2. Important values for the MaxEnt model.
SpeciesFeature ClassesRegularization MultiplierAUCAUC Ratios (E = 0.05)LPT
I. aegyptiacaL, Q, P0.50.8831.48280.0757
I. purchasiL, Q, H, P, T1.00.8491.38130.0507
AUC: the area under the curve of the receiver operating characteristic (ROC) curve; LPT: lowest presence threshold.

