1. Introduction
Differences in fire management, including the frequency and season of fire, cause changes in forest structure and composition in the savanna ecosystems of tropical and subtropical regions. [
1,
2,
3,
4]. Immediately following fires, the perennial plants that dominate the understory in these fire-frequented habitats begin resprouting from belowground buds, often returning to pre-fire stature within months [
5,
6]. The rate of vegetation regrowth could influence competitive interactions between established and newly recruiting individuals [
7,
8]. For instance, if fires are timed during a season when plants regrow slowly, there should be additional time for new individuals to germinate or establish new clones before competitive pressures escalate. Thus, knowledge of vegetation regrowth is potentially important for the management of biodiversity, especially when there is little time between fires.
Normalized Difference Vegetation Index (NDVI), a measure of vegetation productivity using remote sensing, has been used to examine vegetation recovery after fire over a limited range of temporal and spatial scales. To date, this metric has primarily been used to study vegetation recovery after infrequent, stand-replacing fires where yearly satellite images are sufficient to detect changes over time [
9,
10,
11,
12,
13]. In burned savannas, where frequent imagery is needed to detect vegetation recovery, researchers often employ ground-based remote sensing [
14], because differences in canopy density and phenology may skew NDVI [
15,
16]. Additionally, satellite imagery typically does not have the spatial and temporal resolution needed to accurately detect rapid changes in understory vegetation [
17].
The objectives of this paper are to (1) examine the efficacy of using NDVI derived from satellite imagery to detect rapid vegetation recovery after fire; and (2) understand the temporal changes in vegetation recovery after fire by relating NDVI to season changes in weather. These objectives combined allow us to compare the time-to-vegetation recovery expected from altering the season of fire in a fire-frequented, subtropical savanna. In particular, we predict that time-to-vegetation recovery will be faster after fires during the wet, growing season than during the dormant season, because the growing season is when high temperatures and frequent precipitation should result in faster growth of vegetation [
18]. We select sites with low canopy interference and thus expect to see a significant decrease in NDVI following fires resulting from visible char, which remains on the landscape until vegetation steadily recovers in the ensuing days, weeks, or months. Furthermore, we obtain images from Planet Labs, Inc., a company that provides daily, high-resolution satellite imagery that should allow us to collect the frequent, possibly daily values, that are needed to detect an accurate time-to-vegetation recovery. Determining vegetation recovery using a satellite-derived metric, such as NDVI, rather than intensive field sampling, should save both time and money. Additionally, the relationship between fire regimes and vegetation recovery should be important information for restoration and management, particularly when erosion, rare plant recruitment, or biomass accumulation between fires are concerns.
2. Materials and Methods
2.1. Description of Study Site
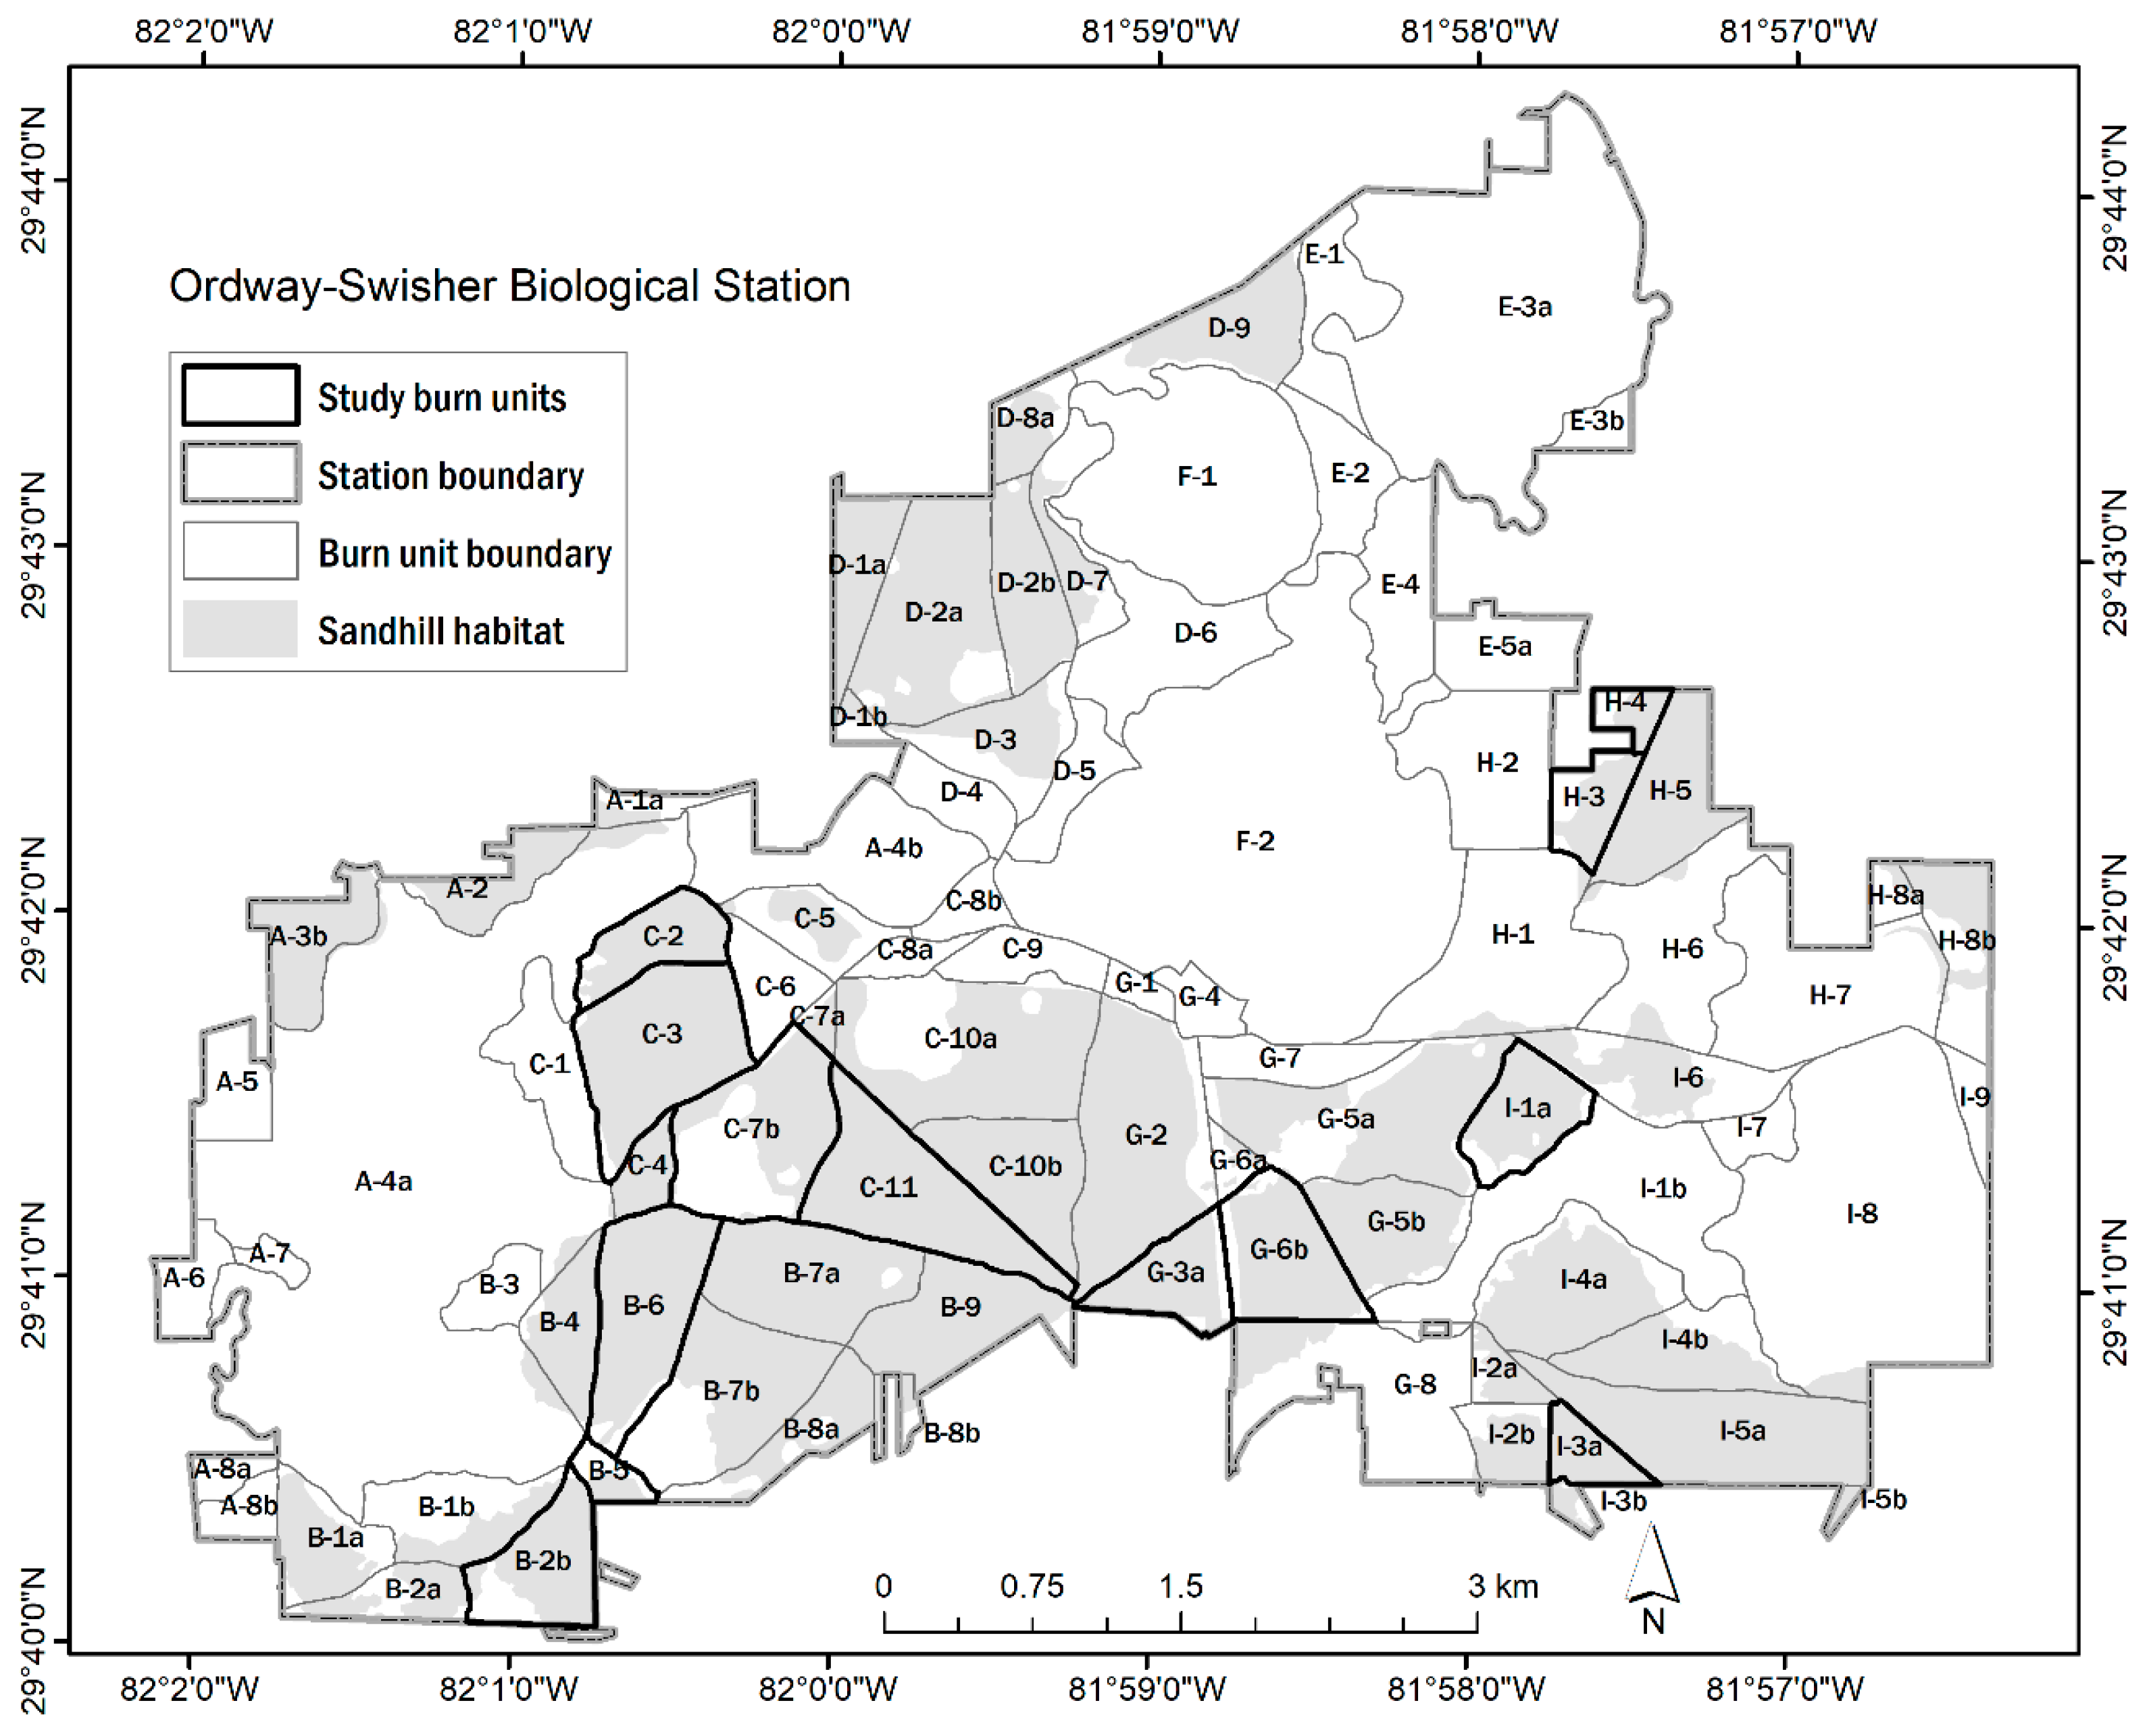
The Ordway-Swisher Biological Station (OSBS) is roughly 3850 hectares located in Melrose, Florida, U.S.A., approximately 35 km east of the University of Florida main campus (29°40′22” N, 82°1′59” W). The topography of this area is very mild, termed rolling sand hills, and varies between 30 and 60 m ASL (Above Sea Level). Xeric, sandhill pine savannas comprise much of the land area at OSBS. The understory in this ecosystem is dominated by a continuous layer of grasses (mainly
Aristida beyrichiana and
Sporobolus junceus), shrubs, and longleaf pine (
Pinus palustris) needles that carry frequent, low-intensity fires across the landscape [
19]. Recurrent fires reduce overstory tree density resulting in widely spaced trees, mostly longleaf pine with scattered oaks, and increase light availability in the understory [
20,
21]. Historically, fires occurred up to five times per decade and were ignited by lightning or Native Americans [
22]. Today, in the southeastern U.S.A., land practitioners frequently use low-intensity prescribed fires during both dormant and growing seasons to maintain open, biodiverse longleaf pine ecosystems.
OSBS is a National Ecological Observatory Network (NEON) site that regularly collects open-access data in a variety of categories, including atmospheric, biologic, hydrologic, land cover, and population data. OSBS is divided into management units (henceforth referred to as “burn units” or “units”), varying in size from 20–80 hectares, where prescribed fires have been frequently lit on average every 2–3 years during different seasons since the early 1980s. Units have experienced a variety of burn seasons, frequencies, and fire-free periods, making them ideal to examine: (a) whether NDVI derived from satellite imagery is sensitive to varying fire regimes; and (b) the effects of varying fire regimes on vegetation recovery.
2.2. Description of Data
Raw satellite imagery was obtained from Planet Labs, Inc., which comes with radiometric and sensor corrections and is from the Ortho Tile product, a part of the PlanetScope satellite constellation, which is a grouping of dozens of mini-satellites that orbit and image the globe daily [
23]. The PlanetScope sensor has four bands, blue (455–515 nm), green (500–590 nm), red (590–670 nm), and near-infrared (780–860 nm) (RGB, NIR). The daily imagery used in this study only started to become available in 2016, with adequate temporal coverage not existing prior to our study dates. Imagery resolution is 3 m and collected roughly monthly for a 2-year period (2017–2018). We selected images that were free of visible cloud and atmospheric noise, and spaced as close to every 30 days as possible. Although our goal was to find at least one usable, cloud-free image immediately post-burn for each study unit and at least one per month thereafter, frequently every day for more than a month would lack a useable image. The red and NIR bands are needed in this study for the calculation of NDVI, which is used to assess the greenness of vegetation, enabling the comparison of the amount of greenness in an area over time.
Although NDVI is a useful tool for assessing the health or season of vegetation, it can be limiting when analyzing certain landscapes. NDVI does not distinguish between different plant species, so any species-specific greenness cannot be determined using NDVI alone. However, because longleaf savannas are known to have minimal overstory tree density and a typical composition of understory plants endemic to the fire-prone ecosystems [
1], this study was conducted under the assumption that most imagery cells with NDVI values would register understory plants that should be affected by low intensity, ground-layer fire in these ecosystems.
2.3. Selection of Burn Units
We used the recorded fire history at OSBS to select frequently burned units that were mostly composed of open, sandhill pine savannas and had experienced a prescribed fire in 2018. This allowed for two year-long cycles of NDVI to be compared: one for 2017, where units did not experience fire, and one for 2018, where study burn units each had one fire. Predicted weather conditions on the day of each prescribed fire in 2018 are included in
Figure S1.
Burn units were grouped into two categories, dormant and growing season burns, based on the date of their 2018 prescribed fire. We defined dormant season fires as those that occurred in the winter months (January and February) of the dry season, which include burn units C-3, C-2, B-6, C-7b, G-6b, I-1a, C-11, and B-2b. Growing season fires were defined as those that occurred in the summer months (April to June) of the wet season and includes units B-5, H-3, H-4, I-3a, and G-3a (
Figure 1). It should be noted that units B-5, H-3, and H-4 that were burned in April could fall into a transitional growing season category in which burns occur when the dry season ends and before the wet season begins, but for the purposes of this study, we will describe these burns as “early growing season”, since vegetation recovery for these is more closely aligned with the remaining growing season burns.
2.4. Processing NDVI
NDVI, a measure of vegetation greenness, uses the red and near-infrared (NIR) bands resulting in processed cells with values between −1 and +1, associating values closer to −1 as waterbodies, values closer to 0 as bare soil, and values closer to +1 as green vegetation [
24,
25]. Red is absorbed in plant chlorophyll, while NIR is heavily reflected by the leaf structure. The formula used to measure NDVI creates a contrasting effect for the two bands, which illustrates where greenness can be found [
26]:
Image processing was done in ENVI [
27]. Multiple images for each of the 18 imagery dates were needed to encompass the total boundary of OSBS. We used a Seamless Mosaic to stitch images together and yield one TIFF file for each date. With each single TIFF file, we used Band Math to input Equation (1) above for NDVI [
28] For the Planetscope sensor, the red is band 3, and the NIR is band 4. Each NDVI layer is stacked together as a set of 18 bands. The selection of study burn units was used as an ROI (region of interest) to extract average NDVI values for each burn unit at each NDVI date.
2.5. Data Analysis
We used a visual analysis of monthly NDVI temporal patterns and defined recovery as NDVI approaching approximately >80% of pre-burn NDVI values. For this study, we do not consider standard deviations, as xeric pine savannas have many patches of bare, sandy soil and occasional evergreen pines. Thus, some cells will always have values of an NDVI close to 1 or close to 0. Taking the average across burn units allows us to examine the overall change through time, with those cells that are unlikely to change as a result of fire remaining the same (i.e., sand is still sand after a fire). Future studies will investigate questions related to spatial and temporal heterogeneity within and between burn units.
We determine when we would need the highest temporal resolution of satellite imagery to detect time-to-vegetation recovery by examining the relationship between NDVI and environmental variables, including temperature and precipitation, and days-since-burn. Average monthly temperature and total monthly precipitation were calculated from data downloaded from the OSBS on-site weather station via their online data portal. A subset of predictor variables was selected using the stepAIC function from the MASS package in R. Both variables that were selected for analysis, days since the last prescribed burn and average temperature (°C), were log-transformed to avoid violating assumptions of normal distribution. Multiple linear regression was then performed in R version 3.6.1 [
29].
3. Results
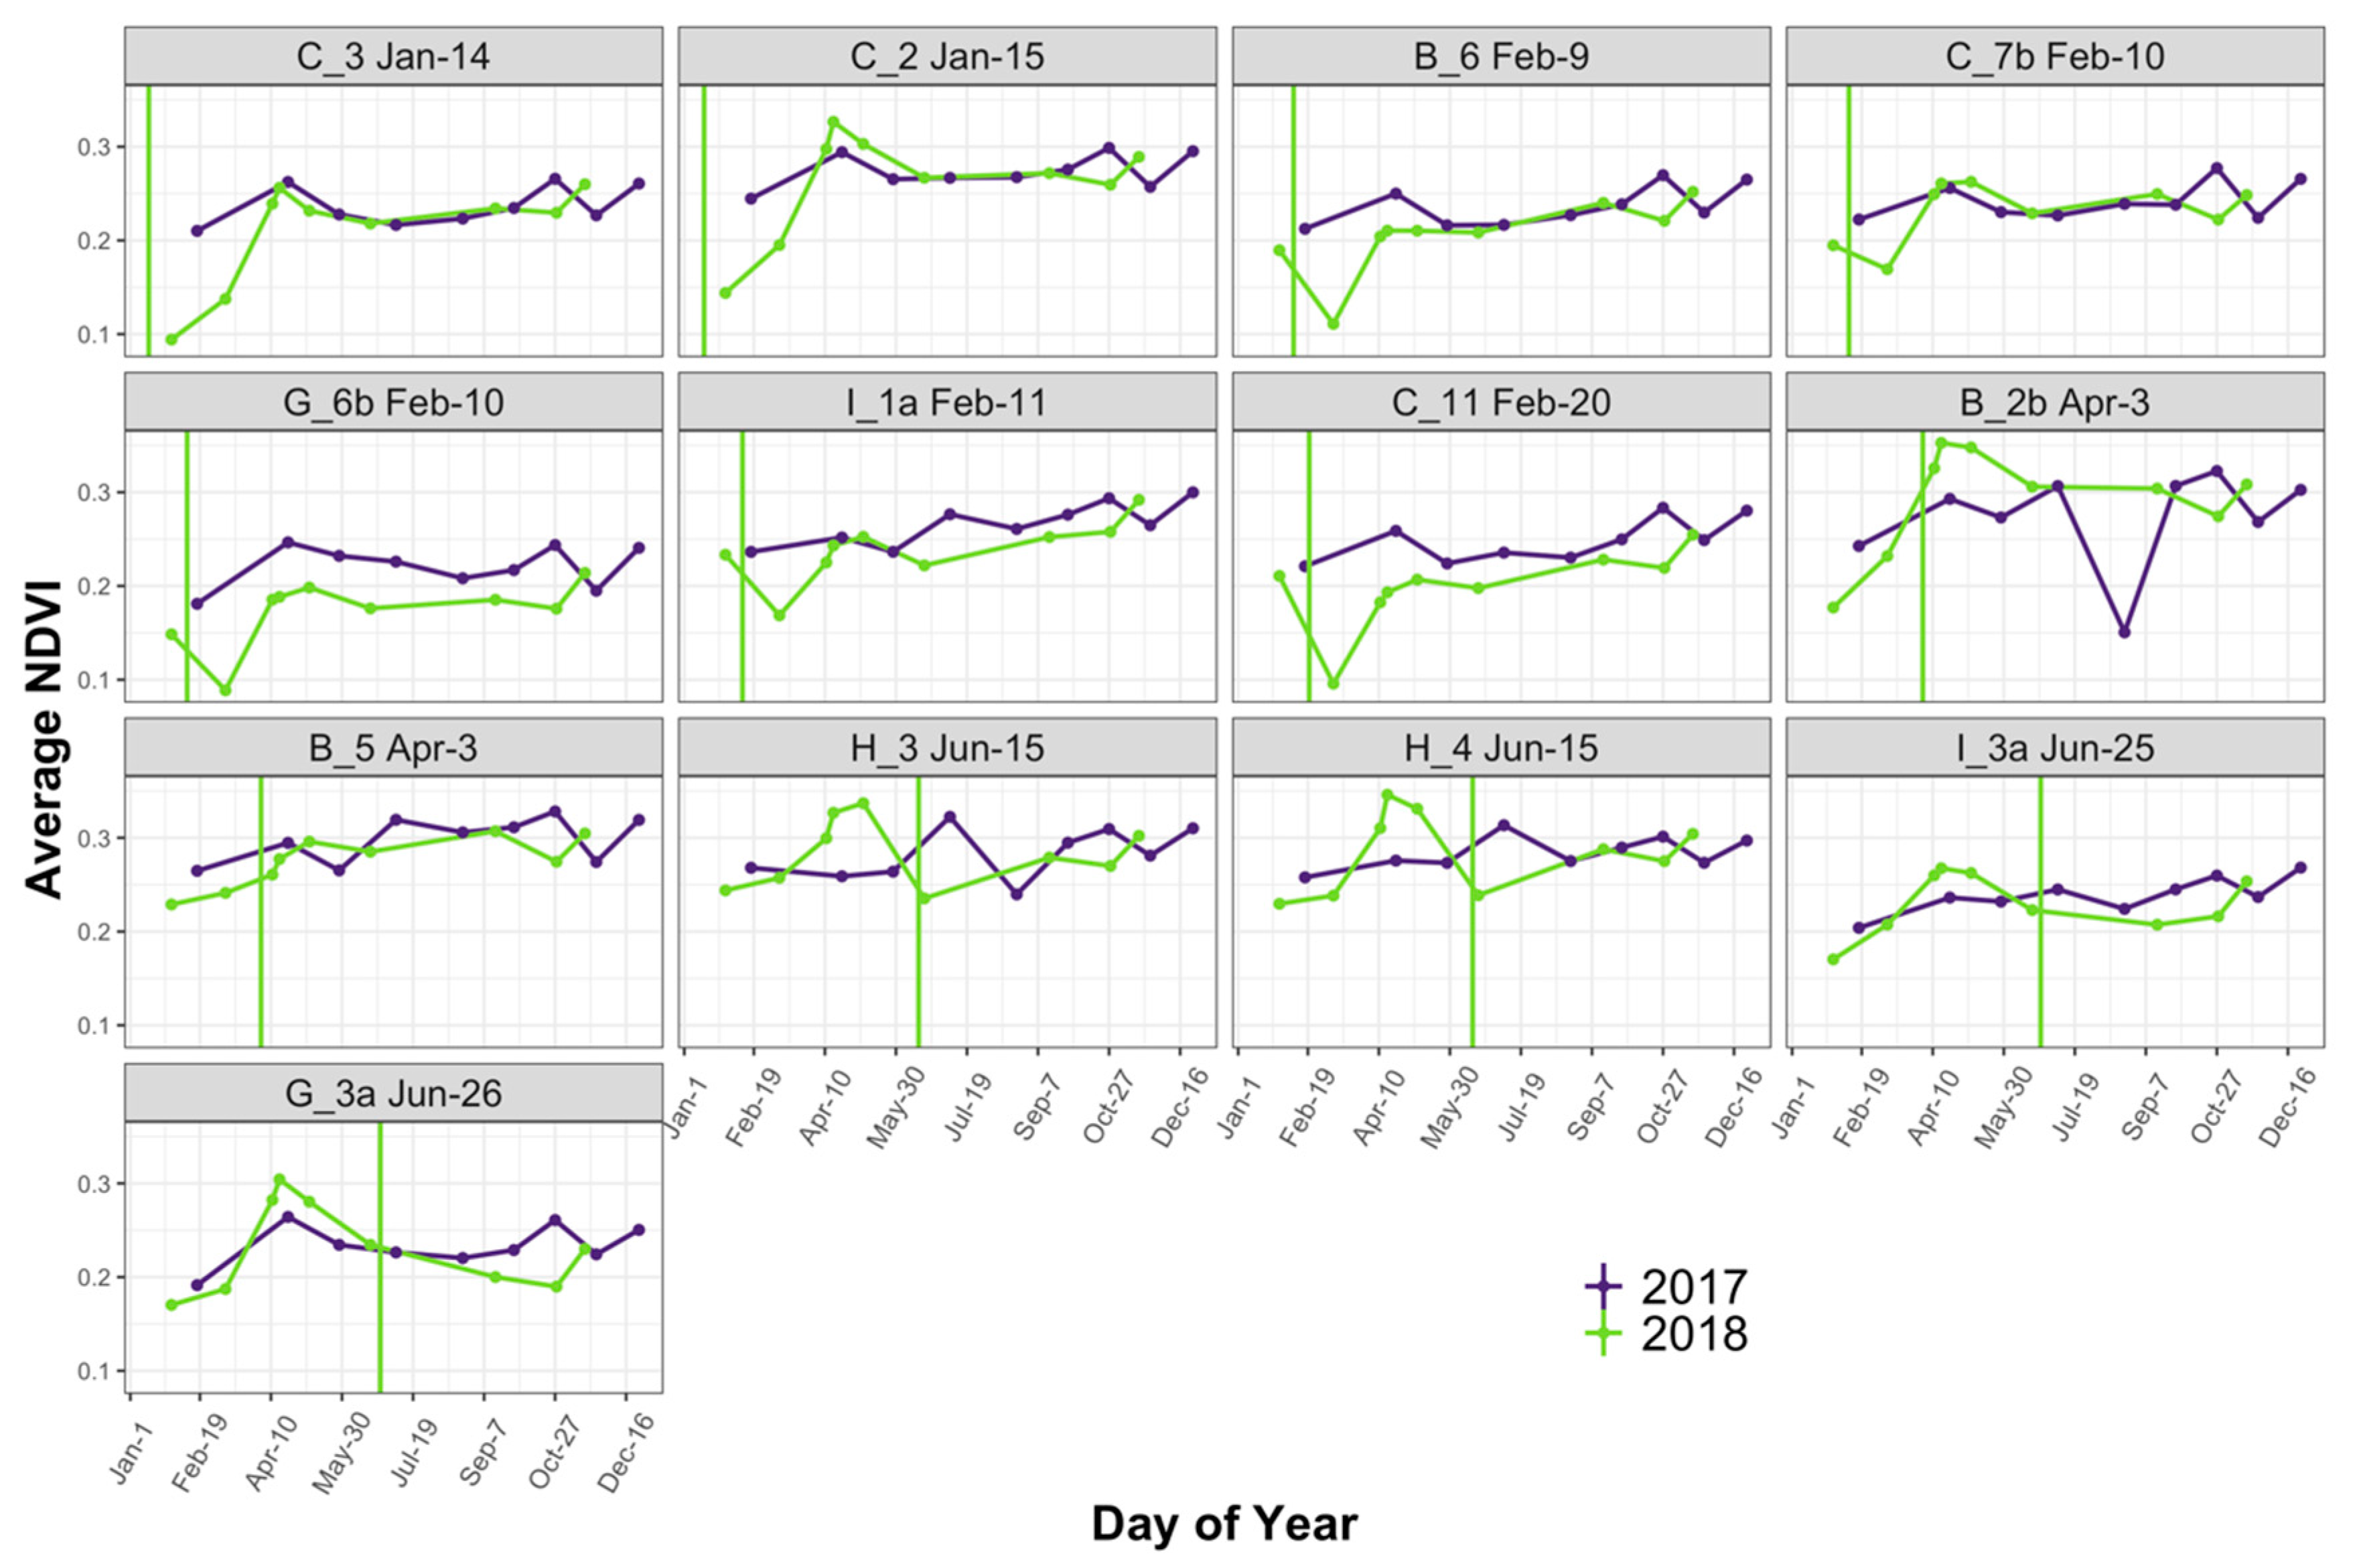
It is possible to discern general patterns in vegetation regrowth in fire-frequented pine savannas using NDVI derived from satellite data. We found similarities in NDVI patterns across burn units in 2017, during which none of our selected units were burned. During the dormant season, particularly January and February, NDVI values were the lowest (approximately 0.2;
Figure 2). Values then increased and peaked at about 0.3 during April when the growing season is thought to begin. In the ensuing five to six months, values dip slightly, though not as low as January values, then rebound in October, and dip again in November. The overall pattern results in two peaks in April and October and two troughs in January and the mid-summer months, including June–August. See
Figure S2 and
Table S1 for graphs of average NDVI patterns and average monthly temperature and total monthly precipitation, respectively.
Although we found that average time-to-vegetation recovery differed by the season of burn, we were unable to precisely identify time-to-vegetation recovery. We were more likely to detect a decrease in NDVI values following the dormant season as compared to growing season fires. NDVI values for burn units that experienced a dormant season burn (January–March) in 2018, including B-6, C-2, C-3, C-7b, C-11, G-6b, and I-1a, dipped initially following fire and recovered after roughly 30 days (
Figure 2). Units that experienced April burns (i.e., B-2b and B-5) had an immediate increase in NDVI values, with recovery after only eight days. NDVI decreased in units H-3 and H-4, which experienced early growing season burns (mid-June), and then gradually recovered, requiring approximately 80 days, although we lacked images on enough cloud-free days to precisely determine time-to-vegetation recovery. Units G-3a, and I-3, which burned during the mid-growing season (late June), also decreased in NDVI following fire, and had similar gradual rates of recovery.
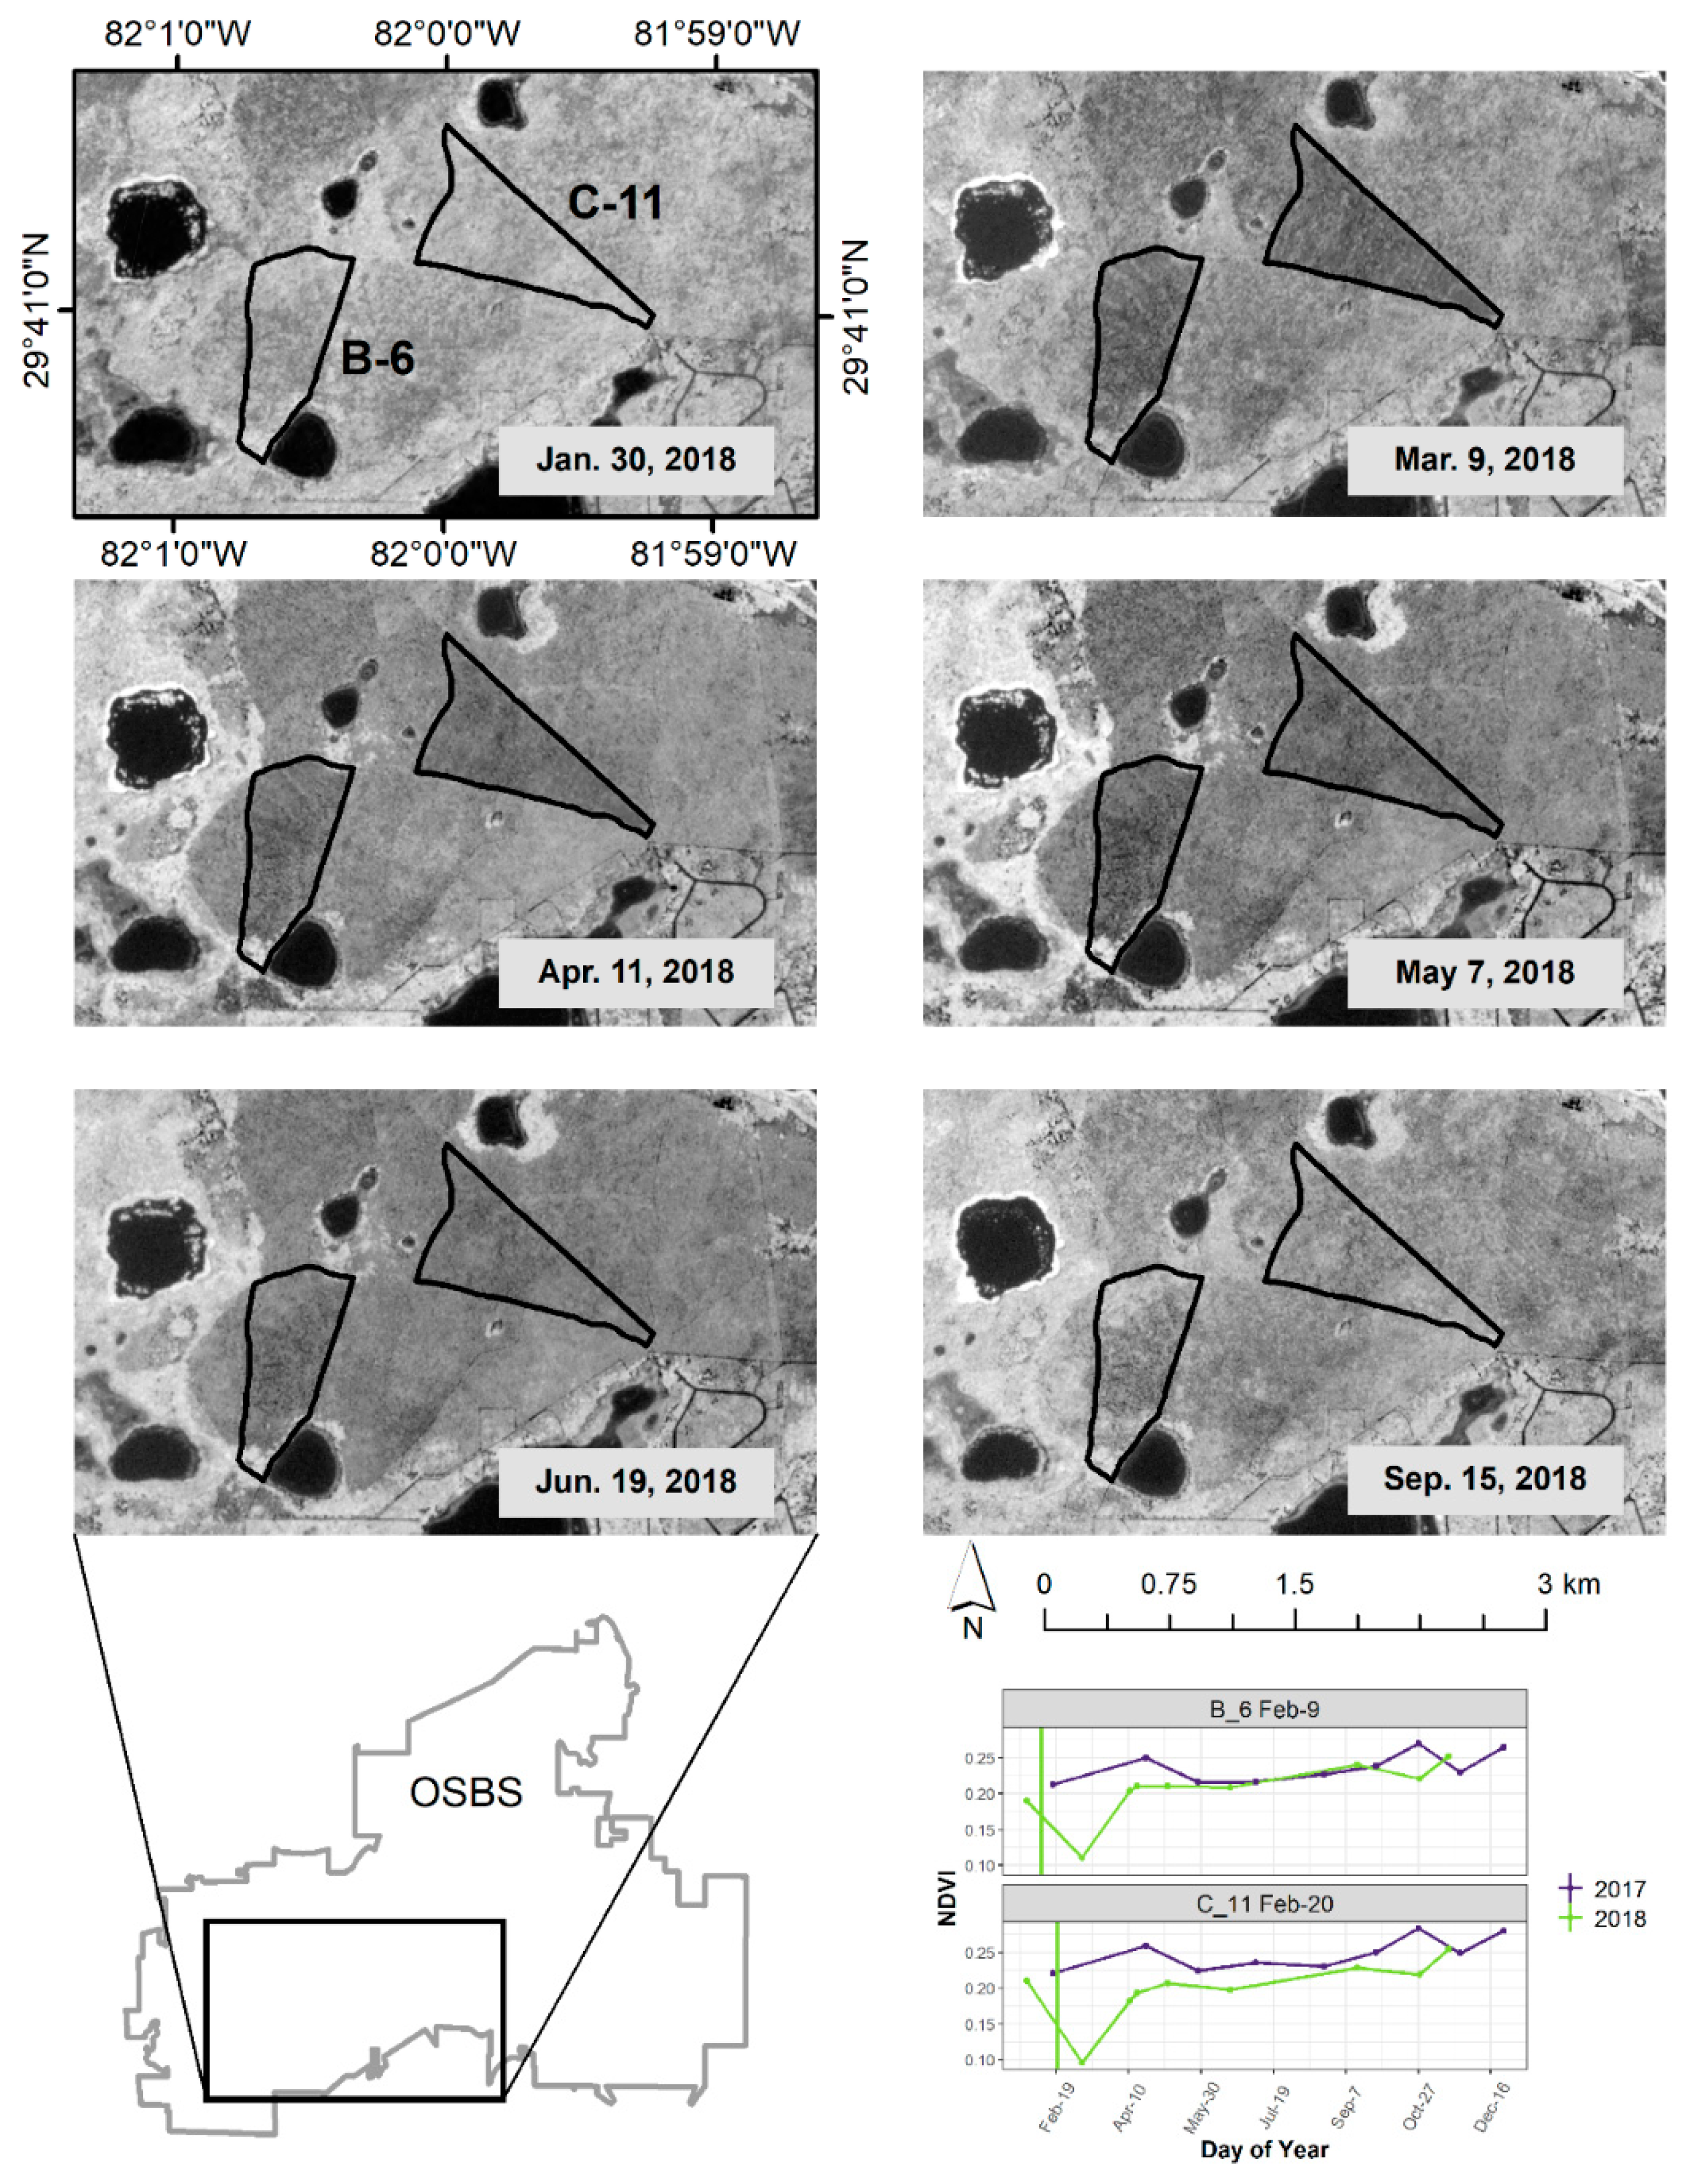
Vegetation changes after fire were evident on NDVI grayscale imagery, indicating that overall patterns of vegetation recovery are detectable (
Figure 3). After a prescribed fire on 9 and 20 February 2018 in burn units B-6 and C-11, respectively, vegetation was absent and charred ground was evident in the following weeks. There was a distinct difference between NDVI imagery on 30 January 2018 (before the burn) and the next NDVI imagery date on 9 March 2018 (after the burn). Following 9 March, vegetation regrew and by 15 September, there was no discernable difference in vegetation between the burn units and the surrounding area.
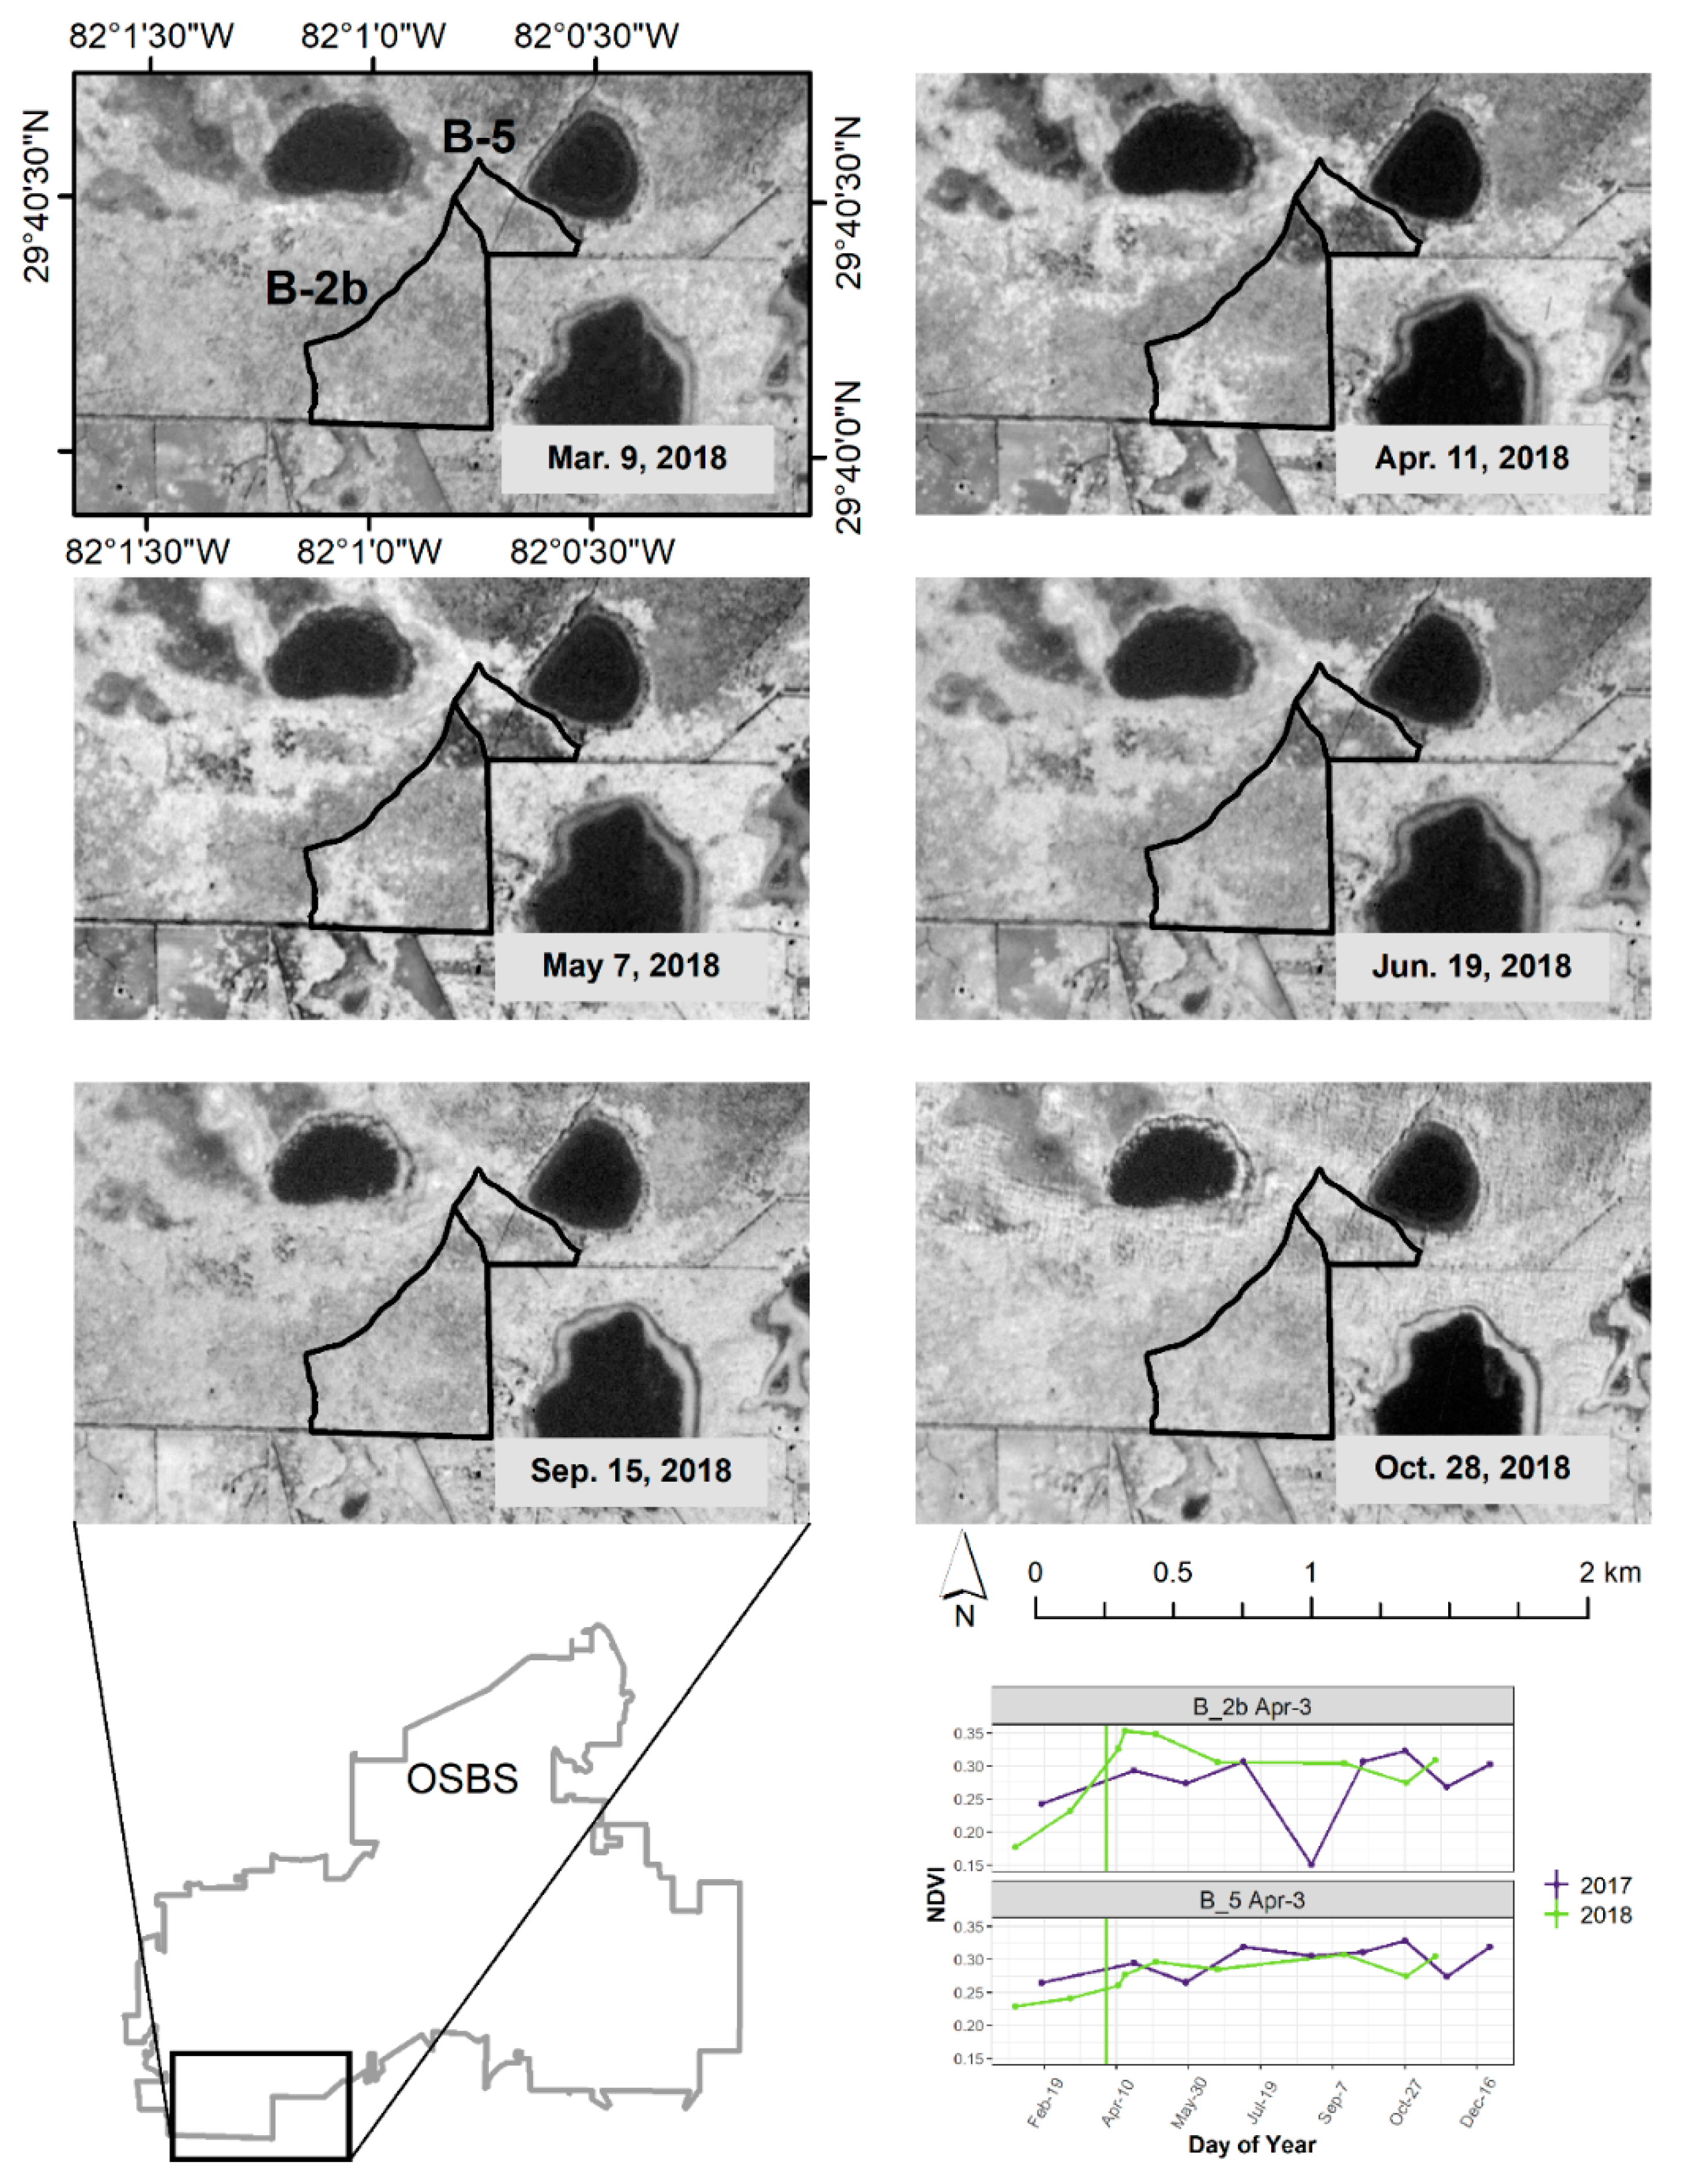
There were some site-related problems with using satellite-derived NDVI for detecting time-to-vegetation recover. A different pattern of regrowth, that contradicted the calculated average NDVI values, was observed on the imagery for burn units B-2b and B-5 (
Figure 4). After a prescribed fire on 3 April 2018, charred areas were apparent in sections of both burn units even though average NDVI values increased instead of decreasing following the fire. Similar to
Figure 3, there was a distinct difference between images before (March 9) and after (April 11) the fire, with charred areas apparent. Following the fire, char lingered for the next two months (until June) when vegetation recovered and appeared similar to neighboring plots around October. Unlike
Figure 3, NDVI grayscale imagery also revealed heterogeneous burns across units B-2b and B-5. Only the northernmost portion of unit B-2b appeared to have burned, which we later leaned was the result of halting fire operations to reduce smoke impacts on the day of the prescribed burn. Unit B-5 also had unburned sections in the northern corner and along the north-northeast border, which corresponds with a subtle (approximately 20 m) increase in elevation and an associated increase in hardwood trees, including oaks.
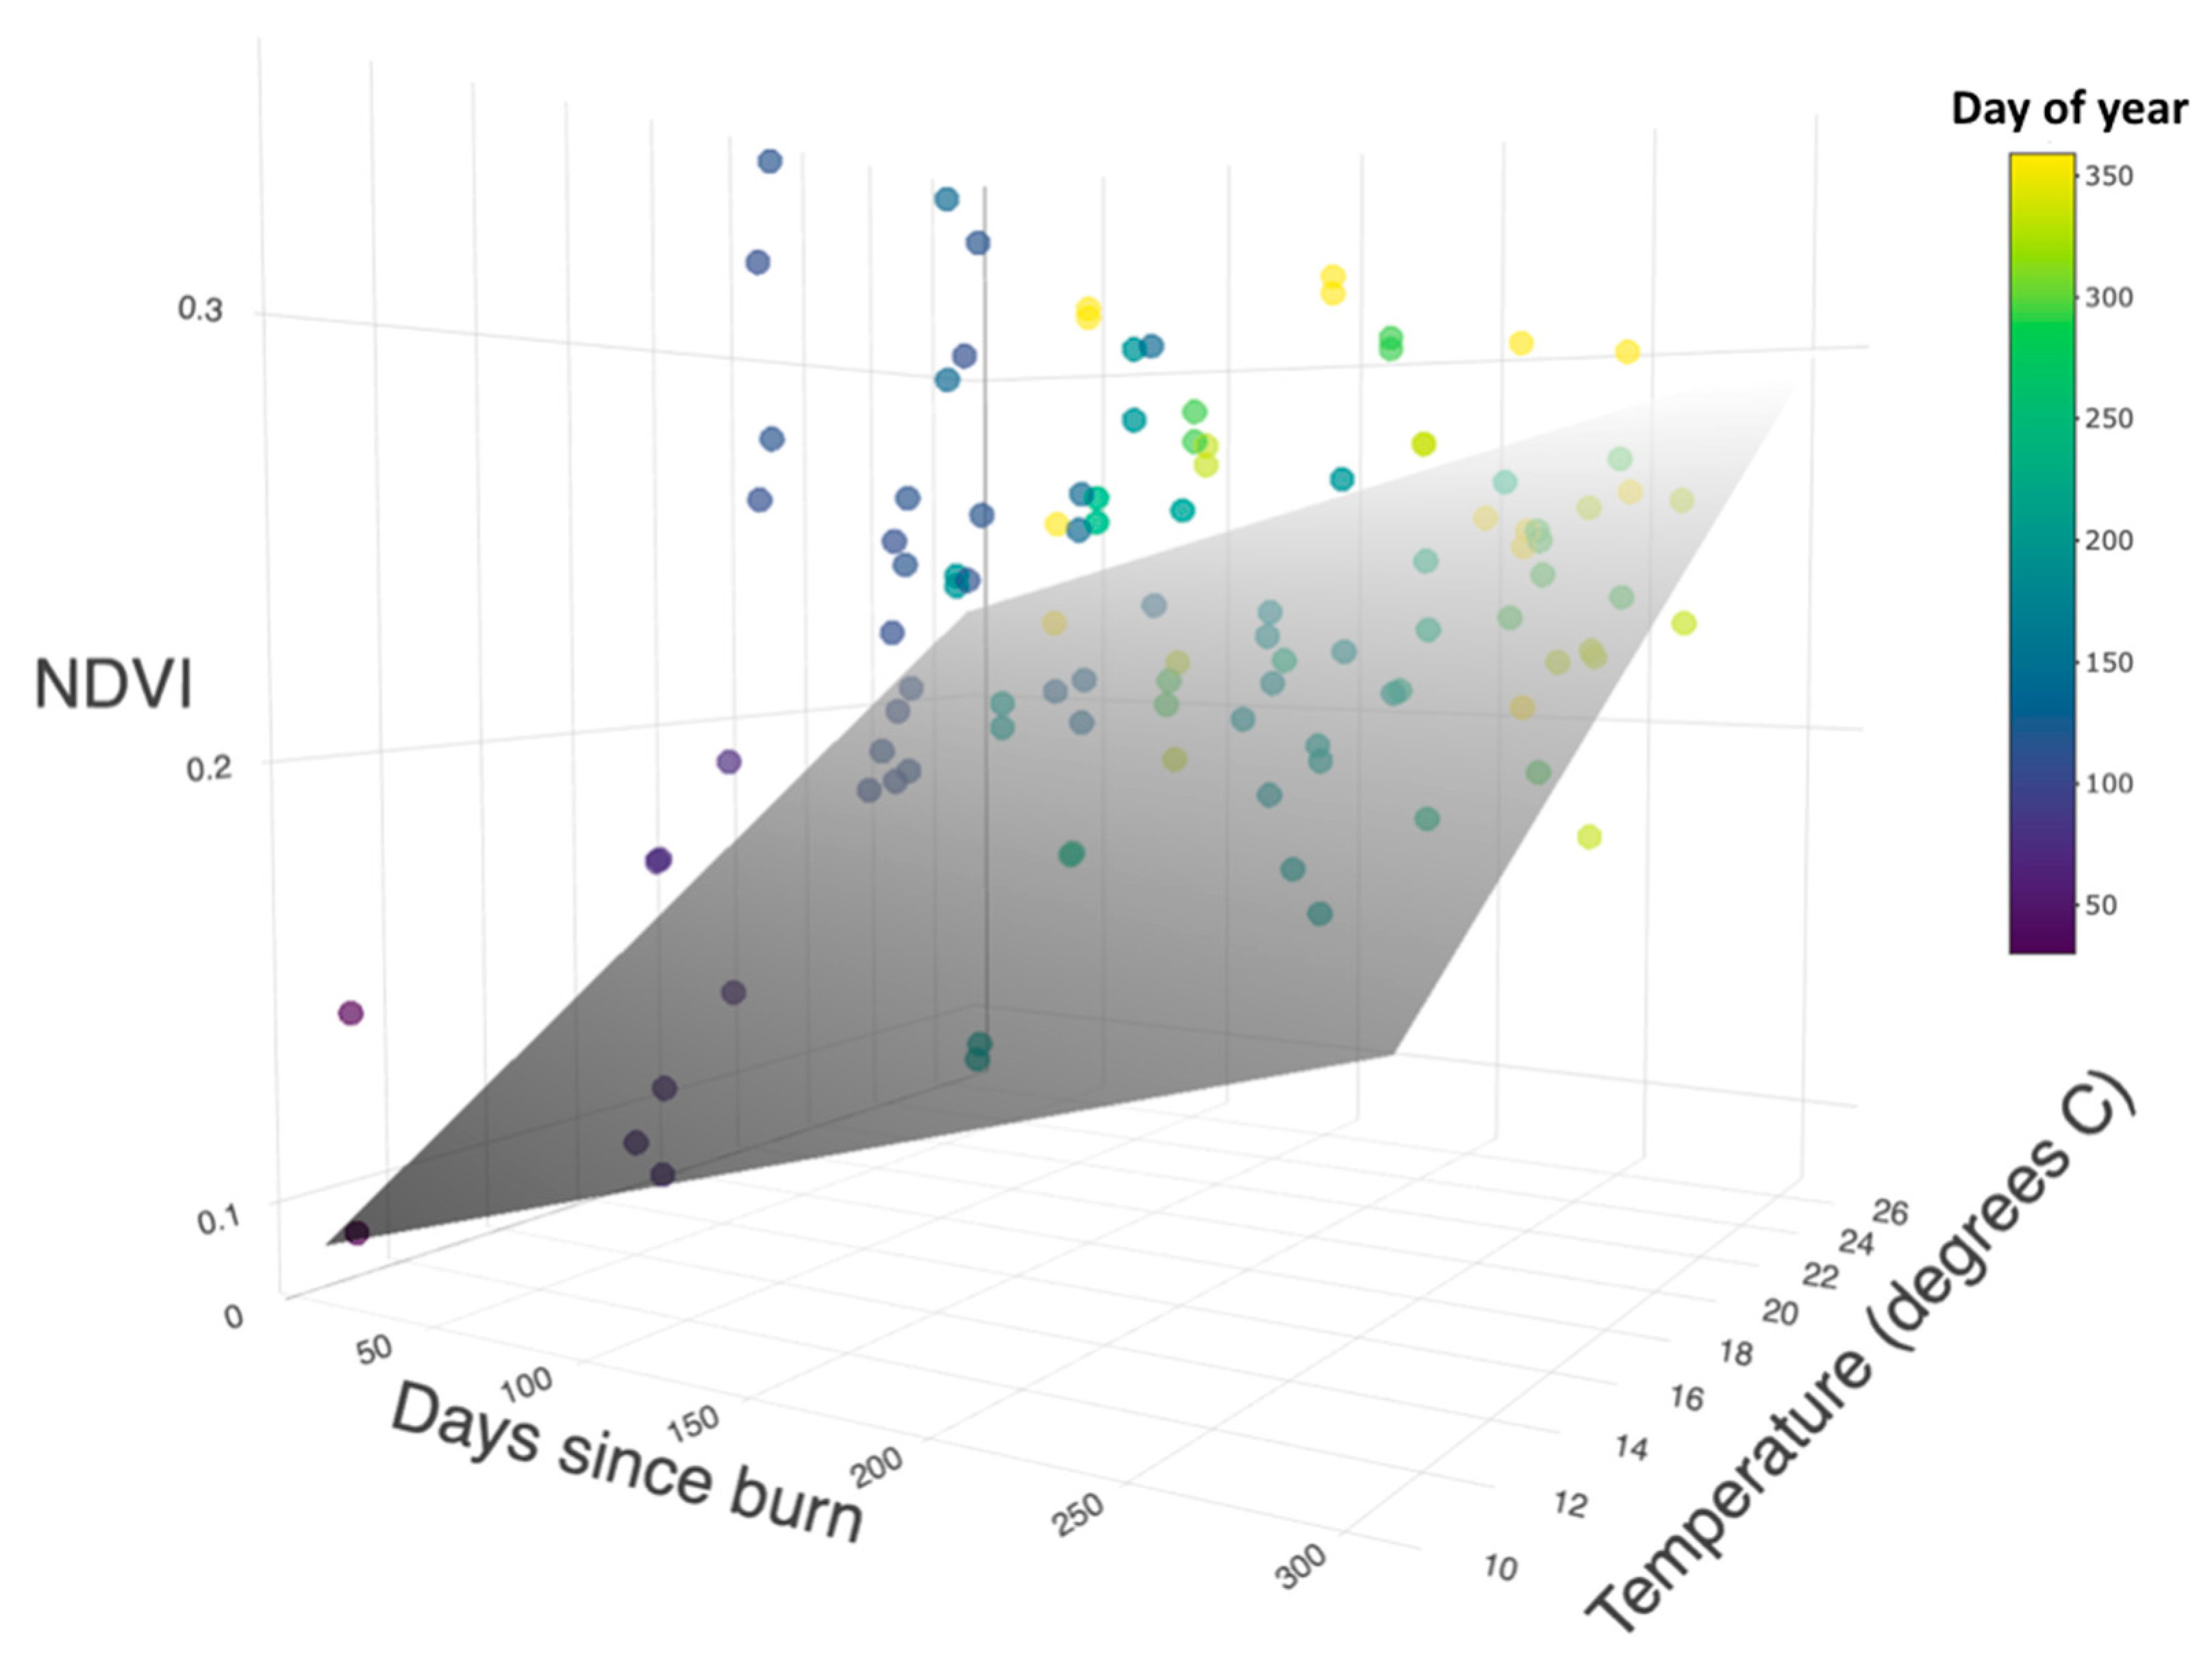
NDVI was affected by days-since-burn and climatic conditions, albeit the trends were subtle (
Figure 5;
p < 0.001; R
2 = 0.110). Although NDVI increased with time since the last prescribed fire as expected (
p < 0.001), it was also significantly affected by temperature (
p = 0.003). At higher temperatures, NDVI increased at a faster rate. Vegetation recovery was delayed when temperatures were low. Although not significant in the analysis, it should be noted that high temperatures during the mid- to late-growing season are accompanied by daily precipitation events, making it difficult to decouple the two during most of the season [
18]. Additionally, in two burn units, B-2b and H-3, there were significant dips in NDVI during late August/early September of 2017 (
Figure S2). These dips corresponded to an abrupt decrease in total precipitation during these months, highlighting that some units might be more sensitive to one weather parameter over another.
4. Discussion
In savannas, remote sensing has been widely used at the landscape level to detect overall differences in stand structure resulting from management practices [
30,
31]. In contrast, data needed at small temporal and spatial scales are often collected using time-intensive measurements of shrub and tree height or expensive ground-based imagery, because vegetation recovery after fire is swift in these ecosystems [
14,
32,
33]. Our study shows that NDVI values derived from satellite imagery could be used to gain ecological information in pine savannas where a high temporal resolution is needed to accurately detect differences, although there are still some challenges to overcome.
Growing season weather increased the time-to-vegetation recovery, but also limited the availability of satellite images. For most of the burn units, we detected a clear decrease in NDVI following fire, and vegetation recovery took much longer after burning in the dormant as compared to the early growing season. This pattern was likely affected by weather, with warmer temperatures promoting faster plant growth. Although general trends of vegetation recovery were discernable from the satellite imagery, we were not able to collect images on enough days to precisely determine when the vegetation had returned to pre-fire values. During the mid-growing season, in particular, daily precipitation was accompanied by cloud cover, thereby obscuring our range of interest on nearly every day. This time period also corresponded with the most rapid vegetation growth when the time-to-recovery should have been the shortest, and our need for imagery was the greatest. Despite this drawback, our results were similar to those of another study in xeric, pine savannas that found that NDVI increased quickly after spring, growing season fires [
14].
Our calculated values of NDVI were skewed by fire heterogeneity, which should vary by season and weather conditions on the day of the burn, among other factors. Visual inspection of satellite imagery revealed that combining NDVI values over an entire burn unit after a heterogeneous fire may cause high variation and consequently inflate the average NDVI value. In contrast, during the dry, dormant season, fuel moisture is low, increasing the probability that fires will burn across larger, contiguous areas through the understory [
34]. This should result in similar NDVI cell values within a burn unit and low variation among burned areas. To account for fire heterogeneity, we recommend dividing a burn unit into smaller subunits and ground truthing, which our study lacked, to estimate fire heterogeneity. Alternatively, vegetation recovery could be defined as the point in time when the variation in NDVI reaches pre-fire or non-fire year levels.
NDVI should not be averaged across a burn unit given that variation in canopy openness affects values. Since NDVI is indiscriminate, any trees or large shrubs not consumed by low-intensity fire will contribute higher greenness values [
16], especially during warm, wet months when vegetation is actively growing. Many savanna fires are low-intensity and remain in the understory, having little to no effect on the canopies of mature pines [
35,
36]. Thus, we mostly selected burn units that had few overstory trees. Patches in one of our study units had subtle changes in topography that likely promoted oaks and other species known to suppress fires via multiple mechanisms [
37,
38,
39]. Even if the conditions had been ideal (e.g., low fuel moisture) for fire to spread through the understory in these patches, it is unlikely to be detectable by NDVI during the growing season when oak canopies are fully developed [
15].
Our results highlight important considerations for using satellite imagery in fire-frequented habitats, especially when a small temporal scale is needed. Even if sparse-canopy sites are selected, fire heterogeneity and variation across the landscape can inflate NDVI values. Although we were unable to gather images on enough cloud-free days to precisely determine how the fire season affects vegetation recovery, we did uncover some broad patterns and provide suggestions for researchers attempting these methods in the future. As the temporal and spatial scope of satellite imagery increases, its application and reliability will also likely increase.
5. Conclusions
Despite its limitations, this study highlights a potential use for NDVI derived from satellite imagery in fire-frequented habitats that experience rapid vegetation recovery, such as in tropical and subtropical savannas. We were unable to precisely measure vegetation recovery in this study because of high fire heterogeneity, which often interacts with environmental heterogeneity, and frequent cloud cover, which limited the availability of images. Despite this, we were still able to conclude that vegetation recovers faster after growing as compared to dormant season fires. With a finer spatial and temporal scale, time-to-vegetation recovery could feasibly be observed remotely in ecosystems with sparse canopy trees, and thus reduce the time and effort typically expended collecting data in the field. We encourage future studies that build on these results and directly map fire intensity at sub-pixel resolution to examine fire heterogeneity across burn units varying in canopy cover and topography. As satellite imagery and our capacity to process it advances, the applications of NDVI to monitor and model natural ecosystems will only improve and expand, allowing us to better manage our forests for the future.


