1. Introduction
The presence of the invasive tree species in our environment is a fact and demands concern regarding their impact on the ecosystem properties and functions, since the invasion of alien species reduces local plant species diversity. In Slovenia, there are more than 180 different alien plant species identified, and approximately 40 of them are invasive. According to the latest research, approximately 25 species can be used for various purposes [
1,
2,
3,
4]. More than half of these species are woody and can be found as trees or shrubs [
2,
3,
5]. Some of them were originally planted in parks and urban environments, but their growth eventually became uncontrolled, and nowadays they are considered as invasive species.
The usability of these species is not well known, and most of them are considered as undervalued and underutilized [
6,
7], while some of them are often used as biomass for energy production [
8,
9]. The basic information concerning anatomy, physical-mechanical properties, machinability, gluing properties and durability has to be provided to use these woods in the most appropriate way in new (high value) products and not only in traditionally wooden ones.
In the previous years, black locust wood (
Robinia pseudoacacia L) was included in the European subsidizing program of tree species cultivation. A large quantity of this species is therefore going to be harvested in the forthcoming years [
10], and knowledge concerning the machining properties and processing parameters of these less (or not commonly) utilized wood species are going to be crucial for further utilization.
As stated by Porankiewicz [
11], not much attention has been paid so far to the study of the machinability of black locust, as an interesting wood species (recently used for parquet production), and the reason for that oversight might be the limited lumber supply of this species. Usta et al. [
12] investigated the influence of a preparative process at a relatively early stage in the planing process of black locust and European oak (
Quercus petraea (Mattu.) Lieble.) and concluded that the surface roughness decreases when the feed rate and cutting depth decreases, but further investigations need to fully elucidate the machinability of this species by examining different preparative parameters to optimize the planing process.
Réh [
13] studied the usability of decorative veneer made from lesser known and lesser used hardwoods (black locust, black walnut, tree of heaven), stating that the lesser known (and used) hardwoods are suitable for application in the furniture industry since the quality of veneer does not differ from the commonly used veneers.
The quality of the wood surface can be characterized by surface irregularities or surface roughness. Besides machining, wood properties, structure and variability also affect the wood surface quality, and thus it is quite a demanding task to determine the wood surface roughness. Data on the quality of machining for a particular tree species is critical and should be available to every producer of wooden products. Many machining tests have recently been done for various exotic and non-traditional tree species [
14,
15,
16,
17,
18]. In some cases, the quality of the machined surface can significantly affect the quality of the surface coatings as well as the quality of the bonded connection [
19,
20]. The fact is that the quality of the machined surface also depends on technological parameters of the machining, where optimal technological parameters such as feed rate and chip thickness exist for each tree species, as well as geometrical parameters of tools such as rake angle [
21,
22,
23,
24], but there is also a positive influence of wood thermal modification on the machining properties [
25,
26,
27].
Several different methods that are used for checking the roughness of other materials have already been tested on wood surface. These are contact (stylus, pneumatic, acoustic emission) or non-contact (optical light sectioning and image analysis using video camera) methods [
28,
29]. The stylus instrument mechanically measures the surface profile in the selected area, but several researchers report that some significant parameters are still not fully explained and understood when analyzing the wood surface [
12,
30,
31]. However, only gross comparison is possible using these methods, and specific information about the surface is not quantifiable [
30]. There is no unique parameter that is able to describe the quality of the wood surface [
32] and there is no commercially available device to be used specifically for wood surface measurement.
The presented research provides information about the basic and most commonly used machining tests under planing, routing and turning of the five most common invasive wood species in Slovenia, i.e., black locust (Robinia pseudoacacia L.), boxelder maple (Acer negundo L.), horse chestnut (Aesculus hippocastanum), honey locust (Gleditsia triacanthos) and tree of heaven (Ailanthus altissima). Testing is performed under different technological conditions, and statistical analysis of the dependence of the quality of machining under different conditions as well as the dependence between individual types of machining is made. The obtained data should form the basis for the usefulness of the tested tree species in every producer of wooden products.
2. Materials and Methods
The machining tests were made in accordance with the American Society for Testing and Materials (ASTM) D1666-17 [
33] standard, where some parts of the standard were modified. The standard prescribes 50 samples for each tree species, but due to a lack of material, only 20 samples were taken for each tree species. For each tree species, four to five trees with the diameter from 20 to 40 cm were cut, and from each trunk, four to five boards were taken.
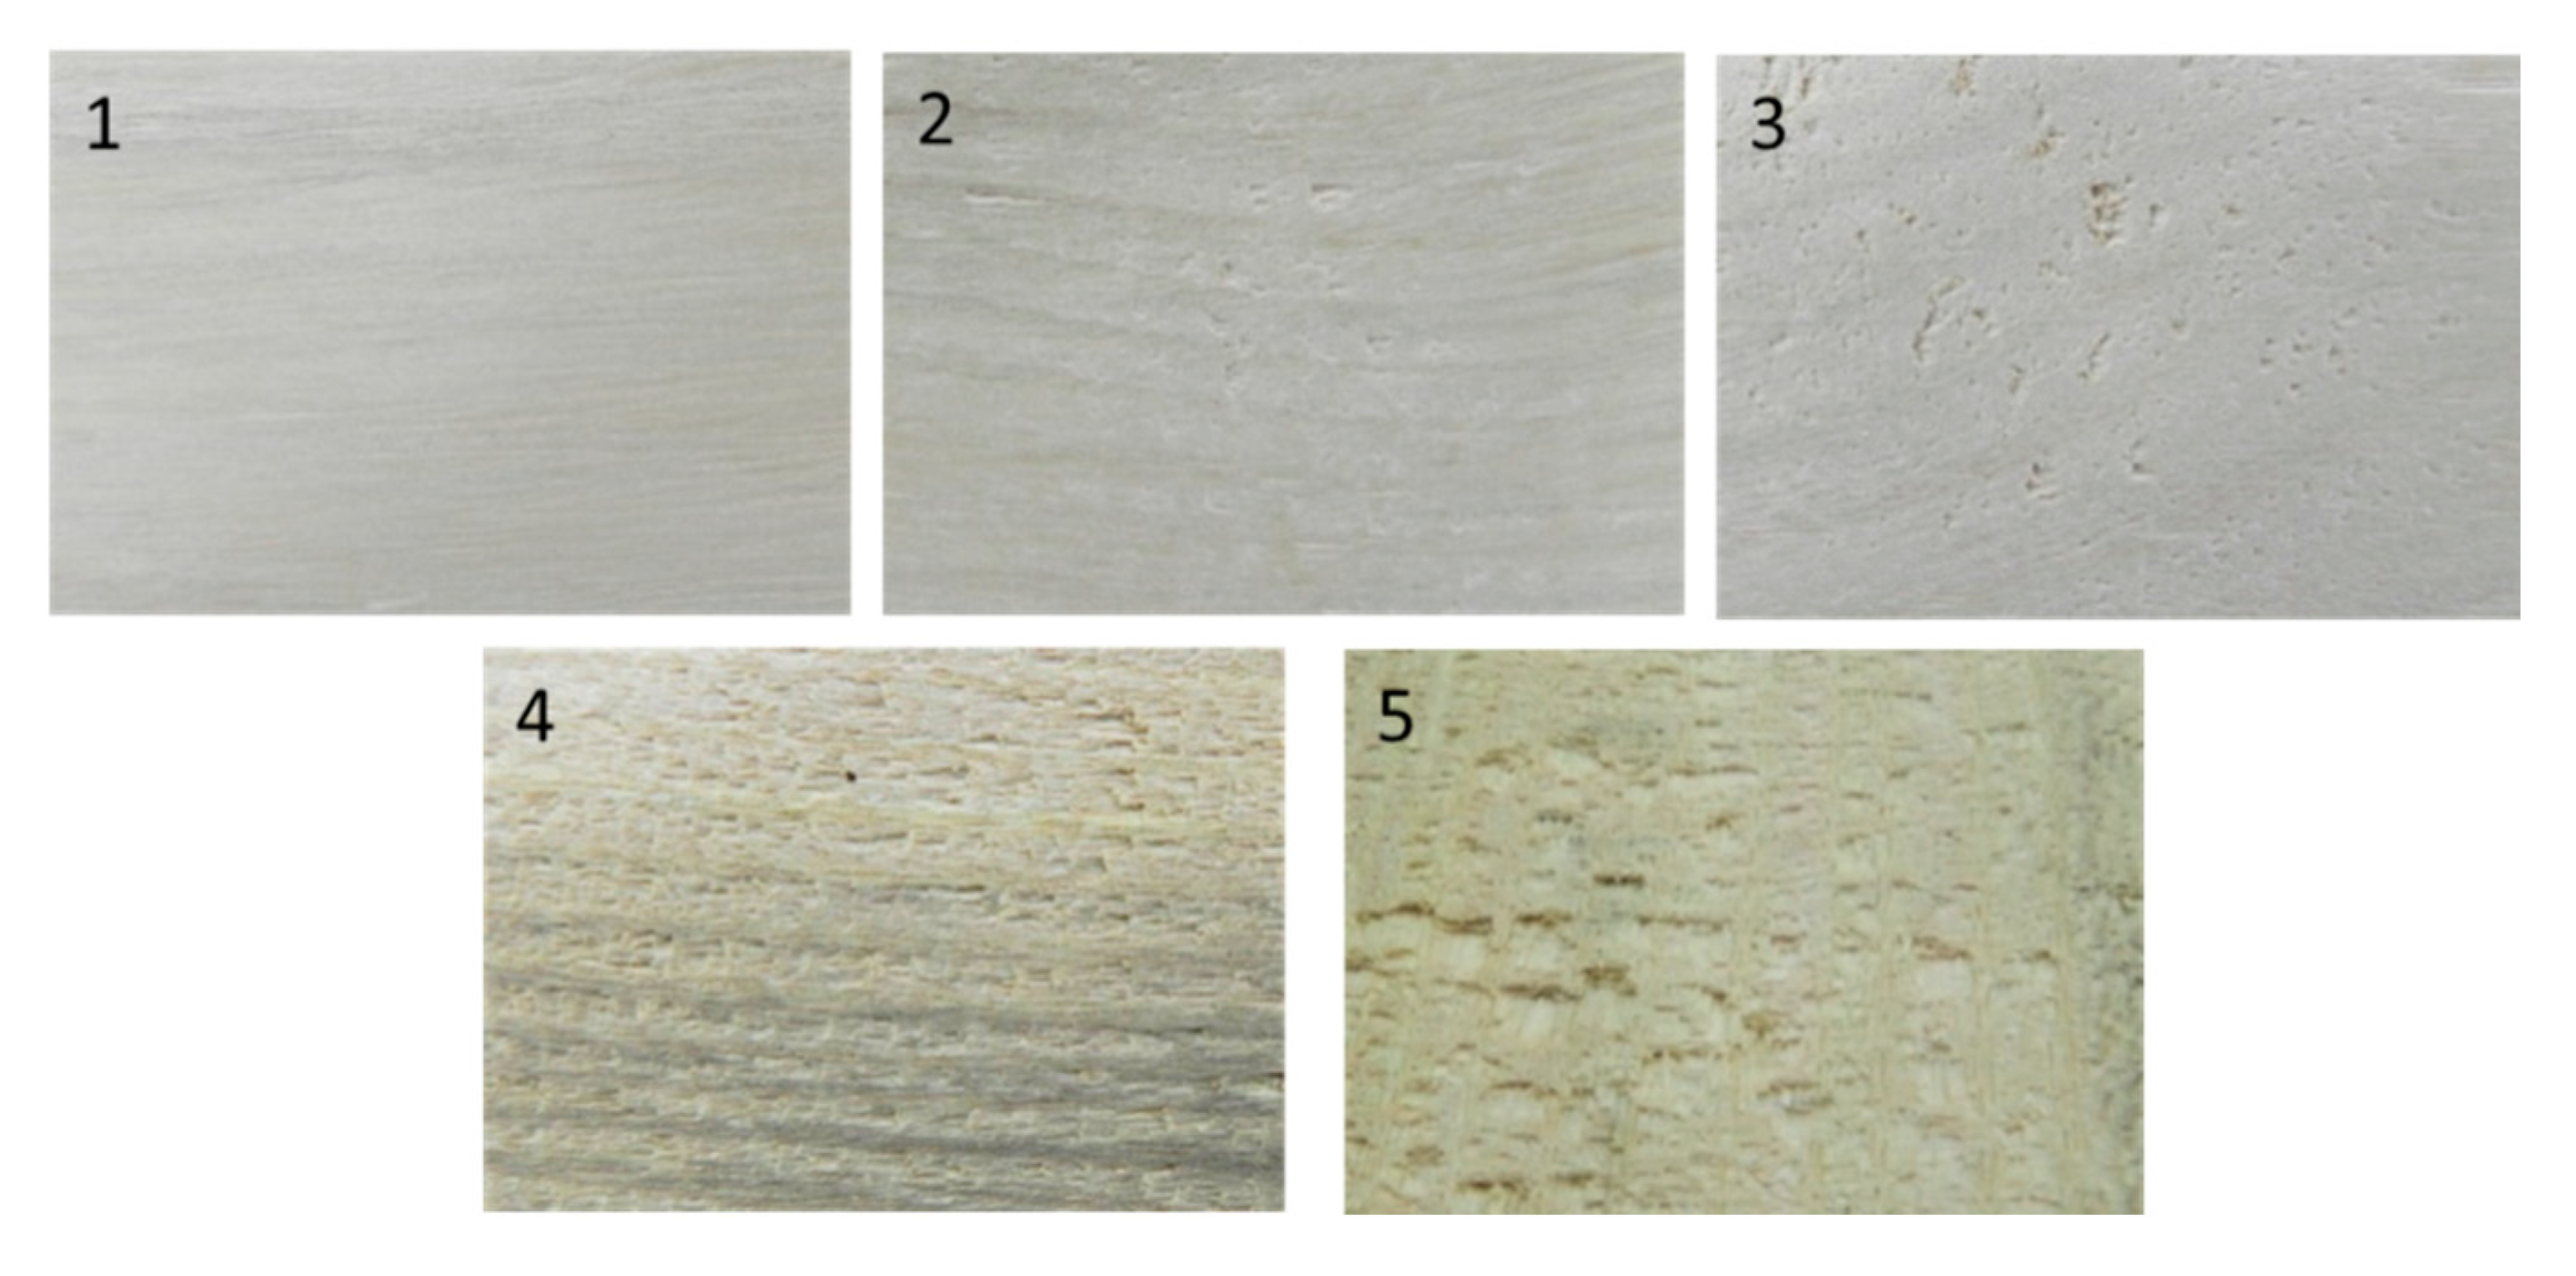
Clear boards (without visual defects) with the dimensions of: 1300 × 135 × 25 mm, were conditioned at the temperature and relative humidity of 20 °C and 65% respectively, and then their density was determined. From each board, one sample was prepared for planing, one for routing and two samples for turning, according to the ASTM D1666 (2017) standard. After planning, routing and turning, visual examination of the machined surface was made by 3 experienced researchers with 20 to 30 years of experience. According to the surface quality, each surface was evaluated with the following grades: Grade 1—excellent, Grade 2—good, Grade 3—fair, Grade 4—poor and Grade 5—very poor. For each machining operation and each tree species, an average grade was determined, and according to the ASTM D1666 (2017) standard, the percentage of specimens with the Grades 1, 2 and 3 was calculated.
The significant differences of grades at different feed rates were verified by the analysis of variance (ANOVA) (F-test) analysis using SPSS software, where 5% was taken for the level of significance (p-value). In the case that the relationship between individual values could not be determined by the basic ANOVA analysis, an additional LSD (least significant difference) statistical analysis was performed with the same level of significance of 5%.
2.1. Planing
For planing, the dimensions of the 20 samples for each species with radial or tangential texture were 900 × 102 × 19 mm. Planing was performed by means of the thicknessing machine, using 4 freshly sharpened HSS (high speed steel) knives with the rake angle of 30°, revolution speed of 4500 rpm and feeding speeds of 5, 8, 12 and 18 m/min, where the thickness of the cut amounted to 1.6 mm. With these conditions, feed per tooth amounted to 0.28, 0.44, 0.67 and 1 mm. Half of the specimens were fed into the machine with the grain and half against the grain.
Since the knives were not jointed on the spindle, it was impossible to achieve that all the knives would be on the same cutting circle. In our case, one knife had a 0.01 mm bigger cutting diameter, which resulted in the single knife finish. Considering this, the knife marks were 1.1, 1.8, 2.7 and 4 mm.
After planing, a visual examination for raised, fuzzy and torn grain was made. The percentage of specimens with the Grade 1 was determined, and the average grade for each tree species was calculated.
2.2. Routing
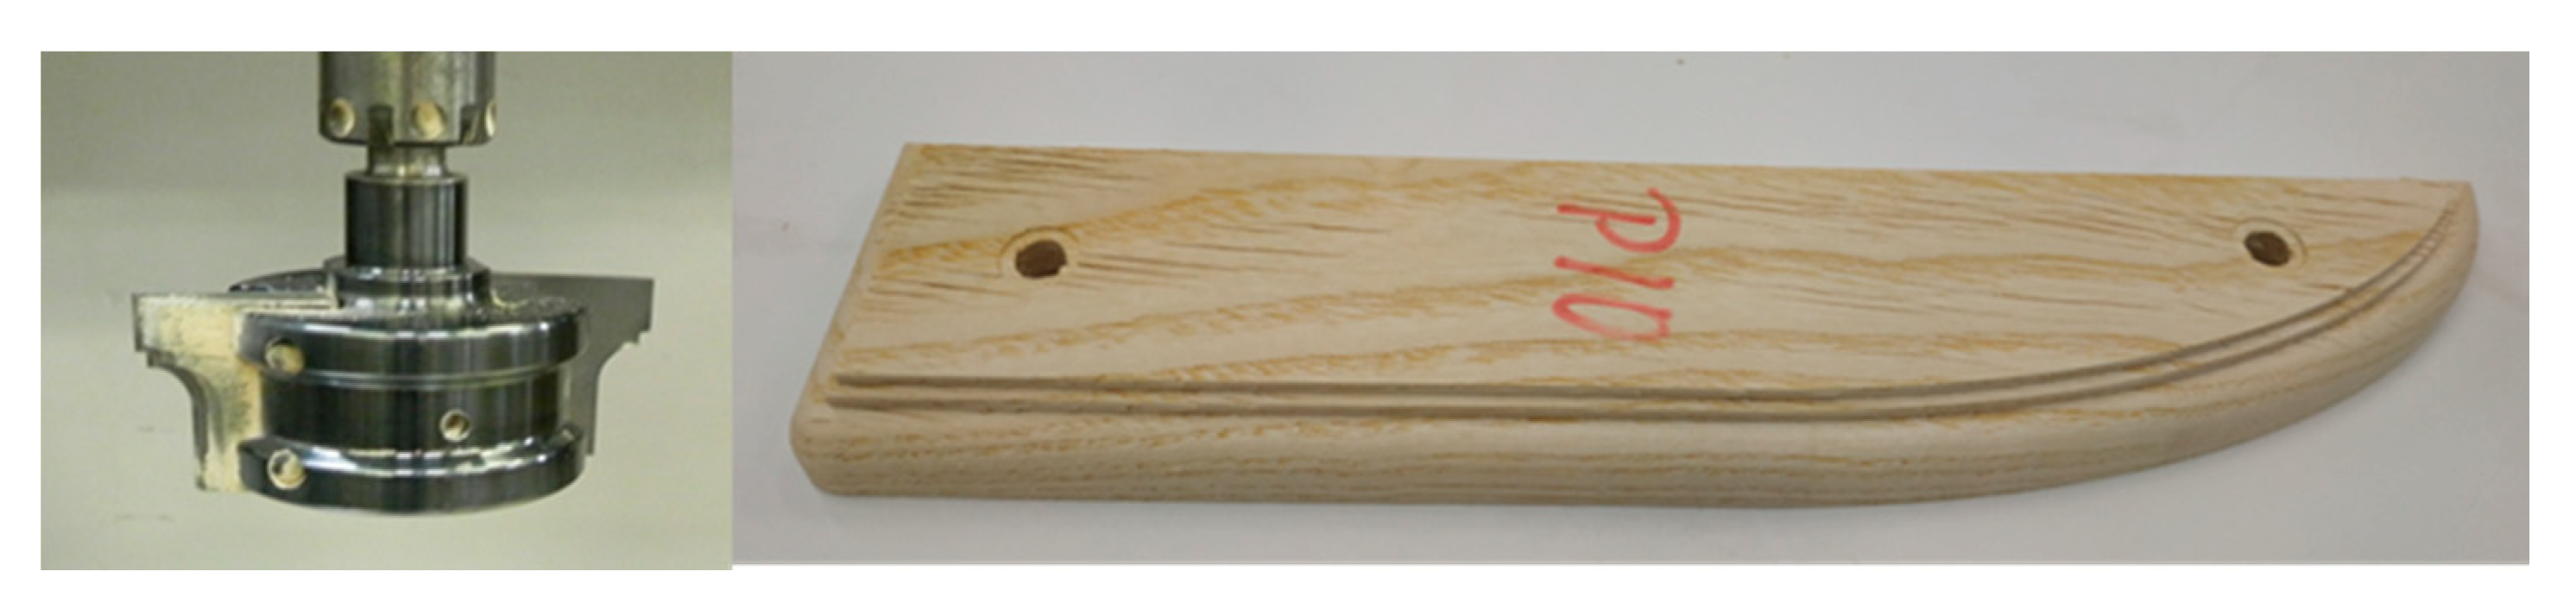
20 routing samples for each tree species with radial or tangential texture had the dimensions of 305 × 76 × 19 mm. First, a preliminary roughing cut was made with the router to approximate the shape (
Figure 1). Then, the second roughing cut was made to remove any damages made in the first cut, whereupon a final finishing cut was made, where the thickness of the cut was 1.6 mm. The edge of the specimen was parallel for half of their length, while the remainder of the length was parabola (
Figure 1). The spindle speed of the router and feed speed amounted to 8000 rpm and 3000 mm/min respectively, where the milling head had 2 knives.
The side and end grain surfaces were graded for raised, fuzzy, chipped grain and roughness of end grain milling. The percentage of specimens with the Grades 1 and 2 was determined and the average grade for each tree species was calculated.
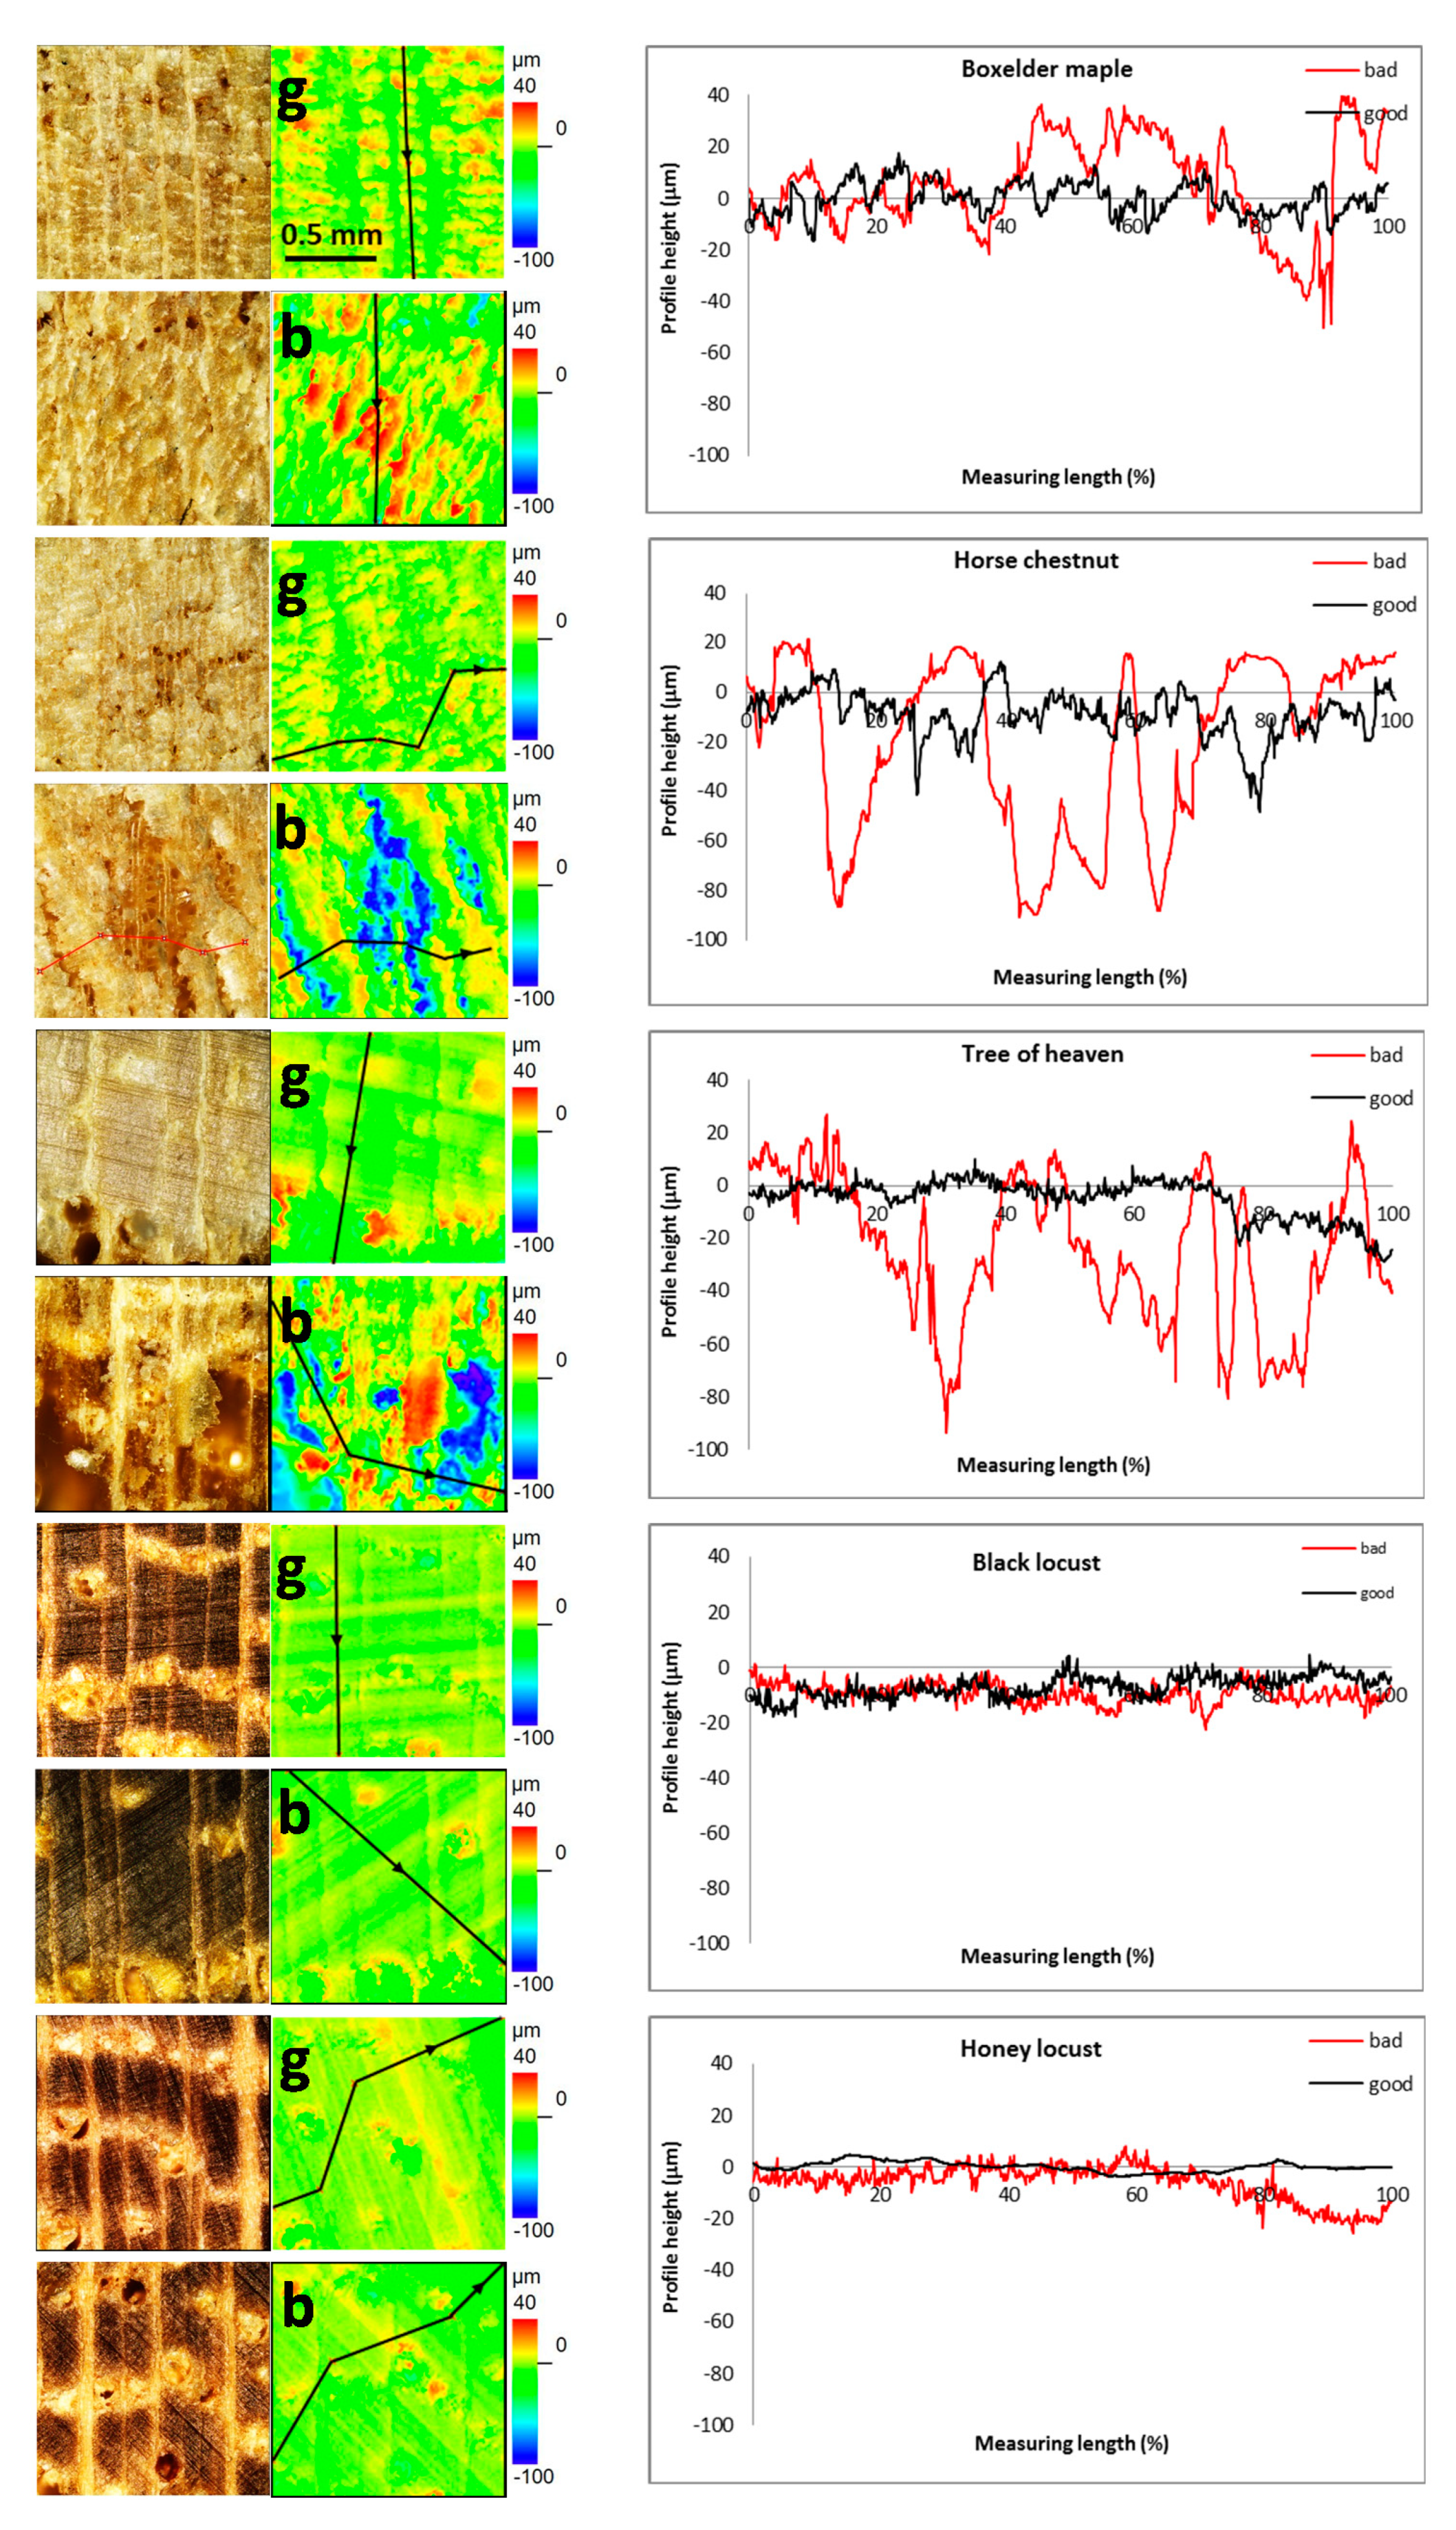
End grain routing is known as problematic because the surface quality is usually much lower than in the side grain routing, especially when the same routing cutter is used. For comparative purposes, one representative sample of end grain surface for a poor-quality surface and one for a good one for each tree species were taken for detailed surface laser examination. Their surfaces were measured with a Measuring Laser Microscope Olympus LEXT 3D OLS5000, where optical camera and laser scans were performed to evaluate surface roughness. To determine the area surface parameters, an area with small lumen diameters was selected, since lumens with high diameters can significantly influence the roughness parameter calculation as a quasi-chipped area. In each measured area, a representative profile for calculating the profile roughness parameters was also determined based on subjective assessment, where we also tried to avoid large lumen of the wood cells.
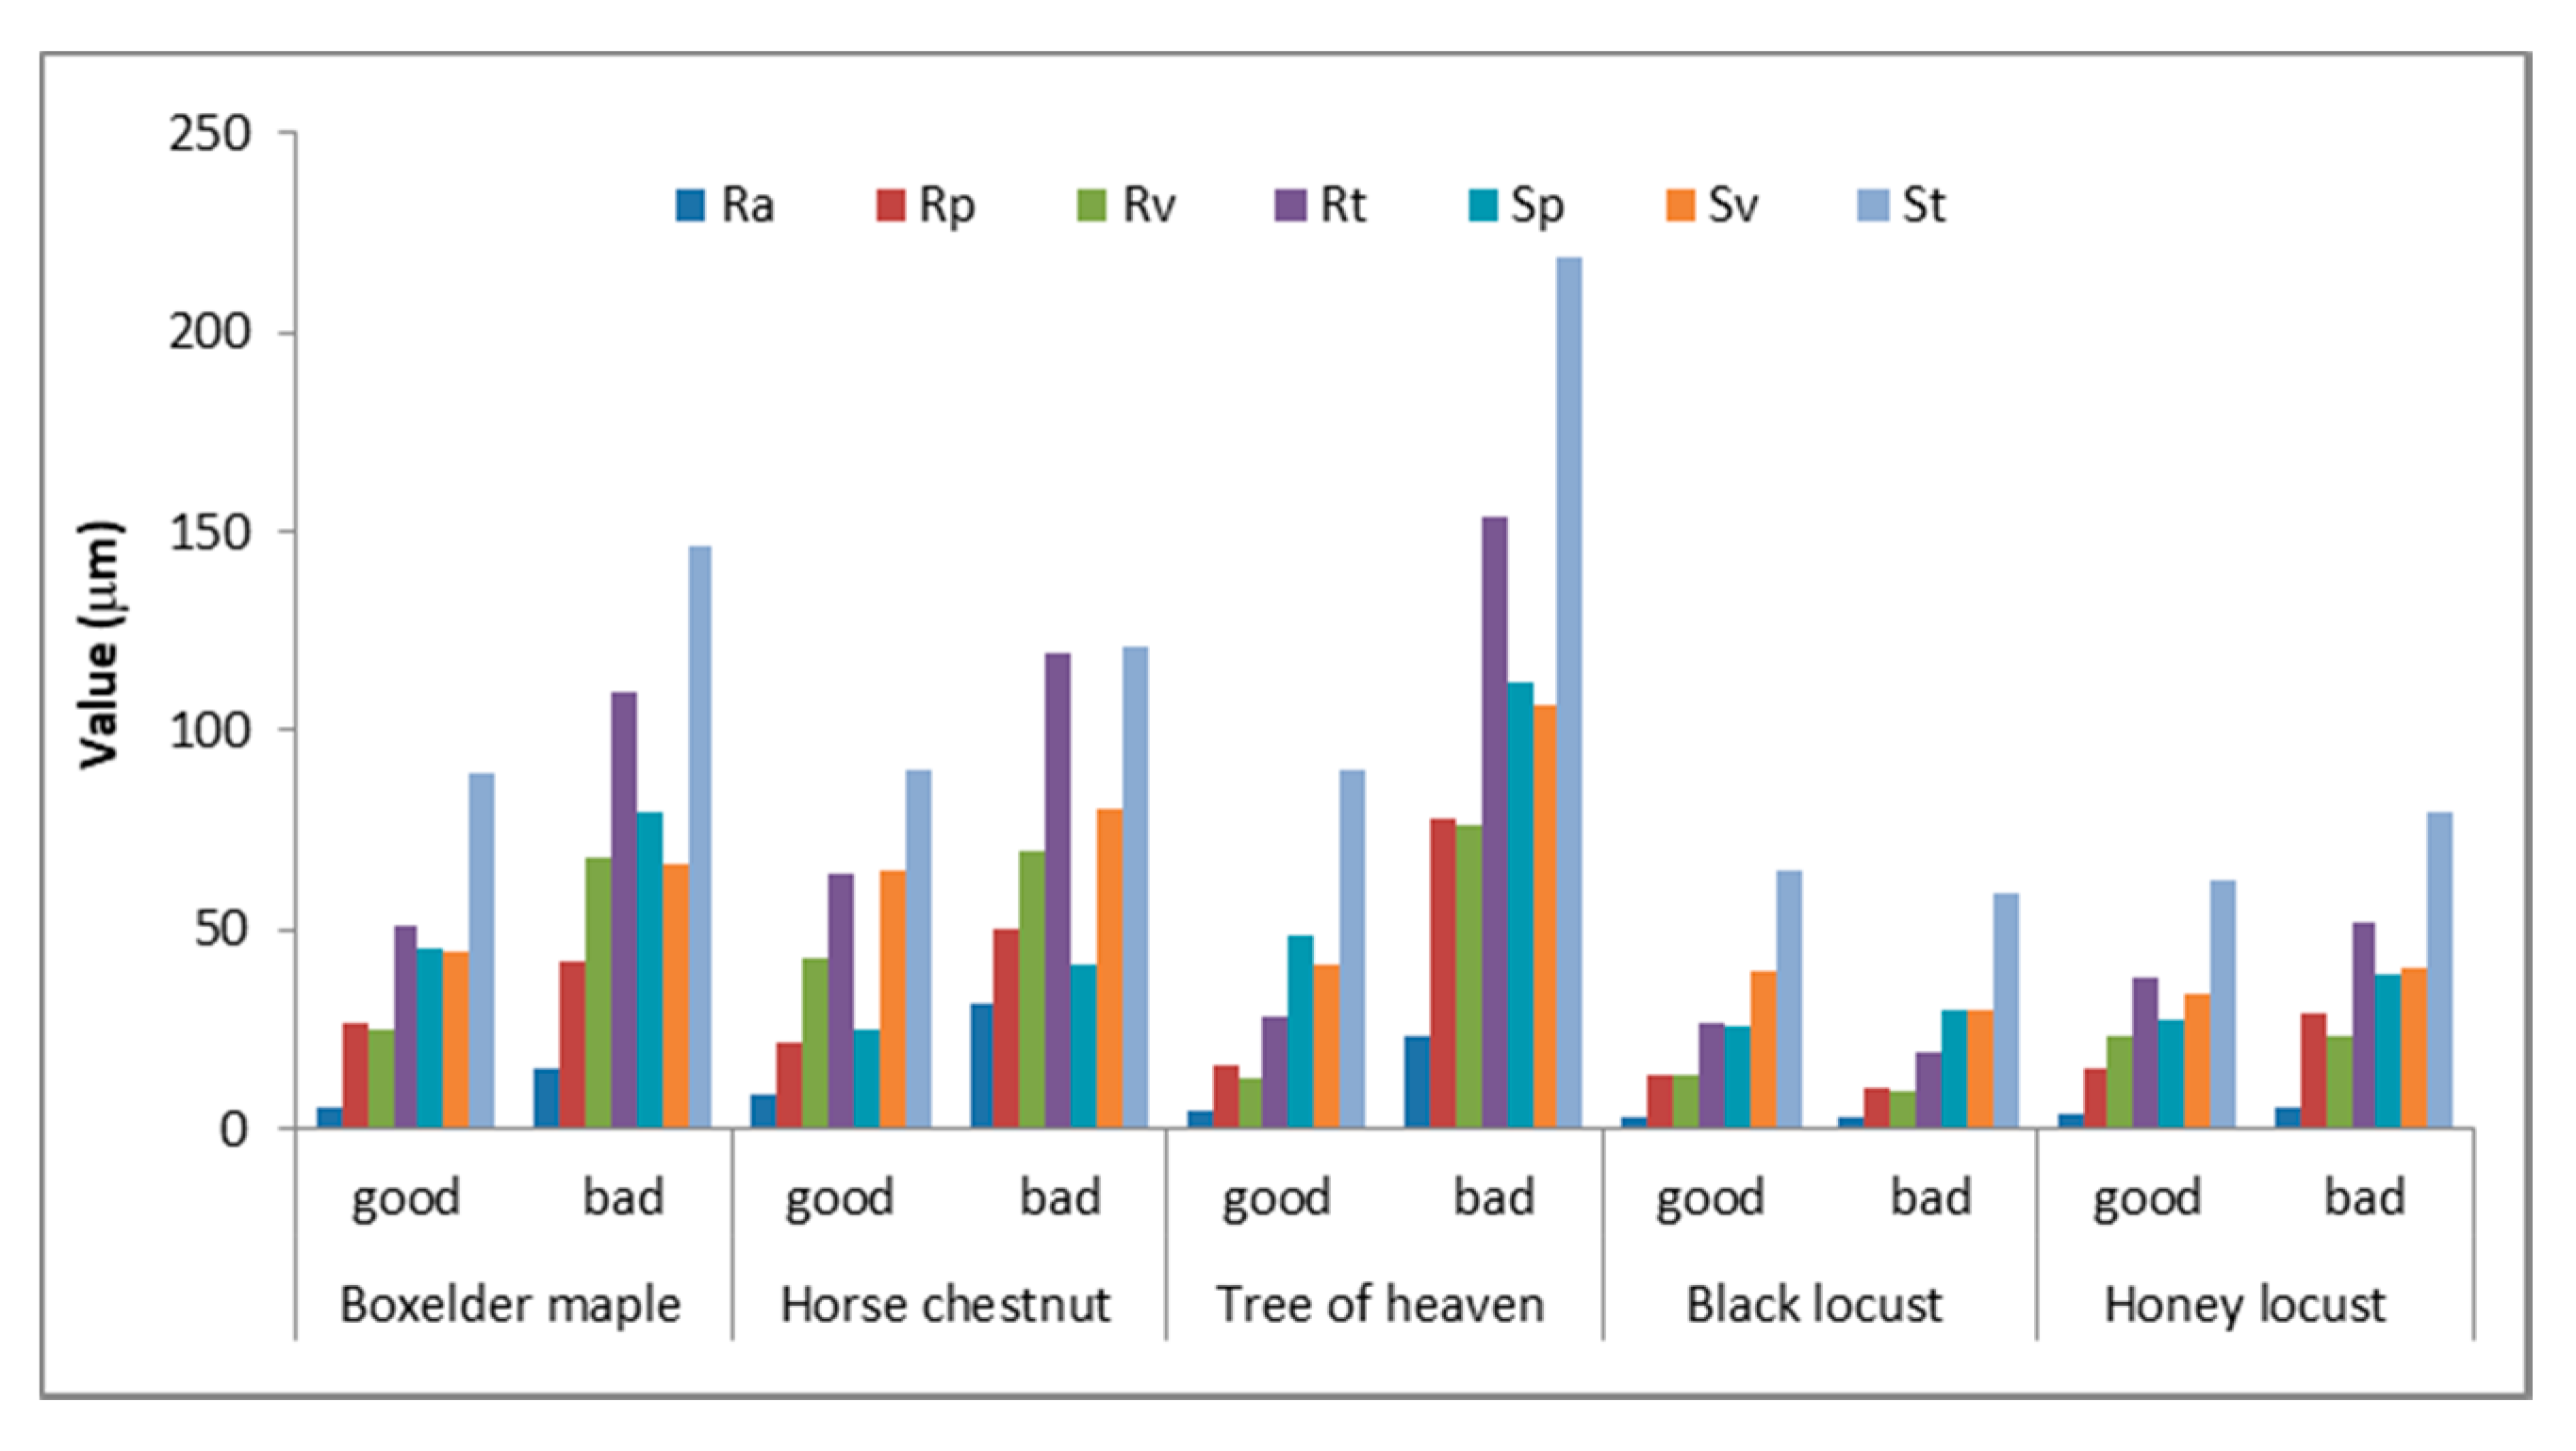
After the measurement, the following area roughness parameters were determined:
Sv—Absolute value of the height of the largest pit within the defined area.
Sp—Height of the highest peak within the defined area.
St—Distance between the largest peak height value and the largest pit depth value within the defined area.
Profile roughness parameters were on the selected profile:
Ra—Arithmetic mean of all deviations from the center line over the sampling path.
Rp—Maximum profile peak height along the sampling length.
Rv—Maximum profile valley depth along the sampling length.
Rt—Total height of profile: the distance between the maximum profile peak height and the maximum profile valley depth along the sampling length.
2.3. Turning
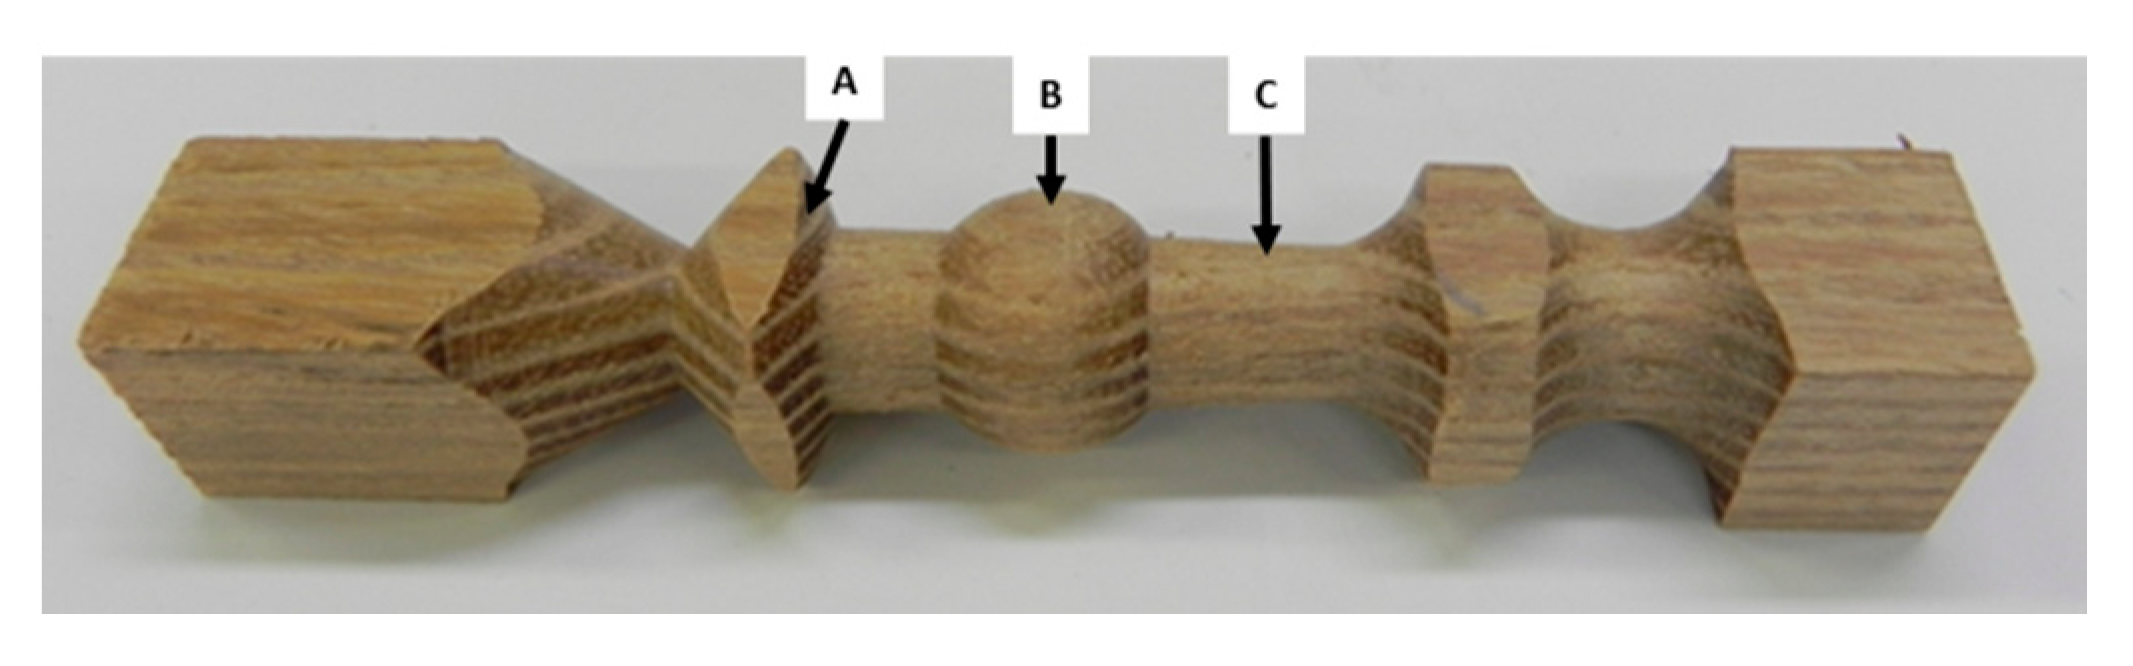
40 turning samples for each species were 127 × 19 × 19 mm in size (
Figure 2), whereby the rotational speed of the specimens and feed rate of the blade was 3200 rpm and 120 mm/min, respectively. First, a rough turning and then a fine turning were done, where the thickness of the cut at final turning was 2 mm. The specimens were graded for fuzzy grain, roughness and torn grain at three locations, as shown in
Figure 2, and the average value was calculated. The percentage of specimens with the Grades 1, 2 and 3 was determined and average grade for each tree species was calculated.
3. Results and Discussion
Material average densities with standard deviations (SD) for tested tree species are shown in
Table 1. The lowest density had horse chestnut with the average value of 495 kg/m
3 and standard deviation of 22 kg/m
3, while the highest average density had black locust with the value of 778 kg/m
3 and standard deviation of 54 kg/m
3.
3.1. Planing
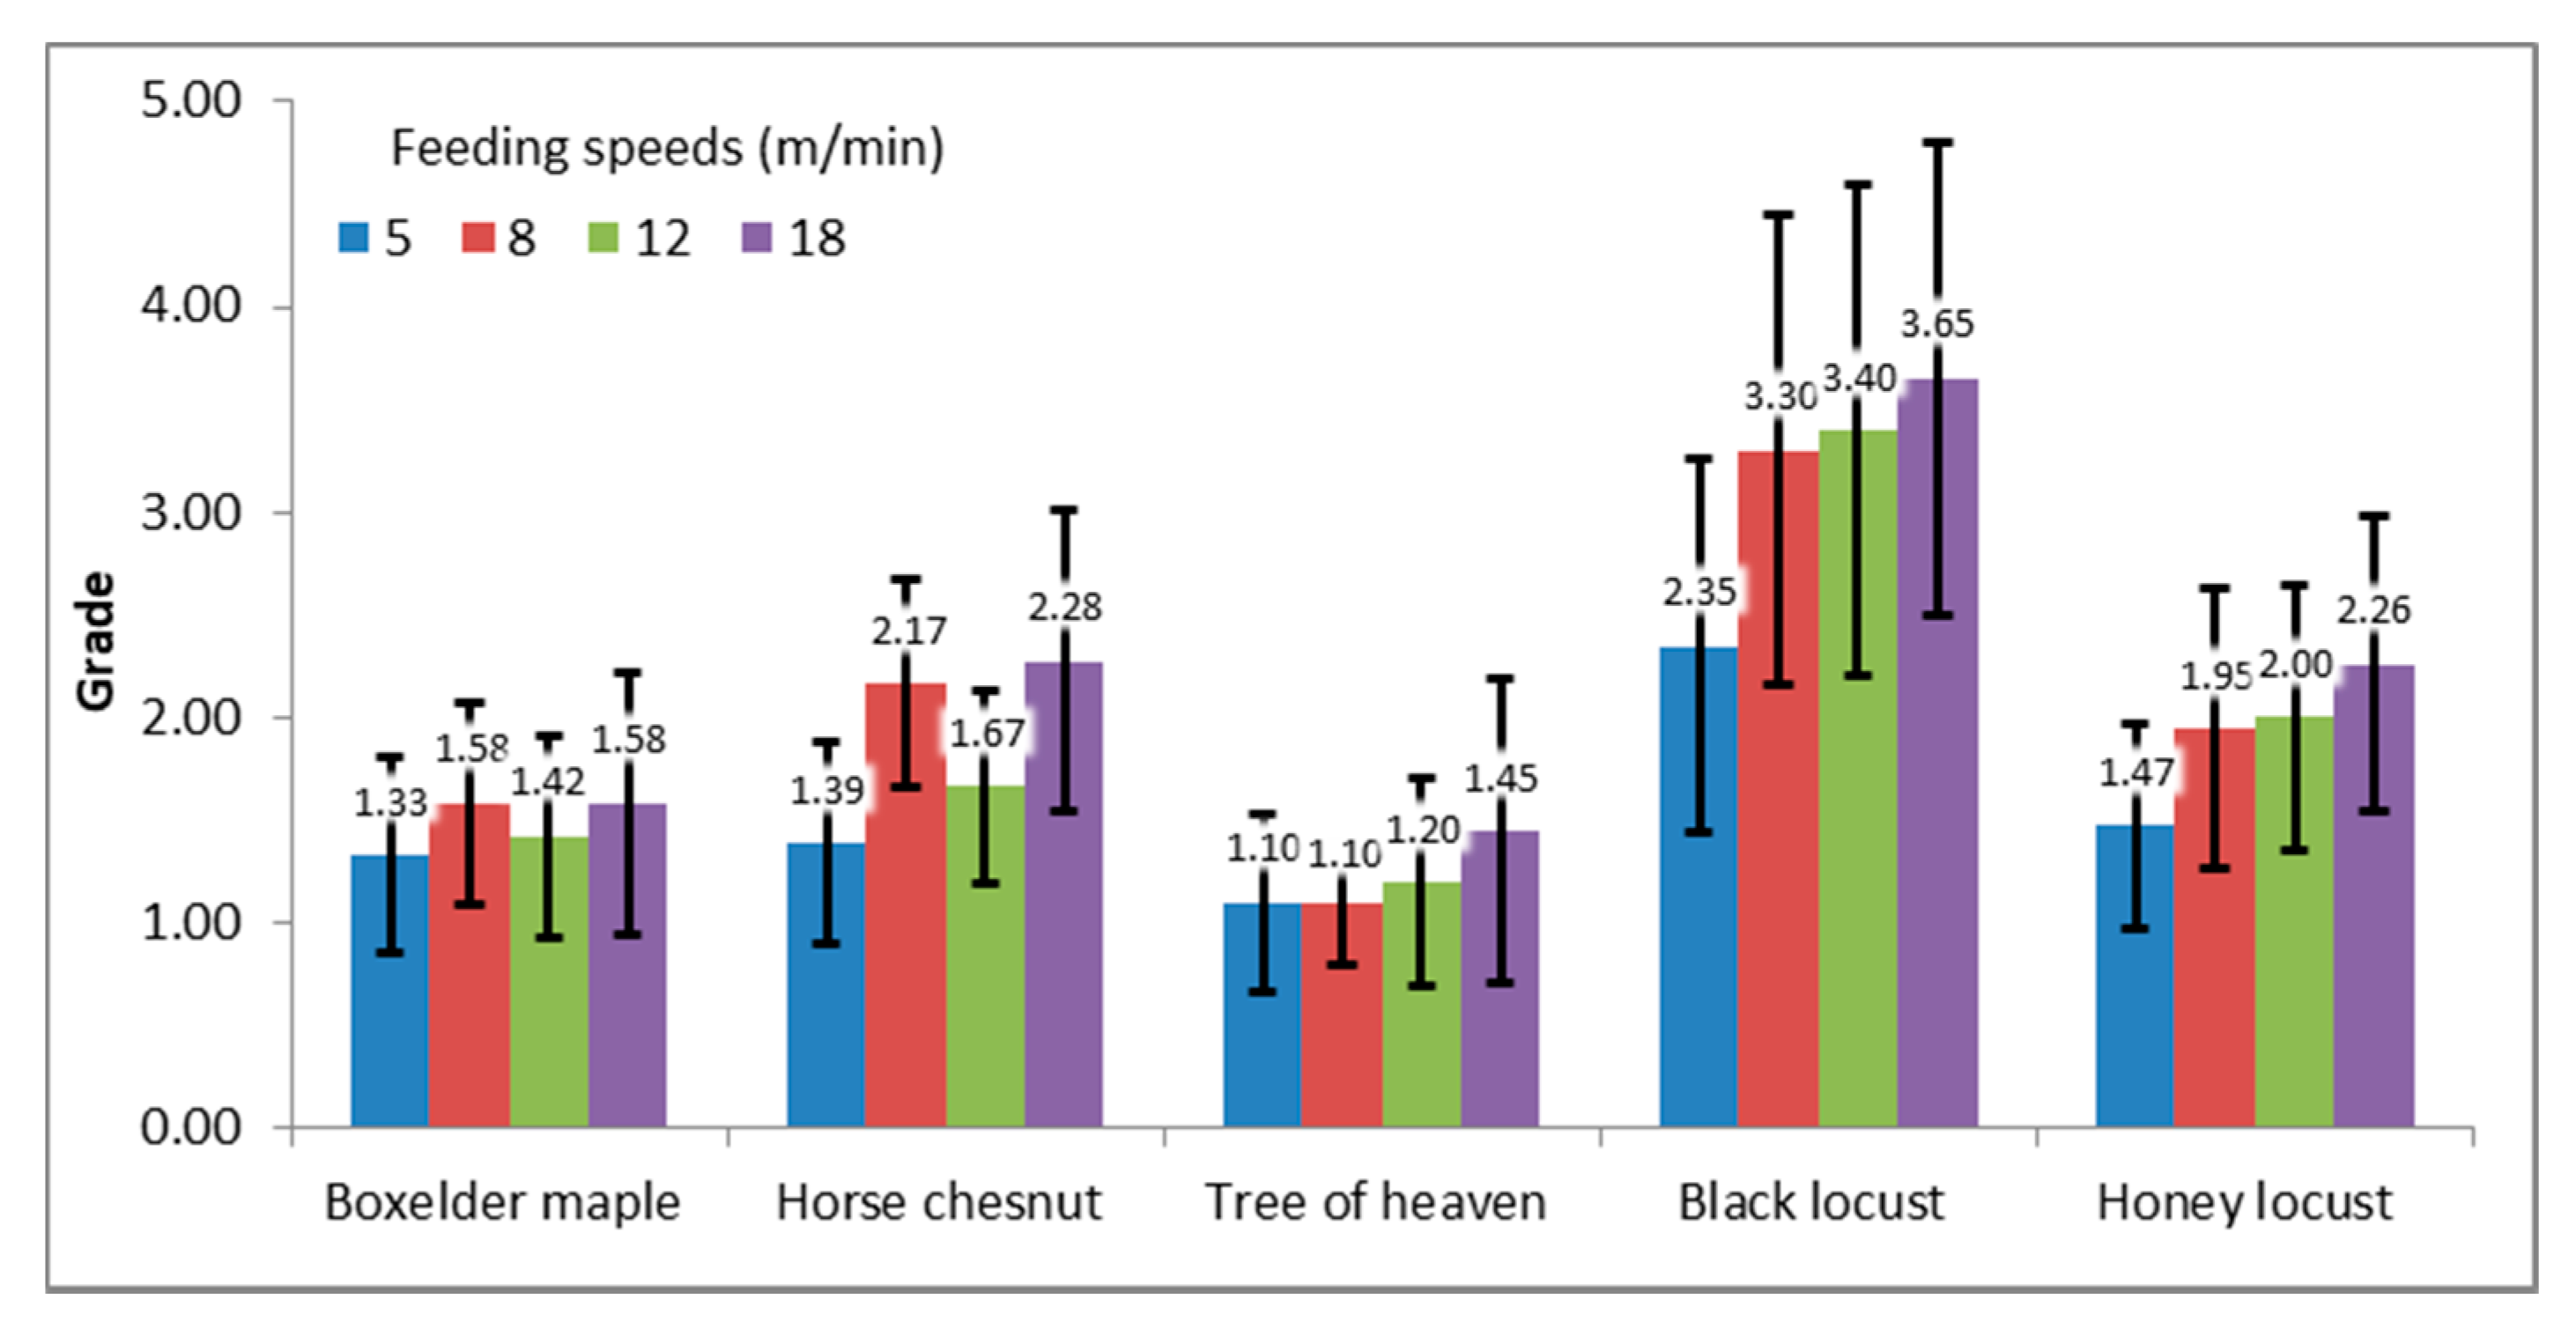
Figure 3 shows planing surfaces with evaluated grades 1 to 5 while
Figure 4 shows the average grades with the standard deviation for each tree species for planing operation at different feeding speeds. It is obvious from
Figure 4 that tree of heaven has the best grades in the range from 1.10 to 1.45, while black locust has the worst grades with the average grade of 3.65 at the highest feeding speed. All species feature better grades at lower feeding speeds, and the surface quality is decreasing with increasing feeding speed, with the greatest difference in quality again shown by black locust.
Because the difference between the qualities at different feeding speeds varies at different tree species, an ANOVA analysis using SPSS software was performed to determine whether the grades for a particular tree species at different feeding speeds differ significantly. The results of this analysis are shown in the left part of
Table 2. Based on the
p-value where the limit was taken at 5%, the table shows that the values differ significantly for horse chestnut, black locust and honey locust, where the
p-values are written in bold. However, from the calculated values, we cannot distinguish between which combinations of feeding speeds there is a significant difference. To resolve this, the post hoc analysis using the LSD (least significant difference) method was performed, where the
p-values between individual combinations of feeding speeds were calculated. The results are shown in
Table 2, where the combinations of feeding speeds which are significantly different are also written in bold.
According to the obtained analysis, we can conclude that boxelder maple can be planed equally well at all feeding speeds with the average grade from 1.33 to 1.58, since according to the LSD ANOVA analysis, the grades between individual feeding speeds do not differ significantly. We can say similar for tree of heaven, which has the average grades from 1.10 to 1.45, and has even better grades than boxelder maple, where the feeding speed has a significant negative impact only at higher values. However, the situation is just the opposite in the case of black locust and honey locust, with the average grades from 2.35 to 3.65 and from 1.47 to 2.26 respectively, where there is a significant difference only between the lowest and the rest of the feeding speeds, while there is no significant difference between the grades at higher speeds. The latter, together with lower grades, can be explained as the fact that these species are problematic for planing and very sensitive to the negative effect, which in our case is represented by higher feeding speed.
The ANOVA analysis was also performed between different tree species at feeding speeds of 5 and 18 m/min, as shown in
Table 3. The surface quality grades at feeding speed of 5 m/min differ significantly between black locust and other species, and also between honey locust and tree of heaven. For other combinations, the values do not differ significantly, so it can be concluded with 95% of probability that tree species can be planed at the same quality at the feeding speed of 5 m/min. However, the situation is different at the feeding speed of 18 m/min, where the grades vary significantly among tree species everywhere, except between boxelder maple and tree of heaven and between honey locust and horse chestnut. The later analysis shows that the feeding speed at higher values influences the planing quality much more compared to the low values of feeding speed.
3.2. Routing
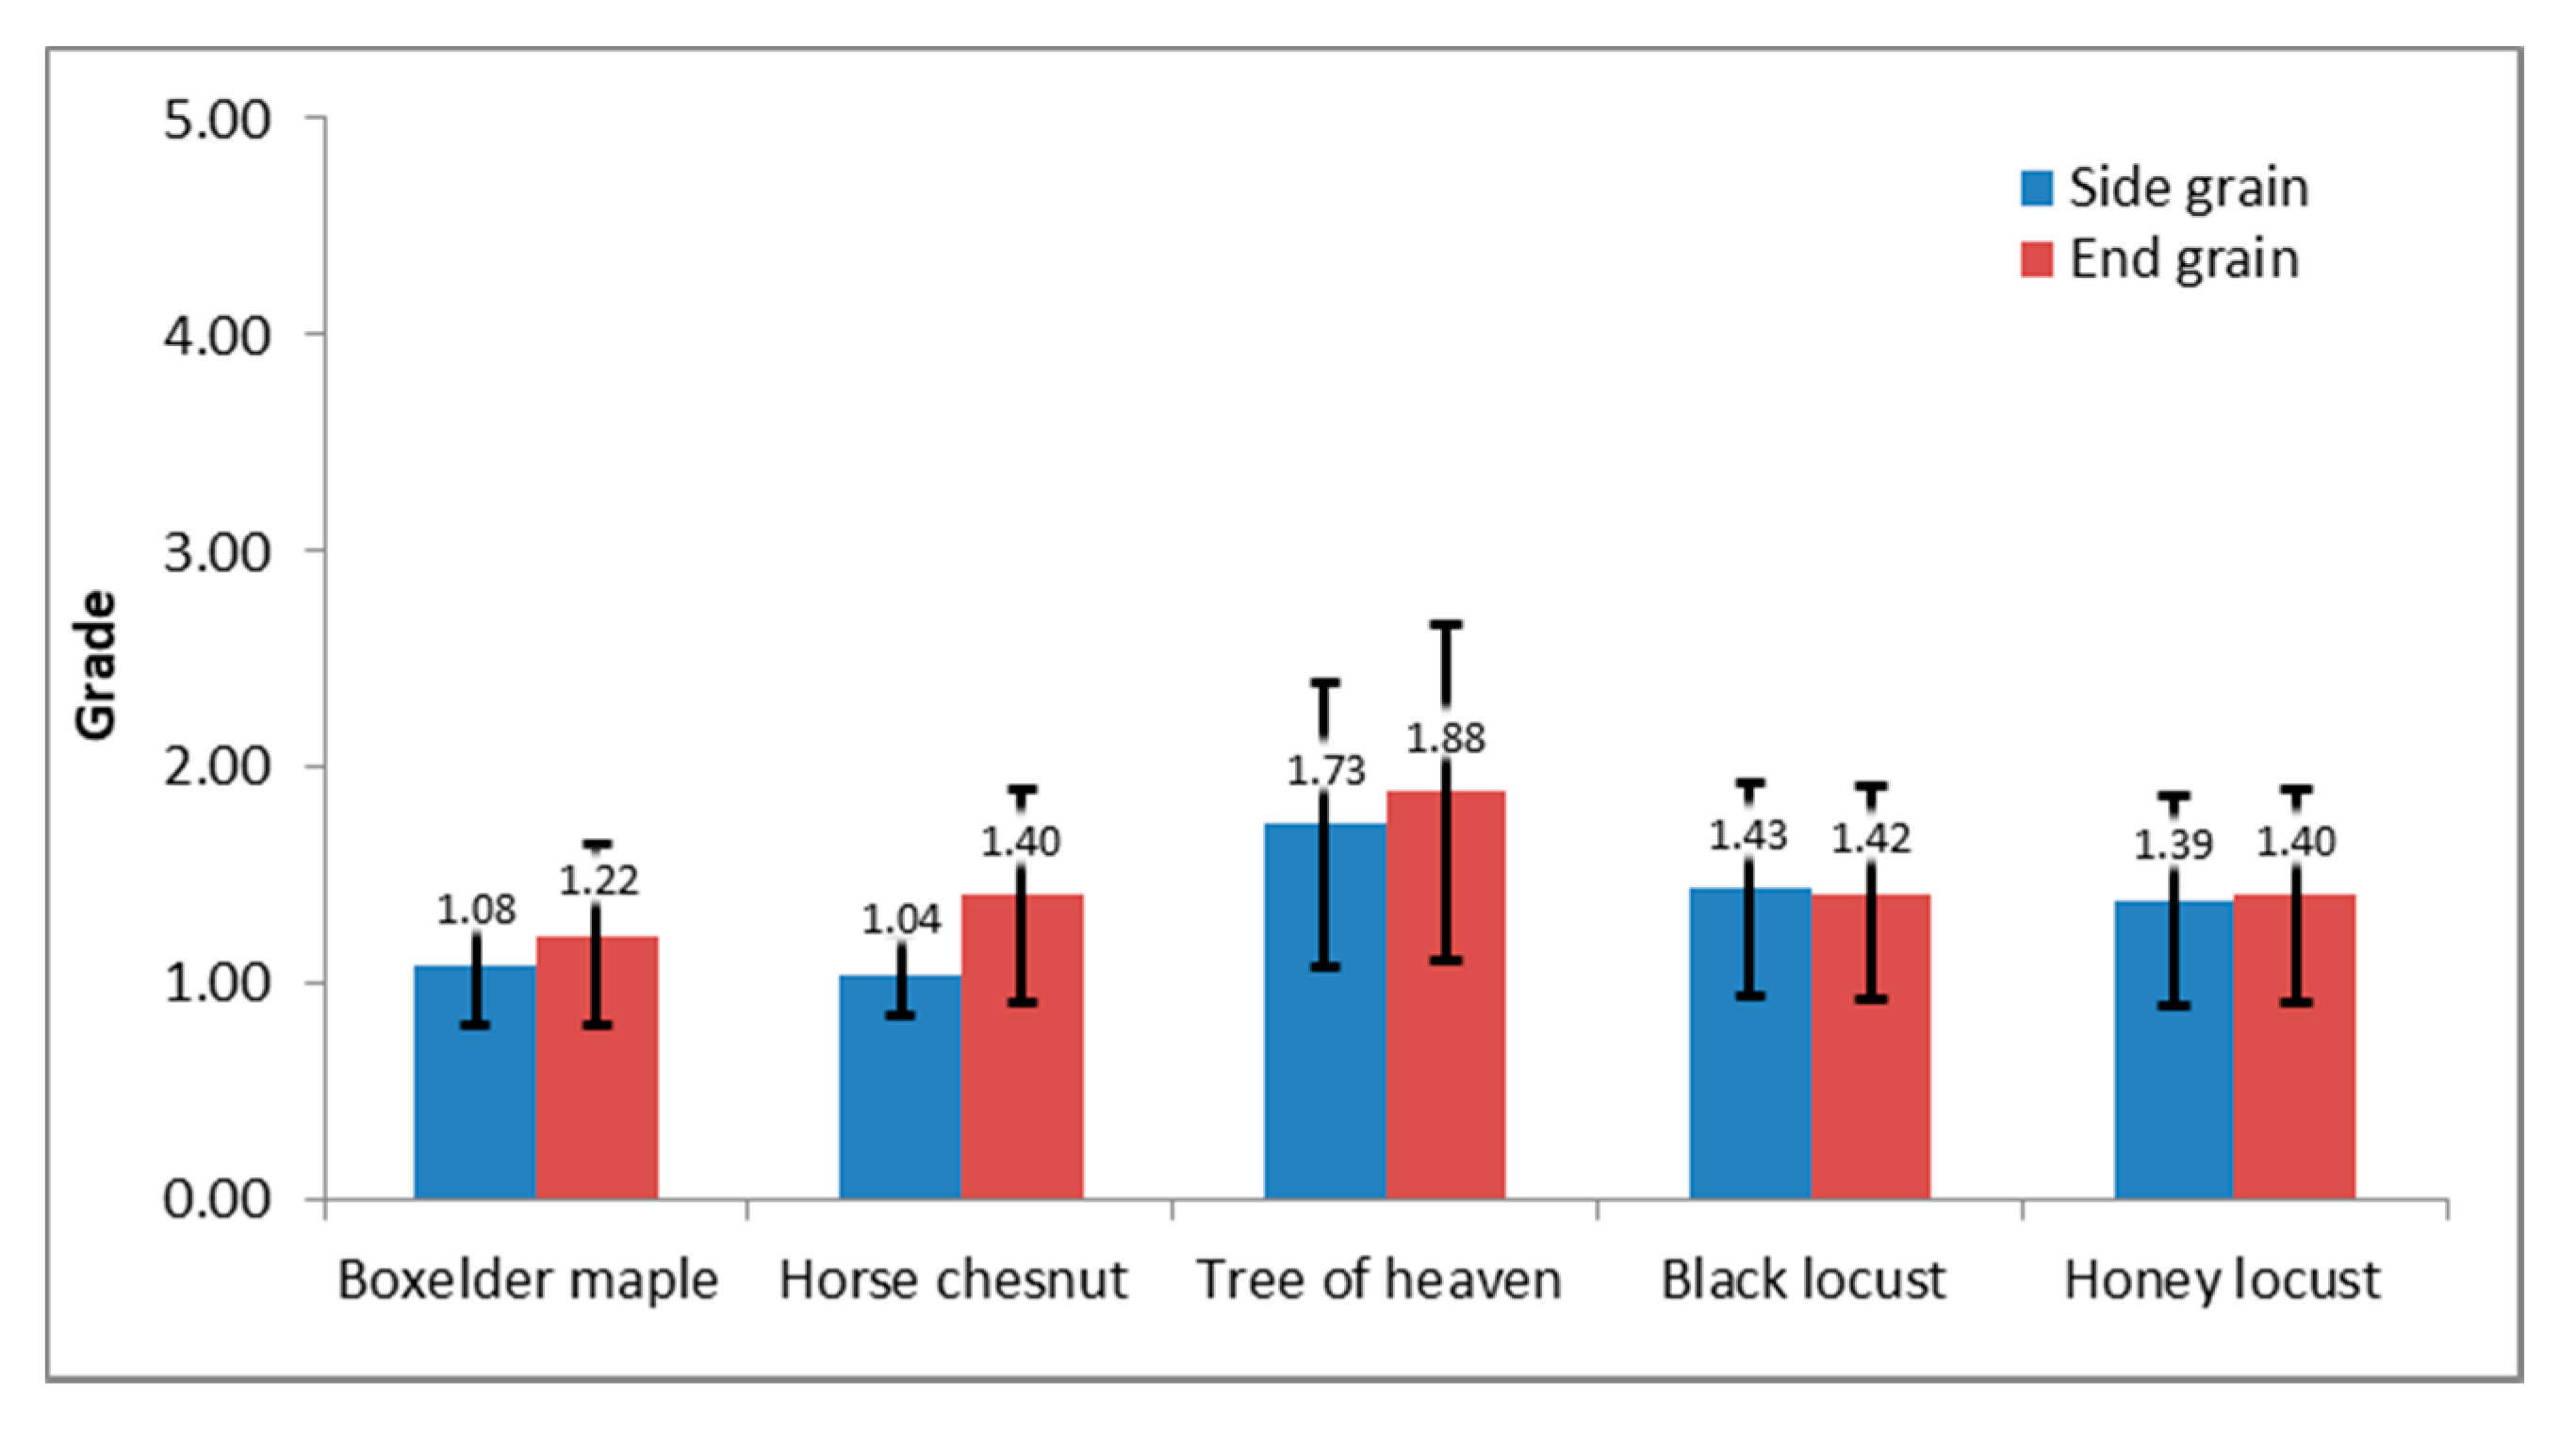
The average grades for side and end grain routing together with the standard deviations for each tree species are presented in
Figure 5. Boxelder maple has the best grades with the average grade of 1.08 and 1.22 for side and end grain respectively, and horse chestnut with the average grade of 1.04 and 1.40 for side and end grain respectively, while tree of heaven has the worst grades with the average grade of 1.73 and 1.88 and also the highest standard deviation. An ANOVA analysis has shown a significant difference in surface quality between the side and end grain routing only in the case of tree of heaven, as shown in
Table 4, while for other species, there is no significant difference between the directions of routing.
For each sample, the total average value from side and end grain routing grades were calculated and verified with the ANOVA analysis to check whether the grades between each tree species differ significantly. The results are shown in
Table 5 where the cells with significant difference are shown in bold. The values do not differ significantly between boxelder maple and horse chestnut and between honey locust, horse chestnut and black locust, while the grades among other tree species differ significantly.
Figure 6 shows the scanned end grain areas and roughness profiles of individual tested tree species, one for the best surface (designated as good surface) and one for the worst surface (designated as bad surface). Comparison of the roughness profiles of good surfaces reveals great differences between tree species, where honey locust has the smoothest line and horse chestnut has the roughest. Similar results are obtained from profile roughness parameters (
Figure 7), where tree of heaven has the worst values for both area and profile roughness parameters, similar to the visual assessment grades shown in
Figure 5.
Based on the profile roughness parameters (
Figure 7), black locust and honey locust have the lowest values while boxelder maple and horse chestnut have the lowest average grades from visual assessment (
Figure 5). This difference could be interpreted in a way that boxelder maple and horse chestnut, on average, can be end grain routed with better quality, but if we take a good sample of boxelder maple and horse chestnut and compare them with a good sample of black locust and honey locust, the latter will have smoother surfaces than the first one.
3.3. Turning
The turning average grades determined on surfaces A, B and C (
Figure 2), together with standard deviations, are shown in
Figure 8, while the results of the ANOVA analysis between the different tree species are shown in
Table 6.
It is clear from
Figure 8 that tree of heaven has the worst grades with the grade of 3.22, while horse chestnut has the best grades with the value of 2.43, to be followed by other tree species. On the basis of
Table 6, it can be stated that the turning quality grades of horse chestnut, black locust and honey locust do not differ significantly from each other.
3.4. Base Comparison Results
Table 7 presents the results as a base comparison of different species on the percentage of Grades 1, 2 or 3. The table shows a similar situation as described above under specific machining operations, but there may be a difference in some cases, such as in turning, where boxelder maple features a higher percentage of samples with fair to excellent grades than a honey locust, but has a worse average grade. The reason is that it can have a larger number of samples with a grade of 1 to 3, but also a few samples with higher grades, which increase the average grade.
4. Conclusions
The research carried out determined the machinability of the most common woody, non-native invasive tree species in Slovenia. Our findings support that some tree species can be very well machined, especially in specific machining operations, while others are worse. Similarly, there are differences in the surface quality produced by different machining operations in the same tree species. Thus, based on the visual grading of surface quality, it can be concluded for boxelder maple, horse chestnut and honey locust that they can be machined very well in all operations that have been studied, with the best results in routing and a little less in turning. The results are slightly different in the case of tree of heaven, which had, among all the studied tree species, the best quality in planing but the worst in turning. In the case of machining black locust, it had the worst quality in planing, while the quality for routing was very similar to other tree species.
The research carried out also showed that there is no significant relationship between the qualities of the various types of machining, which means that if, for example, machining properties for turning are required, it is necessary to carry out the turning test, as they cannot be concluded from the quality of the planing of the same tree species, because a particular tree species can be very well planed and poorly turned, and, of course, also vice versa.
The obtained results form the basis for the usefulness of the tested tree species, and as such, should be available to every producer of wooden products. Based on this data, the producer can decide which tree species will be used for certain products.


