Article

Both Forest Harvesting and Hydropower Dams Yielded Negative Impact on Low Flow Regimes in the Zagunao River Watershed, Southwest China

1
School of Resources and Environment, University of Electronic Science and Technology of China, Chengdu 611731, China
2
Center for Information Geosciences, University of Electronic Science and Technology of China, Chengdu 611731, China
3
Department of Earth, Environmental and Geographic Sciences, University of British Columbia (Okanagan Campus), 1177 Research Road, Kelowna, BC V1V 1V7, Canada
*
Author to whom correspondence should be addressed.
Forests 2020, 11(8), 787; https://doi.org/10.3390/f11080787
Submission received: 8 June 2020 / Revised: 21 July 2020 / Accepted: 21 July 2020 / Published: 22 July 2020
(This article belongs to the Section Forest Ecology and Management)

Abstract

:
Forest harvesting and hydropower dams can significantly affect flow regimes (magnitude, timing, duration, frequency, and variability), resulting in changes in degraded aquatic ecosystems and unstable water supply. Despite numerous studies on the effects of forest harvesting on mean flows, the impact of forest harvesting on flow regimes has been less investigated. A great difficulty lies in separating the hydrological effect of forest harvesting from that of climate variability and other watershed disturbances such hydropower dams. In this study, the Upper Zagunao River watershed (2242 km2) was selected as an example to provide a quantitative assessment of the effects of forest harvesting and hydropower dams on low flow regimes. The key findings include: (1) Forest harvesting led to a significant reduction in the magnitude and return period of low flows, and a significant increment in the variability and duration of low flows; (2) the recovery of low flow regimes occurred 40 years after forest harvesting as forest recovery processed; and (3) hydropower dams caused significant impact on all components of low flow regimes, e.g., a reduction in the magnitude, return period, and timing of low flows, and an increment in the variability and duration of low flows. Our findings highlight the negative impact of both forest harvesting and hydropower dams on low flow regimes in the Upper Zagunao River watershed. A watershed management strategy for offsetting the negative effect of hydropower dams on low flow regimes by restoring hydrological functions of subalpine forests is highly recommended in subalpine watersheds of the Upper Yangtze River.

1. Introduction

Low flows are defined as the flows equal to or less than Q95% (Q95%: Flows exceeded at 95% of the time in a given year) [1,2]. Natural low flow regimes characterized by five components including its magnitude, frequency, timing, duration, and variability are critical in maintaining biodiversity and ecosystem functions [3,4,5,6]. For example, the timing of low flows often acts as an important ecological signal for fish spawning or migration [1,7,8]; salmons in the Willow and Baker watersheds, British Columbia, Canada always migrate upstream and spawn during the low flow seasons [2]. The alteration of natural low flow regimes is believed to cause negative ecological impacts on aquatic and riparian ecosystems, i.e., altering river morphology and habitats for aquatic and riparian species [9,10], and changing the distribution of floodplains vegetation and the life cycle of native species [11,12], resulted with a reduction of sensitive species while increasing the abundance of exotic species [5,13,14,15]. Therefore, understanding the dynamic of low flow regimes is essential for both ecosystem protection and watershed management.
As a matter of fact, the majority of rivers worldwide are regulated by dams with altered low flows regimes, and the impact of dams on low flow regimes and its associated ecological consequences have been widely investigated [16]. For example, after the construction of the Hapchon Dam for water supply, hydropower, and flood control in the Hwang River, Korea, the magnitude of low flows was increased, and the variability of low flows was significantly reduced [16]. Most research on large dams with water storage capacity has similar results. However, the hydropower projects without water storage capacity, especially the water diversion projects, have a larger influence on downstream rivers [17]. Hu et al. [18] found dams in the Huaihe River basin, China profoundly changed low flow regimes, such as decreasing the magnitude and advancing the timing of low flows, and frequent cease-to-flow events. Similarly, a 1–12% reduction in the magnitude and a 5-day delay in the timing of low flows were found due to the Ponte de Pedra hydroelectric dam [19]. The hydropower dams in the Upper Yangtze River basin were also found to yield significant impact on low flow regimes of the Upper Yangtze River and its tributaries, leading to great negative effects on the composition, quantity, and genetic diversity of native fishes [20,21]. Additionally, small hydropower stations may even have greater influence on flow regimes and ecosystems than large ones since they are built in streams which are often important habitats for a large number of sensitive aquatic species [22].
In addition to dams, forest change caused by harvesting, fire, insect infestation, urbanization, agricultural activities, and plantation have also been identified as important drivers for low flow regimes particularly in forested watersheds [23,24,25]. According to the research of Liu et al. [26] in the Poyang Lake basin in China, deforestation decreased the magnitude of low flows by 30.1% and advanced the timing of low flows by 30.5 days, while reforestation yielded limited impact on low flow regimes. Xu et al. [27] claimed forestation significantly increased the average magnitude of low flows by 46.38%, and shortened the duration of low flows by 8.8 days in the Jiujushui watershed in China. On the contrary, in the Upper Grosse Ohe catchment, a 30% of forest loss caused a significant rise in the magnitude of low flows [28]. Yu et al. [29] also found deforestation increased the magnitude of low flows in the Tahe River watershed, China, while reforestation had the opposite result. The increment in the magnitude of low flows after deforestation is mainly associated with the reduction of evapotranspiration [30,31,32].
However, the existing studies only focused on one type of disturbances for low flow regimes, either dam or forest change, ignoring the fact that both factors can yield cumulative effects on low flow regimes over time and space in a watershed [1,23,26,33,34,35]. A possible reason could be the lack of suitable methodology to separate the effects of each disturbance agent on low flow regimes from that of climate variability especially for large watersheds [1,2,35]. Moreover, the majority of them only examined limited components of low flow regimes [23,36]. As mentioned above, from an ecological perspective, all low flow regime components work as a whole to maintain the structures and functions of aquatic, floodplain, and riparian ecosystems [1,4,5,37,38]. Besides their ecological role, low flow regimes are important to water resources management given that low flows occur in dry or even drought season with water shortage as the greatest challenge. Changes of low flow regimes will inevitably lead to great impact or even stress on water supply. This calls for a need to conduct a comprehensive examination of the impact of multiple disturbance agents on a full spectrum of low flow regime components, which can help with the design of watershed management strategies for ecosystem protection and water resources management especially dry season water supply.
The Upper Zagunao River watershed, a subalpine forested watershed in the Upper Yangtze River basin, provides critical ecological services including water supply, flood control, climate mitigation, and carbon sequestration to sustain downstream cities in the Chengdu plain, one of the most populated regions in China. However, this watershed has experienced long-term and diverse disturbances. Large-scale forest harvesting started from the late 1950s to the early 1960s, and then followed by forest recovery since the late 1980s, and hydropower dams were constructed between 1996 and 2010. Studies from neighboring watersheds found that intensive logging yielded negative effects on the magnitude of annual and dry season flows [39,40,41,42,43]. The hydropower dams even have more pronounced effects on dry season flows, resulting in frequent drying-up of streams [44,45]. However, a quantitative study aimed at the cumulative effects of forest harvesting and hydropower dam in large forested watersheds on all components of low flow regimes are limited. In order to address the issues above, this study used the Upper Zagunao watershed as an example to investigate the impact of both forest harvesting and hydropower dams on low flow regimes by a single watershed approach. The specific objectives of this study are: (1) Detecting long-term changes in all components of low flow regimes; (2) quantifying the impact of forest harvesting and hydropower dams on low flow regimes; and (3) providing scientific implications for water resource management and ecosystem protection.

2. Materials and Methods

2.1. Watershed Description

The Upper Zagunao River flows into the Minjiang River, the largest tributary of the Upper Yangtze River (Figure 1). Its main stream is 113 km in length with a drainage area of 2442 km2. Located in the transitional zone between the Qinghai—Tibet Plateau and the Sichuan Basin, the elevation of the Upper Zagunao watershed varies from 1789 to 5632 m above sea level, with an average of 3622 masl. The area with elevation higher than 4000 m accounts for about 50% of the total watershed area, and about 3.50% of the watershed is covered with glacier and permanent snow. The slope of the Upper Zagunao River watershed varies from 0 to 72°, and the area with slope between 30 and 60° accounts for 56.57% of the total watershed area [46].
The Upper Zagunao River watershed is situated in a typical alpine climate zone with relatively cool summers and mild winters. The annual mean temperature is 11.2 °C, and the maximum temperature reaches 26.9 °C in July, while the minimum temperature is −3.3 °C in January. The climate of summer is controlled by the Southwest Monsoon from the Indian Ocean, resulting in a rainy season from May to September with an amount of precipitation (880 mm) accounting for about 80% of the annual total [47]. Snow falls from November to March, contributing to snowmelt runoff from April to May with rising temperature.
The major vegetation types in the Upper Zagunao River watershed include alpine meadow and subalpine coniferous, covering 47% and 32% of the total watershed area, respectively [47]. The dominant tree species are Abies faxoniana and Picea purpurea [48]. The area with an elevation between 2000 and 4000 m is covered with dark coniferous forest, while the area with elevation higher than 4000 m is occupied by shrubs and alpine meadows. The study watershed continuously experienced forest harvesting from the late 1950s to the late 1970s, especially during the period from 1955 to 1962 with about 1% of the watershed area harvested annually. Then forest harvesting greatly declined from the late 1970s and eventually stopped completely in 1998 due to the implementation of the Natural Forest Protection Project.
As located in the mountainous area with a great elevation difference, the Upper Zagunao watershed is an ideal place for hydropower development [49]. There are two middle-sized hydropower stations in this watershed—the Lixian hydropower station constructed in the mainstream of the Zagunao River in 1996 and the Red Leaf hydropower station established in 1997 [50]. All the hydropower stations were connected by diversion tunnels, so that the downstream station can directly use the surplus water of the upstream one for power generation [51]. Since the upstream runoff directly flowed to the powerhouse of the downstream station through diversion tunnels, some sections of the mainstream dried up from time to time during the dry season [49].

2.2. Data

Daily hydrological records from 1958 to 2006 covering the periods with forest harvesting and hydropower dam disturbances were collected from the Zagunao hydrological station, located at the outlet of the study watershed. According to the long-term monthly flow records, the hydrological year can be identified from November to October [47]. Low flow regime components were calculated based on daily flows. In this study, low flows always occur in February and March.
The climate data are limited within or around the Upper Zagunao River watershed, with only one active weather station (the Lixian weather station) and one rain gauge (the Zagunao rain gauge). Monthly mean, minimum, and maximum temperature data from 1958 to 2006 were obtained from the Lixian weather station, and precipitation data available between 1958 and 2006 were collected from the Zagunao rain gauge station. In addition, monthly wind speed and relative humidity data (1955–2015) from the Dujiangyan weather station, located near the Upper Zagunao River watershed, were also used in this study. Seasonal and annual climate data were calculated accordingly.
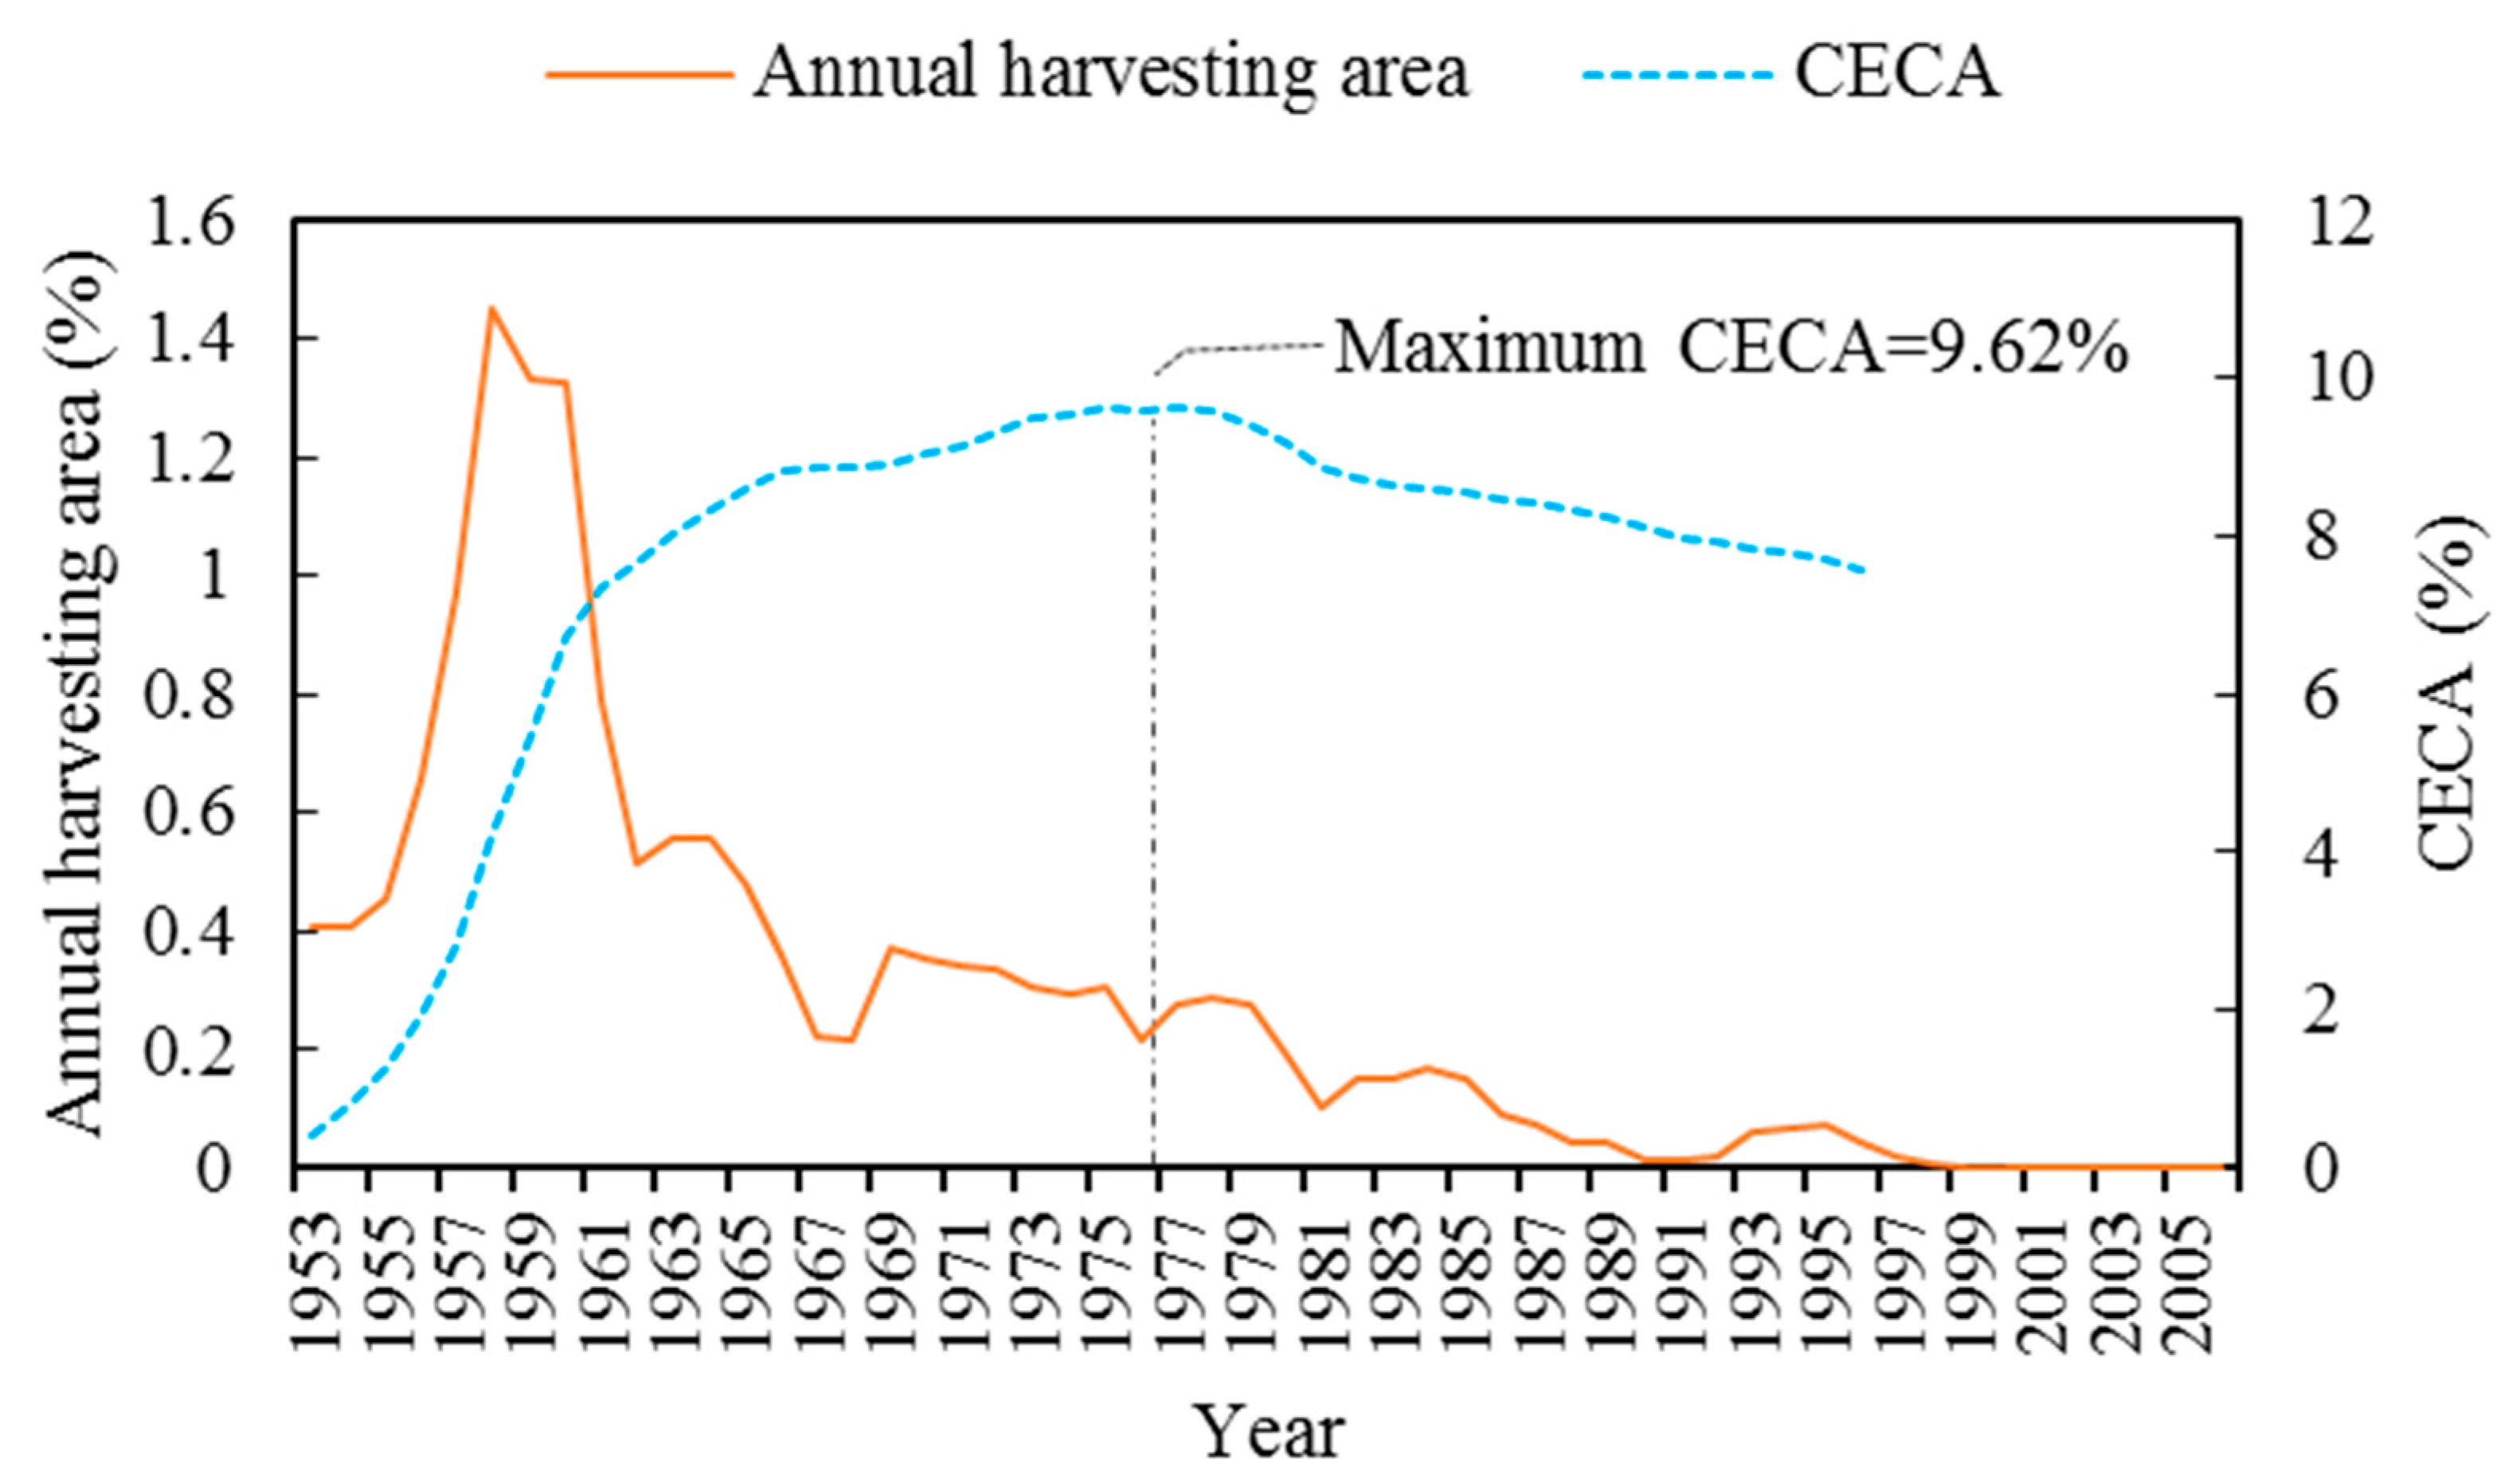
Two types of forest data were used in this study, including annual harvesting area records (1953–1998) from the Miyaluo Forest Station and cumulative equivalent clear-cut area (CECA) from a published paper (Figure 2) [47]. Cumulative equivalent clear-cut area (CECA) is a better index to indicate the forest change with the consideration of hydrological recovery in harvested areas with vegetation regrowth [47,52,53]. CECA is calculated based on hydrological recovery rates. For example, based on the previous relevant studies in this area, no hydrological recovery in the first 3 years after harvesting was assumed, while a hydrological recovery rate of 70% was expected in 50 years after harvesting [54,55]. The period with a rising tendency of CECA can be viewed as a forest harvesting phase, while the period with a downward tendency in the CECA can be considered as a forest recovery phase [47].

2.3. Definitions of Low Flow Regime Components

The flow duration curve (FDC), described as a cumulative distribution function of daily flows over a time interval of interest, shows the frequency of occurrence of various rates of flow [56], where low flow data (the flows equal to or less than Q95%) can be derived from [1,2,57]. Based on the definitions, five components of low flow regimes were further computed [3]. The magnitude of low flows refers to the amount of water moving through the watershed outlet every day when daily flows are equal to or less than Q95%. Timing for low flows refers to the average date for the occurrence of the low flows in a hydrological year, while the duration is the number of days with daily flows being equal to or less than a low flow threshold (the threshold referred to the median of low flows during the reference period). Frequency, also known as return period of low flows, is calculated based on flood frequency analysis using log-Pearson type III distribution. Variability is denoted by the coefficient of variation (CV). Detailed information on the calculation of low flow regime components is provided in Table A1.

2.4. Trend and Change Point Analysis

Kendall tau and Spearman rho tests were employed to detect trends of statistical significance in low flows and climate records. They are also available to detect a correlation between two series with statistical significance. Both of them are non-parametric tests without an assumption of sample distribution, which are widely used in hydrology and meteorology [58,59,60].
During the entire study period (1959–2006), climate variability, forest harvesting, and dams are three major drivers for low flow change in the Upper Zagunao River watershed. The Mann-Kendall breakpoint test, proposed by Mann and Kendall, was used to explore significant change points in the time series of low flow regime components [42,59,60,61,62], which helps in identifying the key drivers for changes in low flow regimes during different periods, as well as estimating the respective impact of each driver. A non-parametric Mann-Whitney U test [63] was applied to confirm the significance of change points that were detected by Mann-Kendall test. The Wilcoxon signed-rank test was used to compare whether there are statistically significant differences between ranks of two related samples, matched samples, or repeated measurements [64]. The Mann-Whitney U test and Wilcoxon signed-rank test used in this study were aimed to detect whether there was a significant difference between reference year and disturbed year.

2.5. Quantification of the Impact of Forest Harvesting and Hydropower Dams on Low Flow Regimes

Climate variability, forest harvesting, and hydropower dams are three major drivers for low flow regime change in the Upper Zagunao watershed due to its remote location with limited human activities [47,53]. As is known, separating the impact of climate variability on low flow regimes from that of forest harvesting can be very challenging in a large watershed, not to mention partitioning the impact of three drivers [53]. The whole study period (1959–2006) was firstly divided into five phases based on the long-term forest harvesting data and hydropower station history, as well as previous studies (Table 1), so that in each phase, only two drivers, either forest harvesting and climate variability, or hydropower dams and climate variability for low flow regime change were identified. In this way, the respective effects of forest harvesting and hydropower dams on low flow regime can be quantified by the designed paired-year approach.
Intensive logging of the old-growth coniferous forests in the study watershed started from 1955 to 1962, and then the harvesting rate greatly declined after 1970, and finally stopped in 1998 due to the Natural Forest Protection Plan (Figure 2). However, the significant change in hydrology caused by deforestation was detected in 1969 in the Upper Zagunao watershed due to the lagged hydrological responses to disturbances in large watersheds [47,53]. Accordingly, the study period can be divided into the reference period (Phase 1: 1959–1968) and disturbed period (Phases 2–5: 1969–2006). According to cumulative forest disturbance level in term of CECA, the cumulative forest harvesting was on a rise before it reached its maximum in 1975, followed by a downward trend (Figure 2). Moreover, the effect of forest harvesting on hydrology was greatly reduced due to forest recovery after 1988, and the reduction in streamflow caused by forest harvesting between 1989 to 1996 was only 1 mm, indicating a hydrological recovery after deforestation achieved prior to the construction of the first large hydropower dam (the Lixian hydropower dam) in 1996 [47]. Therefore, the disturbed period was further divided into Phase 2 (1969–1975), the forest disturbed period with a moderate level of harvesting, Phase 3 (1976–1988), the forest disturbed period with a low level of harvesting, Phase 4 (1989–1996), the forest recovery period, and Phase 5 (1997–2006), the hydropower dam disturbed period without forest harvesting (Table 1).
Four sets of comparisons were then generated to quantify the impact of forest harvesting and dams on low flow regimes separately. Three sets of them (Phase 1 vs. Phase 2, Phase 1 vs. Phase 3, and Phase 1 vs. Phase 4) were used to assess the effect of forest harvesting on low flow regimes. The fourth comparison (Phase 1 vs. Phase 5) was for estimating the impact of dam on low flow regimes. The paired-year approach was eventually adopted to separate the effect of forest harvesting or dam on low flow regime from that of climate variability [1]. The paired-year approach combining statistical analysis and flow duration curves has fewer requirements of data on climate, water disturbances, and hydrology, and avoids the time-consuming model calibration in comparison to hydrological modeling, which enables a quick quantitative assessment on the impact of forest change or hydropower dams on flow regimes. This can improve the efficiency of decision-making processes related to forest and water resource management. In the paired-year approach, a year in the reference period was paired with its comparable year in the disturbed (either deforestation or dam) year according to their similarities in climate conditions. Thus, the hydrological differences between those two years can be regarded as the effects of forest harvesting or dams. In order to select paired years, Kendall tau and Spearman rho were employed first to test the correlations between low flow magnitude and possible relevant climatic variables, including precipitation, mean, maximum, and minimum temperature, wind speed and relative humidity at multiple temporal scales (monthly, seasonal, low flow period (February to March), and annual scales; refer to Table A2 in Appendix A for more details). The statistical tests showed that the annual max temperature (Tmax-a), wet season mean temperature (Tmean-ws), and relative humidity of low flow period (Rhu-lf) were significantly correlated with low flows. Therefore, these climate variables were used as key controlling climate factors in the pair selection. Specifically, each pair of years must have similar annual max temperature (Tmax-a), wet season mean temperature (Tmean-ws), and relative humidity of low flow period (Rhu-lf), where 10% biases are allowed. In addition, monthly climate variables in any reference year in each pair must be insignificantly different from those in its counterpart according to the Mann-Whitney U test. In this way, the similarity of climate conditions in the paired years can be mostly guaranteed. According to those criteria, 23 and 5 pairs were identified for assessing the impact of forest harvesting and dams on low flow regimes, respectively (Table 2 and Table 3).

3. Results

3.1. Long-Term Changes of Climate and Low Flow Regimes

As shown in Table 4, significant upward trends were detected in dry season precipitation from 1959 to 2006 and 1997 to 2006 (α = 0.05). Seasonal and annual mean and minimum temperature were significantly increased during 1959 and 2006, while insignificant trends were identified in seasonal and annual maximum temperature. Significant downward trends were found in wind speed at all temporal scales, while significant downward tendency was detected only in annual and wet season relative humidity. Insignificant trends were identified in all components of low flow regimes between 1959 and 2006 (Table 5).
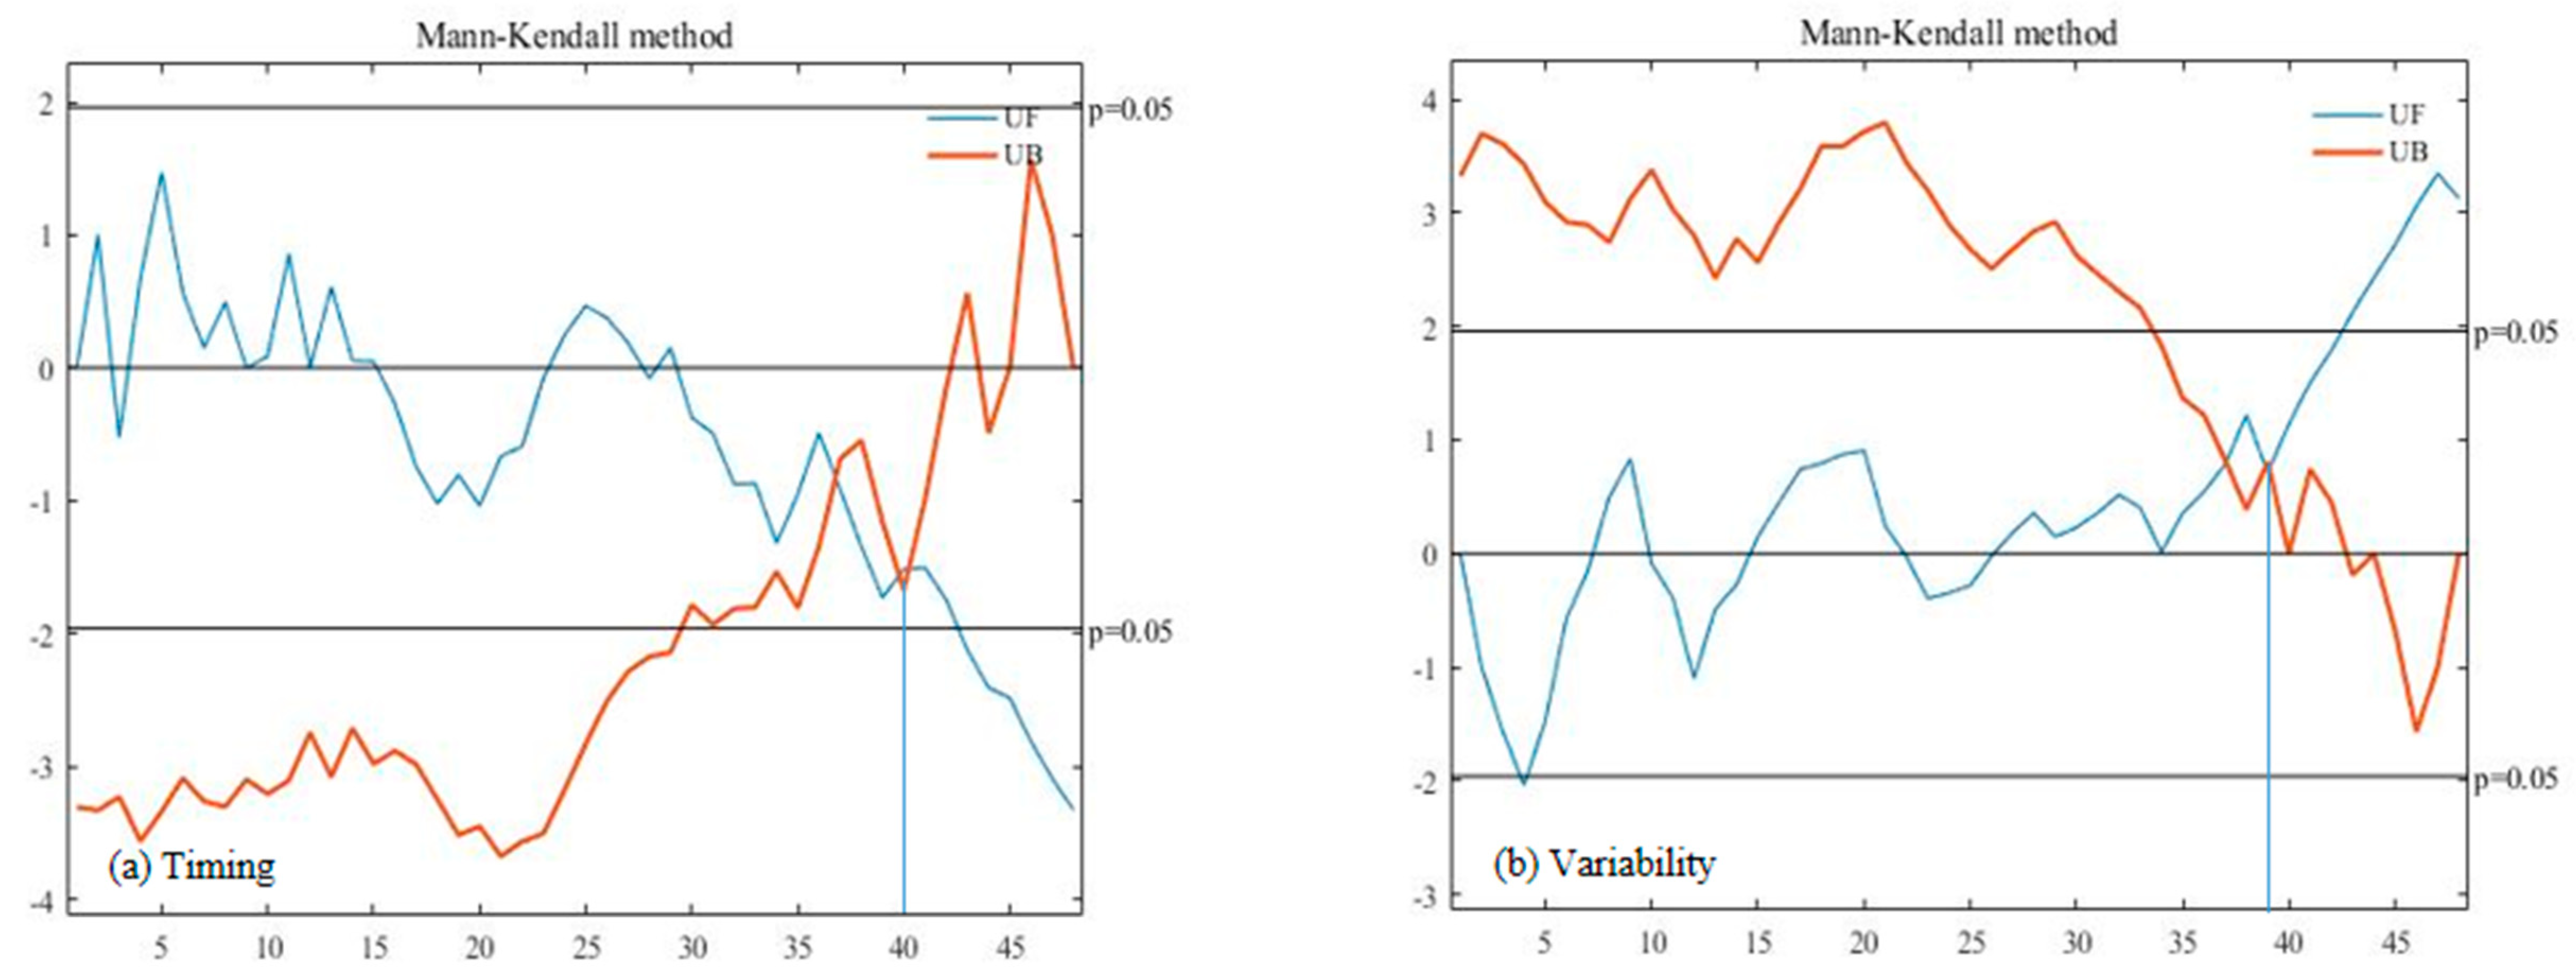
However, significant declines in the magnitude and return period of low flows and significant upward tendency in the duration of low flows were detected from 1959 to 1988 (the deforestation period prior to a high hydrological recovery achieved) in spite of insignificant changes in most climate variables, especially precipitation, wind speed, and relative humidity over the same period (Table 4 and Table 5). This suggests these changes in low flow regime components may be more associated with forest harvesting rather than climate variability. Similarly, a significant downward trend in the return period of low flows and an increasing trend in the duration of low flows was also detected over the period of 1997–2006, the dam disturbed period, though with limited changes in climate. Given the limited forest harvesting impact on hydrology after 1988, the changes of low flow regimes are largely caused by dams since 1997. The change point analysis by the Mann-Kendall and Mann-Whitney U tests (Figure 3 and Table 6) found a significant change point in the timing of low flows in 1998 and a change point in the variability of low flows in 1997, which further confirmed the analysis of key drivers for low flow regime changes over different periods.

3.2. Forest Harvesting Effects on Low Flow Regimes

3.2.1. Magnitude

As illustrated in Figure 4, Figure 5, Figure 6 and Figure 7 and Table 7, the magnitude of low flows was significantly decreased due to forest harvesting. Compared with that in reference years, the magnitude of low flows was averagely reduced by 20.51% in Phase 2 and 19.71% in Phase 3 as a result of continuous forest harvesting (Table 7). As forest recovery continually progressed, the cumulative forest harvesting effect on the magnitude of low flows gradually diminished during 1989 to 1996 (Phase 4), resulting in only 7.61% reduction in the magnitude of low flows. According to Table 7, statistically significant differences were found between Phase 1 and other three counterparts.

3.2.2. Return Period

Based on the quantitative assessment, the return period of low flows was reduced by forest harvesting. Forest harvesting averagely reduced the return period of low flows by 15.95 years in Phase 2, 10.68 years in Phase 3, and 13.24 years in Phase 4 (Figure 8). Moreover, no statistically significant differences in the median of the return period of low flow regimes were detected between Phase 1 and Phase 2 (Table 7), while significant differences were found in Phase 1 vs. Phase 3, and Phase 1 vs. Phase 4.

3.2.3. Timing

The impact of forest harvesting on the timing of low flows was minor. In comparison to that in the reference years, the average timing of low flows was delayed by 0.39 day in Phase 2 while it was advanced by 0.62 days in Phase 3 (Figure 9 and Table 7). With forest recovered, the average timing was delayed 1.09 days in Phase 4. According to the statistical test (Table 7), the effects of forest harvesting on the timing of low flows in three periods were statistically insignificant.

3.2.4. Variability

As suggested by the analysis, forest harvesting led to increasing variability of low flows. The average CV of low flows in Phase 2 was higher (0.91%) than that in Phase 1 (Figure 10 and Table 7), but the difference in the median of CV between two groups was statistically insignificant (Table 8). The average of the CV of low flows in Phase 3 was also greater (0.41%) than that in Phase 1, and the difference in the median of the CV between them was statistically significant. Similarly, in Phase 4 the average CV was significantly increased 0.78%. Thus, over the period of 1969–1996, forest harvesting continually increased the variations of low flows.

3.2.5. Duration

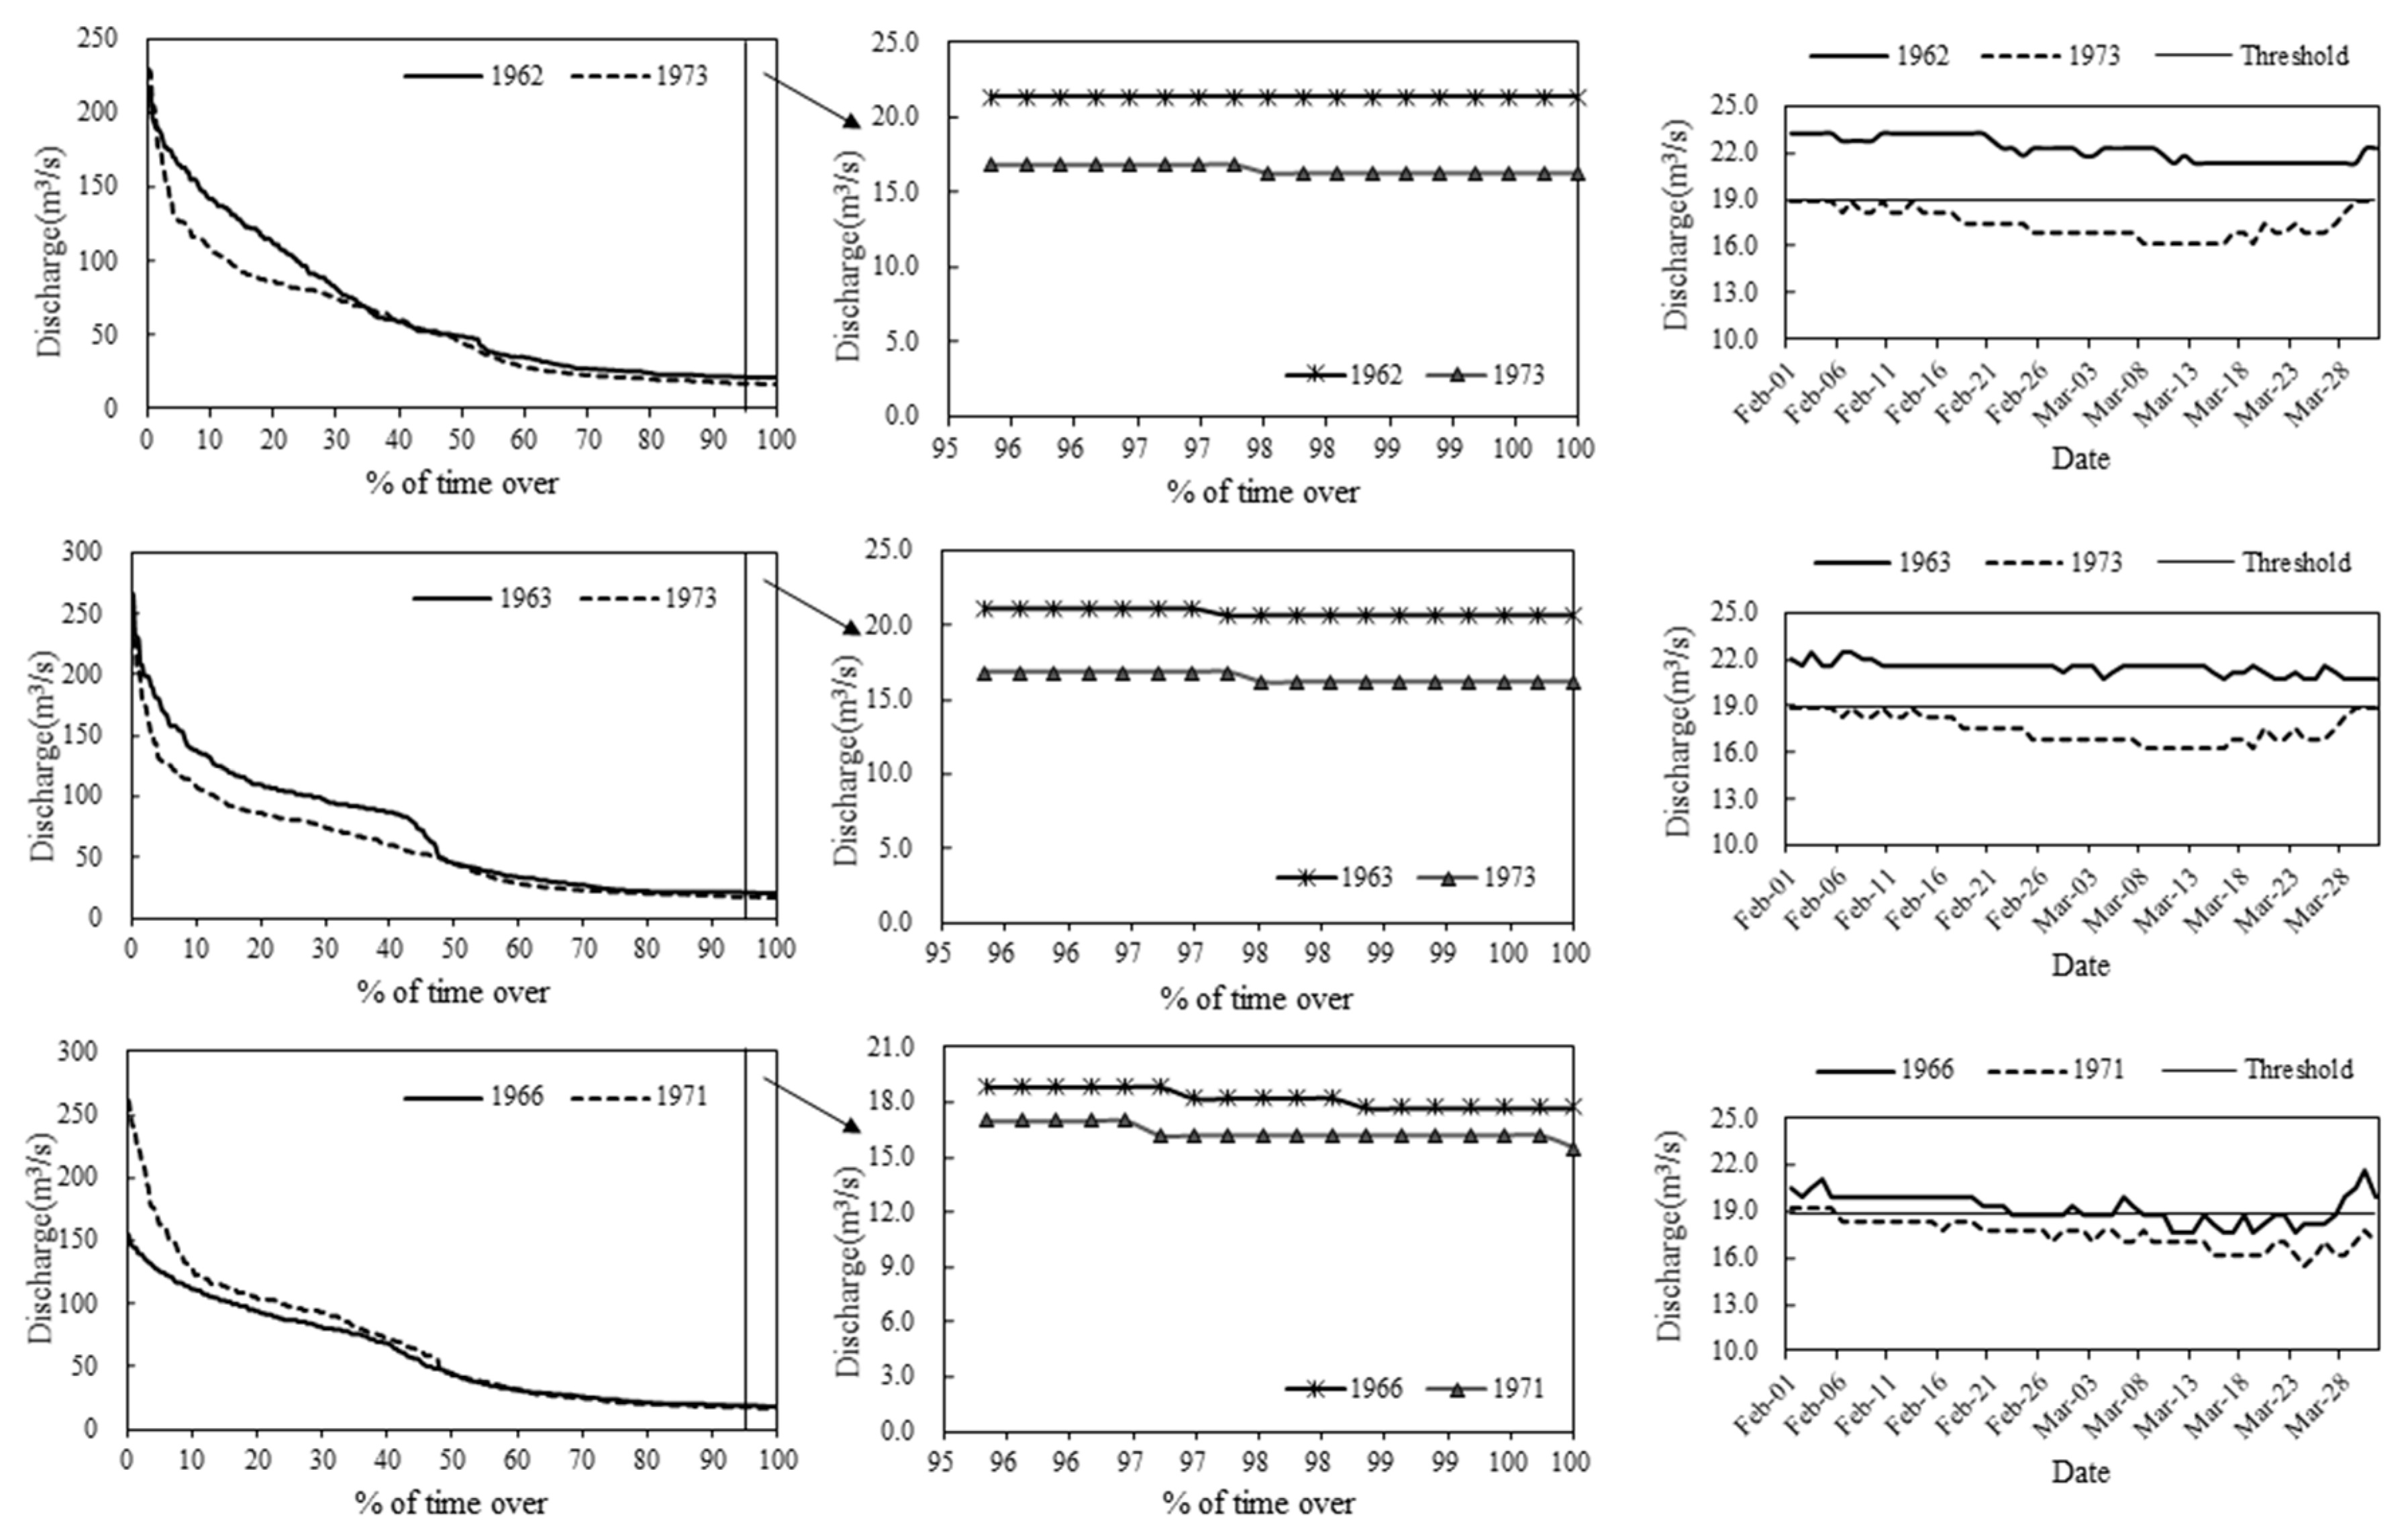
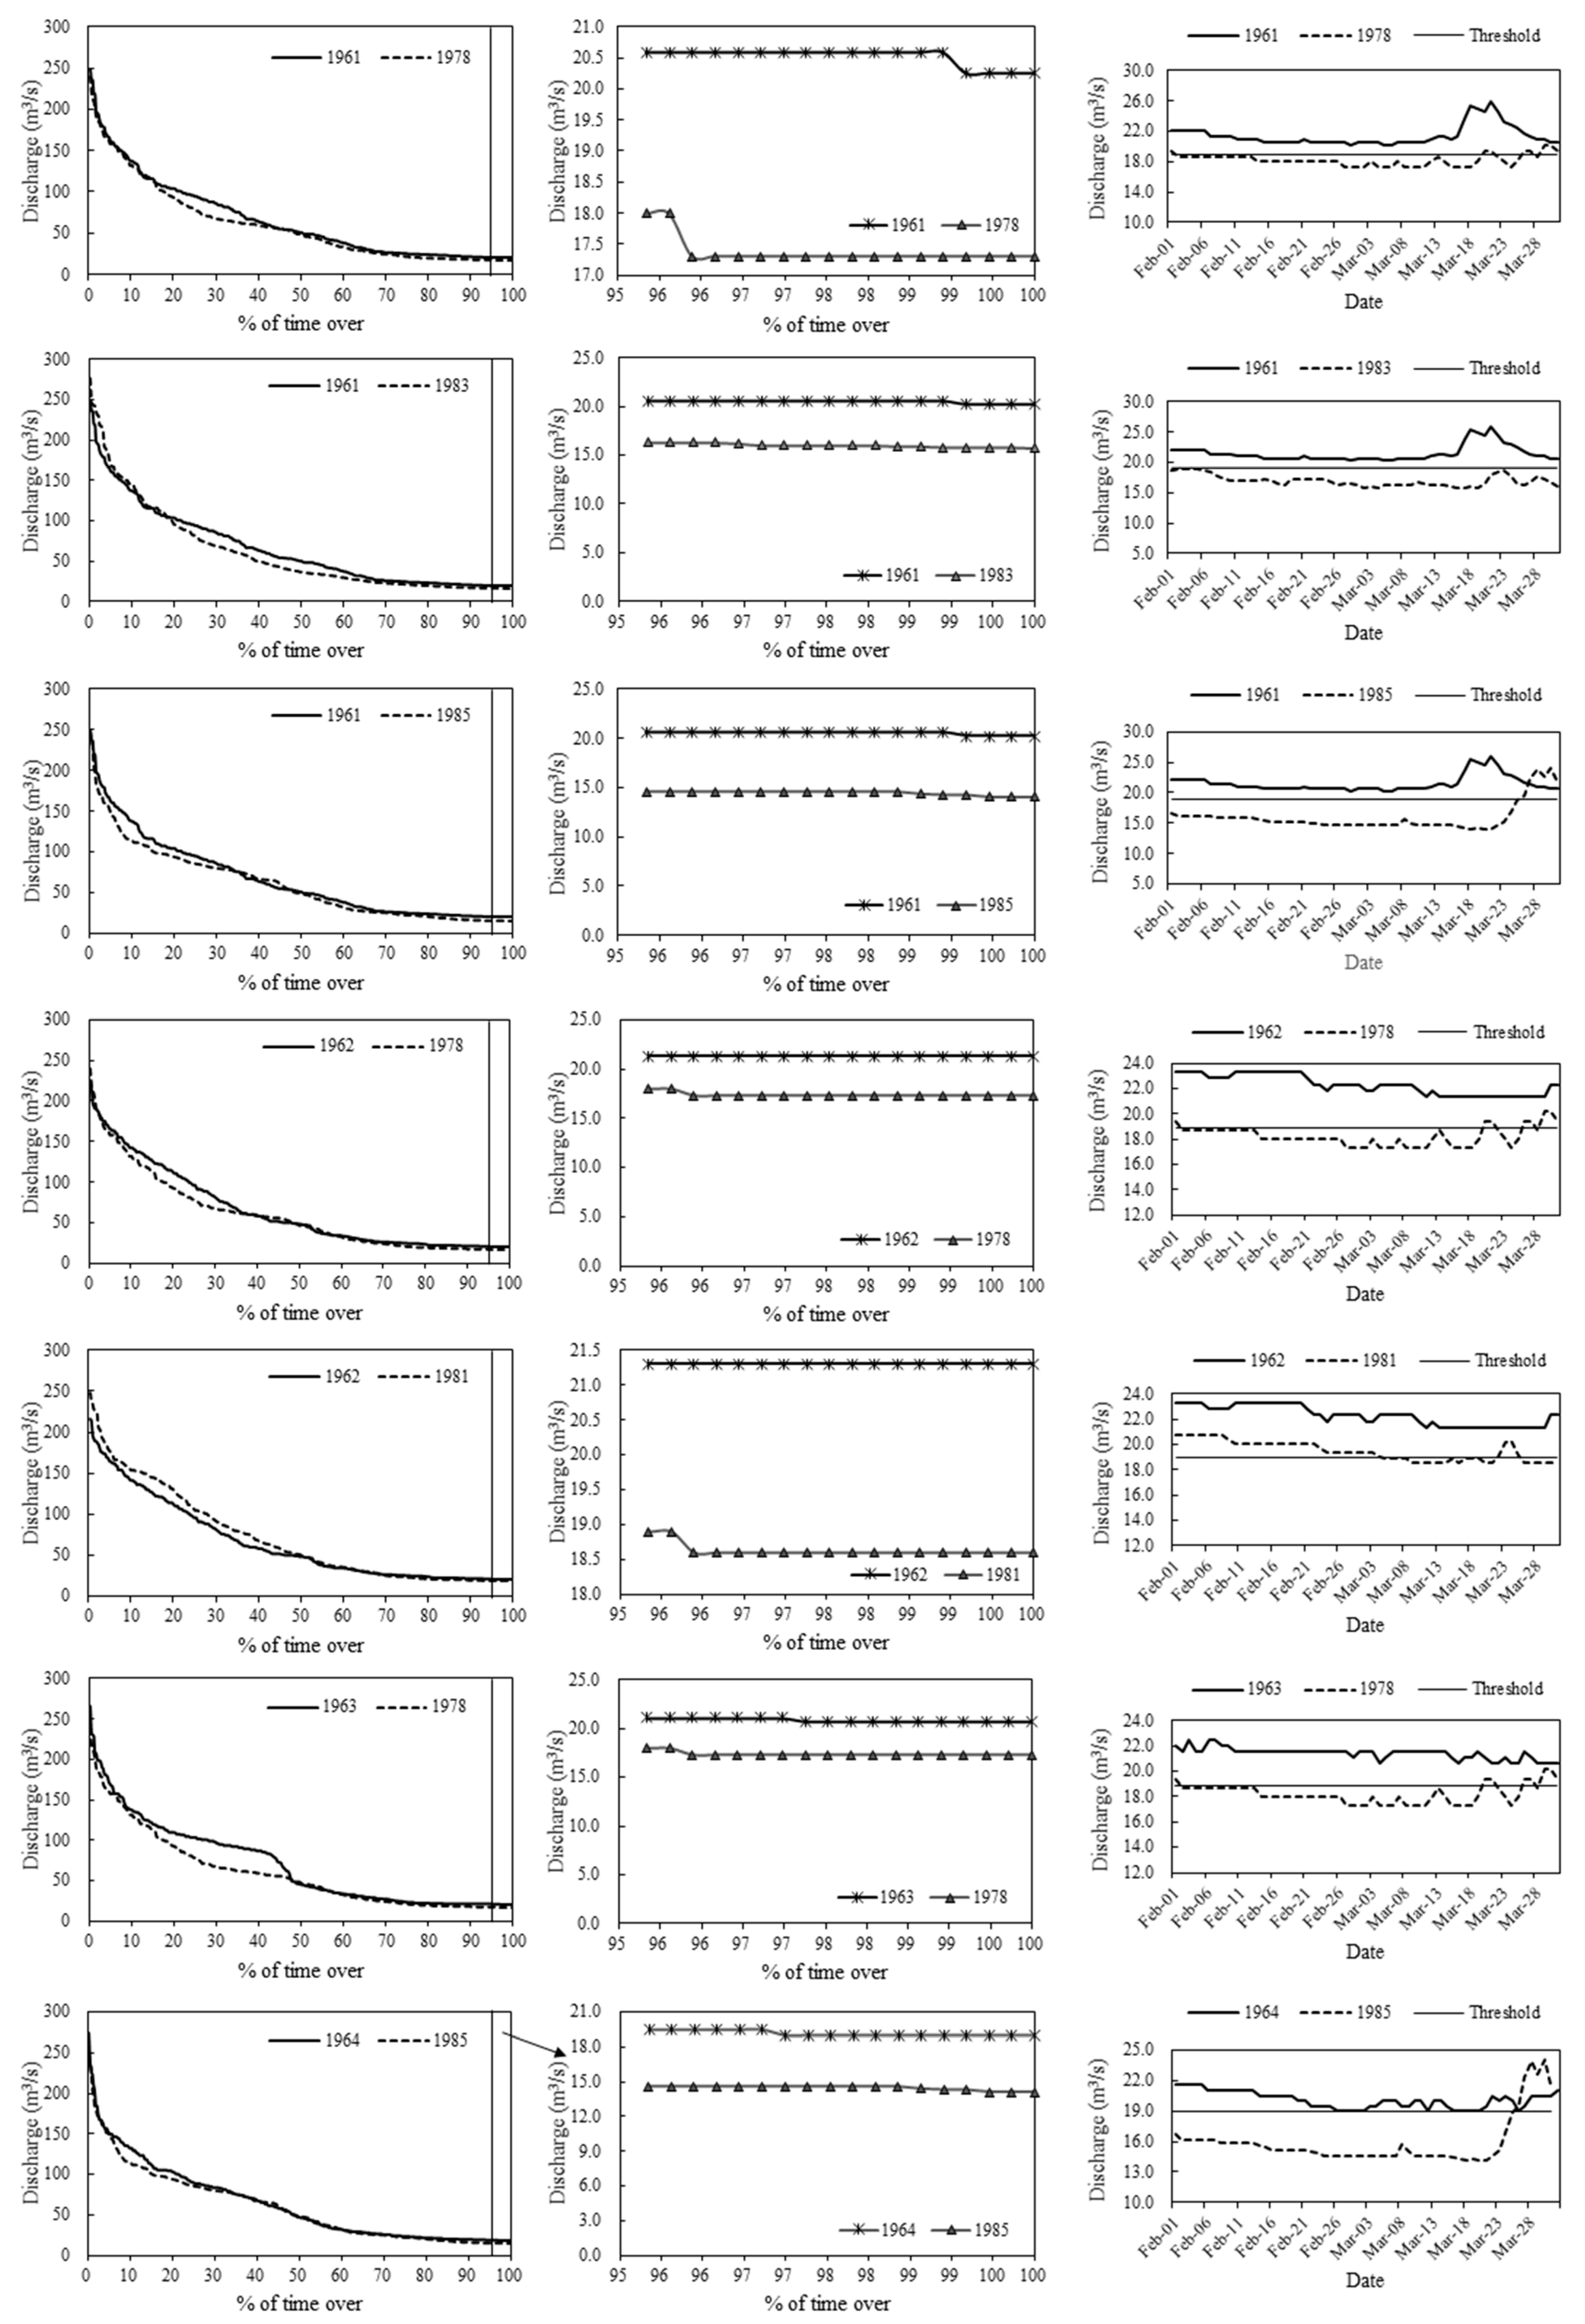
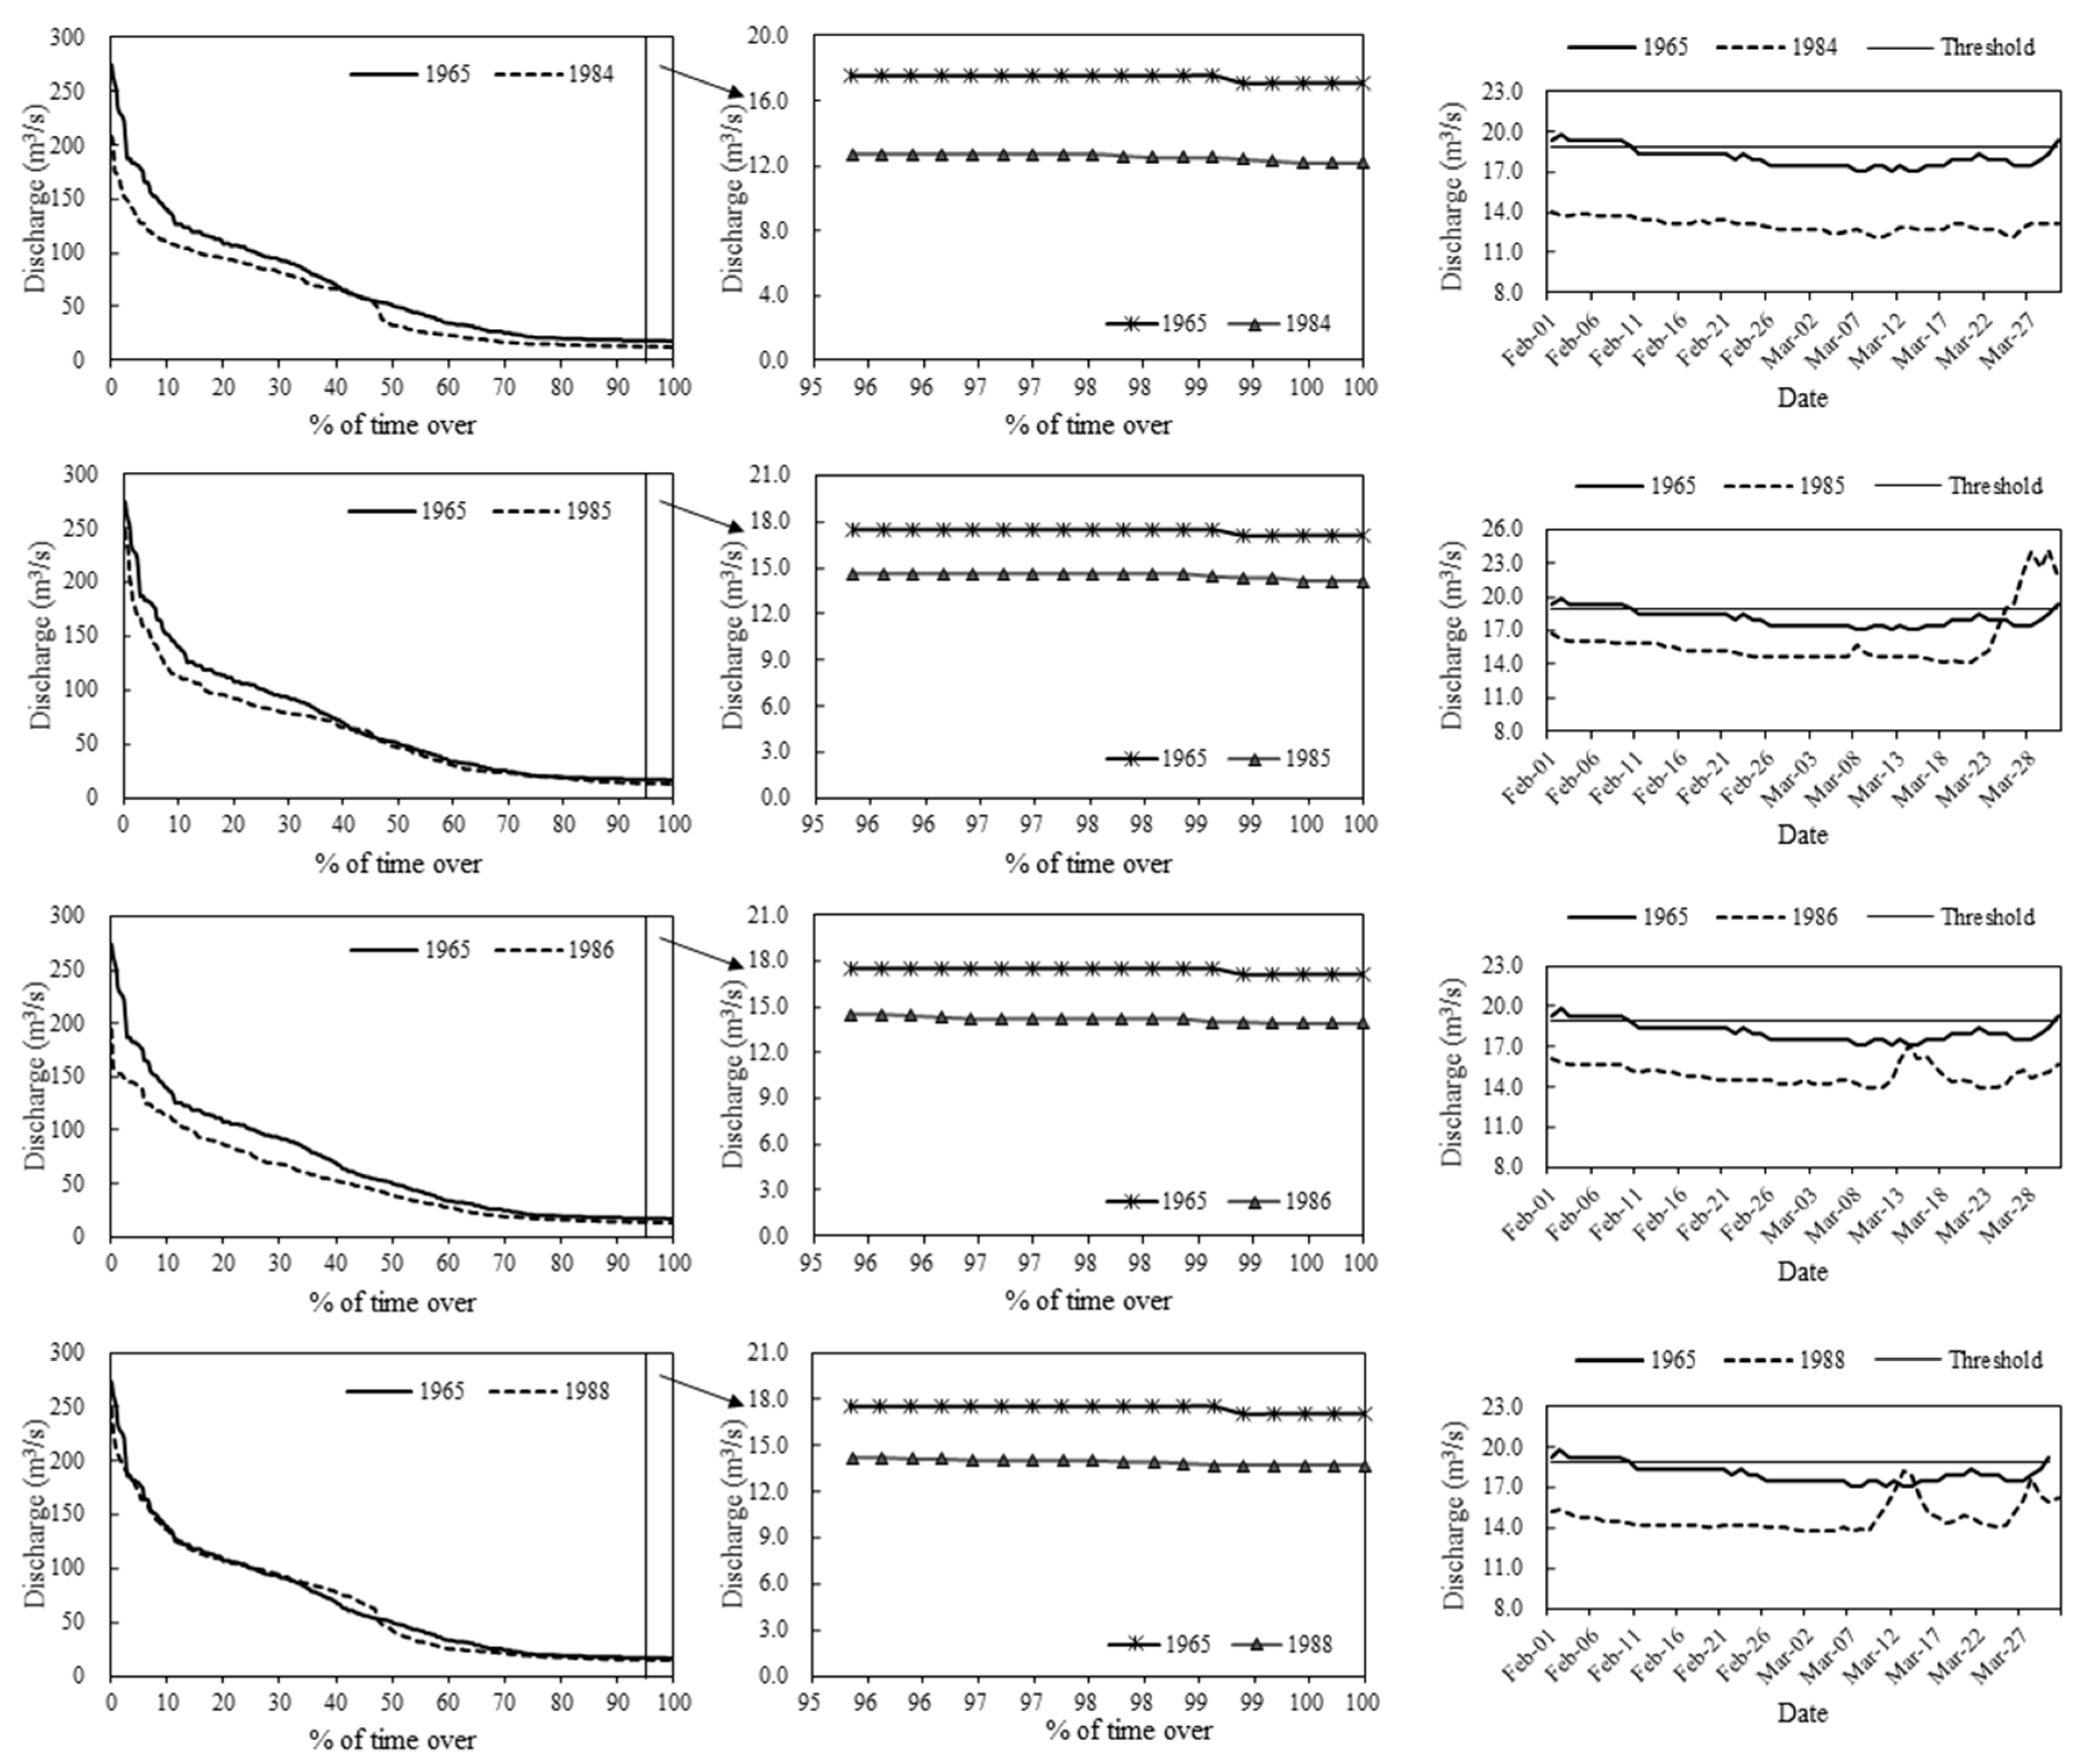
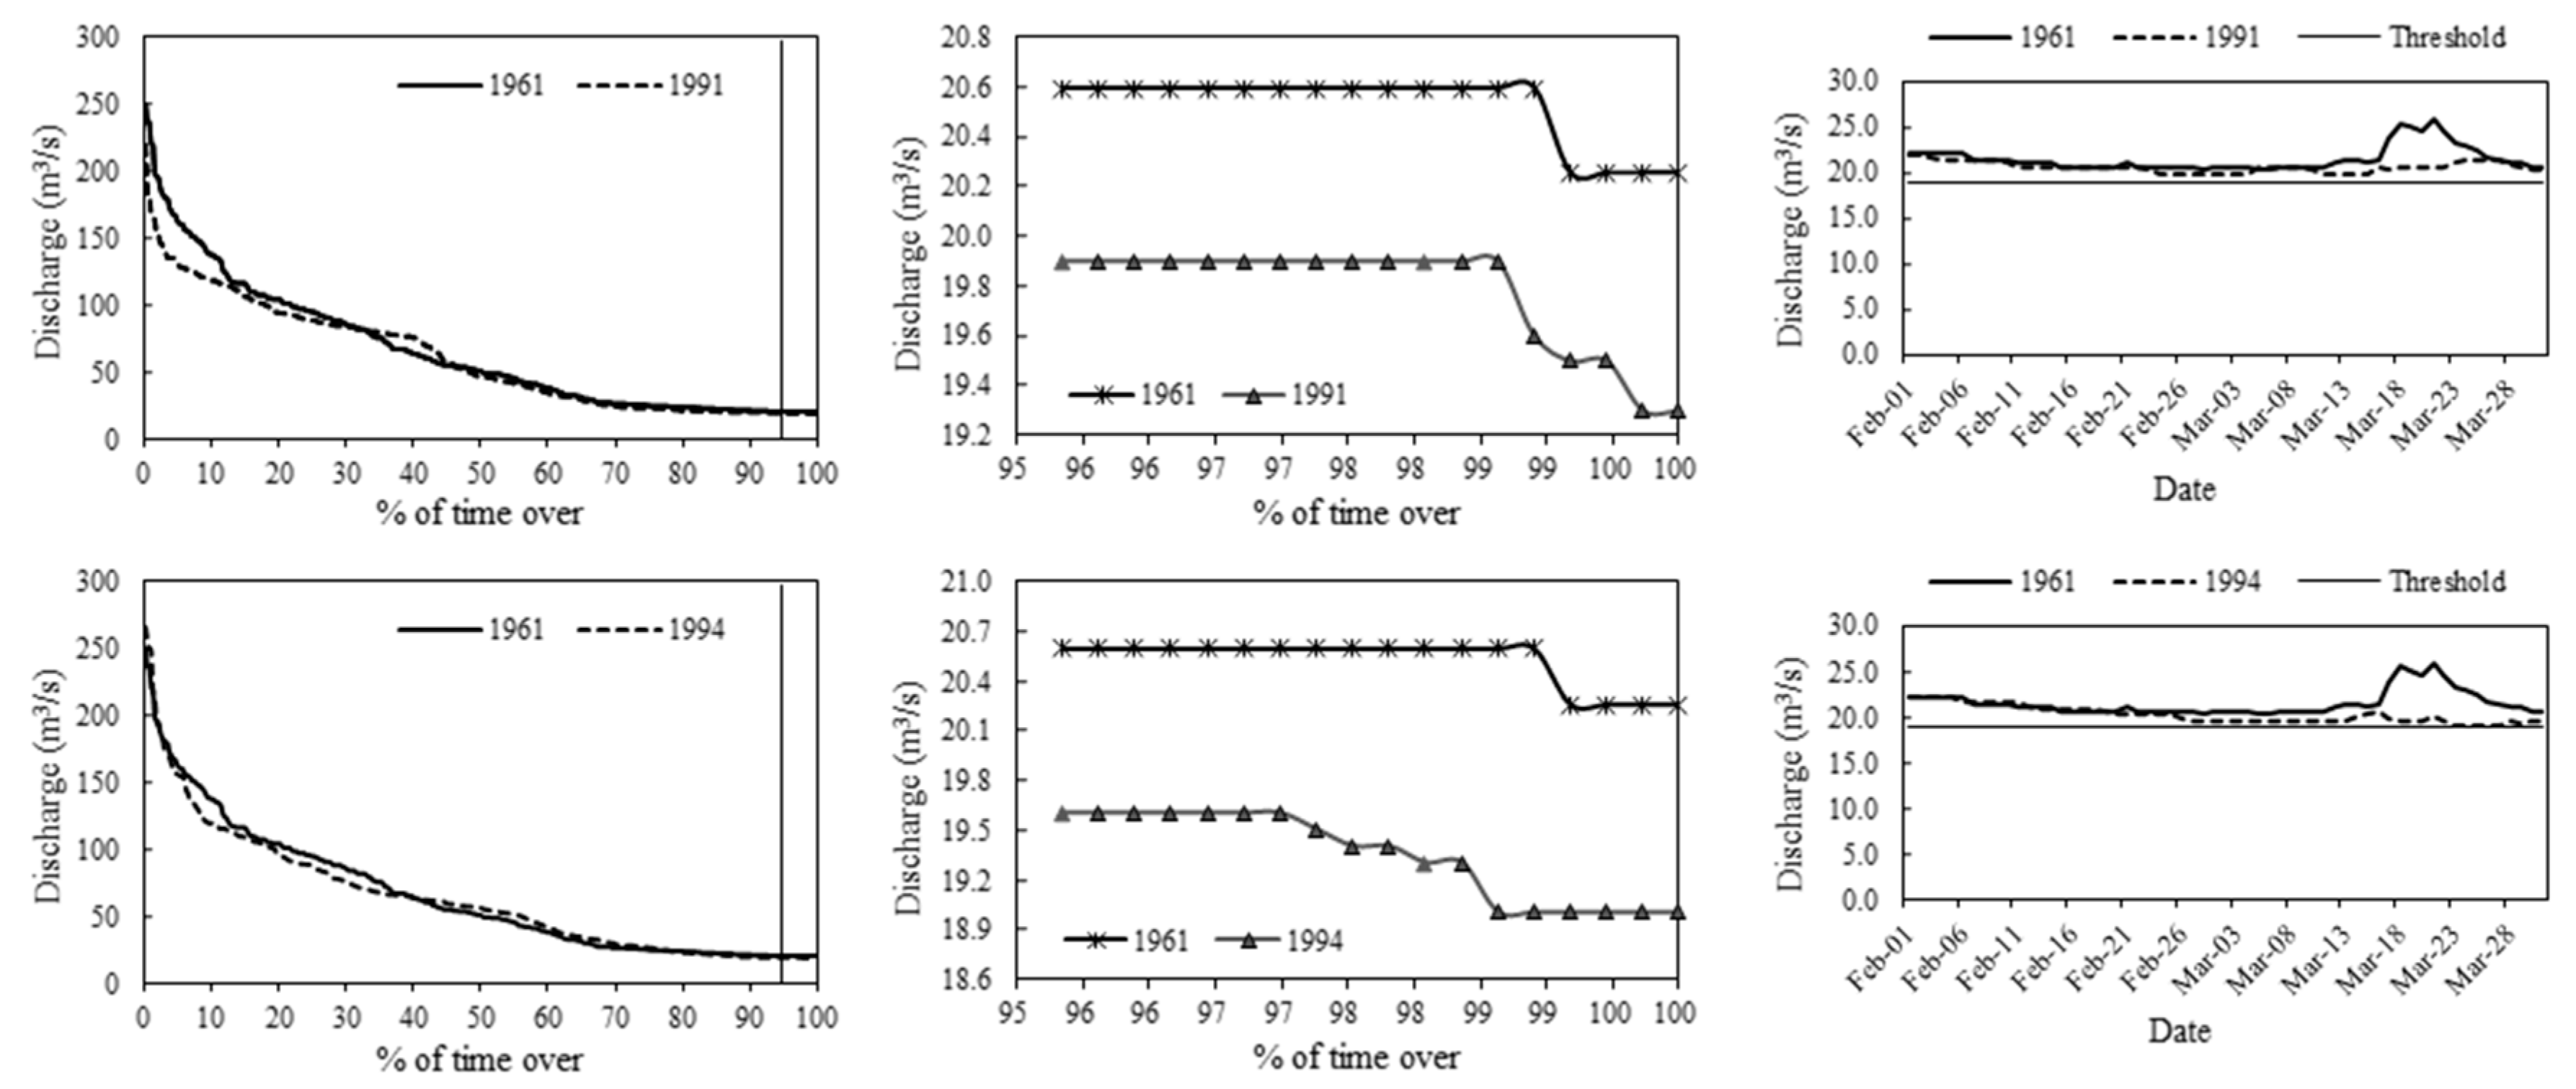
As shown in Figure 11 and Figure 12, the duration of low flows was increased by forest harvesting. In comparison to their corresponding reference years, average duration of low flows in Phase 2 and in Phase 3 was 12 days and 11.45 days longer, respectively (Table 7). For example, in the reference year of 1962, the duration of low flows was 0 days, while in its paired year of 1973, with 9.50% CECA, this value was prolonged to 18 days. Similarly, in the reference year of 1964, the duration of low flows was zero days, while in its paired year of 1985, with 8.56% CECA, it was increased to 18 days. There was no significant difference in the median of the duration of low flows between Phase 1 and Phase 2, while a significant difference was detected between Phase 1 and Phase 3. However, in Phase 4, the average duration was only 5.11 days longer than that of Phase 1 but with statistical insignificant difference in the medians detected (Table 7). As we can see in Figure 12c, the duration of 1961 and 1991 both were zero days.

3.3. Effects of Hydropower Dam on Low Flow Regimes

3.3.1. Magnitude

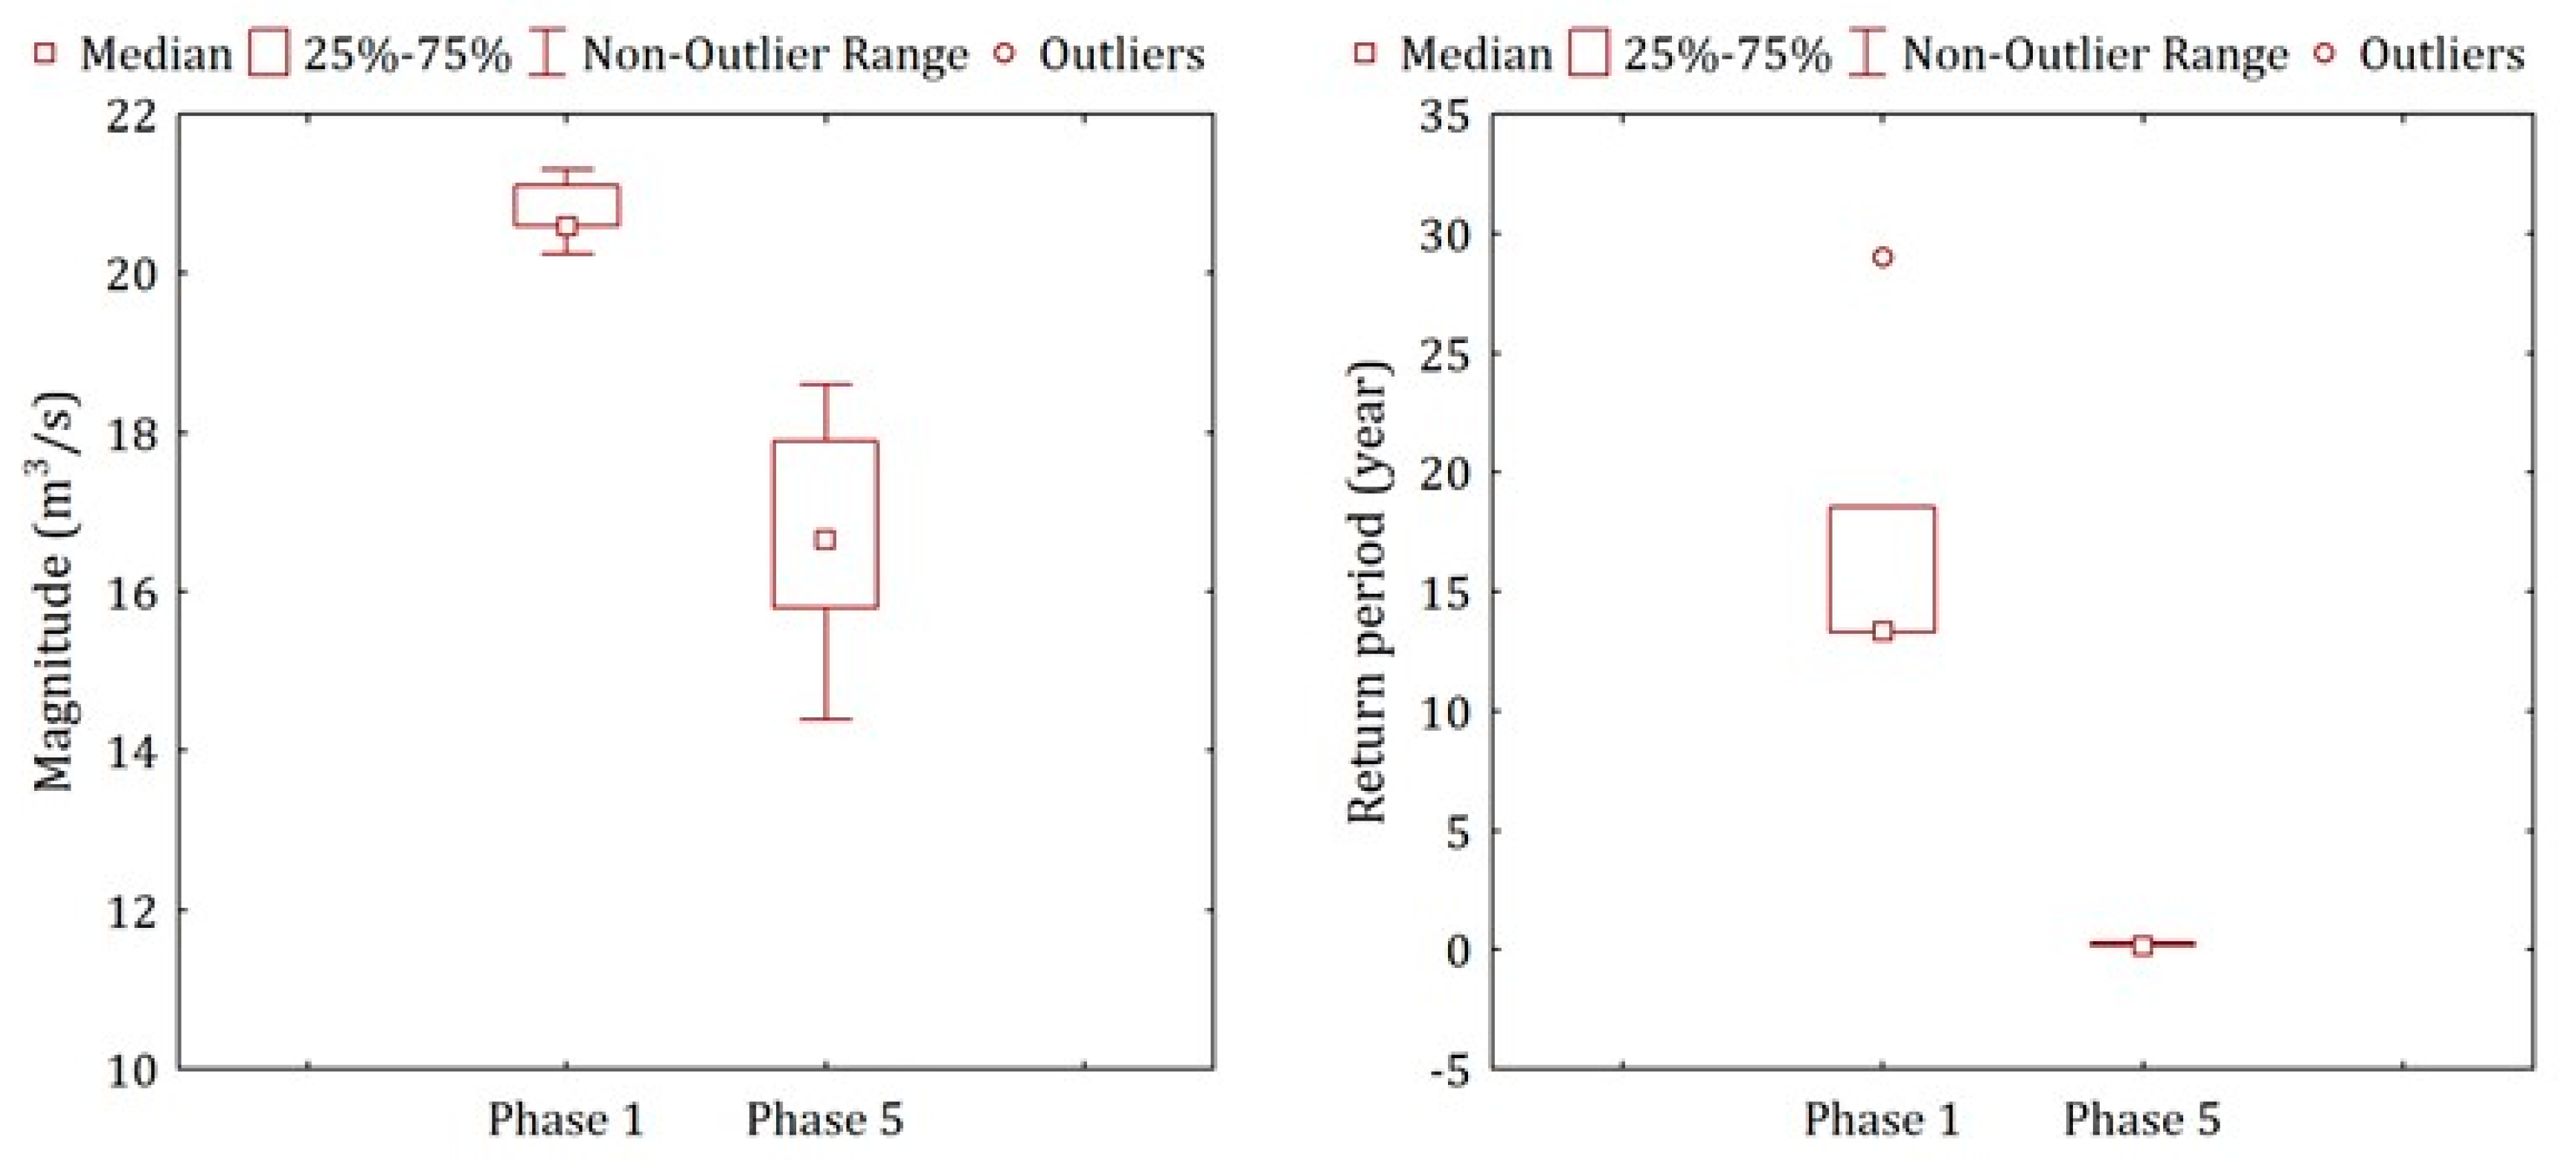
As illustrated in Figure 13 and Figure 14, the magnitude of low flows was decreased significantly due to hydropower dams, with a reduction of 19.71% (Table 8). In addition, a significant difference in the median of the magnitude of low flows between Phase 1 and Phase 5 was detected by the Mann-Whitney U test and Wilcoxon Signed Rank test.

3.3.2. Return Period

The return period of low flows was decreased significantly in the hydropower dam disturbed years (Phase 5) compared to that in the reference years (Phase 1). The average return period in hydropower dam disturbed years was 17.05 years shorter than that in the reference years (Figure 14 and Table 8).

3.3.3. Timing

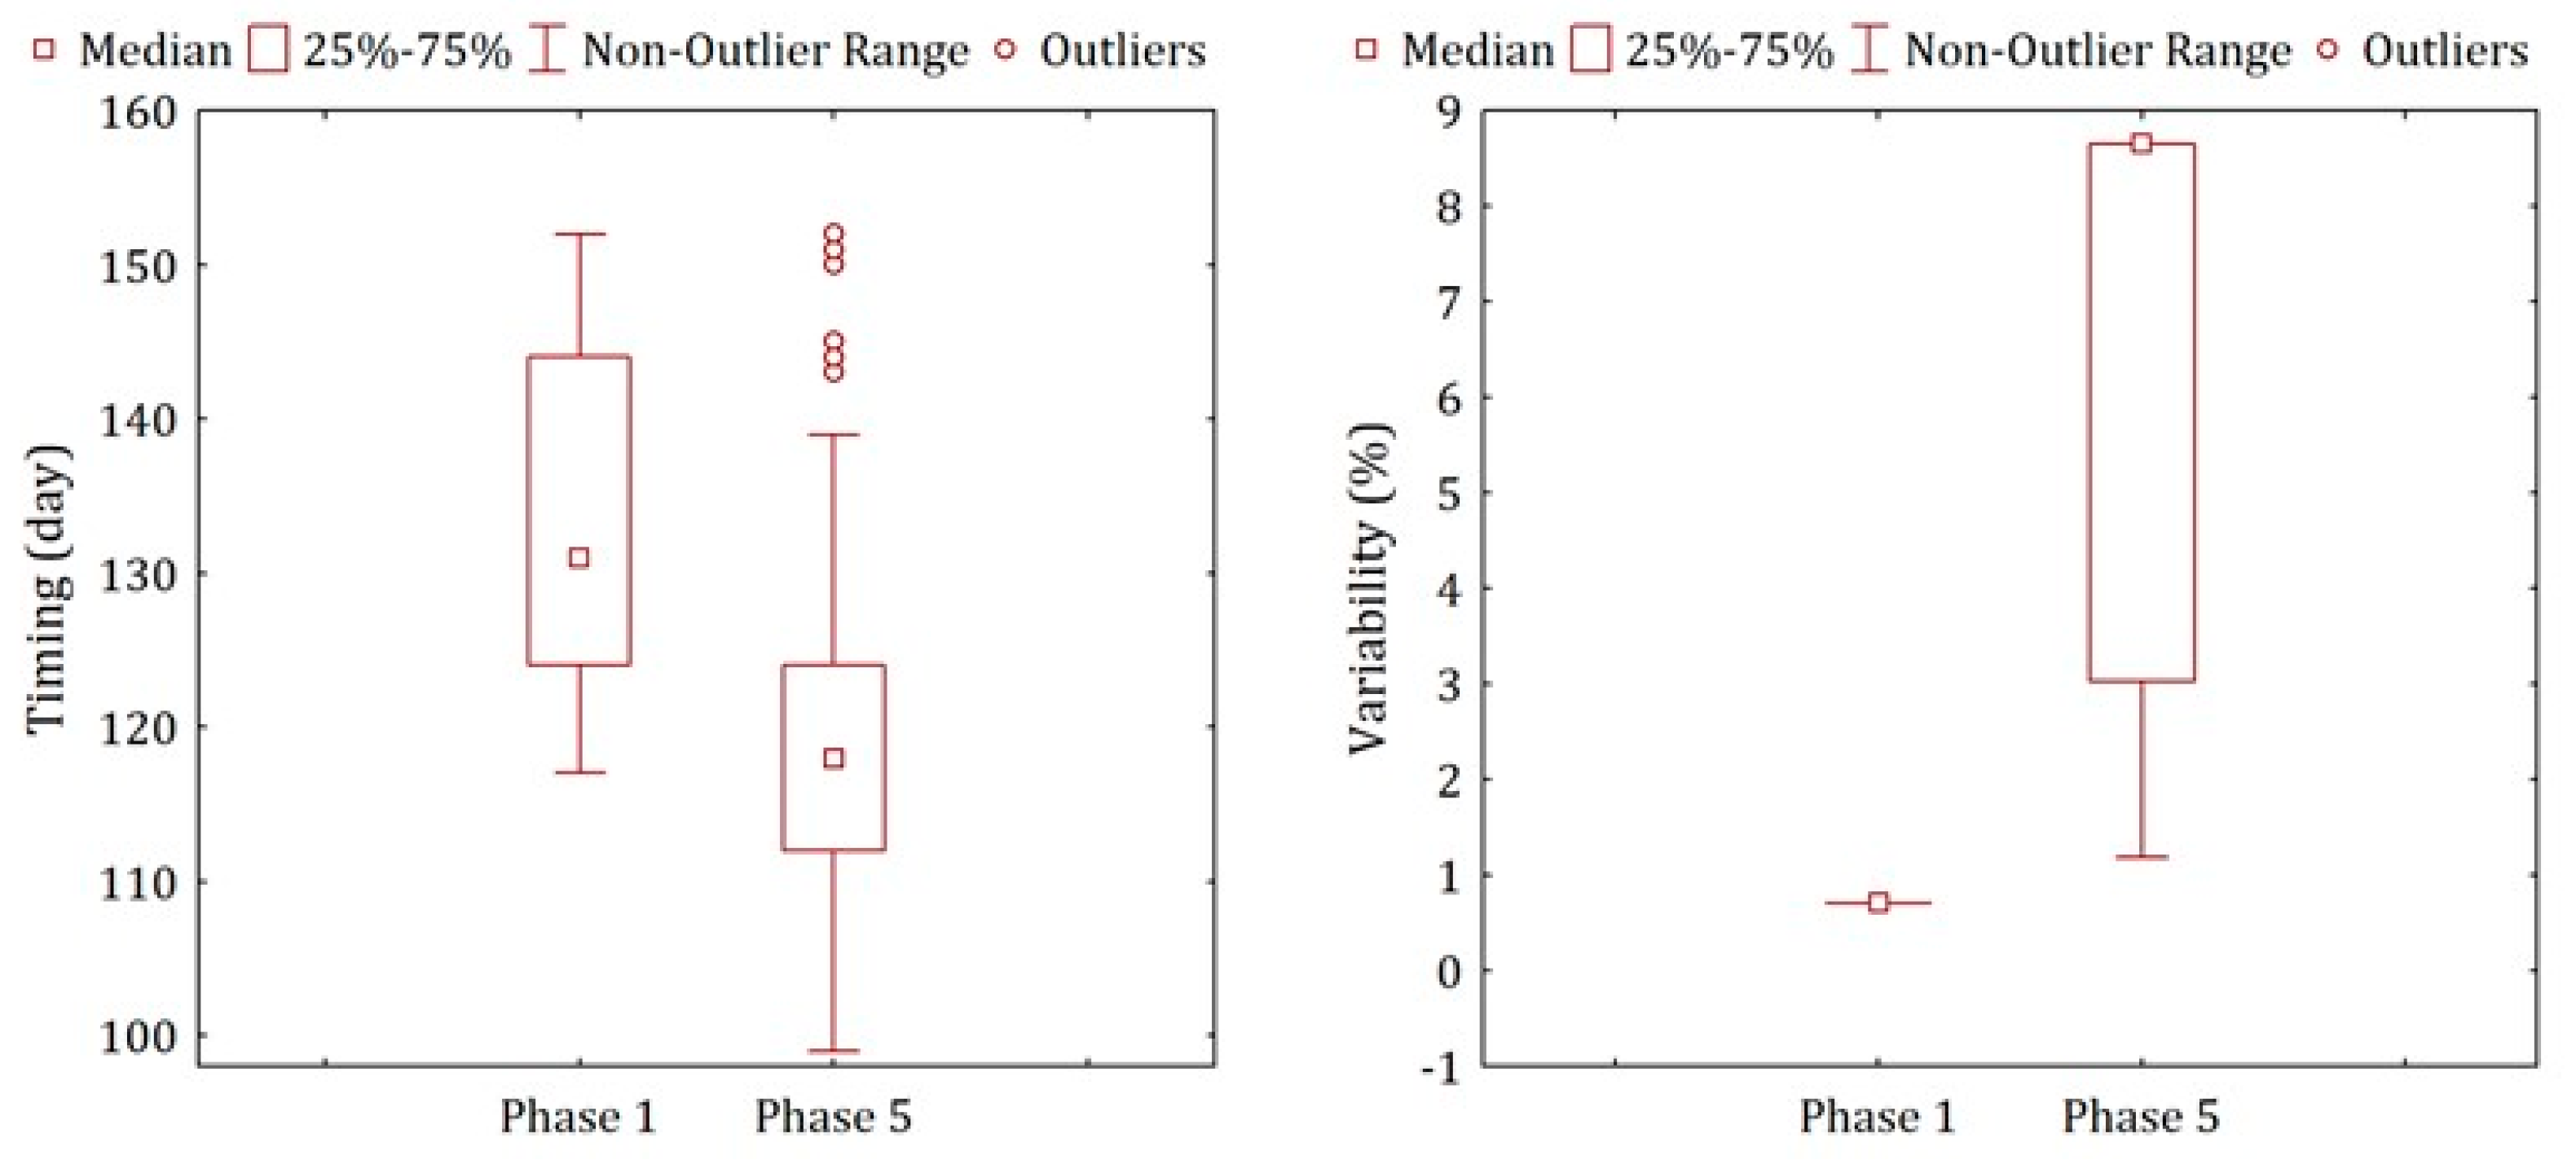
As shown in Figure 15, the timing of low flows was advanced by hydropower dam. The average timing of low flows in a water year for Phase 5 was advanced by 14.87 days compared with that for Phase 1 (Figure 15 and Table 8). In addition, a significant difference in the median of the timing of low flows was detected between Phase 5 and Phase 1 (Table 8).

3.3.4. Variability

As suggested by the analysis, the CV of low flows was significantly increased by hydropower dam (Figure 15). The average CV of low flows in the Phase 5 was significant higher (5.41%) than that in the Phase 1 (Table 8).

3.3.5. Duration

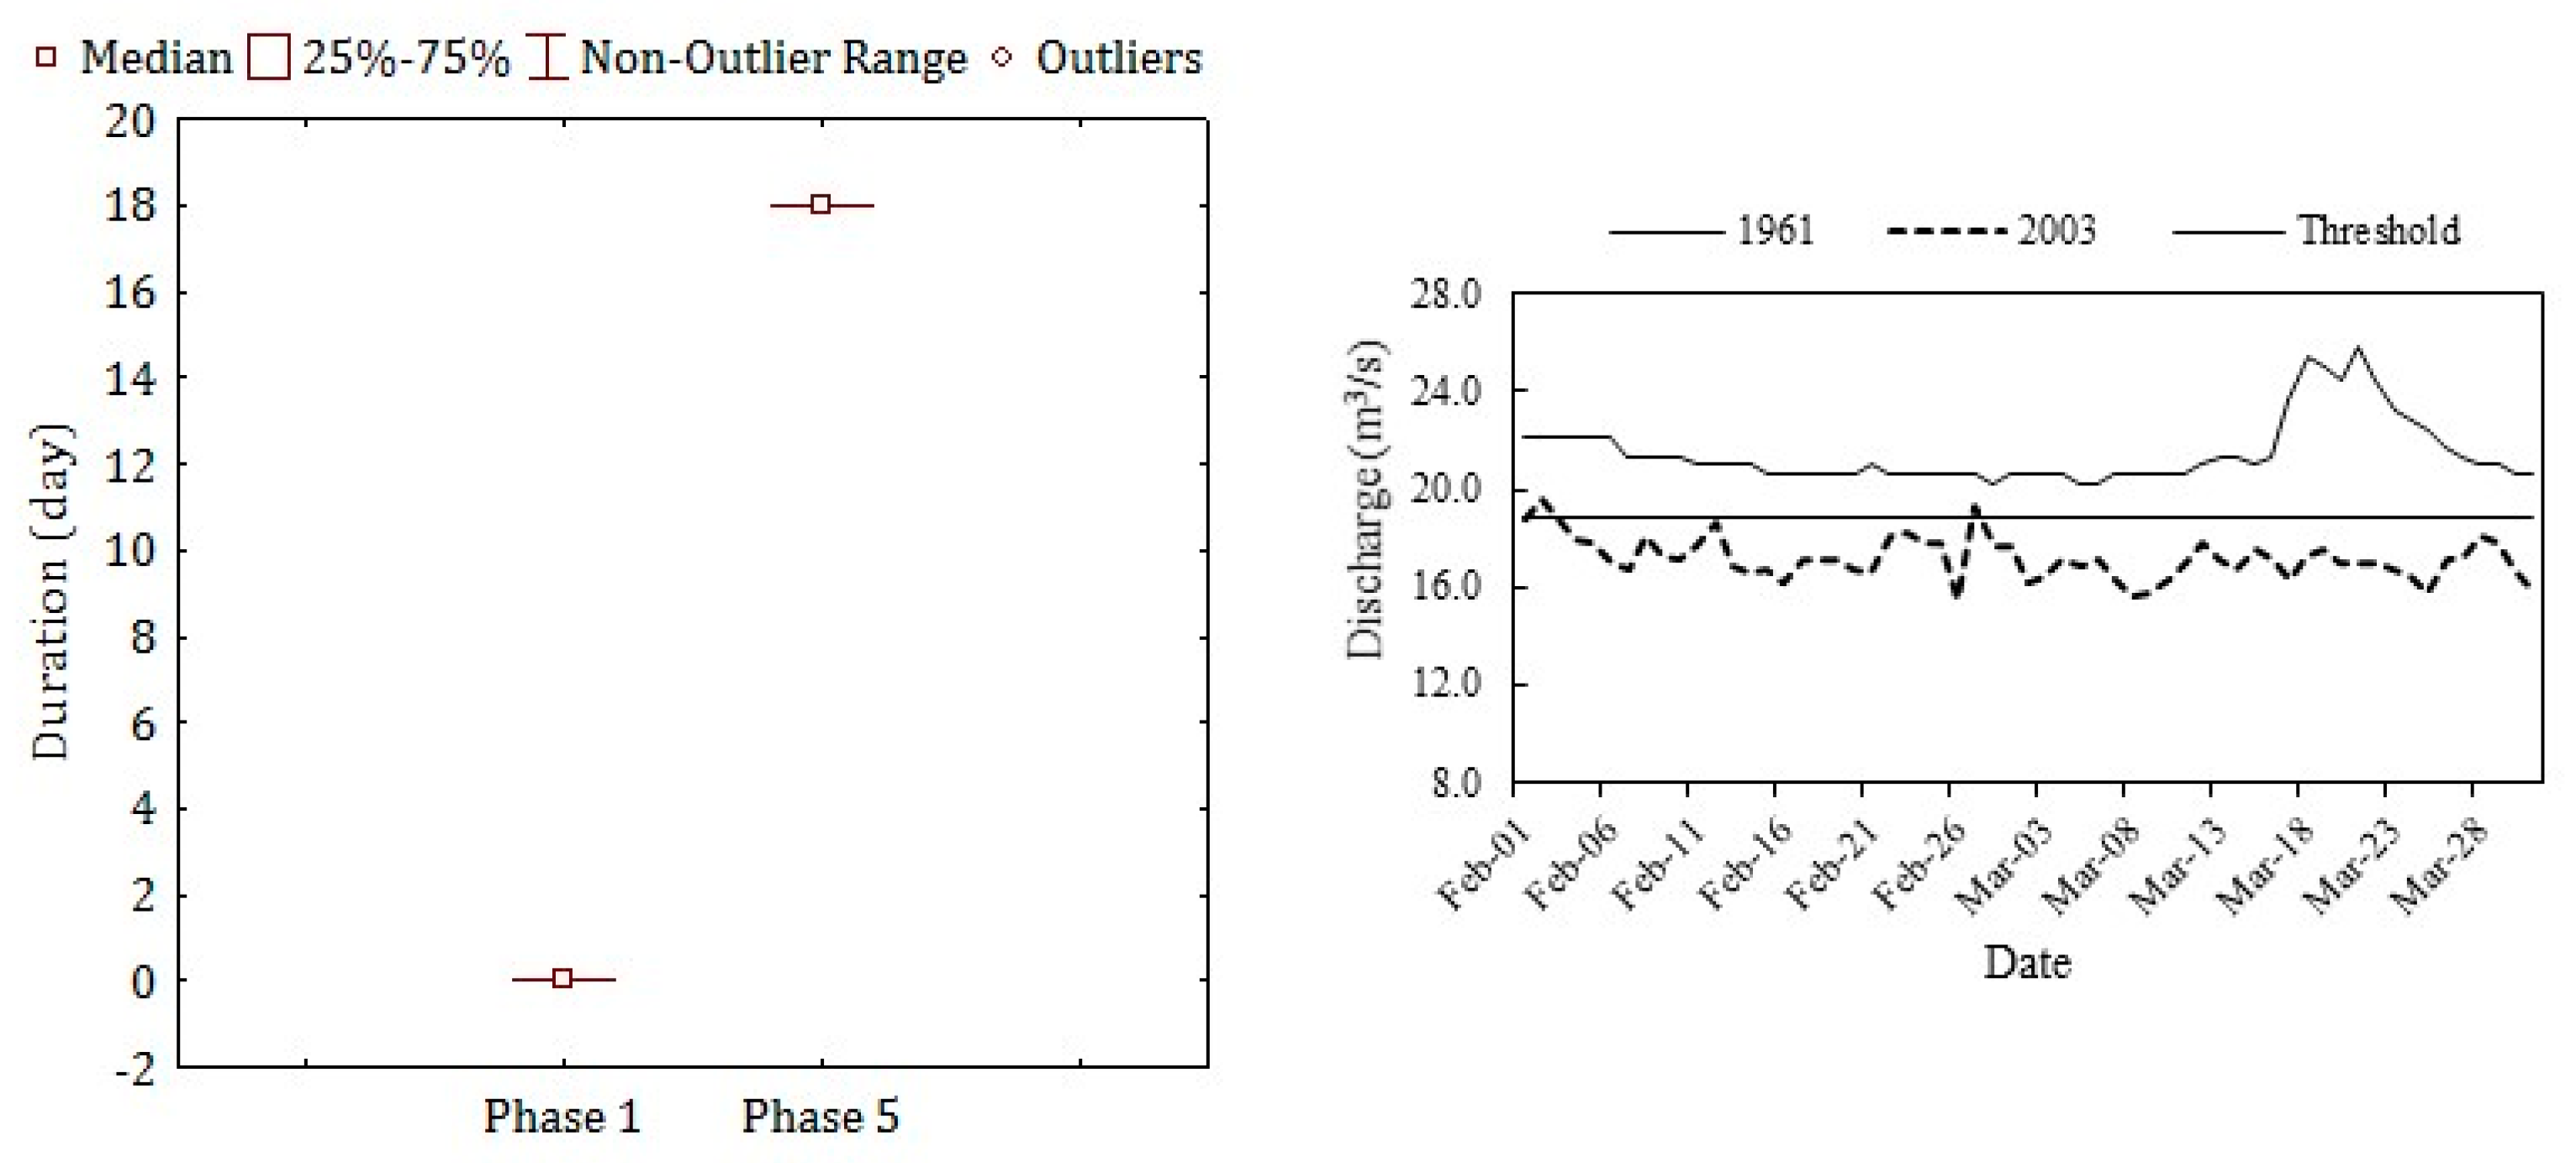
The duration of low flows was greatly augmented by hydropower dams. The average duration of low flows in Phase 5 was increased by 18 days compared with that in Phase 1 (Figure 16 and Table 8). In addition, a significant difference in the median of the duration of low flow regimes was detected between Phase 5 and Phase 1 (Table 8).

4. Discussion

4.1. Impact of Forest Harvesting on Low Flow Regimes

Our results revealed that deforestation caused significant impact on most components of low flow regimes in the Upper Zagunao River watershed. According to the paired-year analysis, deforestation significantly decreased the magnitude (up to 20.51%) and return period of low flows (up to 15.95 years), and increased the variability (up to 0.91%) and duration (up to 12 days) of low flows in spite of limited effect on the timing of low flows. These findings are similar to some other studies [23,65,66]. For example, a study in the Laogou River Watershed, Northeast China found significant alterations of low flow regimes caused by deforestation, where the average magnitude of low flows was decreased by 25.68% and the average CV was increased by 36.77% [67]. Similar findings from the Meijiang watershed in South China were also reported, which claimed that the average magnitude of low flows in the deforestation period was decreased by 30.1%, while the average return period and CV of low flows were increased by 8.9 years and 3.19%, respectively [26]. Another study in the Koga basin, Ethiopia also found that low flow decreased significantly with the forest coverage declining from 16% to 1% [68]. However, opposite conclusions were also found by various studies [30,31,32]. Most of them indicated that forest harvesting can significantly increase the magnitude of low flows as a result of reduced evapotranspiration.
The negative impact of deforestation on low flow regimes in this study watershed is mainly associated with soil disturbance or loss caused by forest harvesting [23,47]. The harvested forest in the Upper Zagunao River watershed is subalpine dark coniferous forest situated at steep slopes with the elevation between 2800 and 3600 m [55,69]. Compared with other forest types, the dominant tree species including Abies faxoniana and Picea purpurea in the study watershed are featured by dense forest canopy, thicker moss and litter layer, lower evapotranspiration, and higher water storage capacity [70,71]. The continuous harvesting activities disturbed the forest floor by removing the understory vegetation and litter and compacting soil, which accelerated the decomposition of organic matter, reduced precipitation interception and water storage by the forest floor, and lowered the soil infiltration rate, which consequently resulted in less soil infiltration and soil water storage [72,73]. More importantly, given the loose soil structure and high content of gravels in the Upper Zagunao watershed [74], without the coverage of litter and moss, frequent storms in wet season led to severe soil erosion, and reduced soil water storage and groundwater recharge in wet season. According to a stand-level study in the study watershed, soil moisture was reduced by 36% after deforestation [39]. Thus, due to soil loss and damage by forest harvesting, a decline in the magnitude and return period of low flows and an increase in the variability and duration of low flows were eventually found [75,76]. In other words, the “sponge” function of a forest ecosystem with complex soils, tree roots, and litter layers that absorbs and holds huge quantities of wet season rainfall and releases the stored water in the dry season was damaged after forest harvesting in the study watershed [23].
The impact of forest harvesting on low flow regimes changed over time and even diminished to some extent during Phase 4. As we can see in Figure 7 and Table 8, the reduction in the magnitude of low flows attributed to forest harvesting declined from 20.51% in Phase 2 (1969–1975) to only 7.61% in Phase 4 (1989–1996), and the reduction in the duration of low flows caused by forest harvesting dropped from 12 days in Phase 2 to 5 days in Phase 4. The recovery of low flow regimes may be due to natural vegetation recovery coupled with the plantation of Picea asperata Mast in the logged area. As suggested by a previous study in the Zagunao River watershed [54], naturally regenerated broad-leaved trees and shrubs occupied the logged sites 10–20 years after harvesting, and a fully developed broad-leaved forest occurred 20–40 years later [69]. The logged coniferous forest with thick moss and litter layers was originally characterized by larger water-holding capacity of soil, moss, and litter, lower evapotranspiration (471 mm/year), and greater soil water storage in the wet season available for dry season runoff generation [46,77]. In comparison, the regenerated broad-leaved or planted coniferous forests were featured with vigor growth and greater evapotranspiration (674.69 and 642.39 mm/year). In addition, these forests with less developed forest floors have lower water-holding capacity of soil, moss, and litter layers, and resultant lower soil water storage in the wet season [46,77]. Therefore, due to the higher water consumption and lower mass and litter layers’ water storage of regenerated broad-leaved or planted coniferous forests in wet season, less water is available for the generation of low flows in the dry season, which was particularly evident in Phase 2 and Phase 3 when no recovery in low flow regimes were found. However, with the natural regrowth of coniferous forest 40 years after forest harvesting, low flow regimes started to recover. Thus, the negative impact of forest harvesting declined significantly in Phase 4, which is expected to diminish in Phase 5 if the study watershed experiences limited disturbances. The estimated recovery time of annual mean flow was only about 20 years after intensive harvesting in the Upper Zagunao watershed [47]. However, our study demonstrated that a longer time (over 40 years) was required for low flows to recover. As is known, the impact of forest harvesting on low flows is closely related to forest floor disturbances [78,79,80]. The recovery of low flow regimes mainly relies on the restoration of the forest floor including soil, moss, and litter layers and their associated hydrological functions such as soil infiltration and water-holding capacity [23]. Given that this type forest has a slow grow that can take between 40 to 50 years to return to the original size [69], it is reasonable consider that low flow regimes may take over 40 years to normalize after forest harvesting in the Zagunao watershed.

4.2. Impact of Hydropower Dams on Low Flow Regimes

Large hydropower dams can regulate streamflow by storing the floods in the wet season and releasing the stored water to downstream in the dry season, resulting in an increment in low flows [81,82,83,84]. For example, Zou [85] analyzed the effects of the Danjiangkou Dam on the downstream flow regimes, and found a significant increment in the magnitude of low flows after the construction of the dam, as well as an 8-day delay in the timing of low flows. On the contrary, our findings suggested that due to hydropower dams, the magnitude, return period, and timing of low flows were significantly decreased by 19.71%, 17 years and 15 days, respectively, while the variability and duration of low flows were significantly increased by 5.41% and 18 days, respectively, in the Zagunao watershed. This is in accordance with some studies of large dams, which found long-lasting cease-to-flow events in the post-dam period in the Huaihe watershed [18] and a 27-day advancement in the timing of low flows due to the regulation of the Three Gorges Dam in the Dongting Lake in the Yangtze River basin [86]. More importantly, studies on small and medium-sized hydropower dams without water storage capacity suggested more significant negative effects on downstream flow regimes, especially in rivers with a large number of small-sized dams [17,22]. In the study watershed, there are two medium-sized cascade hydropower dams (Red Leaf and Lixian) constructed in the mainstream of the Zagunao River, where upstream flows are directly diverted to powerhouse to generate energy through the diversion tunnels, resulting in flow reductions and even cease-to-flow events in the dry season [87]. The cease-to-flow sections near the Red Leaf II hydroelectric power dam and Lixian hydropower dam were up to 11 and 5 km, respectively [49]. Our results further highlighted the negative effect hydropower dams on low flow regimes. Unlike the impact of forest harvesting, all components of low flow regimes were significantly altered by hydropower dams in the Upper Zagunao River watershed, which may yield greater impact on aquatic ecosystems, especially for native fish species.

4.3. Ecological Implications for Watershed Management

Our results demonstrated that both forest harvesting and hydropower dams can yield significant effects on low flow regimes including reducing the magnitude and return period, advancing the timing and increasing the variability and duration of low flows, which will lead to great negative impacts on water supply in the study watershed and its downstream cities. The Upper Zagunao River as one of the most important headwaters of the Yangtze River is essential for water supply of the populated cities in the Chengdu Plain as well as the Upper Yangtze River basin. The significant alterations of low flow regimes in the Upper Zagunao River, the second largest tributaries of the Upper Minjiang River, will inevitably produce negative effects on agricultural irrigation and water use in the Chengdu Plain, e.g., water shortage or conflicts of water use in dry season.
In addition to the impact on water supply, the alteration of low flow regimes will yield negative impact on aquatic ecosystem in the Zagunao watershed. The low flow regimes play an important role in maintaining healthy habitats and life cycle for aquatic species [88]. Reduced magnitude, return period and timing, and increased duration and variability of low flows can degrade habitats in low flow seasons, worsening the living conditions of sensitive aquatic species, and affect fish spawning and hatching, resulting in greatly reduced biodiversity of aquatic ecosystem [44]. For example, the Prenant’s Schizothoracin, a commercial fish in the Zaguano River, actively live in the bottom of the rapids and often spawn in March to May; their spawning grounds are mainly distributed in streams near the hydropower dams. The population and diversity of native fish species such as Prenant’s Schizothoracin were significantly lower than that in 1960s [49]. The degradation of aquatic ecosystems is believed to be caused by the alteration of low flow regimes associated with forest harvesting and hydropower dams.
As mentioned above, low flow regimes started to recover in Phase 4, 40 years after forest harvesting, and were expected to reach a full recovery in Phase 5. However, the hydrological recovery was interrupted by hydropower dams which continued to alter the low flow regimes in the study watershed. Traditionally, the negative effect of dams on low flow regimes has been well recognized by water resource managers. Our study demonstrated appropriate forest management plans, e.g., carefully designed forest restoration projects to help in offsetting the negative effect of hydropower dams on low flow regimes in the Upper Zagunao watershed. This could be a cost-effective and environmentally friendly way to limit dam effects on flow regimes that can be applied in many other watersheds. Therefore, there is a call for a collaboration of water and forest managers to design a watershed management plan in this subalpine watershed with a focus on restoring the hydrological function of forest ecosystems to limit the negative effects of human activities such as dam construction on flow regimes and associated water supply and aquatic ecosystem protection.

4.4. Limitations and Future Studies

As is well-known, spatial heterogeneity in the climate is substantial in a mountainous watershed. The use of climate data from one station fails to capture the detailed spatial variation in climate, especially precipitation input for the whole watershed. In this study, the climate data were used for identifying a pair of years with similar climate conditions, rather than being directly used to do calculations of hydrological variables, for example, evapotranspiration. That is, they were applied for indicating climate temporal variations, e.g., differences in climate conditions between two years, which were mainly controlled by regional or continental climate circulations and oscillations. Thus, we believe the climate trend or temporal variations in one station can be representative for the study watershed and the bias due to the application of climate data from one station in this study can be minor. However, it highlights the need for improving the quality of climate data in our future work. Moreover, the paired-year approach treated the whole study watershed as a “black box”, which failed to investigate the impact of watershed disturbances on hydrological processes, e.g., soil water storage, infiltration, groundwater, and evapotranspiration. Hydrological modeling is recommended for future study to understand the effects of watershed disturbances on hydrological processes and their mechanisms.

5. Conclusions

Both forest harvesting and hydropower dams caused significant alterations of the components of low flow regimes in the Upper Zagunao River watershed. Forest harvesting produced negative effects on the magnitude and return period of low flows, while positive impacts on the variability and duration of low flows. The impacts of forest harvesting on low flow regimes started to diminish with forest recovery, and the recovery occurred 40 years after forest harvesting as the forest recovery processed. In addition, hydropower dams decreased the magnitude, return period, and timing of low flows, whilst increasing the variability and duration of low flows, which will lead to degraded aquatic ecosystems and unstable water supplies for downstream cities in the Chengdu Plain. Our findings indicated that a watershed management strategy for offsetting the negative effect of hydropower dams on low flow regimes by restoring hydrological functions of subalpine forests is highly recommended.

Author Contributions

Data collection, Y.H.; data analysis, Z.J.; manuscript drafting, Z.J. and M.Z.; research design, M.Z.; manuscript revision, M.Z. All authors have read and agreed to the published version of the manuscript.

Funding

This research was supported by the China National Science Foundation (No. 31770759) and National Program on Key Research and Development Project of China (No. 2017YFC0505006).

Conflicts of Interest

The authors declare no conflict of interest.

Appendix A

Table A1. Definitions for flow regime components [2].
ComponentsDefinitions
MagnitudeThe amount of water moving past the watershed outlet per day (m3/s);
Low flows: Daily flows ≤ Q95%.
FrequencyHow often a flow above a given magnitude recurs over specified time interval, for example, a 50-year flood is equaled to or exceeded on average once every 50 years;
Low flows: Return period of low flows.
TimingThe time for a given flow event (e.g., annual peak flow) that occurs regularly. It is also referred as predictability of a given flow event;
Low flows: Average date for low flows in a water year.
VariabilityVariations of flows describing how spread out or closely clustered of flow magnitude. Coefficient of variation is often used to measure variability for a set of data;
Low flows: Coefficient of variation for low flows at each year.
DurationThe period for given flow events (e.g., low flows) last;
Low flows: The number of days with daily flows equal to or less than low flow threshold (low flow threshold: Median of low flows during reference period 1959–1968).
Table A2. Correlation analysis between low flow magnitude and climate variables.
Variables1959–19751959–19881959–19961989–20061959–2006
KendallSpearmanKendallSpearmanKendallSpearmanKendallSpearmanKendallSpearman
PrecipitationAnnual−0.125−0.121−0.152−0.202−0.064−0.102−0.275−0.404−0.141−0.204
Dry season−0.229−0.315−0.094−0.1380.0370.063−0.275−0.403−0.007−0.01
Wet season−0.125−0.116−0.23−0.282−0.144−0.187−0.249−0.355−0.186−0.25
Low flow period0.1250.2020.410.0460.0270.041−0.079−0.0850.0070.024
TmaxAnnual0.030.080.300 *0.446 *0.265 *0.391 *0.0920.1170.250 *0.371 **
Dry season0.0370.0330.1740.2560.0630.087−0.131−0.1510.0640.094
Wet season0.030.080.300 *0.446 *0.265 *0.391 *0.0920.1170.250 *0.371 **
Low flow period−0.229−0.315−0.005−0.004−0.026−0.05−0.238−0.395−0.025−0.04
TmeanAnnual−0.044−0.0630.1520.1930.1310.161−0.236−0.3750.1440.198
Dry season−0.281−0.409−0.005−0.021−0.029−0.054−0.304−0.3920.0270.039
Wet season0.360.495 *0.285 *0.405 *0.235 *0.353 *−0.08−0.0780.251 *0.382 **
Low flow period−0.252−0.373−0.007−0.034−0.053−0.084−0.223−0.329−0.02−0.029
TminAnnual−0.189−0.223−0.129−0.15−0.1−0.115−0.185−0.328−0.022−0.024
Dry season−0.189−0.223−0.129−0.15−0.1−0.115−0.185−0.328−0.022−0.024
Wet season0.0070.034−0.14−0.177−0.15−0.193−0.159−0.184−0.068−0.072
Low flow period−0.286−0.442−0.134−0.22−0.136−0.221−0.08−0.11−0.042−0.07
RhuAnnual−0.134−0.233−0.215−0.319−0.089−0.1380.2380.343−0.121−0.181
Dry season−0.12−0.164−0.14−0.2120.001−0.0180.399 *0.541 *0.002−0.005
Wet season0.0670.108−0.127−0.174−0.132−0.1770.0460.1−0.16−0.213
Low flow period−0.156−0.26−0.237−0.331−0.09−0.1330.430 *0.622 **−0.04−0.049
WinAnnual0.0150.0220.070.095−0.026−0.03−0.007−0.001−0.11−0.162
Dry season0.0670.1040.10.148−0.0060.006−0.125−0.163−0.113−0.158
Wet season−0.096−0.097−0.03−0.024−0.099−0.1230.020.035−0.155−0.215
Low flow period0.1720.260.1270.201−0.018−0.006−0.268−0.334−0.147−0.184
Note: * Significant at α = 0.05, ** Significant at α = 0.01.
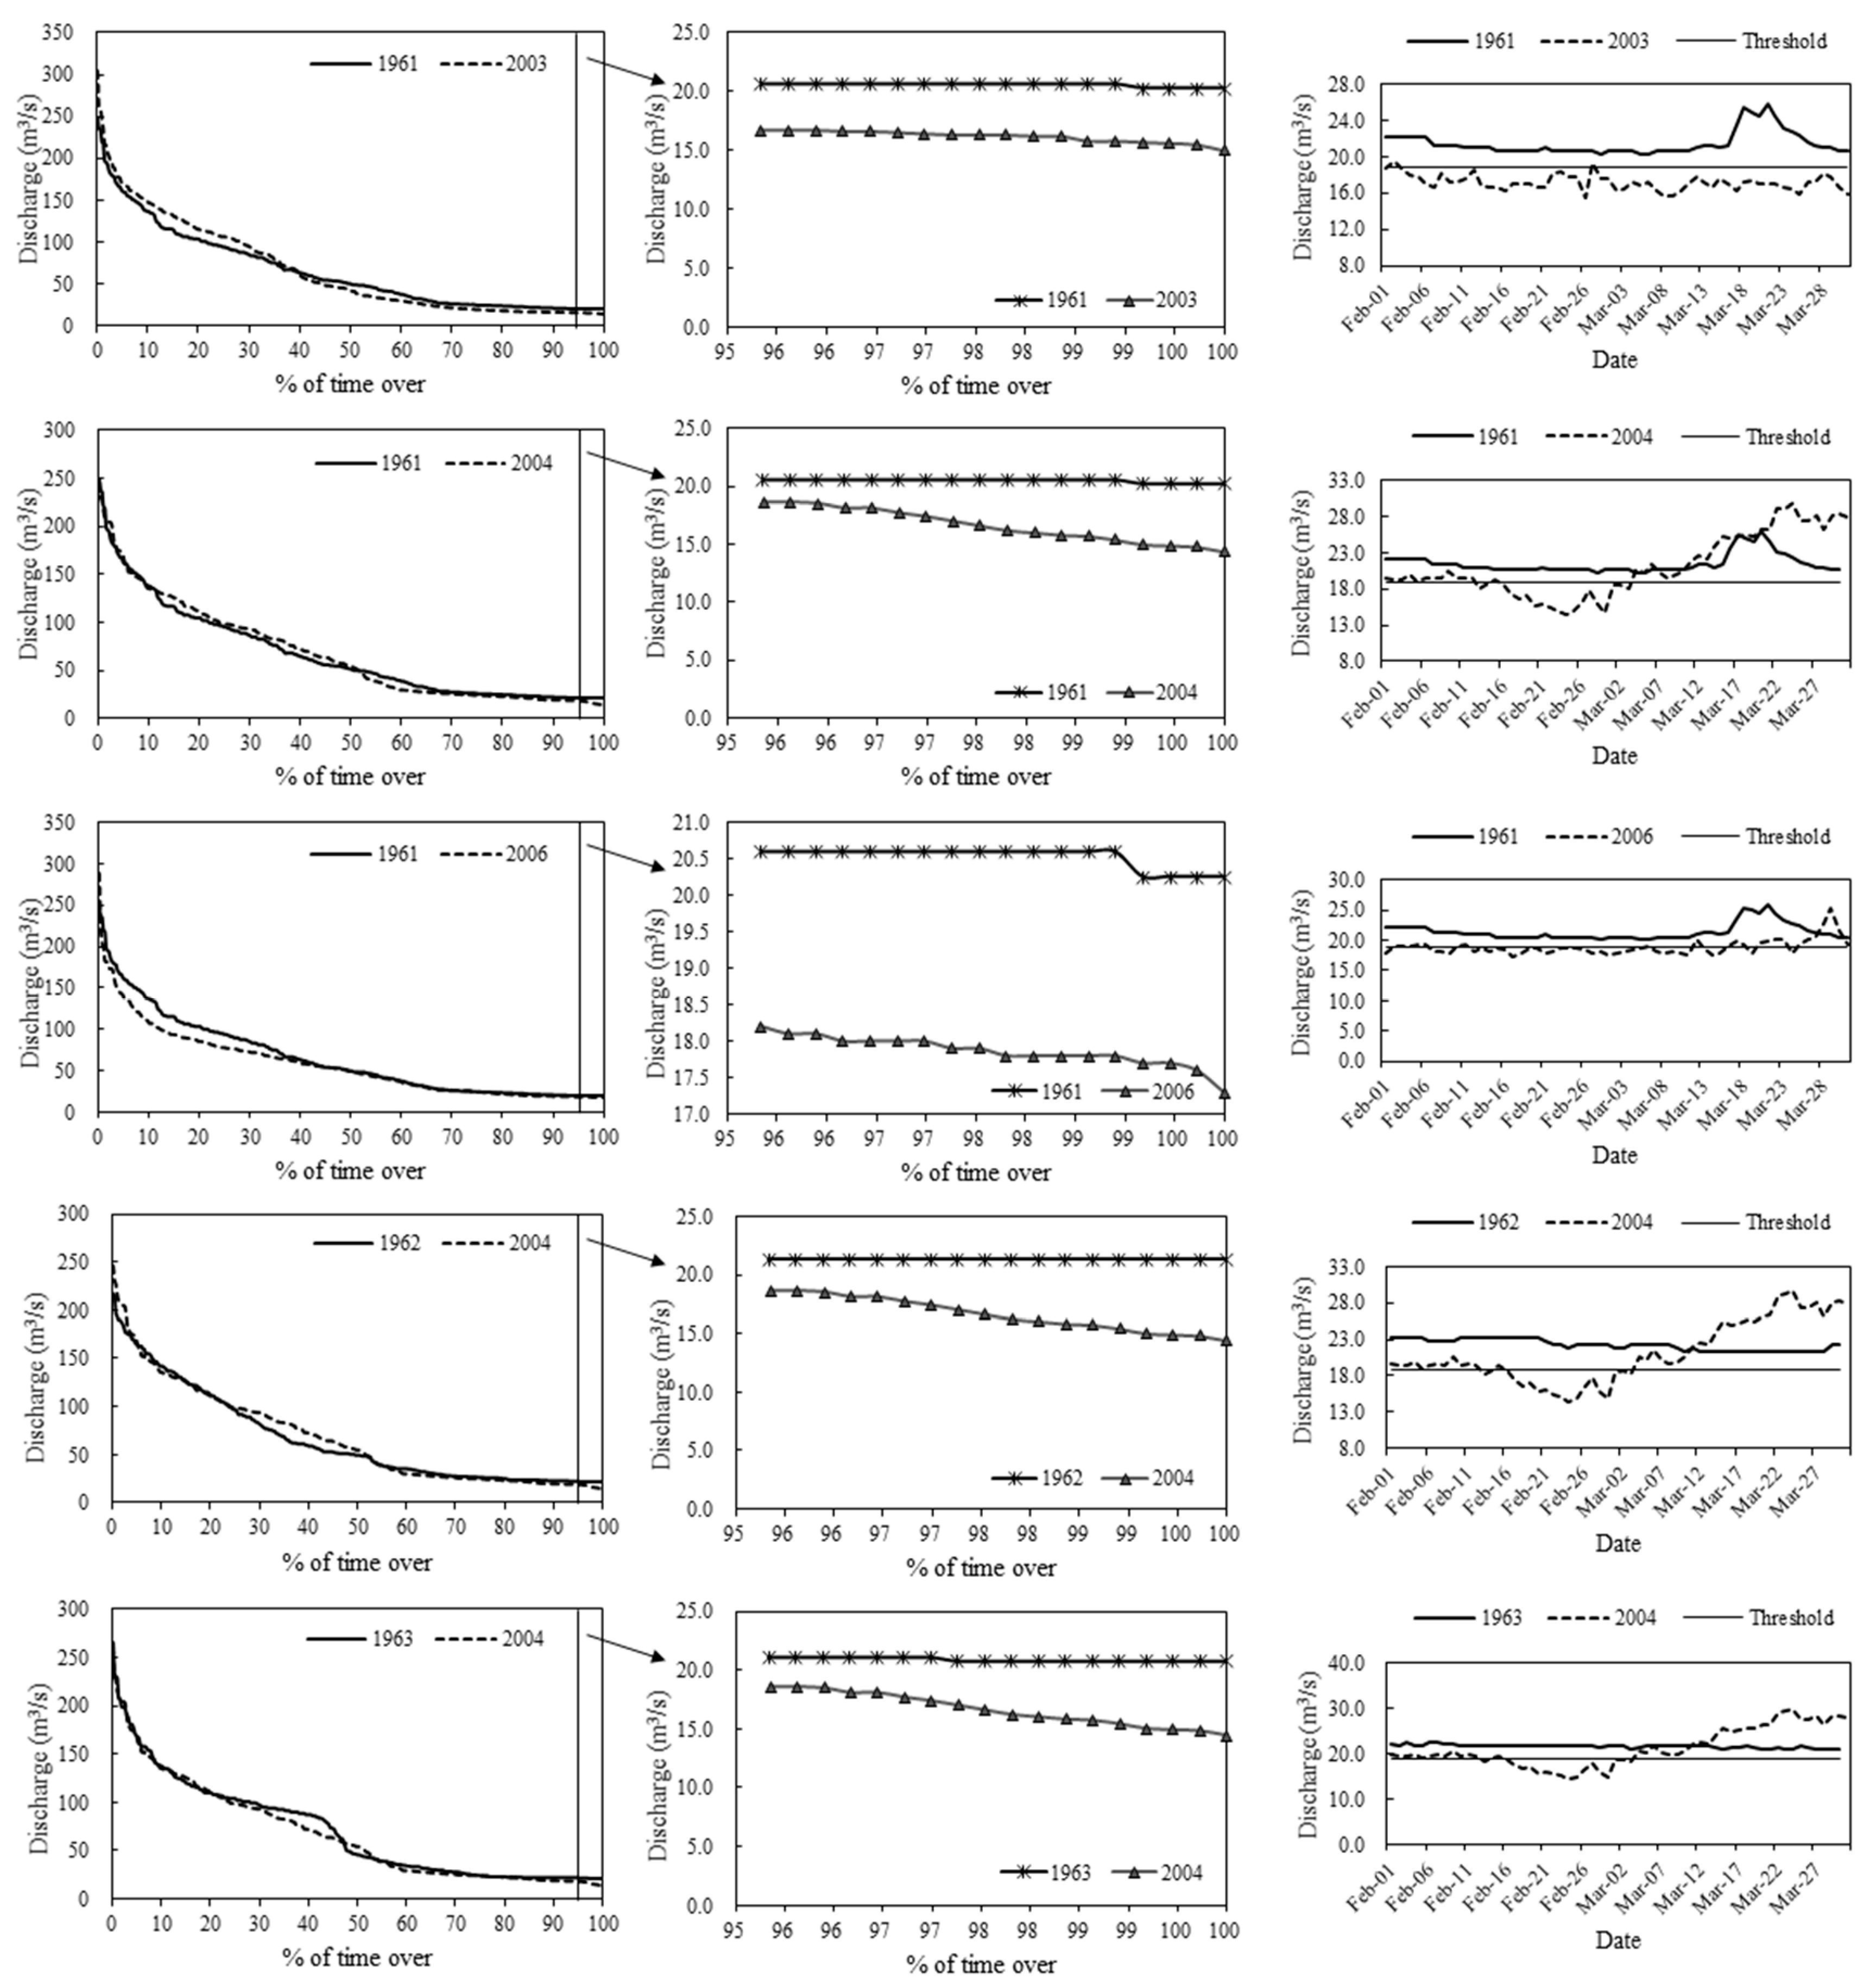
Figure A1. Flow duration curves for all selected pairs in Phase 1 and Phase 2.
Forests 11 00787 g0a1
Figure A2. Flow duration curves for all selected pairs in Phase 1 and Phase 3.
Forests 11 00787 g0a2aForests 11 00787 g0a2b
Figure A3. Flow duration curves for all selected pairs in Phase 1 and Phase 4.
Forests 11 00787 g0a3aForests 11 00787 g0a3b
Figure A4. Flow duration curves for all selected pairs in Phase 1 and Phase 5.
Forests 11 00787 g0a4

References

  1. Zhang, M.; Wei, X. Alteration of flow regimes caused by large-scale forest disturbance: A case study from a large watershed in the interior of British Columbia, Canada. Ecohydrology 2013, 7, 544–556. [Google Scholar] [CrossRef]
  2. Zhang, M.; Wei, X.; Li, Q. A quantitative assessment on the response of flow regimes to cumulative forest disturbances in large snow-dominated watersheds in the interior of British Columbia, Canada. Ecohydrology 2016, 9, 843–859. [Google Scholar] [CrossRef]
  3. Hart, D.D.; Finelli, C.M. Physical-Biological Coupling in Streams: The Pervasive Effects of Flow on Benthic Organisms. Annu. Rev. Ecol. Syst. 1999, 30, 363–395. [Google Scholar] [CrossRef]
  4. Poff, N.L.; Allan, J.D.; Bain, M.B.; Karr, J.R.; Prestegaard, K.L.; Richter, B.; Sparks, R.E.; Stromberg, J.C. The Natural Flow Regime. BioScience 1997, 47, 769–784. [Google Scholar] [CrossRef]
  5. Poff, N.L.; Zimmerman, J.K.H. Ecological responses to altered flow regimes: A literature review to inform the science and management of environmental flows. Freshw. Biol. 2010, 55, 194–205. [Google Scholar] [CrossRef]
  6. Schneider, C.; Laize, C.; Acreman, M.C.; Florke, M. How will climate change modify river flow regimes in Europe. Hydrol. Earth Syst. Sci. 2012, 17, 325–339. [Google Scholar] [CrossRef] [Green Version]
  7. Montgomery, W.L.; McCormick, S.D.; Naiman, R.J.; Whoriskey, J.F.G.; Black, G.A. Spring migratory synchrony of salmonid, catostomid, and cyprinid fishes in Rivière à la Truite, Québec. Can. J. Zool. 1983, 61, 2495–2502. [Google Scholar] [CrossRef]
  8. Sparks, R.E. Need for Ecosystem Management of Large Rivers and Their Floodplains. BioScience 1995, 45, 168–182. [Google Scholar] [CrossRef]
  9. Tealdi, S.; Camporeale, C.V.; Ridolfi, L. Long-term morphological river response to hydrological changes. Adv. Water Resour. 2011, 34, 1643–1655. [Google Scholar] [CrossRef]
  10. Belmar, O.; Bruno, D.; Martinezcapel, F.; Barquin, J.; Velasco, J. Effects of flow regime alteration on fluvial habitats and riparian quality in a semiarid Mediterranean basin. Ecol. Indic. 2013, 30, 52–64. [Google Scholar] [CrossRef]
  11. Merritt, D.M.C.; David, J. Riparian vegetation and channel change in response to river regulation: A comparative study of regulated and unregulated streams in the Green River Basin, USA. Regul. Rivers Res. Manag. 2000, 16, 543–564. [Google Scholar] [CrossRef]
  12. Cooper, D.J.A.; Douglas, C.; Chimner, R.A. Multiple pathways for woody plant establishment on floodplains at local to regional scales. J. Ecol. 2003, 91, 182–196. [Google Scholar] [CrossRef]
  13. Agostinho, A.A.; Pelicice, F.M.; Gomes, L.C. Dams and the fish fauna of the Neotropical region: Impacts and management related to diversity and fisheries. Braz. J. Biol. 2008, 68, 1119–1132. [Google Scholar] [CrossRef] [PubMed] [Green Version]
  14. Lessard, J.; Hicks, D.M.; Snelder, T.H.; Arscott, D.B.; Larned, S.T.; Booker, D.J.; Suren, A.M. Dam Design can Impede Adaptive Management of Environmental Flows: A Case Study from the Opuha Dam, New Zealand. Environ. Manag. 2013, 51, 459–473. [Google Scholar] [CrossRef]
  15. Mcmanamay, R.A.; Frimpong, E.A. Hydrologic filtering of fish life history strategies across the United States: Implications for stream flow alteration. Ecol. Appl. 2015, 25, 243–263. [Google Scholar] [CrossRef] [Green Version]
  16. Choi, S.; Yoon, B.; Woo, H. Effects of dam-induced flow regime change on downstream river morphology and vegetation cover in the Hwang River, Korea. River Res. Appl. 2005, 21, 315–325. [Google Scholar] [CrossRef]
  17. Ma, L.; Zhang, X.; Wang, H.; Qi, C. Characteristics and Practices of Ecological Flow in Rivers with Flow Reductions Due to Water Storage and Hydropower Projects in China. Water 2018, 10, 1091. [Google Scholar] [CrossRef] [Green Version]
  18. Hu, W.; Wang, G.; Deng, W.; Li, S. The influence of dams on ecohydrological conditions in the Huaihe River basin, China. Ecol. Eng. 2008, 33, 233–241. [Google Scholar] [CrossRef]
  19. Fantin-Cruz, I.; Pedrollo, O.; Girard, P.; Zeilhofer, P.; Hamilton, S.K. Effects of a Diversion Hydropower Facility on the Hydrological Regime of the Correntes River, a Tributary to the Pantanal floodplain, Brazil. J. Hydrol. 2015, 531, 810–820. [Google Scholar] [CrossRef]
  20. Fu, C.; Wu, J.; Chen, J.; Wu, Q.; Lei, G. Freshwater fish biodiversity in the Yangtze River basin of China: Patterns, threats and conservation. Biodivers. Conserv. 2003, 8, 1649–1685. [Google Scholar] [CrossRef]
  21. Li, C. A Preliminary Analysis of the Impacts of the Cascade Hydropower Development on the Fish Biodiversity in the Upper Reach of the Yangtze River. Master’s Thesis, Huazhong University of Science & Technology, Wuhan, China, 2012. [Google Scholar]
  22. Kibler, K.M.; Tullos, D.D. Cumulative biophysical impact of small and large hydropower development in Nu River, China. Water Resour. Res. 2013, 49, 3104–3118. [Google Scholar] [CrossRef]
  23. Bruijnzeel, L.A. Hydrological functions of tropical forests: Not seeing the soil for the trees? Agric. Ecosyst. Environ. 2004, 104, 185–228. [Google Scholar] [CrossRef]
  24. Calder, I.R. Blue Revolution: Integrated Land and Water Resource Management; Routledge: Abingdon, UK, 2005; Volume 565, pp. 277–288. [Google Scholar]
  25. Moore, R.D.; Wondzell, S.M. Physical hydrology and the effects of forest harvesting in the Pacific Northwest: A review. J. Am. Water Resour. Assoc. 2005, 41, 763–784. [Google Scholar] [CrossRef]
  26. Liu, W.; Wei, X.; Fan, H.; Guo, X.; Liu, Y.; Zhang, M.; Li, Q. Response of flow regimes to deforestation and reforestation in a rain-dominated large watershed of subtropical China. Hydrol. Process. 2015, 29, 5003–5015. [Google Scholar] [CrossRef]
  27. Xu, Z.; Liu, W.; Wei, X.; Fan, H.; Ge, Y.; Chen, G.; Xu, J. Contrasting Differences in Responses of Streamflow Regimes between Reforestation and Fruit Tree Planting in a Subtropical Watershed of China. Forests 2019, 10, 212. [Google Scholar] [CrossRef] [Green Version]
  28. Bernsteinova, J.; Bassler, C.; Zimmermann, L.; Langhammer, J.; Beudert, B. Changes in runoff in two neighbouring catchments in the Bohemian Forest related to climate and land cover changes. J. Hydrol. Hydromech. 2015, 63, 342–352. [Google Scholar] [CrossRef] [Green Version]
  29. Yu, Z.; Sun, G.; Cai, T.; Hallema, D.W.; Duan, L. Water Yield Responses to Gradual Changes in Forest Structure and Species Composition in a Subboreal Watershed in Northeastern China. Forests 2019, 10, 211. [Google Scholar] [CrossRef] [Green Version]
  30. Robinson, M.; Dupeyrat, A. Effects of commercial timber harvesting on streamflow regimes in the Plynlimon catchments, mid-Wales. Hydrol. Process. 2005, 19, 1213–1226. [Google Scholar] [CrossRef]
  31. Eisenbies, M.H.; Aust, W.M.; Burger, J.A.; Adams, M.B. Forest operations, extreme flooding events, and considerations for hydrologic modeling in the Appalachians—A review. For. Ecol. Manag. 2007, 242, 77–98. [Google Scholar] [CrossRef]
  32. Webb, A.A.; Jarrett, B.W.; Turner, L.M. Effects of plantation forest harvesting on water quality and quantity Canobolas State forest NSW. In Proceedings of the 5th Australian Stream Management Conference, Australian Rivers: Making a Difference, Charles Sturt University, Thurgoona, New South Wales, 1 January 2007. [Google Scholar]
  33. Savary, S.; Rousseau, A.N.; Quilbe, R. Assessing the Effects of Historical Land Cover Changes on Runoff and Low Flows Using Remote Sensing and Hydrological Modeling. J. Hydrol. Eng. 2009, 14, 575–587. [Google Scholar] [CrossRef]
  34. Price, K.; Jackson, C.R.; Parker, A.J.; Reitan, T.; Dowd, J.F.; Cyterski, M. Effects of watershed land use and geomorphology on stream low flows during severe drought conditions in the southern Blue Ridge Mountains, Georgia and North Carolina, United States. Water Resour. Res. 2011, 47, 1–19. [Google Scholar] [CrossRef]
  35. Rientjes, T.H.M.; Haile, A.T.; Kebede, E.; Mannaerts, C.M.; Habib, E.; Steenhuis, T.S. Changes in land cover, rainfall and stream flow in Upper Gilgel Abbay catchment, Blue Nile basin—Ethiopia. Hydrol. Earth Syst. Sci. 2011, 15, 1979–1989. [Google Scholar] [CrossRef] [Green Version]
  36. Woodsmith, R.D.; Vache, K.B.; Mcdonnell, J.J.; Helvey, J.D. Entiat Experimental Forest: Catchment-scale runoff data before and after a 1970 wildfire. Water Resour. Res. 2004, 40, W11701.11701–W11701.11705. [Google Scholar] [CrossRef] [Green Version]
  37. Pettit, N.E.; Froend, R.H.; Davies, P.M. Identifying the natural flow regime and the relationship with riparian vegetation for two contrasting western Australian rivers. Regul. Rivers 2001, 17, 201–215. [Google Scholar] [CrossRef]
  38. Stromberg, J.C.; Beauchamp, V.B.; Dixon, M.D.; Lite, S.J.; Paradzick, C. Importance of low-flow and high-flow characteristics to restoration of riparian vegetation along rivers in arid south-western United States. Freshw. Biol. 2007, 52, 651–679. [Google Scholar] [CrossRef]
  39. Liu, S. Hydrological functions of forest vegetation in upper reaches of the Yangtze River. J. Nat. Res. 2001, 16, 451–456. [Google Scholar]
  40. Fan, H. A Study on 50a Land Use and Cover Change of Watershed of Upper Minjiang River. J. Mount. Res. 2002, 20, 64–69. [Google Scholar]
  41. Li, A.; Zhou, W.; Jiang, X. Dynamic change of landuse/land cover during 15 years in upper reaches of Minjiang River supported by RS & GIS. J. Soil. Water. Conserv. 2003, 17, 153–156. [Google Scholar]
  42. Liu, L.; Zan, G. Vegetation hydrological effect model of typical watershed in the upstream of Minjiang Valley. J. Beijing For. Univ. 2004, 26, 19–24. [Google Scholar]
  43. Hu, Z.; He, X.; Jiang, X.; Zhao, Y.; Hu, Y.; Yu, C.; Li, Y.; Han, W.; Liu, M. Landscape pattern change at the upper reaches of Minjiang River and its driving force. Chin. J. Appl. Ecol. 2004, 15, 1797–1803. [Google Scholar]
  44. Fan, J.; Cheng, G.; Zhang, Y.; Liu, Q.; Chen, J. The Problems and Suggestions about Hydropower Cascade Exploitation in the Upper Reaches of Minjiang River. China Water Kesources 2005, 10, 47–49. [Google Scholar]
  45. Hou, B.; Zhu, X.; Liang, C. Water environment cumulative impact of cascade hydropower development in upper typical reaches of Minjiang River. Yangtze River 2010, 7, 32–37. [Google Scholar]
  46. Cui, X. Impact of Landcover Change and Climate Change on Ecohydrological Process in Zagunao Watershed, Upper Minjiang. Ph.D. Thesis, Chinese Academy of Forestry, Beijing, China, 2013. [Google Scholar]
  47. Zhang, M.; Wei, X.; Sun, P.; Liu, S. The effect of forest harvesting and climatic variability on runoff in a large watershed: The case study in the Upper Minjiang River of Yangtze River basin. J. Hydrol. 2012, 464, 1–11. [Google Scholar] [CrossRef]
  48. Jiang, Y. The primary study on habitat type of subalpine forest in Miyaluo and Markang, West Sichuan. Sci. Silvae Sin. 1963, 8, 321–335. [Google Scholar]
  49. Lv, Q. The Research about the Environmental Water Requirement of Small Watersheds Water and Electricity Exploitation. Master’s Thesis, Southwest Jiaotong University, Chengdu, China, 2007. [Google Scholar]
  50. Wang, H. Integrated Assessment on Hydro-Electricity to River Ecosystem Services and Human Well-Being. Ph.D. Thesis, Institute of Mountain Hazards and Environment Chinese Academy of Sciences, Chengdu, China, 2007. [Google Scholar]
  51. Li, M. Cumulative Influence of Cascade Hydropower Development on Runoff in Upper Reaches of Minjiang River. Master’s Thesis, Chengdu University of Technology, Chengdu, China, 2014. [Google Scholar]
  52. Hudson, R. Snowpack recovery in regenerating coastal British Columbia clearcuts. Can. J. Forest Res. 2000, 30, 548–556. [Google Scholar] [CrossRef]
  53. Wei, X.; Zhang, M. Quantifying streamflow change caused by forest disturbance at a large spatial scale: A single watershed study. Water Resour. Res. 2010, 46, 439–445. [Google Scholar] [CrossRef]
  54. Shi, L.; Hou, G. Earlier-Stage Succession of Vegetation on the Clear-cuts in Miyaluo Forest District in Western Sichuan. Acta Phytoecol. Sin. 1988, 12, 306–312. [Google Scholar]
  55. Ma, J. Ecological Basis and Countermeasures for Restoration Evaluation of Subalpine Degraded Dark Coniferous Forests in the Western Sichuan. Ph.D. Thesis, Chinese Academy of Forestry, Beijing, China, 2007. [Google Scholar]
  56. Brown, A.E.; Zhang, L.; Mcmahon, T.A.; Western, A.W.; Vertessy, R.A. A review of paired catchment studies for determining changes in water yield resulting from alterations in vegetation. J. Hydrol. 2005, 310, 28–61. [Google Scholar] [CrossRef]
  57. Liu, W.; Wei, X.; Li, Q.; Fan, H.; Wu, J.; Giles-Hansen, K.; Zhang, H. Hydrological recovery in two large forested watersheds of southeastern China: The importance of watershed properties in determining hydrological responses to reforestation. Hydrol. Earth Syst. Sci. 2016, 20, 4747–4756. [Google Scholar] [CrossRef] [Green Version]
  58. Goossens, D. Automatic Node Recognition in a Partitioning Graph: Restricting the Search Space While Preserving Completeness. In Proceedings of the European Conference on Artificial Intelligence, Brighton, UK, 20–25 July 1986; pp. 327–333. [Google Scholar]
  59. Kendall, M.G. Rank correlation methods. Am. Psychol. Assoc. 1990, 25, 86–91. [Google Scholar] [CrossRef]
  60. Cao, J.; Chi, D.; Wu, L.; Liu, L.; Li, S.; Yu, M. Mann-Kendall Examination and Application in the Analysis of Precipitation Trend. Agric. Sci. Technol. Equip. 2008, 179, 35–40. [Google Scholar]
  61. Mann, H.B. Nonparametric Tests Against Trend. Econom. J. Econom. Soc. 1945, 13, 245–259. [Google Scholar] [CrossRef]
  62. Yue, S.; Wang, C. Applicability of prewhitening to eliminate the influence of serial correlation on the Mann-Kendall test. Water Resour. Res. 2002, 38, 4-1–4-7. [Google Scholar] [CrossRef]
  63. Mann, H.B.; Whitney, D.R. On a Test of Whether one of Two Random Variables is Stochastically Larger than the Other. Ann. Math. Stat. 1947, 18, 50–60. [Google Scholar] [CrossRef]
  64. Wilcoxon, F. Individual Comparisons by Ranking Methods. Biom. Bull. 1945, 1, 80–83. [Google Scholar] [CrossRef]
  65. Zhou, G.; Wei, X.; Luo, Y.; Zhang, M.; Li, Y.; Qiao, Y.; Liu, H.; Wang, C. Forest recovery and river discharge at the regional scale of Guangdong Province, China. Water Resour. Res. 2010, 46, 5109–5115. [Google Scholar] [CrossRef] [Green Version]
  66. Zhang, M.; Wei, X. The effects of cumulative forest disturbance on streamflow in a large watershed in the central interior of British Columbia, Canada. Hydrol. Earth Syst. Sci. 2012, 16, 2021–2034. [Google Scholar] [CrossRef] [Green Version]
  67. Duan, L.; Man, X.; Yu, Z.X.; Liu, Y.; Zhu, B. The effects of forest disturbance on flow regimes of a small forested watershed in northern Daxing’anling, China. Acta Ecol. Sin. 2017, 37, 1421–1430. [Google Scholar]
  68. Gebrehiwot, S.G.; Taye, A.; Bishop, K. Forest Cover and Stream Flow in a Headwater of the Blue Nile: Complementing Observational Data Analysis with Community Perception. AMBIO J. Hum. Environ. 2010, 39, 284–294. [Google Scholar] [CrossRef] [Green Version]
  69. Zhang, Y.; Liu, S.; Ma, J.; Shi, Z.; Liu, X. Woodland hydrological effects of birch forests in sub-alpine region of western Sichuan, China. Acta Ecol. Sin. 2005, 25, 2939–2946. [Google Scholar]
  70. Jiang, Y. Phytocenological Role of Forest Floor in Subalpine Fir Forests in Western Sichuan Province. Chin. Acad. For. Sci. 1981, 5, 4–13. [Google Scholar]
  71. Huang, L. Preliminary Studies on Water Conservative Functions of Alpine Forest in Western Sichuan; Sichuan Science and Technology Press: Chengdu, China, 1990. [Google Scholar]
  72. Malmer, A.; Grip, H. Soil disturbance and loss of infiltrability caused by mechanized and manual extraction of tropical rainforest in Sabah, Malaysia. For. Ecol. Manag. 1990, 38, 1–12. [Google Scholar] [CrossRef]
  73. Kamaruzaman, J. Effect of tracked and rubber-tyred logging machines on soil physical properties of the Berkelah Forest Reserve, Malaysia. Pertanika 1991, 14, 265–276. [Google Scholar]
  74. Guo, Y.; Tang, Z. Prevention and control of soil erosion in the upper reaches of the Minjiang river. Mount. Res. 1995, 13, 267–272. [Google Scholar]
  75. Roessel, B.W.P. Herbebossching op Java (Reafforestation in Java). Tectona 1939, 32, 230–238. [Google Scholar]
  76. Ward, R.C.; Robinson, M. Principles of Hydrology, 3 ed.; McGraw-Hill Book Company: London, UK, 1990; p. 365. [Google Scholar]
  77. Lin, B.; Liu, Q.; Wu, Y.; He, H.; Pang, X. Water hoding capacity of moss and litter layers of subalpine coniferous plantations in western Sichuan, China. J. Appl. Environ. Biol. 2002, 8, 234–238. [Google Scholar]
  78. Whitmore, T.C. An Introduction to Tropical Rain Forests; Oxford University Press: Oxford, UK, 1998. [Google Scholar]
  79. Giambelluca, T.W. Hydrology of altered tropical forest. Hydrol. Process. 2002, 16, 1665–1669. [Google Scholar] [CrossRef]
  80. Hölscher, D.; Mackensen, J.; Roberts, J.M.; Bonell, M.; Bruijnzeel, L.A. Forest recovery in the humid tropics: Changes in vegetation structure, nutrient pools and the hydrological cycle. In Proceedings of the Joint Unesco International Hydrological Programme-international Union of Forestry Research Organizations Symposium & Workshop; Cambridge University Press: Cambridge, UK, 2005; pp. 598–621. [Google Scholar] [CrossRef]
  81. Wang, H.; Xiang, Z.; Chen, H. Analysis on the influence of large water conservancy projects on dry flows of Sanxia in the upper reaches of Yangtze River. Yangtze River 2006, 37, 21–23. [Google Scholar]
  82. Gu, Y.; Lei, S.; Liu, J. Effects of cascade hydropower development on hydrological regime of Lower Lancang River. Water Resour. Hydropower Eng. 2008, 4, 20–23. [Google Scholar]
  83. Shao, J.; Fan, K.; Xiong, Y.; Bing, J. Preliminary analysis of effects of cascade reservoirs operation on runoff in the upper reaches of Yangtze river. J. Water Resour. Res. 2012, 33, 9–12. [Google Scholar]
  84. Chen, X.; Zhao, J.; Zhao, T.; Lei, X.; Ni, G. Effects of hydropower reservoir operation on natural flow regime and ecosystem. A case study of Xiaowan and Nuozhadu dams. J. Hydroelectr. Eng. 2014, 33, 36–43. [Google Scholar]
  85. Zou, Z.; Li, Q.; Xia, Z.; Liu, Y.; Ma, Y.; Guo, J. Human-induced Alterations in the Flow Regime of the Hanjiang River. Water Resour. Power 2007, 25, 33–35. [Google Scholar]
  86. Yuan, Y. Research on the Evolution of Hydrological Regimes and Wetland Conservation in Dongting Lake under the Changing Environment. Master’s Thesis, Hunan University, Changsha, China, 2017. [Google Scholar]
  87. Li, M.; Fu, B.; Wang, Y.; Peng, P.; Yan, K. Characteristics and spatial patterns of hydropower development in the Upper Minjiang River basin. Resour. Environ. Yangtze Basin 2015, 24, 74–79. [Google Scholar]
  88. Richter, B.; Warner, A.T.; Meyer, J.L.; Lutz, K. A collaborative and adaptive process for developing environmental flow recommendations. River Res. Appl. 2006, 22, 297–318. [Google Scholar] [CrossRef]
Figure 1. Location of the Upper Zagunao River Watershed.
Forests 11 00787 g001
Figure 2. Annual harvesting area from the Miyaluo forest station from 1953–2006 and cumulative equivalent clear-cut area (CECA) in the Upper Zagunao River watershed from 1953–1997 [47].
Forests 11 00787 g002
Figure 3. Mann-Kendall breakpoint tests for (a) timing and (b) variability of low flows from 1959 to 2006.
Forests 11 00787 g003
Figure 4. An example of flow duration curve for pair 1962 vs. 1973 in Phase 1 and Phase 2 (flow duration curves for other selected pairs in the moderation level of forest harvesting period can be found in Figure A1).
Forests 11 00787 g004
Figure 5. An example of flow duration curve for pair 1964 vs. 1985 in Phase 1 and Phase 3 (flow duration curves for other selected pairs in the low level of forest harvesting n period can be found in Figure A2).
Forests 11 00787 g005
Figure 6. An example of flow duration curve for pair 1961 vs. 1991 in Phase 1 and Phase 4 (flow duration curves for other selected pairs in forest recovery period can be found in Figure A3).
Forests 11 00787 g006
Figure 7. The comparison of the magnitude of low flows in different phases during the forest harvesting period.
Forests 11 00787 g007
Figure 8. The comparison of the return period of low flows in different phases during the forest harvesting period.
Forests 11 00787 g008
Figure 9. The comparison of timing of low flows in different phases during the forest harvesting period.
Forests 11 00787 g009
Figure 10. The comparison of the variability of low flows in different phases during the forest harvesting period.
Forests 11 00787 g010
Figure 11. The comparison of duration of low flows in different phases during the forest harvesting period.
Forests 11 00787 g011
Figure 12. Examples of the duration of low flows in paired years during the forest harvesting period: (a) Phase 1 vs. 2; (b) Phase 1 vs. 3 and (c) Phase 1 vs. 4 (duration for other selected pairs can be found in Appendix A).
Forests 11 00787 g012
Figure 13. An example of flow duration curve for the paired years 1961 and 2003 during the hydropower dam disturbance period (flow duration curves for other selected pairs in disturbed period can be found in Figure A4).
Forests 11 00787 g013
Figure 14. The comparison of the magnitude and return period of low flows in Phase 1 and Phase 5 during the hydropower dam disturbance period.
Forests 11 00787 g014
Figure 15. Comparison of timing and variability of low flows in the hydropower dam disturbance period.
Forests 11 00787 g015
Figure 16. Comparison of duration of Phase 1 and Phase 5 (duration for other selected pairs can be found in Figure A1, Figure A2, Figure A3 and Figure A4).
Forests 11 00787 g016
Table 1. The division of study periods for low flow regime responses analysis.
Drivers for Hydrological VariationsPhase
Forest harvesting
Climate variability
(1959–1996)
Phase 1: 1959–1968
(The reference period without hydrological change due to forest harvesting)
Phase 2: 1969–1975
(The forest disturbed period with a moderate level of harvesting)
Phase 3: 1976–1988
(The forest disturbed period with a low level of forest harvesting)
Phase 4: 1989–1996
(The forest recovery period)
Hydropower dam
Climate variability
(1997–2006)
Phase 5: 1997–2006
(The hydropower dam disturbed period without forest harvesting)
Table 2. Selected pairs for assessing the effects of forest harvesting on flow regimes.
GroupsPair YearTmax-aTmean-wsRhu-lfRelative Biases/%
Tmax-aTmean-wsRhu-lf
Phase 1 vs. Phase 21Reference196218.307.9773.50
Disturbed197318.607.8878.501.641.056.80
2Reference196318.408.3375.50
Disturbed197318.607.8878.501.095.403.97
3Reference196617.507.9778.00
Disturbed197118.807.9081.507.430.384.49
Phase 1 vs. Phase 3 Reference196119.008.7380.00
1Disturbed197819.508.0279.002.638.211.25
2Disturbed198317.208.1383.509.476.874.38
3Disturbed198518.107.9886.504.748.598.13
Reference196218.307.9773.50
4Disturbed197819.508.0279.006.560.637.48
5Disturbed198117.807.6278.502.734.396.80
6Reference196318.408.3375.50
Disturbed197819.508.0279.005.983.804.64
7Reference196419.308.4785.00
Disturbed198518.107.9886.506.225.711.76
Reference196517.007.3582.00
8Disturbed198417.207.4081.001.180.681.22
9Disturbed198518.107.9886.506.478.625.49
10Disturbed198617.907.4783.005.291.591.22
11Disturbed198817.508.0883.502.949.981.83
Phase 1 vs. Phase 4 Reference196119.008.7380.00
1Disturbed199118.007.9584.005.268.975.00
2Disturbed199419.708.4080.503.683.820.63
3Disturbed199517.608.7082.007.370.382.50
Reference196218.307.9773.50
4Disturbed199317.307.6280.005.464.398.84
5Disturbed199419.708.4080.507.655.449.52
Reference196318.408.3375.50
6Disturbed199317.307.6280.005.988.605.96
7Disturbed199419.708.4080.507.070.806.62
8Disturbed199517.608.7082.004.354.408.61
Reference196419.308.4785.00
9Disturbed199419.708.4080.502.070.795.29
Note: Tmax-a, Tmean-ws, and Rhu-lf are the annual maximum temperature, wet season mean temperature, and average relative humidity of February and March, respectively.
Table 3. Selected pairs for evaluating the effects of hydropower dams on low flow regimes.
GroupsPair YearTmax-aTmean-wsRhu-lfRelative Biases/%
Tmax-aTmean-wsRhu-lf
Phase 1 vs. Phase 5 Reference196119.008.7380.00
1Disturbed200318.378.2275.503.345.915.63
2Disturbed200418.748.2273.001.355.918.75
3Disturbed200620.639.3581.008.567.041.25
4Reference196218.307.9773.50
Disturbed200418.748.2273.002.423.150.68
5Reference196318.408.3375.50
Disturbed200418.748.2273.001.861.393.31
Note: Tmax-a, Tmean-ws, and Rhu-lf are the annual maximum temperature, wet season mean temperature, and average relative humidity of February and March, respectively.
Table 4. Trend analysis for climatic variables.
Variables1959–20061959–19881989–20061959–19961997–2006
KendallSpearmanKendallSpearmanKendallSpearmanKendallSpearmanKendallSpearman
PrecipitationAnnual0.1030.1540.1270.186−0.046−0.0530.1690.2500.4220.576
Dry season0.276 **0.393 **0.0950.1550.1370.1700.2080.3080.600 *0.733 *
Wet season0.005−0.0100.140.196−0.124−0.1720.1470.1970.3330.479
Low flow period0.1410.2060.0880.1130.3200.4430.013−0.0030.3330.455
Max temperatureAnnual0.0200.021−0.321 *−0.490 **0.414 *0.589 *−0.233 *−0.358 *0.1560.236
Dry season−0.074−0.103−0.246−0.363 *0.3330.474 *−0.270 *−0.395 *−0.067−0.006
Wet season0.0200.021−0.321 *−0.490 **0.414 *0.589 *−0.233 *−0.358 *0.1560.236
Low flow period0.0700.113−0.187−0.2470.3090.457−0.166−0.221−0.067−0.042
Mean temperatureAnnual0.260 *0.397 **−0.245−0.3470.589 **0.781 **−0.130−0.1830.1140.146
Dry season0.247 *0.377 **−0.135−0.2170.428 *0.669 **−0.085−0.133−0.156−0.067
Wet season0.211 *0.313 *−0.268 *−0.371 *0.567 **0.722 **−0.142−0.1860.3220.355
Low flow period0.1120.181−0.143−0.2080.1760.269−0.116−0.166−0.244−0.321
Min temperatureAnnual0.400 **0.555 **0.2250.3210.3110.4270.1830.258−0.068−0.183
Dry season0.400 **0.555 **0.2250.3210.3110.4270.1830.258−0.068−0.183
Wet season0.214 *0.300 *0.1660.2210.3250.4670.0600.0780.0670.115
Low flow period0.1870.2710.0380.0460.0730.1300.0250.023−0.494 *−0.584
Relative humidityAnnual−0.202 *−0.326 *0.1560.228−0.678 **−0.840 **0.1780.230−0.511 *−0.697 *
Dry season−0.165−0.2400.0580.120−0.709 **−0.879 **0.1740.270−0.584 *−0.748 *
Wet season−0.241 *−0.367 *0.1060.142−0.472 **−659 **0.0130.000−0.333−0.455
Low flow period−0.071−0.1210.1270.175−0.488 **−0.708 **0.1830.254−0.200−0.309
Wind speedAnnual−0.340 **−0.475 **0.0720.126−0.488 **−0.612 **−0.092−0.1030.270.353
Dry season−0.333 **−0.470 **0.0420.09−0.393 *−0.475 *−0.106−0.1320.4220.624
Wet season−0.308 **−0.427 **0.1210.216−0.472 **−0.580 *−0.062−0.0620.2250.292
Low flow period−0.292 **−0.406 **0.0480.052−0.247−0.299−0.116−0.1520.4490.596
Note: * Significant at α = 0.05, ** Significant at α = 0.01.
Table 5. Trends analysis for low flow regime components.
Variables1959–20061959–19881989–20061959–19961997–2006
KendallSpearmanKendallSpearmanKendallSpearmanKendallSpearmanKendallSpearman
Magnitude−0.095−0.069−0.465 **−0.582 **−0.262−0.377−0.095−0.069−0.467−0.648 *
Return Period−0.090−0.076−0.432 **−0.547 **−0.436 *−0.572 *−0.090−0.076−0.584 *−0.729 *
Timing−0.151−0.217−0.046−0.073−0.333−0.505 *−0.151−0.217−0.289−0.406
Variability0.1490.2130.0460.0910.425 *0.556 *0.1490.2130.2000.236
Duration−0.029−0.0490.414 **0.486 **0.375 *0.454−0.005−0.0180.582 *0.726 *
Note: * Significant at α = 0.05, ** Significant at α = 0.01.
Table 6. Change point test in low flow regime components from 1959 to 2006.
VariablesBreakpointYearMann-Whitney U Test
Zp-Value
Timing4019982.84<0.01 *
Variability391997−3.14<0.01 *
Note: * Significant at α = 0.05.
Table 7. The comparison of low flow regime components in different phases during the forest harvesting period by statistical tests.
GroupsVariablesDifferenceMann-Whitney U TestWilcoxon
x ¯ ± s Zp-ValueZp-Value
Phase 1 vs. Phase 2Ml (%)−20.51 ± 2.168.01 *<0.016.39 *<0.01
RPl (y)−15.95 ± 10.991.730.081.600.11
TMl (d)0.39 ± 4.99−0.20.840.440.66
CVl (%)0.91 ± 0.77−0.580.561.070.29
DRl (d)12 ± 8.49−1.150.251.410.16
Phase 1 vs. Phase 3Ml (%)−19.71 ± 1.3411.55 *<0.0112.20 *<0.01
RPl (y)−10.68 ± 9.222.52 *<0.052.93 *<0.01
TMl (d)−0.62 ± 3.220.930.351.120.26
CVl (%)0.41 ± 0.17−2.03 *<0.052.93 *<0.01
DRl (d)11.45 ± 8.66−2.27 *<0.052.37 *<0.05
Phase 1 vs. Phase 4Ml (%)−7.61 ± 1.017.92 *<0.0110.70 *<0.01
RPl (y)−13.24 ± 7.791.880.062.52 *<0.05
TMl (d)1.09 ± 3.830.230.821.580.11
CVl (%)0.78 ± 0.48−2.02 *<0.052.67 *<0.01
DRl (d)5.11 ± 5.95−1.150.251.830.07
Note: Ml, RPl, TMl, CVl, and DRl are the magnitude, variability, return period, timing, and duration of low flows, respectively.   x ¯   represents mean, and s is standard deviation. * Significant at α = 0.05
Table 8. Differences significance tests of low flow regime components in hydropower dam disturbance period.
GroupsVariablesDifferenceMann-Whitney U TestWilcoxon
x ¯ ± s Zp-ValueZp-Value
Phase 1 vs. Phase 5Ml (%)−19.71 ± 2.438.96 *<0.018.24 *<0.01
RPl (y)−17.05 ± 6.301.96 *<0.012.02 *<0.05
TMl (d)−14.87 ± 5.995.27 *<0.016.09 *<0.01
CVl (%)5.41 ± 3.35−1.97 *<0.012.02 *<0.05
DRl (d)18 ± 0−1.96 *<0.012.02 *<0.05
Note: Ml, RPl, TMl, CVl, and DRl are the magnitude, variability, return period, timing, and duration of low flows, respectively. x ¯   represents mean, and s is standard deviation. * Significant at α = 0.05.