Article

Slash Pile Burn Scar Restoration: Tradeoffs between Abundance of Non-Native and Native Species

1
Department of Agricultural Biology and Graduate Degree Program in Ecology, Colorado State University, 1177 Campus Delivery, Fort Collins, CO 80523, USA
2
Atrium Health, Charlotte, NC 28204, USA
3
Coastal San Luis Resource Conservation District, 1203 Main Street Suite B, Morro Bay, CA 93442, USA
4
Department of Horticulture and Crop Science, California Polytechnic State University, 1 Grand Avenue, San Luis Obispo, CA 93407, USA
*
Authors to whom correspondence should be addressed.
Forests 2020, 11(8), 813; https://doi.org/10.3390/f11080813
Submission received: 31 May 2020 / Revised: 17 July 2020 / Accepted: 24 July 2020 / Published: 28 July 2020

Abstract

:
The accumulation of live and dead trees and other vegetation in forests across the western United States is producing larger and more severe wildfires. To decrease wildfire severity and increase forest resilience, foresters regularly remove excess fuel by burning woody material in piles. This common practice could also cause persistent ecosystem changes such as the alteration of soil physical and chemical properties due to extreme soil heating, which can favor invasion by non-native plant species. The abundance and species richness of native plant communities may also remain depressed for many years after burning has removed vegetation and diminished propagules in the soil. This adds to the vulnerability of burned areas to the colonization and dominance by invasive species. Research into the use of revegetation techniques following pile burning to suppress invasion is limited. Studies conducted in various woodland types that investigated revegetation of pile burn scars have met with varying success. To assess the effectiveness of restoring pile burn scars in Rocky Mountain National Park, Colorado, we monitored vegetation in 26 scars, each about 5 m in diameter, the growing season after burning. Later that summer, we selected 14 scars for restoration that included soil scarification, seed addition, and pine duff mulch cover. We monitored the scars for four years, pre-restoration, and three years post-restoration and found that the cover of seeded species exceeded the surrounding unburned areas and unseeded controls. The restoration seeding suppressed cover of non-native species as well as native species that were not seeded during restoration. Our results suggest that restoration of pile burn scars could be a useful tool to retard the establishment of invasive plant species when there are pre-existing infestations near scars. However, this must be weighed against the simultaneous suppression of native species recruitment. Monitoring for periods more than three years will help us understand how long the suppression of native and non-native species by restoration species may persist.

1. Introduction

Abundant fuels in forest landscapes across the American West are a legacy of fire suppression. When combined with climate change, this can increase the size and severity of wildfires [1]. Removal of burnable material has been employed as a restoration method that can decrease fire severity and increase forest resilience [2]. A common practice to remove unmarketable wood from the landscape following fuel reduction and other forest management activities is to stack the excess wood or slash and burn the piles when the risk of wildfire is low.
These fires can have dramatic impacts [3,4,5,6,7,8,9]. Slash pile burning consumes soil organic material exposing mineral soil [8] and alters soil chemical characteristics. As a consequence of pile burning, the water repellency of soils increases, reducing water infiltration [10]. Significant increases in available plant nutrients, such as phosphorus [4], as well as mineralized nitrogen [3,5,6] have also been detected in pile burn scars.
Soil nutrient changes associated with pile burning can favor non-native species [11], making burn scars more susceptible to invasion [3]. Exotic plants that invade burned areas can continue to dominate the community years after initial establishment [9]. However, the effects on vegetation are not absolute and may depend on the amount of invasion pressure by exotic plants and the size of the pile as the fire intensity increases with the pile size [4,8].
Non-native plants also benefit from a lack of native competition as the regeneration of plants in pile burn scars is limited by the reduction or elimination of propagules from the soil. Multiple studies that examined the soil seed bank after pile burning showed a significant reduction of viable seed density and species richness [3,4]. Fornwalt and Rhoades also observed that little or no regeneration occurred from roots or rhizomes at scar interiors [5]. Thus, temperatures near the center of piles were hot enough to penetrate the soil and kill underground plant organs. However, near the edges of the burn pile, where temperatures were lower, some plants emerged from underground structures. These vegetation changes might persist on the landscape as Creech et al. detected decreased native species richness seven years after pile burning [4]. The longevity of impacts on native vegetation may also depend on the pile size. Rhoades et al. observed native forb and graminoid cover recovered in the interior of small, unrestored scars so that it was similar to adjacent unburned areas within three years after burning [8].
Several methods have been investigated to ameliorate the effects of pile burning. Mulch used as cover in restorations provides a source of carbon, which is likely a limiting resource for microbes once it is consumed during pile burning. The carbon addition promotes the growth of microbes that utilize inorganic nitrogen and immobilize it in biomass [12]. In the Rhoades et al. small scar study, a 10-cm deep layer of woodchip mulch rapidly reduced inorganic nitrogen compared to controls but also suppressed plant establishment even when combined with seeding [8]. Fornwalt et al. found that a thinner layer of mulch (4–6 cm) still reduced ammonium and nitrate, but also had the benefit of increased native plant cover and richness when combined with seed addition [5]. DeSandoli et al. found that straw mulch increased the cover of agronomic species and the total plant cover but not native species seeded for burn scar restoration [6]. Species richness and diversity were also increased by the straw cover.
Scars denuded of vegetation could be rehabilitated by replenishing propagules destroyed by fire. In open ponderosa pine (Pinus ponderosa Lawson and C. Lawson) park lands, native, herbaceous seed additions increased native and total vegetative cover [6]. Korb et al. found that seeding increased native forb and graminoid cover in scars of ponderosa pine forest [3]. Rhoades et al. studied scars across an elevation gradient in forests dominated by ponderosa pine, Douglas-fir (Pseudotsuga menziesii (Mirb.) Franco), and lodgepole pine (Pinus contorta Douglas and Loudon) [8]. They found that seeding increased the total native species richness but did not increase the cover of native forbs or graminoids. Seeding native grasses similarly increased species richness without affecting plant cover of burn scars in woodlands of piñon pine (Pinus edulis Engelm.) and Utah juniper (Juniperus osteosperma (Torr.) Little) [13]. Conversely, Havrilla et al. found that seeding a mix of native and non-native herbaceous plants and shrubs increased native cover beyond nearby, undisturbed upland piñon-juniper woodlands [14]. The seeding of native herbaceous plants also increased native plant cover, so that seeded species had greater cover in scars than unburned Juniper woodlands [15]. Seeding in combination with mulch or soil scarification increased native cover and species richness within a year of treatment in upper montane forest dominated by lodgepole pine and quaking aspen (Populus tremuloides Michx.) in Colorado [5].
Seeding to establish native plant species has an additional benefit of creating a plant community to compete with non-native species as they invade. The capacity for a community to decrease the success of an invading species is called biotic resistance [16]. In a meta-analysis of research on biotic resistance to invasion by non-native plants, Levine et al. found competition to have a strong suppressive effect [16]. Given the interest in conservation applications, they invoke a need for restoration ecologists to develop community assemblages that maximize invasion resistance. Fourteen years later, Schuster et al. lamented that there is limited literature on the efficacy of revegetation to suppress reinvasion following invasive species removal [17]. They concede that interest and the body of literature on this subject are growing as the majority of studies show revegetation suppresses invasive species, but most studies last three years or fewer. They also note that revegetation of woodlands is particularly underrepresented in research, which is dominated by studies in grasslands.
Although revegetation studies are less common in woodlands, some studies have shown that seed additions can be used to establish vegetation that suppresses non-native species in pile burn scars [3,6,13,15]. Success has been mixed, as some studies found that establishing vegetation in pile burn scars does not always decrease the success of non-native species [5,6,15]. Like other revegetation research, studies of seeding on pile burn scars have primarily been of short duration. Schuster et al. observed that revegetation experiments lasting fewer than three years were less likely to detect suppression of invasive species [17]. This illustrates a need for longer duration studies that test the efficacy of revegetating pile burn scars to suppress invasion by non-native species.
In addition to suppressing non-native species, existing vegetation could affect the performance of native species that colonize later. Early establishing vegetation can facilitate later arrivals, inhibit them, or have neutral effects [18,19]. Existing literature indicates that revegetation can limit the future composition of communities [17]; therefore, the inhibition of native species following restoration should be evaluated and considered when making management decisions.
To better understand how plant community development is affected by restoration of pile burn scars in Rocky Mountain National Park, Colorado, we monitored plant cover for four consecutive years after burning, pre-restoration, and three years post-restoration, and assessed the performance of a native forb when seeded 3.5 years after burning in scars with and without restoration. We tested the following hypotheses in two field studies.
Hypothesis 1. 
Restoration of pile burn scars can ameliorate the impacts of pile burning to establish native vegetation.
Prediction 1. 
Seeded native species will have greater cover in restored scars, but their coverage will be dependent upon the time after restoration and where within the scar estimates are made.
Hypothesis 2. 
Restoration of pile burn scars suppresses non-native species relative to unrestored scars.
Prediction 2. 
Non-native species will have less cover in restored scars, but their cover will be dependent upon time after restoration and where within the scar estimates are made.
Hypothesis 3. 
Restoration of pile burn scars suppresses native species that were not seeded during restoration relative to unrestored scars.
Prediction 3. 
Native species that were not seeded during restoration will have less cover in restored scars, but their cover will be dependent upon time after restoration and where within the scar estimates are made.
Prediction 4. 
Native species seeded three years after restoration will have fewer plants established and they will have lower productivity in restored scars.

2. Materials and Methods

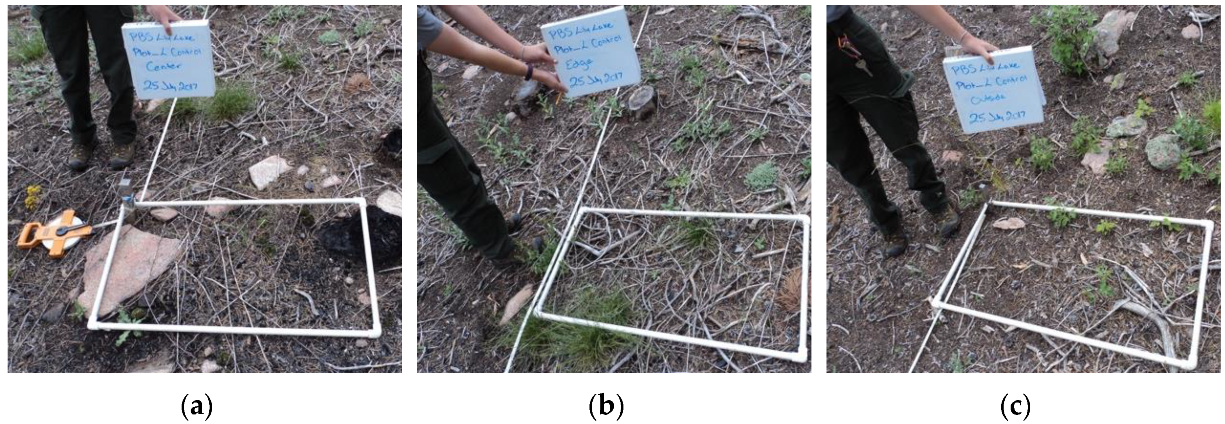
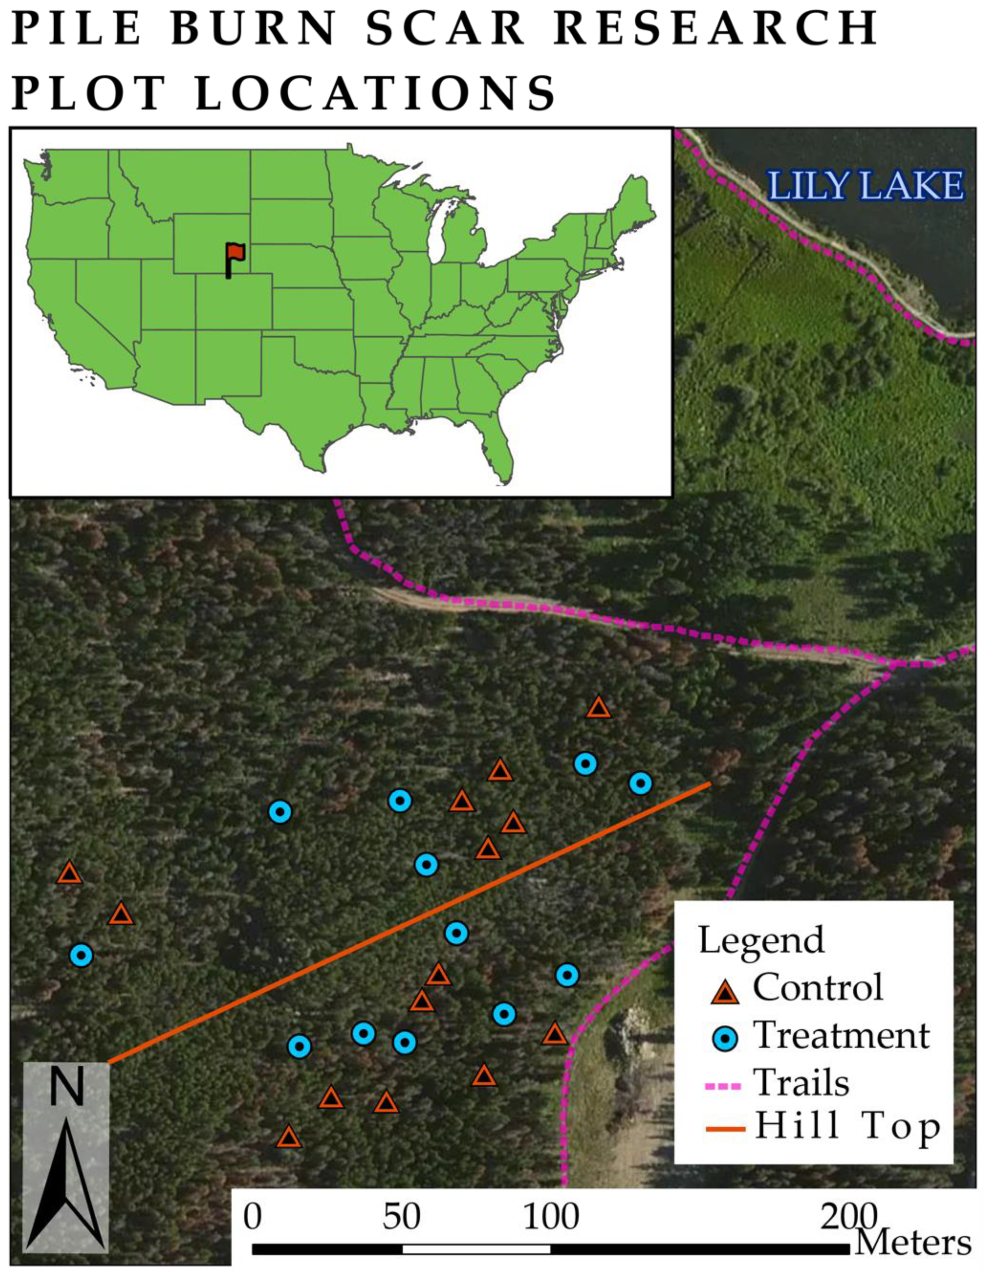
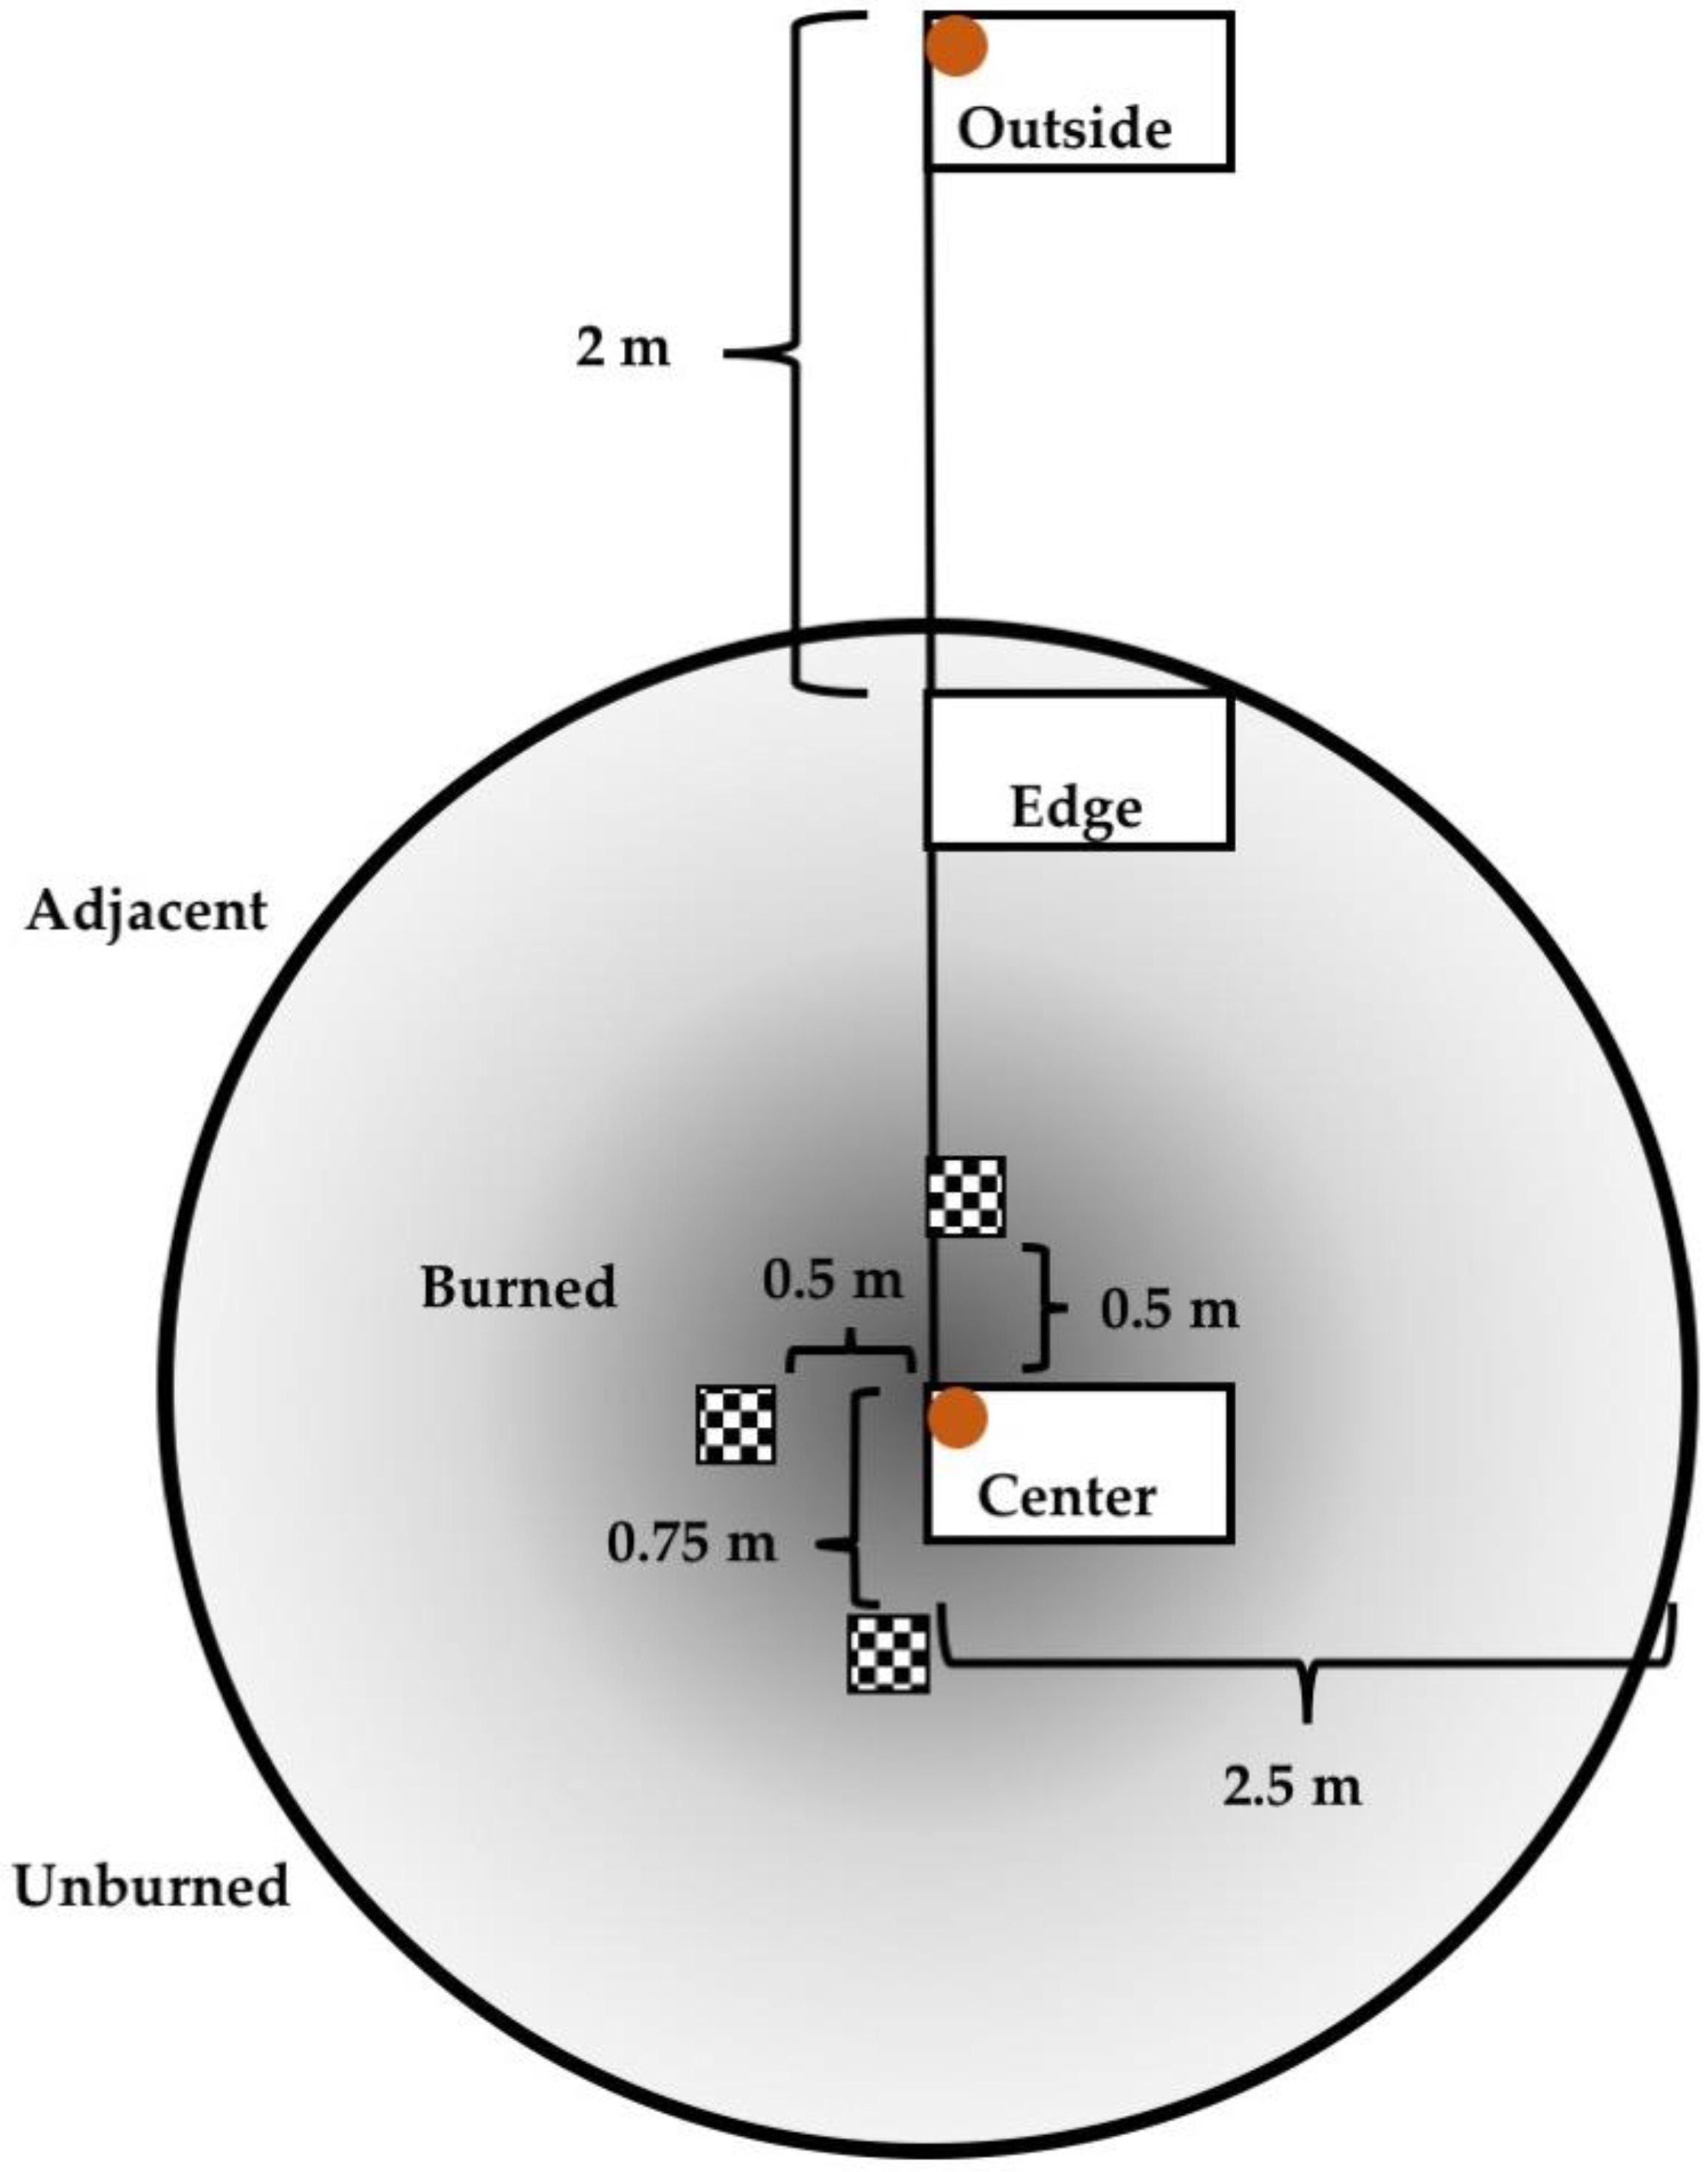
2.1. Site Selection and Plot Establishment

The study site was located at Lily Lake near the eastern border of Rocky Mountain National Park in Northern Colorado’s Front Range at an elevation of 2706 m (Figure 1). Lodgepole pine (Pinus contorta Douglas ex Loudon) is the dominant overstory species in this mountainous, forested area. The average annual precipitation over the past 30 years was 711 mm at the nearby Copeland Lake SNOTEL station [20]. Before fuels reduction, park staff estimated the forest stand at Lily Lake had an average overstory tree height of 14 m, average diameter at breast height of 19 cm, average basal area of 51 m2 ha−1, and average mortality of 55% of stems.
In the summer of 2013, contractors completed a fuels reduction treatment across 16 ha at Lily Lake. Park staff marked approximately 618 trees per ha for felling prior to treatment. In addition to the marked trees, contractors felled all trees less than 2.4 m tall within 4.6 m of a trail or road. As an exception to the above felling, contractors left intact live limber pine, live aspen, dead aspen with intact bark, and trees with evidence of significant wildlife. They removed limbs below a height of 1.8 m from the remaining trees greater than 3.7 m tall. To remove “ladder fuels”, they also cut and piled brush and trees under 3.7 m tall from an area within 1.8 m of the drip line of remaining trees. They cut and piled all dead and fallen material greater than 5 cm in diameter and longer than 0.6 m. To remove cut material, they piled anything greater than 3 cm in diameter bearing a saw mark regardless of length, excluding stumps left in the ground. Park staff burned fuel piles the following winter.
Impacts, including vegetation loss and charring, were visible as ~5 m wide scars in 2014 (Appendix A, Figure A1). We selected 26 of these scars on a hill with north- and south-facing slopes for monitoring. We randomly selected seven scars on the north side of the hill and seven scars on the south side of the hill to be restored. We left six scars on each side of the hill (12 total) untreated as controls (Figure 1).
We established transects starting 2 m outside of each scar by marking the ends with wooden stakes for consistent plot measurements in subsequent years. The transects generally ran downhill to scar centers. The outside stakes were the north of the scar on the south side of the hill and the south of the scar on the north side of the hill.

2.2. Restoration Methods

Interns from the Public Lands History Center at Colorado State University conducted the restoration of more than 300 scars near Lily Lake during summer 2014 because it is an area of high-visitor use with known populations of Canada thistle (Cirsium arvense L. Scop.) and cheatgrass (Bromus tectorum L.). Interns scarified the soil to a depth of ~5–8 cm using hand tools to disrupt the hydrophobic layer of soil. Once the seedbed was prepared, they hand broadcast a seed mix of squirreltail (Elymus elymoides Raf. Swezey), Canada wildrye (Elymus canadensis L.), and prairie sagewort (Artemisia frigida Willd.) at a rate of 1086 seeds m−2 (Table 1). Park staff selected these species because they quickly establish to compete with non-native species and were used extensively in revegetation projects throughout the park. We did not have seeds of additional species available in sufficient quantities when initiating this experiment. Seeds were collected within the park and grown to produce more seeds through a contract with the Natural Resources Conservation Service (NRCS) Upper Colorado Environmental Plant Center (Meeker, CO, USA). After seeding, interns raked pine duff from the surrounding area onto seeded scars to create approximately 50% litter cover.
National Park Service employees applied herbicide to Canada thistle at the study area in 2014 and 2016 because it is a List B noxious weed in Colorado and is targeted for eradication by the Rocky Mountain National Park (NPS, 2003). They spotted sprayed plants until evenly wet with Milestone (aminopyralid, Dow AgroSciences LLC, Indianapolis, IN, USA) at a concentration of 0.07% products (0.03% active ingredient) mixed with a non-ionic surfactant at a concentration of 0.5%. The control and restored scars were equally likely to receive herbicide if they contained Canada thistle because the herbicide was applied without regard to whether the Canada thistle plants occurred inside or outside of study plots of either type.

2.3. Vegetation Sampling

We made ocular estimates of pre-restoration cover in July 2014 and post-restoration cover during summer 2015, 2016, and 2017 (Figure 2) at three positions for each scar. To estimate the cover in the same location each year, we placed 0.5 m2 (0.5 × 1 m) quadrats (1) outside of the burn scar at 1.5–2 m from the edge (0–0.5 m on the transect), (2) just inside the edge of the scar (2–2.5 m), and (3) at the scar center (3–3.5 m) with the transect on the left side of the short edge when facing the outside stake (Figure 3). Before estimating cover, we identified vascular plants to species. When we could not identify plants to species, we recorded their genus or growth form (i.e., graminoid, forb, tree, or shrub). We described the cover as ranges of 0–1, 1–3, 3–5, 5–10, 10–25, 25–50, 50–75, 75–90, 90–95, 95–99, or 99–100% according to modified Daubenmire cover classes [21].

2.4. Seedling Establishment Study

To test our hypothesis that the restoration species would inhibit recruitment and growth of native species, we conducted a second experiment to examine the effects of restoration on plants seeded three years after burning/restoration. We established three 25 cm by 25 cm subplots within 1 m of the center stake for each previously monitored scar. To avoid overlapping with the existing subplots, we placed new subplots at 90, 180, and 270 degrees measured clockwise starting from the long side of the existing subplot as it extended from the center stake (Figure 3). Over four days, 5–8 June 2017, we added 40 common yarrow (Achillea millefolium L.) seeds to each new subplot and raked them into the ground with fingertips to increase contact with soil while minimizing disturbance. The seeds were collected from within Rocky Mountain National Park. On 15 September 2017, we counted, collected, dried, and weighed the aboveground biomass of the yarrow seedlings from each new subplot.

2.5. Data Analysis

We used the midpoint of the cover class range as the response variable for each observation. To analyze cover data, we pooled species into three response variables (seeded species, native species not seeded, and non-native species) following the native status reported by the United States Department of Agriculture-Natural Resources Conservation Service PLANTS Database [22]. The cover data were log-transformed before the analysis to meet subsequent model assumptions. We analyzed each cover response variable by fitting a (multi-level) linear mixed model using the SAS software, Version 9.4 of the SAS System for Windows (SAS Institute Inc., Cary, NC, USA), using restricted maximum likelihood in conjunction with Kenward Roger degrees of freedom. Specifically, we included the factors treatments (yes, no), position (center, edge, outside), year (2014, 2015, 2016, 2017), and aspect (north, south) in the model as fixed main effects and allowed for all two-way interactions. We also accounted for any possible spatial autocorrelation by including pile burn scar coordinates (UTM NAD 83 Zone 13) as predictors and examined the residuals. Type 3 F-tests of fixed effects were run on all terms in the model. To correct p-values for multiple testing, we performed the Holm’s Step-Down-Procedure in R, Version 3.5.1 (R Foundation for Statistical Computing, Vienna, Austria. URL https://www.R-project.org/). We also examined pairwise comparisons of least squares means for fixed factors that had significant effects using Holm t-tests. In all three models, we included pile burn scars random effects and quadrat (nested within pile burn scar) random effects. We obtained covariance parameter estimates with profile likelihood 95% confidence intervals. Because each quadrat was measured over time, we also allowed for autocorrelation among measurements and estimated the correlation matrix at each pile burn scar position. Specifically, we tried several different error covariance structures, using the minimum Akaike’s Information Criterion (AIC) to select an autoregressive (1) structure [23]. Residual diagnostics were run to verify that the model assumptions were met.
We used the total number of seedlings alive at the end of the growing season out of 120 seeds planted for each pile burn scar as a response variable for the seedling establishment study. Specifically, the proportion of seedlings alive was modeled via logistic regression allowing for overdispersion using maximum likelihood estimation and residual degrees of freedom. To analyze seedling productivity, we summed the seedling biomass for each pile burn scar and divided the mass by the number of seedlings weighed. This gave us the average aboveground biomass per seedling for each pile burn scar. We then logit-transformed these averages and fit a linear mixed model using restricted maximum likelihood and residual degrees of freedom. Both models included the factors treatment and aspect as fixed main effects and their interaction. As with the cover data models, we also included pile burn scar UTM coordinates. Type 3 F-tests of fixed effects were run on all terms in the model, and p-values were adjusted with the Holm’s Step-Down-Procedure to correct for multiple tests. Residual diagnostics were run to verify that the model assumptions were met.

3. Results

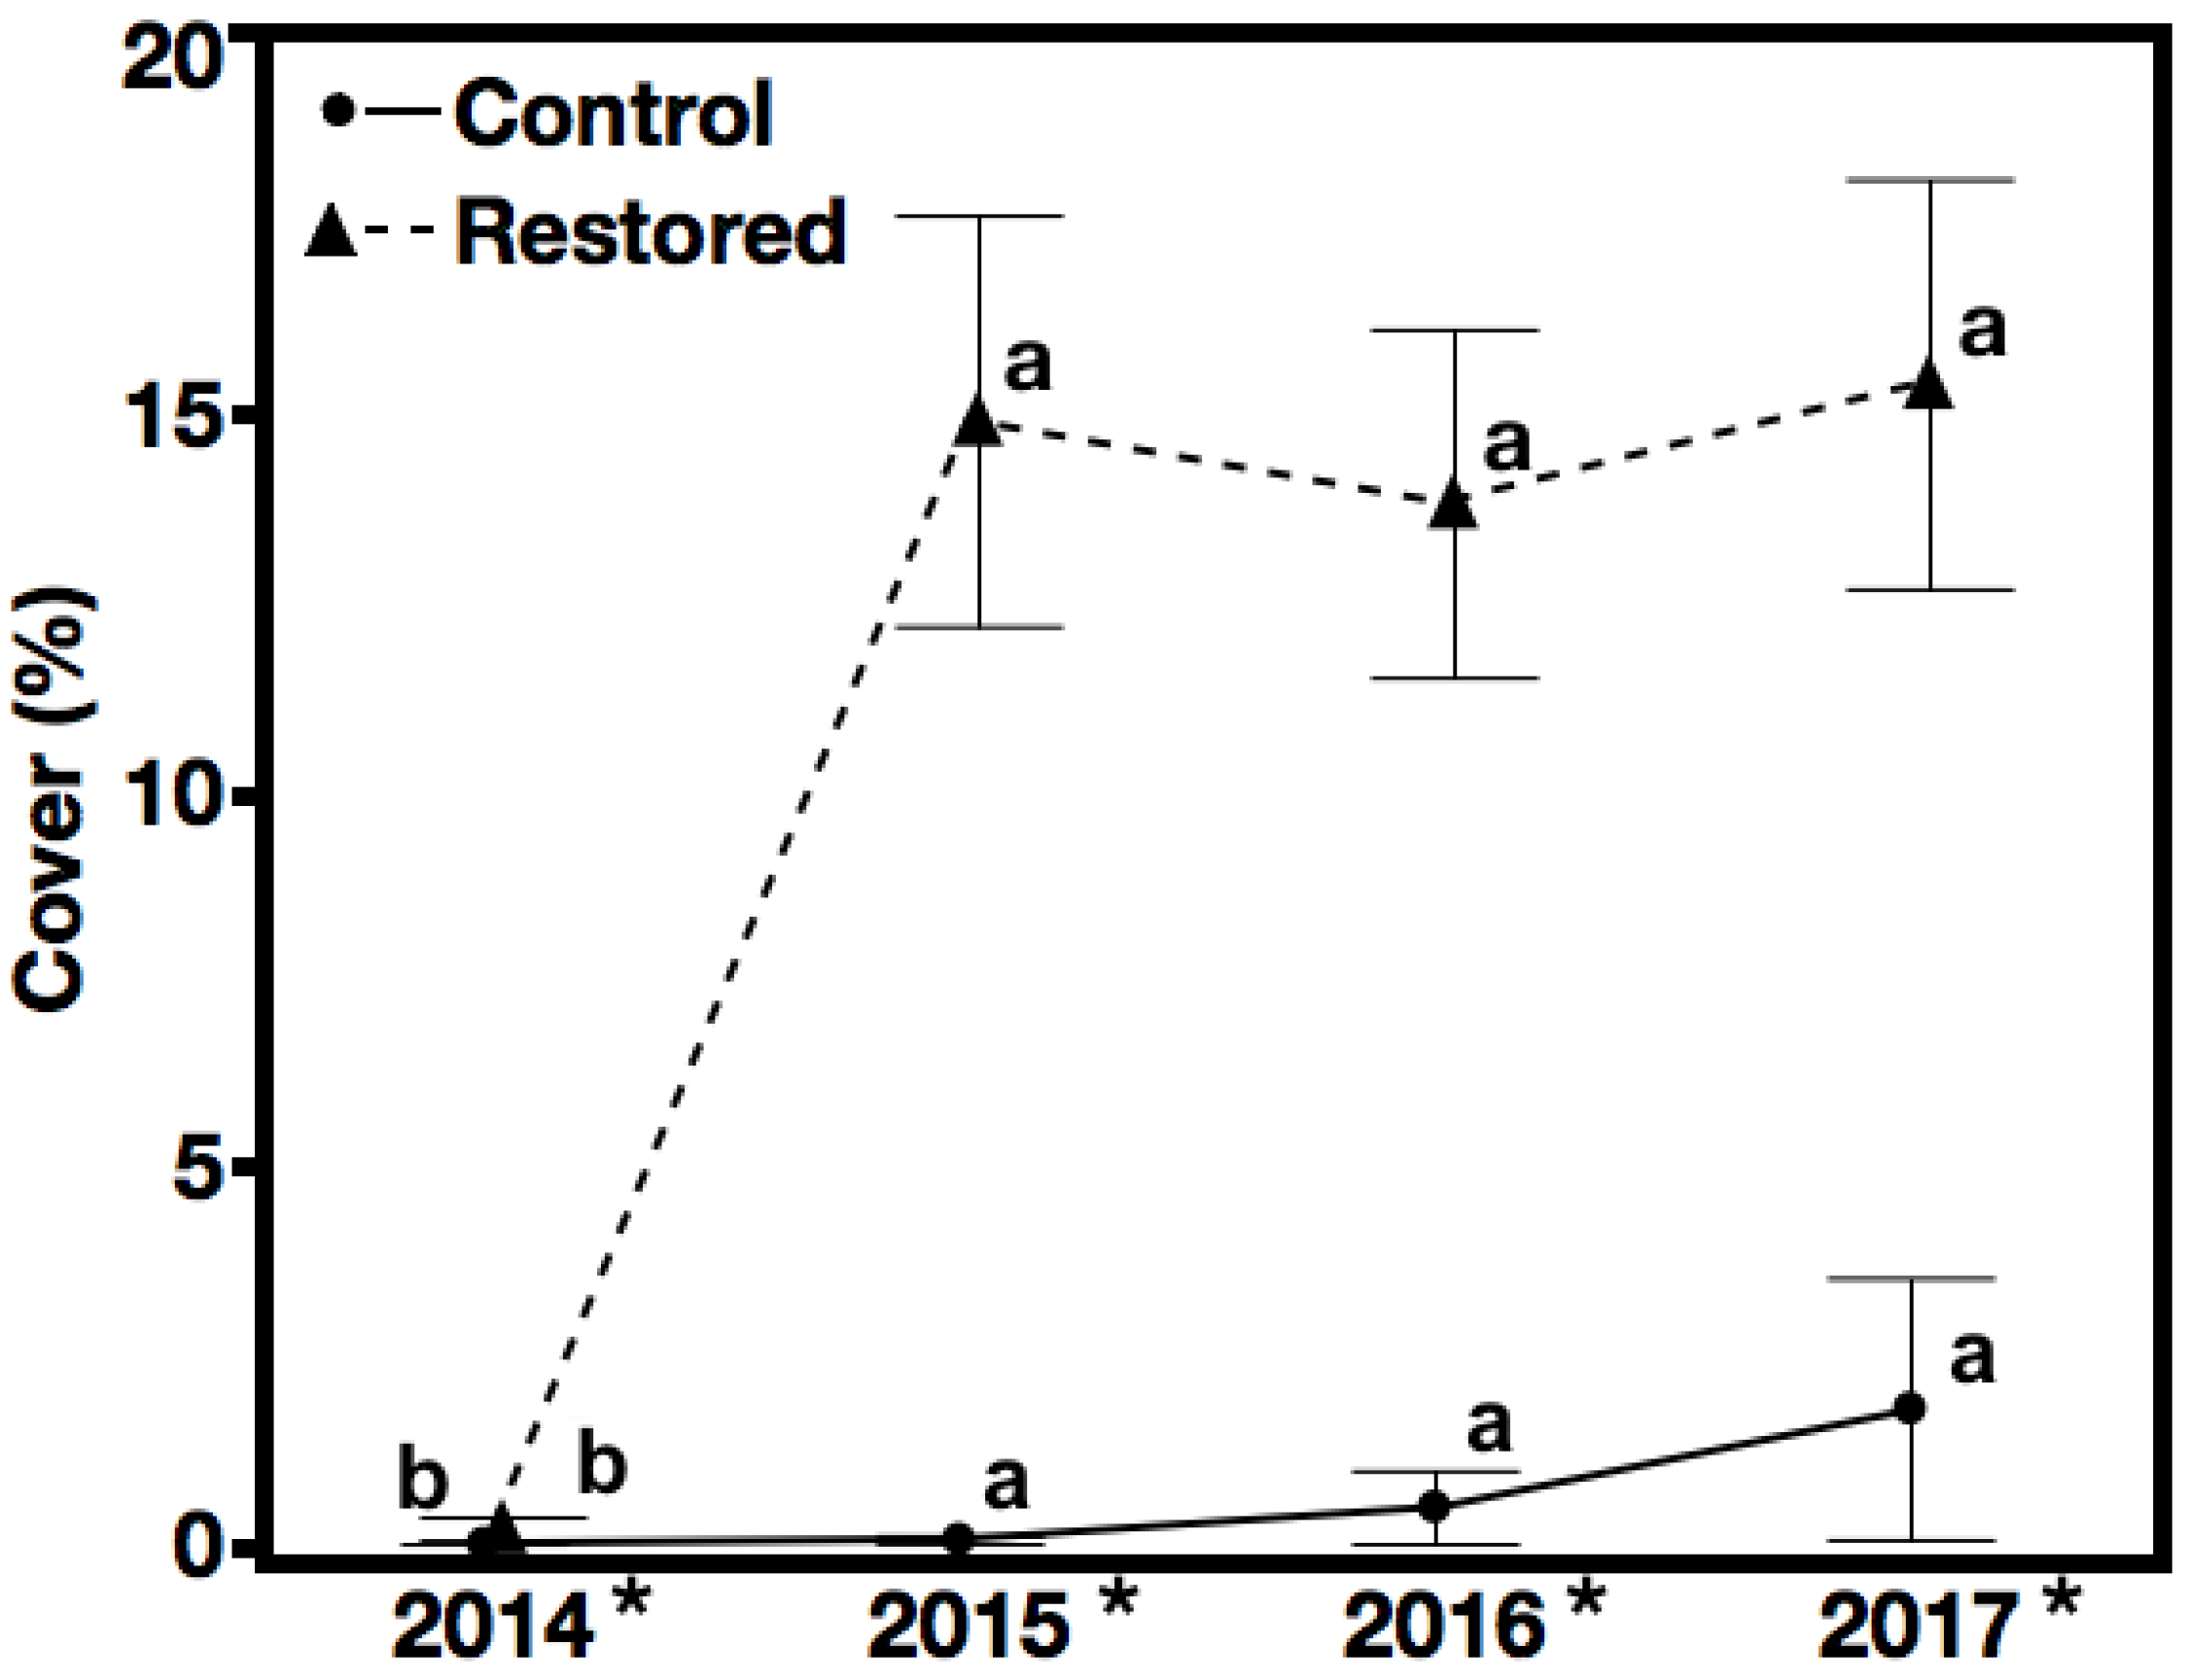
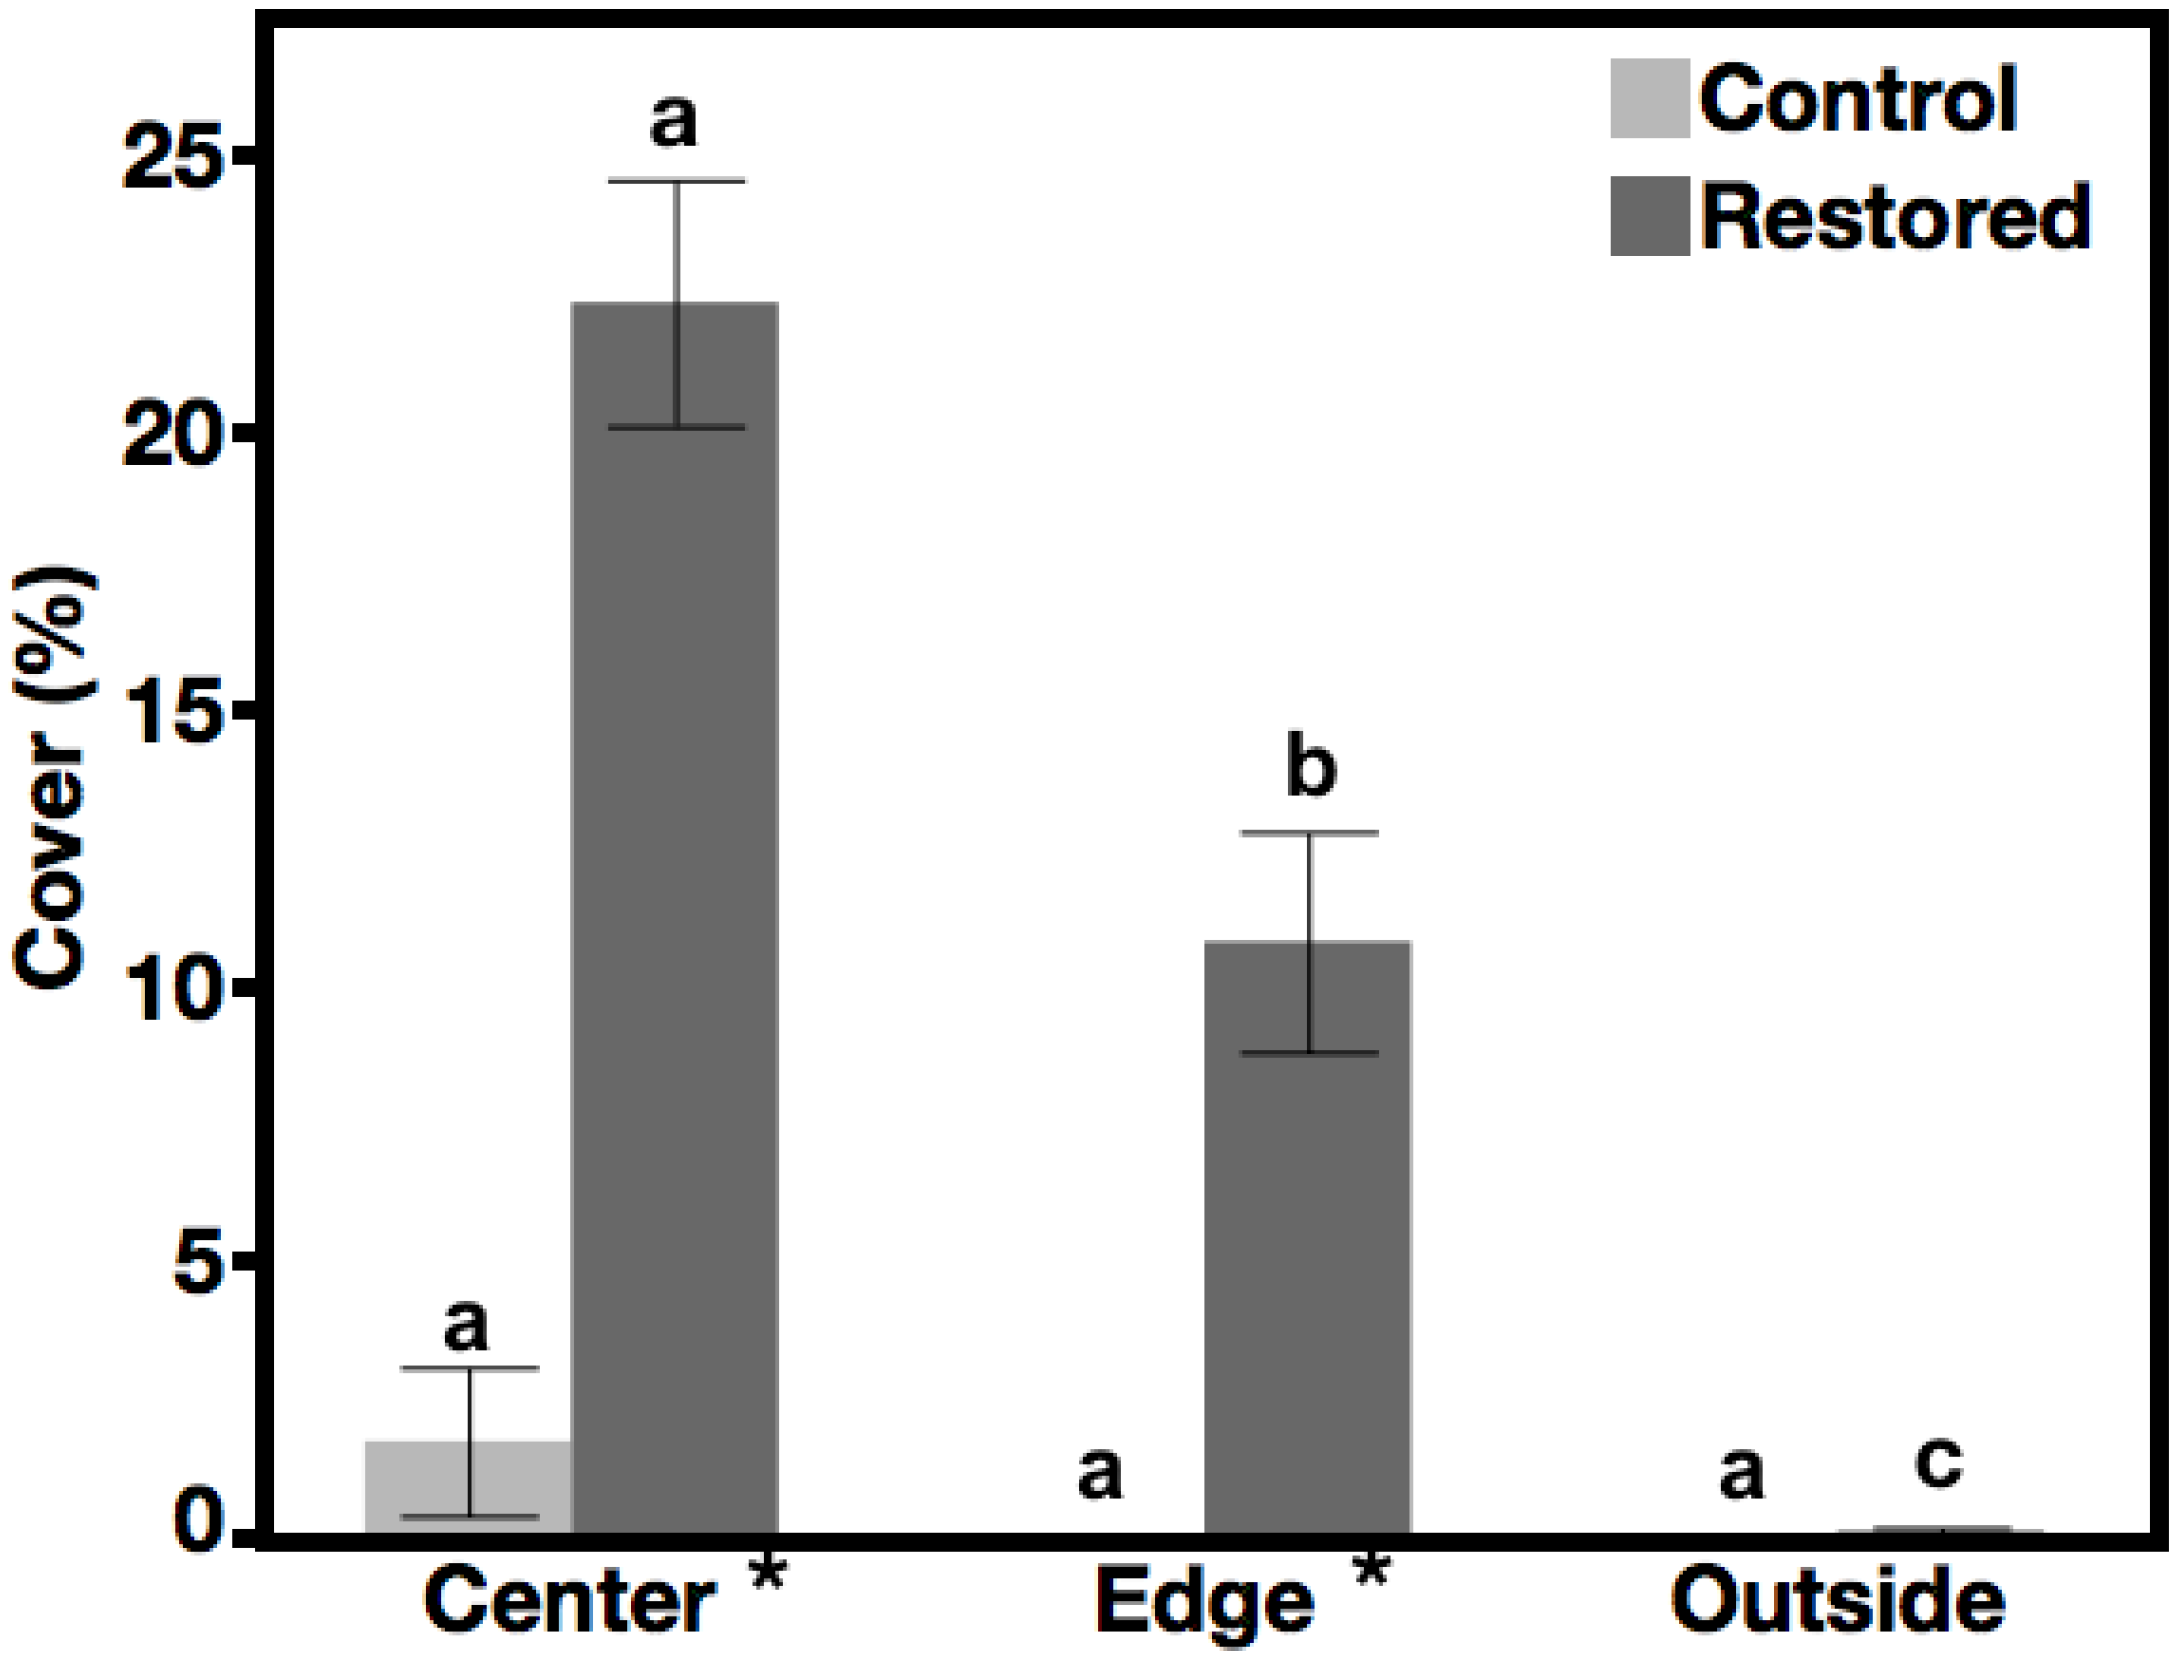
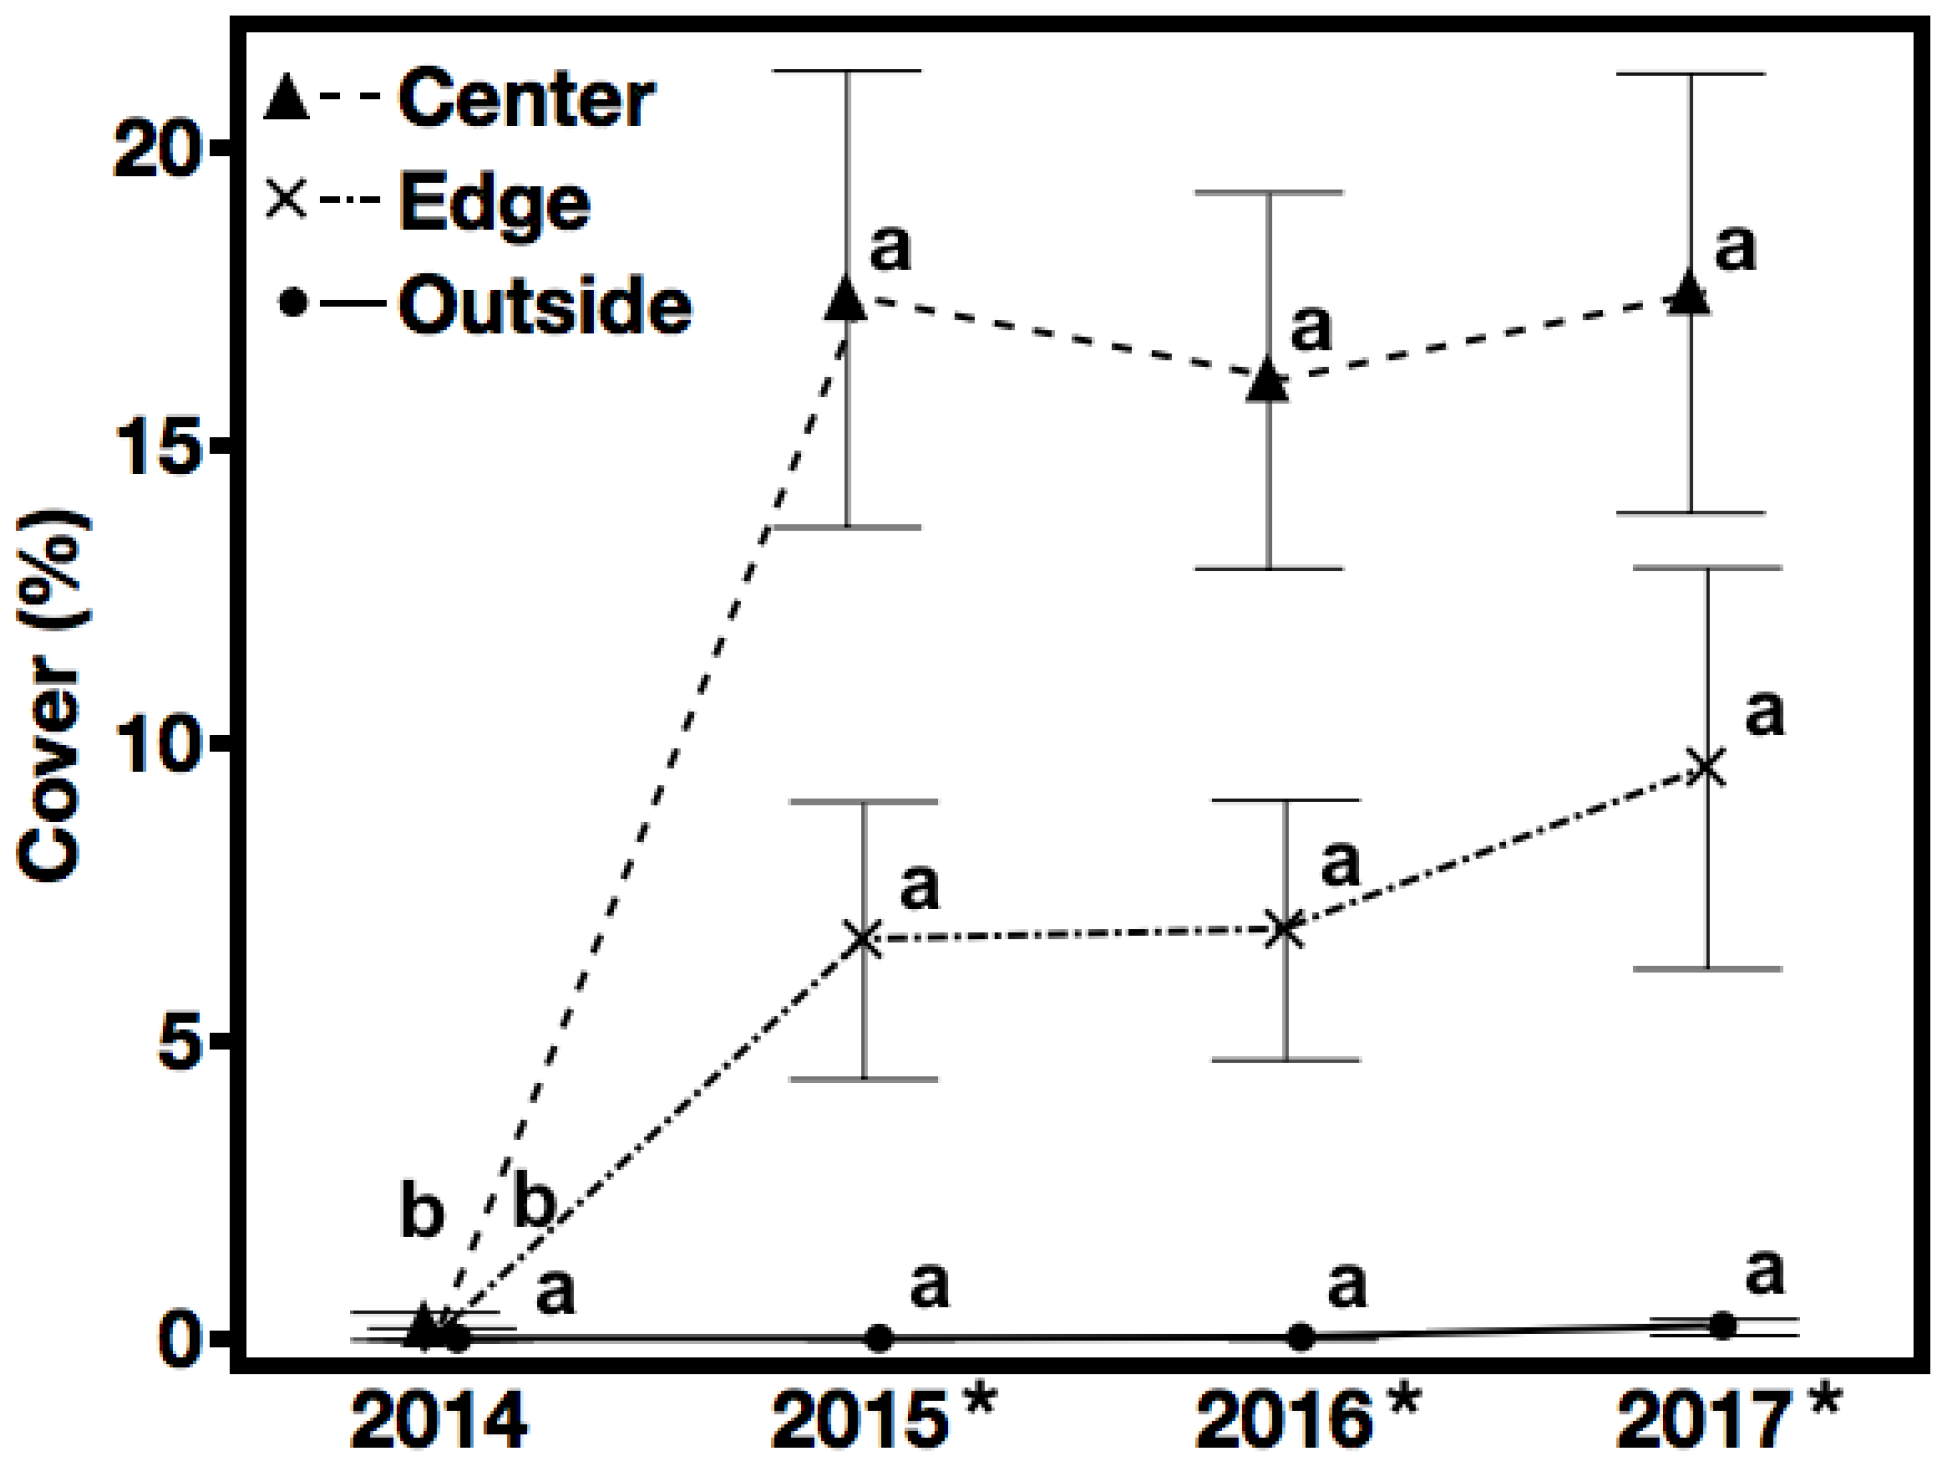
3.1. Seeded Species Cover—Hypothesis 1, Prediction 1

The restoration treatment increased the cover of the seeded native species (SD) depending on the year and position (center, edge, and outside) (Table 2). Restored scars had higher SD cover in all years of the study. The difference between treatments was small but statistically significant in 2014 (pre-treatment). A single scar, with 3%–5% and 0%–1% cover of the Canada wildrye at the center and edge, respectively, along with 1%–3% cover of squirreltail at the center and edge, was responsible for the difference between treatments before restoration. At the end of the study, the SD cover in restored scars was 8.6 times higher than controls. For both restored and control scars, the SD cover increased in 2015, but no other years differed significantly (Figure 4). The restored scars had nearly 13 times greater cover of SD at their centers than controls when averaged over time from pre-restoration to three years after restoration (Figure 5). At the scar edges, the SD cover was 10.77 ± 1.99% (mean ± standard error of the mean) in the restored scars, but the SD cover was essentially zero in the controls. There was no difference between treatments outside of the scars. There was no difference in the SD cover among the positions of the control scars, but it increased moving from outside to the center of the restored scars (Figure 5).
The cover of the SD at different positions depended on the year (Table 2). In 2014, before restoration, all the positions had the same cover of SD, but it varied by position in the following years. The cover of the SD increased in 2015 at the center and edge of the scars, and then remained constant so that the SD cover was greater at the center of the scars than the edges for all the years after restoration. We detected no changes outside of the scars (Figure 6).
For the cover of the SD, scar-to-scar variation and quadrat-to-quadrat (within-scar) variation were negligible. The within-quadrat variance was dramatically reduced outside the pile; the autocorrelation increased moving from the center of the pile to the edge of the pile, but then decreased once outside the pile to levels similar to those observed in the center (p < 0.0001).

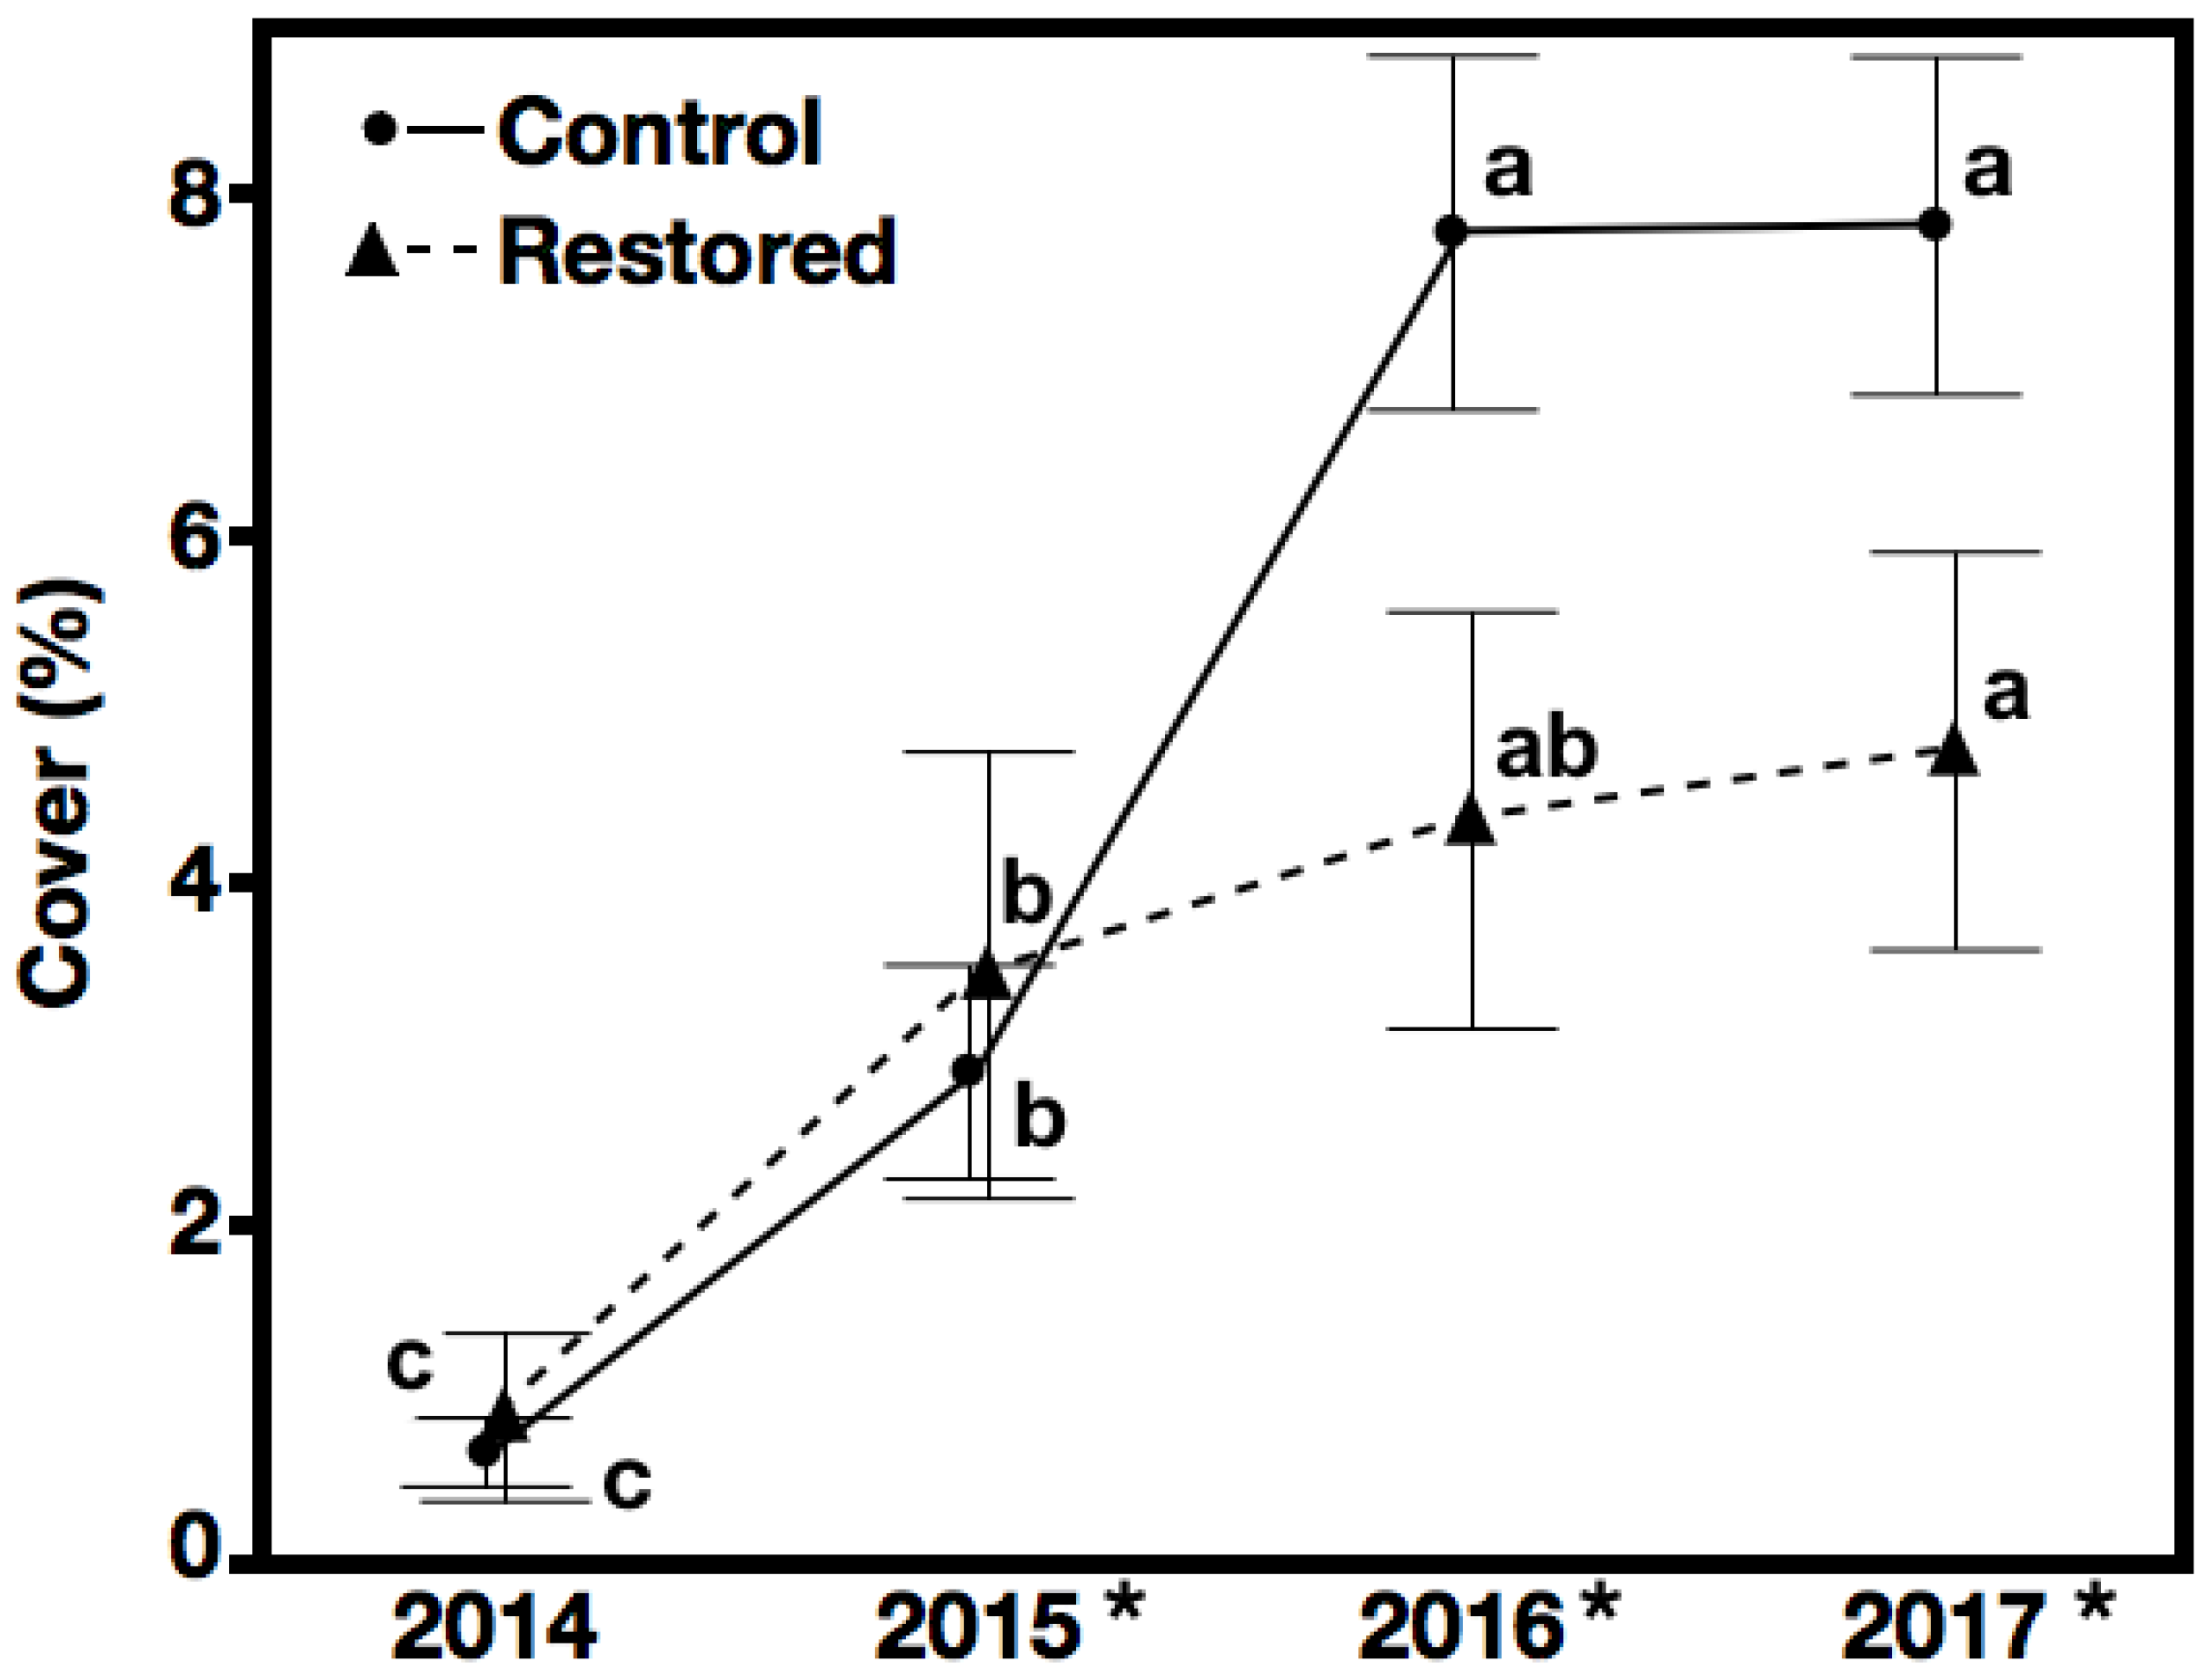
3.2. Non-Native Species Cover—Hypothesis 2, Prediction 2

Non-native species (NN) cover increased over time, depending on treatment (Table 2). In scars without restoration, NN cover increased in 2015 and 2016, but not in 2017. Conversely, it remained constant in restored scars. We did not detect a difference between treatments in 2014 and 2015, but the NN cover was higher in controls than restored scars in 2016 and 2017. By the end of the study, restored scars had less than one-third of the non-native cover found in unrestored scars (Figure 7).
The position did not have an effect on non-native cover, and this did not depend on year or treatment (Table 2).
For cover of NN, scar-to-scar variation and quadrat-to-quadrat (within-scar) variation was negligible. Both within-quadrat variance and autocorrelation increased moving from the center to the outside of the scar (p = 0.0004).
We found 10 non-native species throughout the study (Appendix A, Table A1). The most abundant non-native species in the control scars was Canada thistle, which comprised 40% of the total non-native cover. It had a mean cover of 1.49 ± 0.46% in the control scars, when averaged over all years. Its cover in the restored scars averaged 0.13 ± 0.06%. Canada bluegrass (Poa compressa (L.)) was the most abundant non-native species in restored scars, where it was less abundant than the control scars (0.42 ± 0.17% and 0.53 ± 0.22%, mean cover across years in the restored and control scars, respectively).

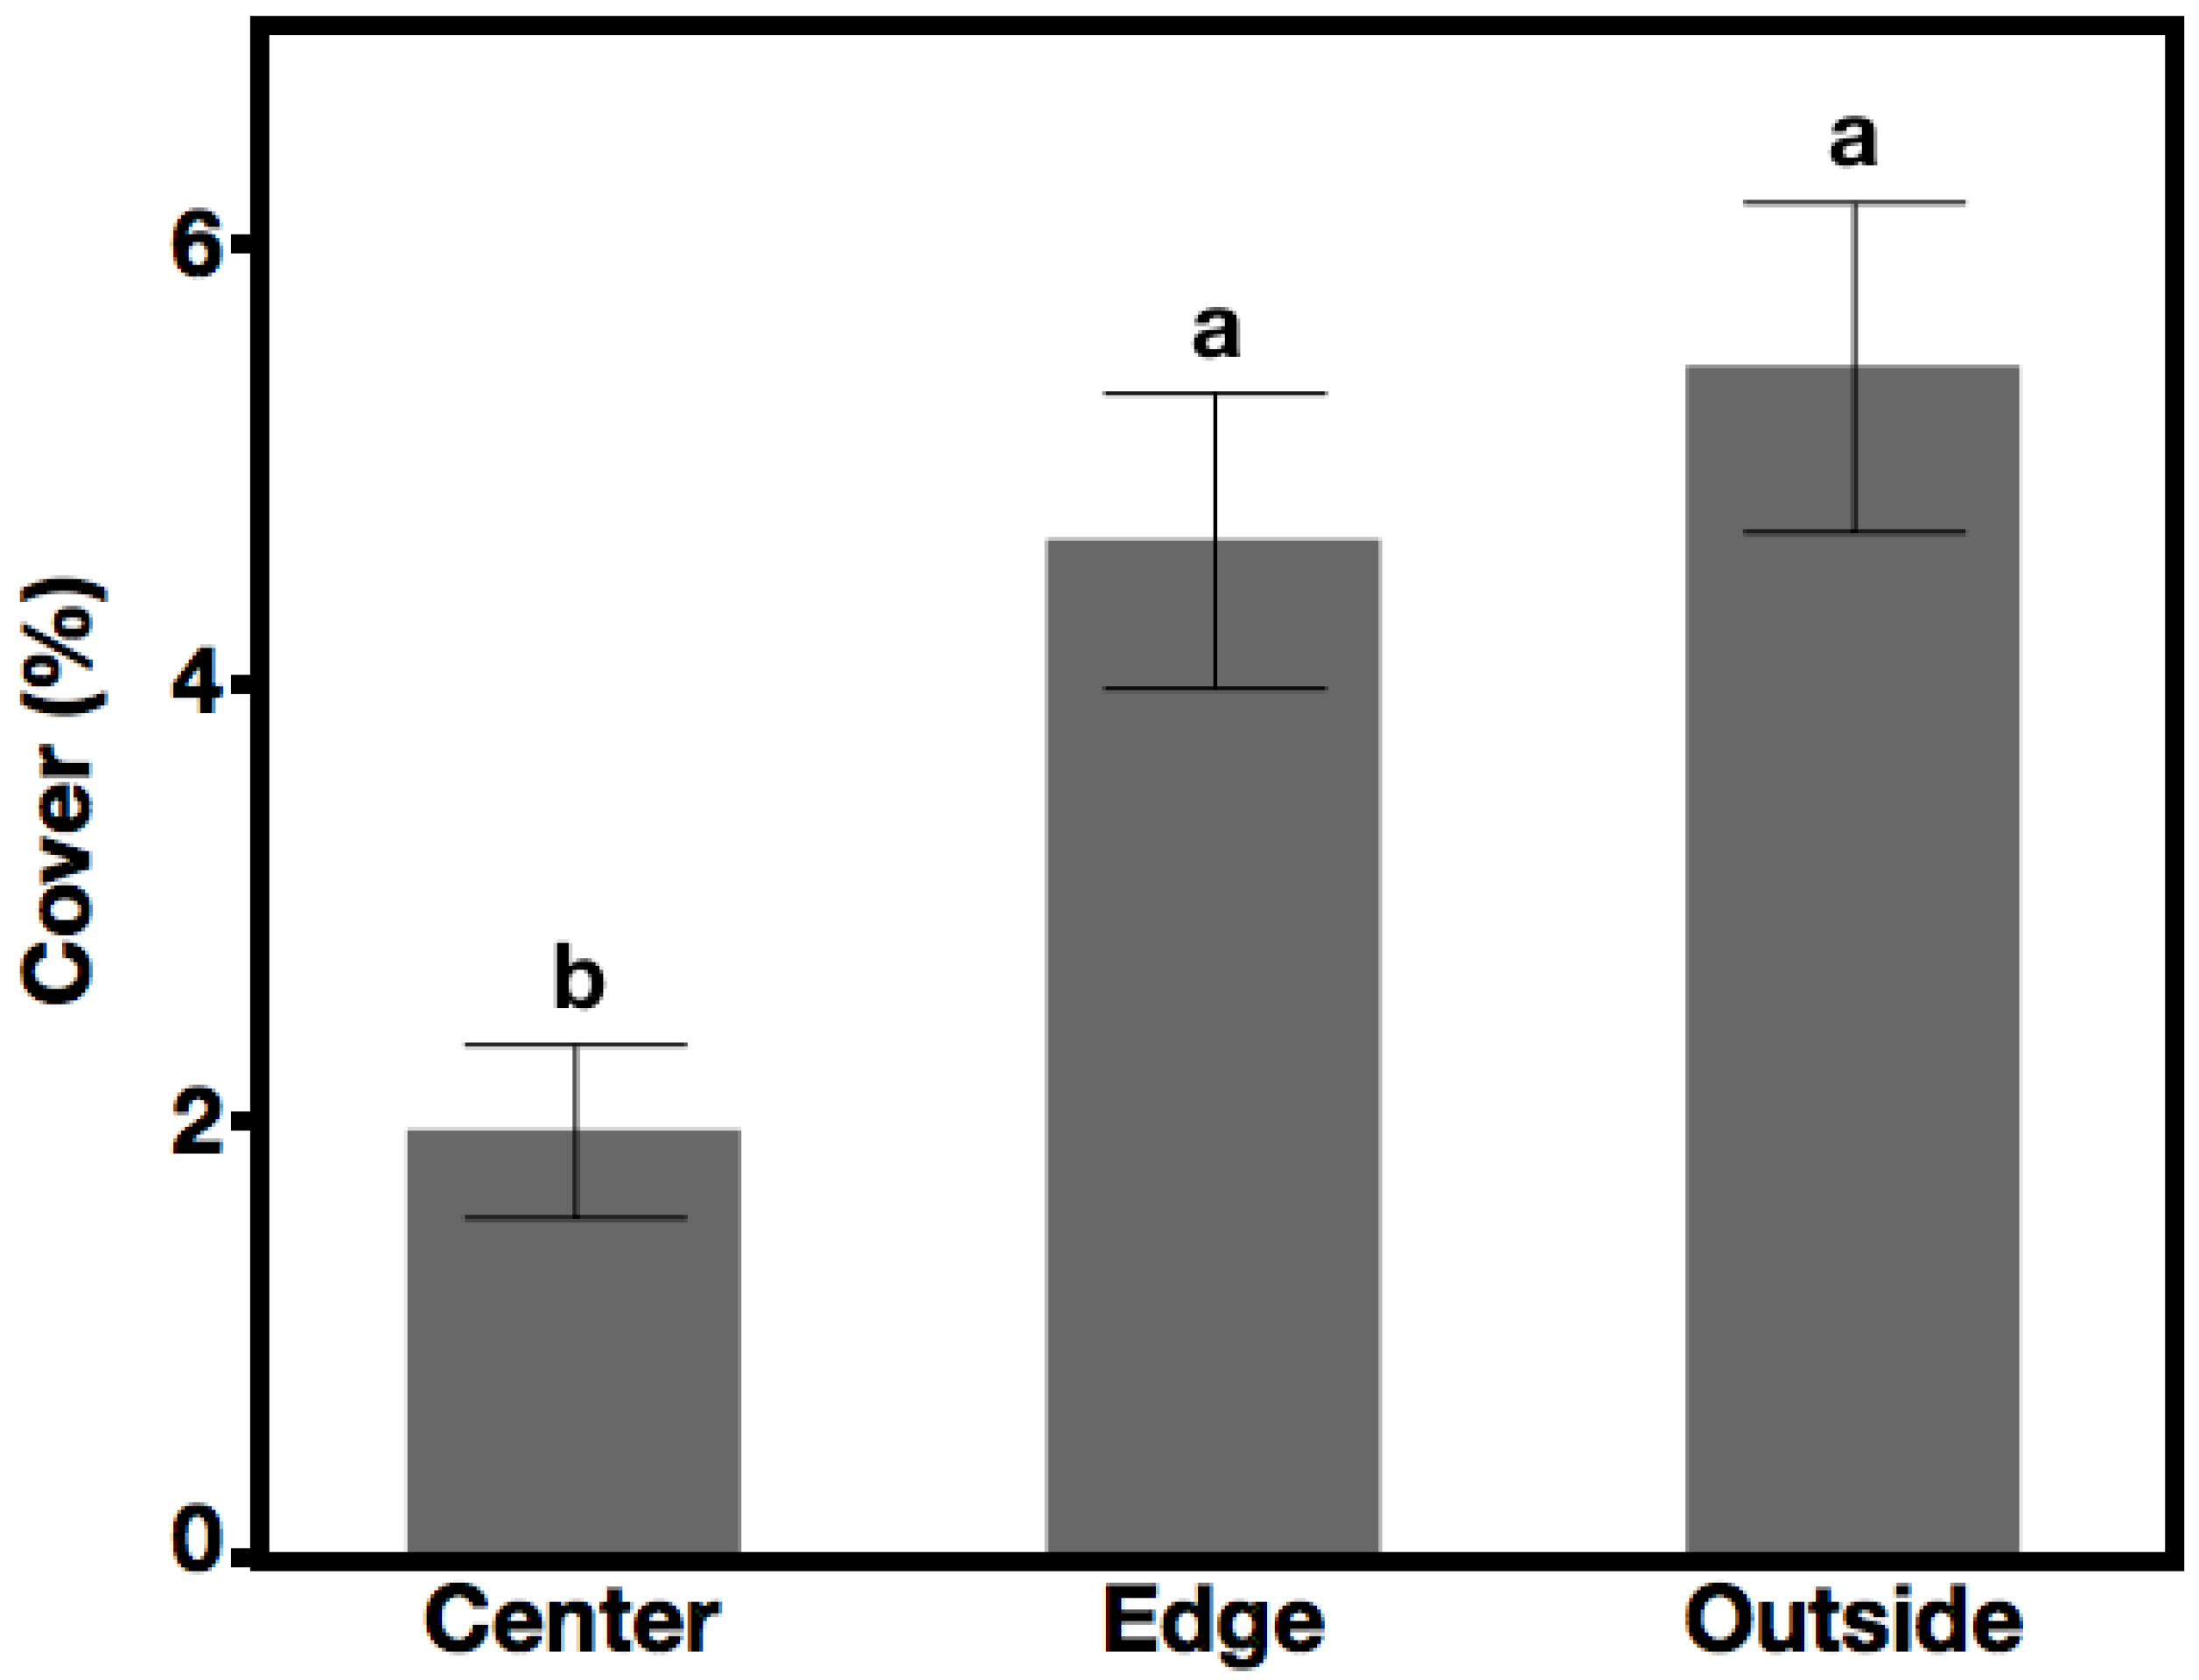
3.3. Native Species, Not Seeded Cover—Hypothesis 3, Prediction 3

The restoration treatment decreased the cover of native species that were not seeded (NSD) depending on the year (Table 2). The cover of the NSD increased in both the restored and control scars, but increased more in the controls. The controls had greater NSD cover than the restored scars in 2016 and 2017 (Figure 8). In 2015, log-transformed NSD cover was slightly higher in the restored scars than controls, but this was marginally significant (p = 0.0497). By the end of the study, controls had 65% more NSD cover than restored scars.
The NSD differed among positions independent of treatment and year (Table 2). The cover of the NSD was lower at the center than the edge and outside, where it did not differ (Figure 9).
For the cover of the NSD, the scar-to-scar variation and quadrat-to-quadrat (within-scar) variation were negligible. Both within-quadrat variance and autocorrelation increased moving from the center to the outside of the scar (p < 0.0001).
We found 45 native species other than those seeded in the initial restoration (Appendix A, Table A2). American red raspberry (Rubus idaeus L.) was the most abundant NSD species in the control scars with an average cover of 0.47% ± 0.19%. Silverleaf phacelia (Phacelia hastata Douglas ex Lehm.) was the most abundant native species not seeded in restored scars, with cover of 0.26% ± 0.15%.

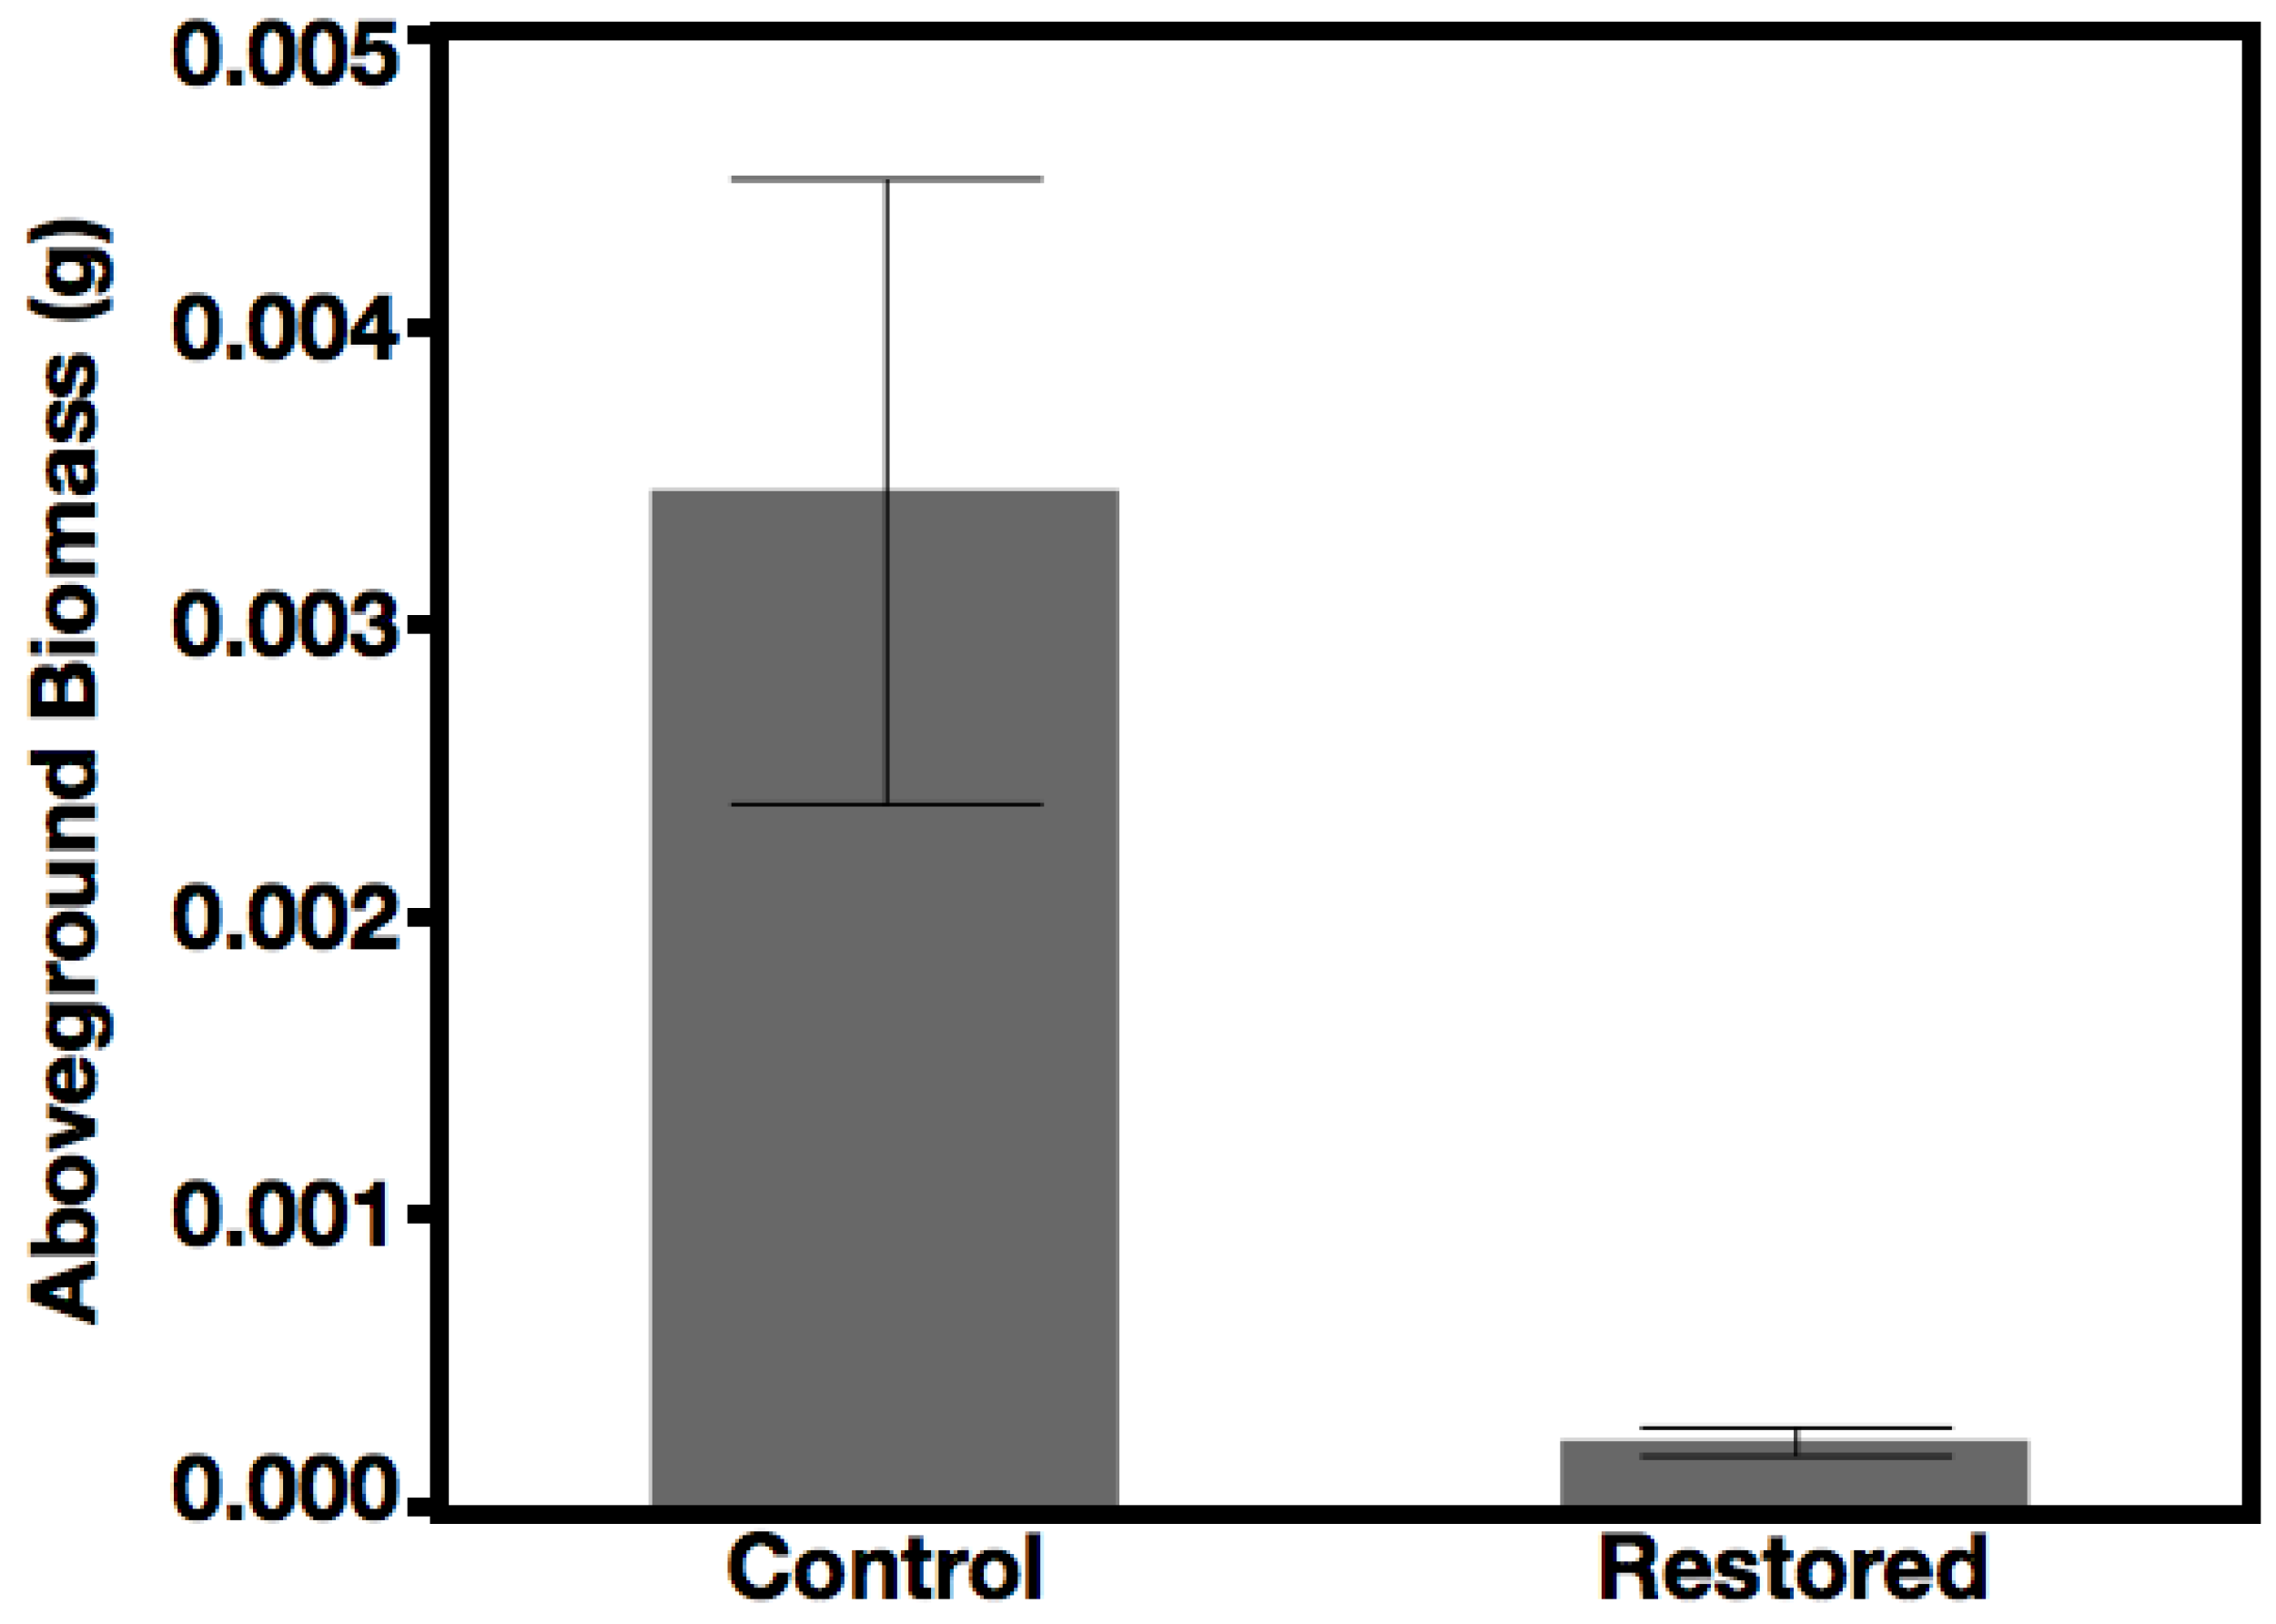
3.4. Recruitment and Productivity of Species Seeded Three Years After Restoration—Hypothesis 3, Prediction 4

Seedlings established equally regardless of restoration (Table 3), but seedlings in the control scars accrued more than 15 times more aboveground biomass than in the restored scars (Figure 10; Appendix A, Figure A4). We did not find a significant correlation between the number of established seedlings and their aboveground biomass (r = 0.19, p = 0.35).

4. Discussion

Burn scar restoration may not be necessary in all situations [8], but it can be a useful tool to establish native vegetation quickly [3,5,6,15] and reduce risks of invasion [3,6,13,15]. We found that this held true for our study and supported our hypotheses that restoration could ameliorate impacts of pile burning to establish native vegetation and suppress non-native species. We also found that restoration could suppress native species that were not seeded during restoration.
When interpreting these results, it is also important to consider the role of spatial variation within scars and how measurements correlate temporally. While we failed to detect an effect of position on the NN cover, there was a spatial component operating on the variance for all three cover responses. Within-quadrat variance increased moving from the center to the outside of the scars for the cover of both groups that were not seeded (NN and NSD). This pattern did not hold true for the cover of the SD. Measurements for all three cover responses were also temporally correlated and showed a spatial pattern in autocorrelation. All three cover responses showed greater autocorrelation at the edge than the center. While the autocorrelation continued to increase outside the scar for the NN and NSD, the SD had an autocorrelation outside of the scar that was similar to the center.

4.1. Hypothesis 1: Establishment of Seeded Species

The establishment of seeded species following restoration increased native plant cover, which supports Hypothesis 1. The restoration species established quickly to dramatically increase the difference between treatments after the first year. Large increases in the SD cover at the restored scar centers and edges created this difference, while the SD cover remained low for all the positions in the control scars (Appendix A, Figure A2 and Figure A3). In a similar study along the Front Range of Colorado, native forbs and graminoids recovered to the abundance found in unburned areas outside of scars regardless of seeding [8]. This differs from our results, where restoration treatments created greater understory plant cover than that found in unburned areas. Similarly, Havrilla et al. found that seeding increased the native cover beyond areas without fuel reduction, and the majority of other studies also found increases in native cover following seeding [3,5,6,14,15].

4.2. Hypothesis 2: Suppression of Non-Native Species

Restoration suppressed the abundance of non-native species relative to unrestored scars, similar to previous studies and in support of Hypothesis 2. We do not believe this result is related to the herbicide application in 2014 because the cover of non-native species did not differ between treatments before the restoration treatment was applied, and non-native species were still present after herbicide application. Furthermore, control and restored scars were equally likely to receive herbicide if they contained Canada thistle. Thus, results can be attributed to the efficacy of the restoration. The restoration treatments were successful in this way; therefore, we were able to demonstrate that local, native seeds could effectively compete with non-natives. Desandoli et al. found that agronomic (primarily non-native) species, seeded into pile burn scars, reduced the cover of non-native species (excluding seeded species), but native seeds did not [6]. This prompted them to suggest testing the effectiveness of native agronomic species to avoid the negative consequences of using non-native agronomic species. In a seeding experiment on pile burn scars in juniper woodlands of central Oregon, seeded cultivars decreased the cover of tall, non-native annuals, but local seeds had no effect on non-native vegetation [15]. Rhoades et al. achieved a marginal reduction in non-native cover using a mix of local seeds and seeds purchased from regional suppliers, while the addition of native seeds from regional suppliers decreased the cover of non-native species after scars were amended with living soil in Arizona [3,8]. These mixed results indicate that seed origin is unlikely to determine non-native suppression. The success of our restoration was likely because we used locally-adapted seeds of grasses competitive with invasive species [24,25]. We also monitored scars long enough for non-native species to increase and differentiate between treatments, while others expected increases after the termination of their experiment [5]. The successful establishment of seeded species was also likely important as Redmond et al. attributed their lack of suppression to the low seedling establishment during drought [13].

4.3. Hypothesis 3: Suppression of Unseeded Native Species

While suppression of non-native plants is a goal of restoration, suppression of native plants may be an unintended consequence. The restoration treatment reduced the cover and productivity of native species that we did not seed during restoration, as predicted by Hypothesis 3. While the cover of the NSD was greater in controls than the restored scars for the final two years of our study, it continued to increase in restored scars. If this trend continued, the NSD cover in the restored scars might have eventually equaled that in the controls, especially if the seeded species declined and were replaced by later seral species as expected by successional theory. However, we still detected a net competitive effect reducing the productivity of common yarrow seeded three years after restoration. The seedlings established equally in the controls and restored scars; therefore, the difference in biomass was not caused by variation in germination or seedling establishment leading to variation in intraspecific competition. Furthermore, we found no correlation between mean aboveground biomass and establishment. Yarrow plants accumulated mass at the same rate regardless of how many conspecifics were present, indicating no net intraspecific competition or facilitation.
Native plants established quickly at the scar edges regardless of treatment, but the scar centers did not recover to the level of the NSD cover found in unburned areas at our study site. In a study of smaller burn scars (3.5 m mean diameter), vegetation near the scar centers recovered to equal the total plant cover found in unburned areas outside scars [8]. This may be a result of smaller burn piles producing less severe fires, reducing the effects of burning.

5. Conclusions

Restoring pile burn scars can quickly establish native cover to slow the march of invasion, but it does not prevent it entirely. Because restoration does not address preexisting infestations in unburned surroundings, it will likely need to be part of an integrated pest management program if management objectives are focused on control of invasive species. Even when invasive species control is the primary goal of management, seeding may not be necessary if invasion pressure is low, and there are sources of native seeds that can disperse into scars. This is particularly true at the scar edges, where plant cover regenerates quickly, or throughout smaller scars. The ability to detect an effect of restoration may also change over longer time periods. Thus, restoration experiments in pile burn scars should be followed for longer periods in the future to see if the restored scars are eventually dominated by non-native species and seeded species are replaced. The studies we found that examined seeding into pile burn scars only sampled vegetation for one to two years [3,5,6,8,13,15]. One study sampled vegetation for six growing seasons after pile burning, but all the pile burn plots were seeded and could not be compared to unseeded controls [14]. It will also be important to follow pile burn scars over longer time periods to examine how long restoration suppresses native vegetation. Managers will need to consider the objectives of management actions when weighing the benefits of restoration against the consequences for native vegetation. We did not see unseeded native species recover in scar centers, leaving unrestored scars vulnerable to invasion.

Author Contributions

Conceptualization, C.S.B. and L.R.; methodology, L.R.; software, P.T.; validation, C.S.B., I.S. and P.T.; formal analysis, P.T.; investigation, I.S. and L.R.; resources, C.S.B.; data curation, I.S.; writing—original draft preparation, I.S.; writing—review and editing, C.S.B. and I.S.; visualization, I.S.; supervision, C.S.B.; project administration, C.S.B.; funding acquisition, C.S.B. All authors have read and agreed to the published version of the manuscript.

Funding

This research was funded by The United States Department of the Interior, National Park Service, cooperative agreement number P14AC00749 and the APC was funded by the Colorado Agricultural Experiment Station.

Acknowledgments

Kara Brunngraber, Erin Durant, Paula J. Fornwalt, Mark W. Paschke, Rachel Rubin.

Conflicts of Interest

Employees of the funding agency designed the study, collected and interpreted data, wrote this manuscript, and are responsible for the decision to publish the results.

Appendix A

Figure A1. Photographs of (a) a scar left by burning slash piles to reduce the amount of woody fuels at the Lily Lake in Rocky Mountain National Park, and (b) a scar that was restored by scarifying the soil, seeding native plant species, and raking litter in from the surrounding area.
Forests 11 00813 g0a1
Figure A2. Subplots used to estimate cover at the (a) center, (b) edge, and (c) outside unrestored pile burn scars at the Lily Lake in Rocky Mountain National Park three years after burning.
Forests 11 00813 g0a2
Figure A3. Subplots used to estimate cover at the (a) center, (b) edge, and (c) outside restored pile burn scars at the Lily Lake in Rocky Mountain National Park three years after restoration.
Forests 11 00813 g0a3
Figure A4. Yarrow seedlings representative of average size after a single growing season when grown in restored (a) and unrestored (b) pile burn scars at the Lily Lake in Rocky Mountain National Park three years after burning/restoration.
Forests 11 00813 g0a4
Table A1. Cover of non-native plants by species in restored and unrestored pile burn scars at the Lily Lake in Rocky Mountain National Park. Means and standard errors of the mean are averaged across years and position.
ControlRestored
MeanSEMeanSE
Agrostis stolonifera L.0.11110.04990.08630.0426
Bromus inermis Leyss.0.04860.031300
Bromus tectorum L.0.03130.019800
Cirsium arvense (L.) Scop.1.48610.45560.13100.0590
Phleum pratense L.0.07990.05890.07440.0411
Poa compressa L.0.53130.21560.41960.1706
Rumex acetosella L.0.43060.215000
Rumex crispus L. 000.06850.0505
Salsola collina Pall.0.00350.003500
Taraxacum officinale F. H. Wigg.0.21180.06030.24400.1226
Table A2. Cover of native plants that were not seeded by species in restored and unrestored pile burn scars at Lily Lake in Rocky Mountain National Park. Means and standard errors of the mean are averaged across years and position.
ControlRestored
MeanSEMeanSE
Achillea millefolium L.000.00300.0030
Agrostis scabra Willd.0.18400.07370.01490.0123
Agrostis sp.0.29860.10710.09520.0531
Androsace septentrionalis L.0.01390.01390.05060.0448
Antennaria parvifolia Nutt.0.00350.003500
Antennaria sp.0.02780.027800
Arabis fendleri (S. Watson) Greene000.00300.0030
Arctostaphylos uva-ursi (L.) Spreng000.01190.0119
Arnica cordifolia Hook.0.06940.05390.02380.0238
Arnica latifolia Bong.000.01490.0149
Arnica sp.0.06600.053800
Artemisia ludoviciana (Nutt).0.02780.02780.01190.0119
Artemisia sp.0.02780.027800
Astragalus sp.0.00350.003500
Carex sp.1.02780.21830.85420.2923
Chamerion angustifolium (L.) Holub0.01390.01390.05950.0313
Chenopodium fremontii S. Watson0.14240.07580.00300.0030
Chenopodium sp.0.00350.003500
Corydalis aurea Willd.0.00350.00350.05060.0448
Descurainia incana (Bernh. ex Fisch. & C.A. Mey.) Dorn 0.00350.003500
Potentilla fissa Nutt.0.00350.00350.00300.0030
Epilobium ciliatum Raf.0.02430.015100
Epilobium lactiflorum Hausskn.0.01740.01430.00300.0030
Epilobium palustre L.0.00350.003500
Epilobium sp.0.02430.01510.00600.0042
Equisetum arvense L.000.00300.0030
Erysimum capitatum (Douglas ex Hook.) Greene0.04860.031300
Festuca saximontana Rydb.0.01390.01390.04760.0290
Festuca sp.000.00300.0030
Fragaria sp.000.00300.0030
Fragaria virginiana Duchesne000.00600.0042
Gayophytum diffusum Torr. & A. Gray0.00350.00350.02980.0138
Grindelia subalpina Greene0.00350.00350.00300.0030
Harbouria trachypleura (A. Gray) J.M. Coult. & Rose000.02980.0173
Heterotheca villosa0.02780.027800
Koeleria macrantha (Ledeb.) Schult. 0.02780.019600
Leymus ambiguus0.01740.014300
Lupinus bakeri000.00300.0030
Monolepis nuttalliana (Schult.) Greene 0.02080.014700
Oreochrysum parryi (A. Gray) Rydb. 0.02780.02780.02380.0238
Oxytropis sp.0.06600.05380.00300.0030
Packera fendleri (A. Gray) W.A. Weber & Á. Löve 0.05560.039100
Penstemon sp.0.00350.003500
Penstemon virens Pennell ex Rydb. 0.17360.06600.00300.0030
Phacelia alba Rydb. 0.00350.00350.06850.0505
Phacelia hastata Douglas ex Lehm.000.26490.1535
Phacelia sericea (Graham) A. Gray0.10070.06050.05950.0462
Phacelia sp.000.00300.0030
Pinus contorta Douglas ex Loudon0.04860.02430.04460.0210
Pinus sp.0.11110.02720.06550.0279
Potentilla fissa Nutt.0.02080.01470.02380.0168
Potentilla norvegica L.000.02380.0238
Pseudognaphalium macounii (Greene) Kartesz 0.04170.031000
Pseudotsuga menziesii (Mirb.) Franco0.00350.00350.00600.0042
Ribes sp.0.00350.00350.02380.0168
Rosa woodsii Lindl.0.04510.024100
Rubus idaeus L.0.47220.19430.12200.0651
Sedum lanceolatum Torr.0.05210.02450.08630.0426
Senecio eremophilus Richardson0.00350.00350.12800.1067
Senecio sp.0.00350.003500
Solidago simplex Kunth0.06600.053800
Solidago sp.000.07140.0505
Unk. Forb0.52080.12950.26190.1479
Unk. Grass0.06250.02200.04760.0271
Unk. Sedge0.74310.21900.68150.2218

References

  1. Adams, M.A. Mega-fires, tipping points and ecosystem services: Managing forests and woodlands in an uncertain future. For. Ecol. Manag. 2013, 294, 250–261. [Google Scholar] [CrossRef]
  2. Waltz, A.E.M.; Stoddard, M.T.; Kalies, E.L.; Springer, J.D.; Huffman, D.W.; Meador, A.S. Effectiveness of fuel reduction treatments: Assessing metrics of forest resiliency and wildfire severity after the Wallow Fire, AZ. For. Ecol. Manag. 2014, 334, 43–52. [Google Scholar] [CrossRef]
  3. Korb, J.E.; Johnson, N.C.; Covington, W.W. Slash pile burning effects on soil biotic and chemical properties and plant establishment: Recommendations for amelioration. Restor. Ecol. 2004, 12, 52–62. [Google Scholar] [CrossRef]
  4. Creech, M.N.; Kirkman, L.K.; Morris, L.A. Alteration and Recovery of Slash Pile Burn Sites in the Restoration of a Fire-Maintained Ecosystem. Restor. Ecol. 2012, 20, 505–516. [Google Scholar] [CrossRef]
  5. Fornwalt, P.J.; Rhoades, C.C. Rehabilitating Slash Pile Burn Scars in Upper Montane Forests of The Colorado Front Range. Nat. Areas J. 2011, 31, 177–182. [Google Scholar] [CrossRef]
  6. DeSandoli, L.; Turkington, R.; Fraser, L.H. Restoration of slash pile burn scars to prevent establishment and propagation of non-native plants. Can. J. For. Res. 2016, 46, 1042–1050. [Google Scholar] [CrossRef] [Green Version]
  7. Rhoades, C.C.; Fornwalt, P.J. Pile burning creates a fifty-year legacy of openings in regenerating lodgepole pine forests in Colorado. For. Ecol. Manag. 2015, 336, 203–209. [Google Scholar] [CrossRef]
  8. Rhoades, C.C.; Fornwalt, P.J.; Paschke, M.W.; Shanklin, A.; Jonas, J.L. Recovery of small pile burn scars in conifer forests of the Colorado Front Range. For. Ecol. Manag. 2015, 347, 180–187. [Google Scholar] [CrossRef]
  9. Haskins, K.E.; Gehring, C.A. Long-term effects of burning slash on plant communities and arbuscular mycorrhizae in a semi-arid woodland. J. Appl. Ecol. 2004, 41, 379–388. [Google Scholar] [CrossRef]
  10. Hubbert, K.R.; Busse, M.; Overby, S.; Shestak, C.; Gerrard, R. Pile burning effects on soil water repellency, infiltration, and downslope water chemistry in the lake tahoe basin, USA. Fire Ecol. 2015, 11, 100–118. [Google Scholar] [CrossRef]
  11. Davis, M.A.; Grime, J.P.; Thompson, K. Fluctuating resources in plant communities: A general theory of invasibility. J. Ecol. 2000, 88, 528–534. [Google Scholar] [CrossRef] [Green Version]
  12. Eschen, R.; Mortimer, S.R.; Lawson, C.S.; Edwards, A.R.; Brook, A.J.; Igual, J.M.; Hedlund, K.; Schaffner, U. Carbon addition alters vegetation composition on ex-arable fields. J. Appl. Ecol. 2007, 44, 95–104. [Google Scholar] [CrossRef] [Green Version]
  13. Redmond, M.D.; Zelikova, T.J.; Barger, N.N. Limits to Understory Plant Restoration Following Fuel-Reduction Treatments in a Pion-Juniper Woodland. Environ. Manag. 2014, 54, 1139–1152. [Google Scholar] [CrossRef] [PubMed]
  14. Havrilla, C.A.; Faist, A.M.; Barger, N.N. Understory Plant Community Responses to Fuel-Reduction Treatments and Seeding in an Upland Pinon-Juniper Woodland. Rangel. Ecol. Manag. 2017, 70, 609–620. [Google Scholar] [CrossRef]
  15. Kerns, B.K.; Day, M.A. Fuel Reduction, Seeding, and Vegetation in a Juniper Woodland. Rangel. Ecol. Manag. 2014, 67, 667–679. [Google Scholar] [CrossRef]
  16. Levine, J.M.; Adler, P.B.; Yelenik, S.G. A meta-analysis of biotic resistance to exotic plant invasions. Ecol. Lett. 2004, 7, 975–989. [Google Scholar] [CrossRef] [Green Version]
  17. Schuster, M.J.; Wragg, P.D.; Reich, P.B. Using revegetation to suppress invasive plants in grasslands and forests. J. Appl. Ecol. 2018, 55, 2362–2373. [Google Scholar] [CrossRef]
  18. Connell, J.H.; Slatyer, R.O. Mechanisms of succession in natural communities and their role in community stability and organization. Am. Nat. 1977, 111, 1119–1144. [Google Scholar] [CrossRef]
  19. Temperton, V.M.; Zirr, K. Order of Arrival and Availability of Safe Sites: An Example of Their Importance for Plant Community Assembly in Stressed Ecosystems. In Assembly Rules and Restoration Ecology: Bridging the Gap between Theory and Practice; Temperton, V.M., Hobbs, R.J., Nuttle, T., Halle, S., Eds.; Island Press: Washington, DC, USA, 2004; pp. 285–304. [Google Scholar]
  20. United States Department of Agriculture. Copeland Lake; SNOTEL Station 412; 1988–2017 Data. Available online: https://wcc.sc.egov.usda.gov/ (accessed on 9 November 2018).
  21. Daubenmire, R. A canopy-coverage method of vegetational analysis. Northwest Sci. 1959, 33, 43–64. [Google Scholar]
  22. United States Department of Agriculture-Natural Resources Conservation Service. The Plants Database. Available online: http://plants.usda.gov/ (accessed on 26 January 2016).
  23. Akaike, H. New look at statistical-model identification. IEEE Trans. Autom. Control 1974, 19, 716–723. [Google Scholar] [CrossRef]
  24. Arredondo, J.T.; Jones, T.A.; Johnson, D.A. Seedling growth of Intermountain perennial and weedy annual grasses. J. Range Manag. 1998, 51, 584–589. [Google Scholar] [CrossRef] [Green Version]
  25. Ulrich, E.; Perkins, L. Bromus inermis and Elymus canadensis but not Poa pratensis demonstrate strong competitive effects and all benefit from priority. Plant Ecol. 2014, 215, 1269–1275. [Google Scholar] [CrossRef]
Figure 1. Map of the plot locations at the Lily Lake in Rocky Mountain National Park near Estes Park, Colorado, USA. The orange line indicates the division between plots on the north and south sides of the hill.
Forests 11 00813 g001
Figure 2. Timeline of treatment and research events to examine the effects of restoration on understory vegetation in pile-burn scars at Lily Lake in Rocky Mountain National Park.
Forests 11 00813 g002
Figure 3. Diagram of subplot orientation and location relative to scars created by burning slash piles at Lily Lake in Rocky Mountain National Park. The small orange circles represent the ends of the transect used to align the subplots. The black rectangles represent the three locations where we estimated cover for each scar in 0.5 m by 1.5 m subplots. The checkered squares indicate the location of seeds added to 25 cm by 25 cm subplots three years after burning/restoration.
Forests 11 00813 g003
Figure 4. Cover of seeded native species (squirreltail (Elymus elymoides Raf. Swezey), Canada wildrye (Elymus canadensis L.), and prairie sagewort (Artemisia frigida Willd.)) averaged across position in pile burn scars before (2014) and after restoration at the Lily Lake in Rocky Mountain National Park. Points are means ± standard error of the mean. Means labeled with different letters within a treatment level indicate that the log-transformed means differed among years and asterisks indicate years when the log-transformed means differed between treatment levels (Holm adjusted p < 0.05).
Forests 11 00813 g004
Figure 5. Cover of seeded native species [squirreltail (Elymus elymoides Raf. Swezey), Canada wildrye (Elymus canadensis L.), and prairie sagewort (Artemisia frigida Willd.)] in pile burn scars at the Lily Lake in Rocky Mountain National Park averaged over time (pre-restoration to three years after restoration). Bars are means ± standard error of the mean. Means labeled with different letters within a treatment level (restored or control) indicate that the log-transformed means differed between positions and asterisks indicate the positions where the log-transformed means differed between treatment levels (Holm adjusted p < 0.05).
Forests 11 00813 g005
Figure 6. Cover of seeded native species (squirreltail (Elymus elymoides Raf. Swezey), Canada wildrye (Elymus canadensis L.), and prairie sagewort (Artemisia frigida Willd.)) averaged across treatments in pile burn scars before (2014) and after restoration at Lily Lake in Rocky Mountain National Park. Points are means ± standard error of the mean. Means labeled with different letters within a position indicate that the log-transformed means differed between years and asterisks indicate the years when all log-transformed means differed between positions (Holm adjusted p < 0.05).
Forests 11 00813 g006
Figure 7. Cover of non-native species in pile burn scars averaged across position before (2014) and after restoration at Lily Lake in Rocky Mountain National Park. Points are means ± standard error of the mean. Means labeled with different letters within a treatment level indicate that the log-transformed means differed between years and asterisks indicate years when the log-transformed means differed between treatment levels (Holm adjusted p < 0.05).
Forests 11 00813 g007
Figure 8. Cover of native species that were not seeded in pile burn scars averaged across position before (2014) and after restoration at Lily Lake in Rocky Mountain National Park. Points are means ± standard error of the mean. Means labeled with different letters within a treatment level indicate that the log-transformed means differed between years and asterisks indicate the years when the log-transformed means differed between treatment levels (Holm adjusted p < 0.05).
Forests 11 00813 g008
Figure 9. Cover of native species that were not seeded in pile burn scars at Lily Lake in Rocky Mountain National Park averaged over time and treatment. Bars are means ± standard error of the mean. Means labeled with different letters indicate that the log-transformed means differed between position (Holm adjusted p < 0.05).
Forests 11 00813 g009
Figure 10. Productivity of common yarrow (Achillea millefolium L.) seeded into scars 3.5 years after pile burning at Lily Lake in Rocky Mountain National Park. Bars are means ± standard error of the mean of the aboveground biomass per plant.
Forests 11 00813 g010
Table 1. Plant species seeded during the restoration of pile burn scars at Lily Lake in Rocky Mountain National Park in 2014.
Seed Mix Composition% Pure Live Seed
Elymus elymoides (Raf.) Swezey24%80–90%
Elymus canadensis L.64%63–87%
Artemisia frigida Willd.12%85–90%
Table 2. Linear mixed model analysis of log-transformed plant cover at Lily Lake in Rocky Mountain National Park. P-values were adjusted using the Holm step-down procedure. Bold p-values are statistically significant (α = 0.05). An asterisk (*) indicates an interaction between factors.
Seeded SpeciesNon-Native SpeciesNative Species Not Seeded
Num dfDen dfFpNum dfDen dfFpNum dfDen dfFp
Treatment152.8126.11<0.01133.47.800.09134.214.440.01
Year3118.045.65<0.013204.013.59<0.013190.054.05<0.01
Position236.594.43<0.01239.84.370.17241.314.51<0.01
Treatment * Year349.25.980.013196.05.190.023188.08.73<0.01
Treatment * Position237.963.52<0.01240.40.061.00241.92.600.34
Position * Year6113.020.26<0.016169.00.671.006156.02.830.10
Block139.73.010.54120.70.271.00122.75.690.15
Block * Treatment115.50.511.00118.60.221.00119.40.800.76
Block * Year349.20.971.003196.01.651.003188.00.500.76
Block * Position237.91.960.77240.40.391.00241.94.190.15
UTMX115.50.491.00118.60.241.00119.43.850.32
UTMY115.51.251.00118.60.431.00119.42.060.50
Table 3. Linear mixed model analysis of establishment and logit transformed productivity (mean aboveground biomass per plant) of common yarrow (Achillea millefolium L.) seeded into scars 3.5 years after pile burning at Lily Lake in Rocky Mountain National Park. Treatment levels were restored or unrestored controls. p-values were adjusted using the Holm step-down procedure. Bold p-values are statistically significant (α = 0.05). An asterisk (*) indicates an interaction between factors.
SurvivalProductivity
Num dfDen dfFpNum dfDen dfFp
Treatment1200.750.4012030.88<0.01
Block1205.740.131200.910.14
Treatment * Block1201.800.391201.970.47
UTMX1202.540.381202.180.47
UTMY1205.000.151202.180.47

