Article

Transcriptome and Co-Expression Network Analyses Identify the Molecular Signatures Underlying Drought Resistance in Yellowhorn

1
State Key Laboratory of Tree Genetics and Breeding, Research Institute of Forestry, Chinese Academy Forestry, Beijing 100091, China
2
Chifeng Academy Forestry, Chifeng 024000, China
*
Author to whom correspondence should be addressed.
Forests 2020, 11(8), 840; https://doi.org/10.3390/f11080840
Submission received: 28 June 2020 / Revised: 21 July 2020 / Accepted: 27 July 2020 / Published: 1 August 2020
(This article belongs to the Section Forest Ecophysiology and Biology)

Abstract

:
Drought is a key factor that limits plant growth and yield. Yellowhorn is an important and vigorously promoted oil tree in China. It can survive under certain drought conditions, but a lack of water severely restricts its growth and results in yield losses in arid and semi-arid areas. Therefore, it is important to identify the key pathways and genes to understand the mechanisms of its drought resistance. In this study, we evaluated drought resistance in four types of yellowhorn, and obtained 2669 and 2451 differentially expressed genes (DEGs) via the transcriptome analysis of the comparison of water-saving/water-consuming and fast-growing/slow-growing yellowhorn, respectively, under long-term drought conditions. The gene ontology (GO) and Kyoto Encyclopedia of Genes and Genomes (KEGG) analyses of DEGs showed the key biological processes and metabolic pathways involved in drought resistance, which demonstrated that there are both the same and different biological processes involved in regulating water use efficiency (WUE) and growth in response to drought stress. Furthermore, the network analysis indicated hub genes (especially seven protein kinases) and potential co-expressed gene clusters in a greenyellow module associated with WUE and a blue module associated with growth. These identified hub genes and key biological processes can significantly enhance our knowledge about the molecular mechanisms of drought resistance in yellowhorn.

1. Introduction

Yellowhorn (Xanthoceras sorbifolium Bunge), an oil woody plant belonging to the genus Xanthocera (Sapindaceae), is of great medicinal, economic, and ecological value [1]. The seed kernel of yellowhorn is rich in oil with unsaturated fatty acids and unique neuric acid, which are used for edible oil and in nervonic acid capsules [2,3]. In addition, yellowhorn has a strong adaptability to drought, cold, and barren environments, and is widely distributed in the hills and sandy land of Northern China, which can contribute to sand fixation and the ecological environment [4]. However, hostile environments, especially drought, also inhibit the growth and yield of yellowhorn [5,6]. Drought stress is an important restricting factor that limits the expansion of a suitable growth area, the survival rate of afforestation, and a high yield of yellowhorn.
Drought stress is the most prevalent environmental problem that seriously affects the normal growth and development of plants and restricts the development of forestry and agriculture in the world [7,8]. Deciphering the underlying molecular mechanism of how plants adapt to drought is critical in order to develop drought resistance and improve growth characteristics of various plant species [7,9]. In plants, response to drought stress involves a series of physiological, cellular, and molecular processes, for instance, stomatal closure, root morphology formation, reactive oxygen species (ROS) release, and osmotic and hormone regulation [7]. At a molecular level, a number of drought-responsive genes have been identified in plants via molecular and genomic analyses, such as receptors that sense osmotic and oxidative stresses, transcription factors that regulate stress-inducible gene expression, and biosynthetic and degrading enzymes [9,10,11]. A great deal of drought responsive genes are regulated at transcriptional and post-translational levels, and phosphorylation modification plays an important role in response to drought stress [12]. For example, SnRK2s protein kinases, which play a critical role in the abscisic acid (ABA) signaling pathway; mitogen activated protein kinases (MAPKs), which play a critical role in the cascade pathway; and calcium-dependent protein kinases (CDPKs) have been identified to be involved in the responses to drought stress [13].
Until now, the research on the drought resistance of yellowhorn has mainly been about the breeding of drought-tolerant varieties, as well as about the physiological and growth responses. Under drought conditions, the growth (such as dry weight, plant height, basal diameter, and leaf area) of yellowhorn seedlings is inhibited, while their root length increases [5,6]. Moreover, the study on the physiological characteristics of yellowhorn seedlings reveals that the contents of osmotic regulation substances (soluble sugar, soluble protein, and proline) and the activities of antioxidative enzymes (catalase (CAT), superoxide dismutase (SOD) and peroxidase (POD)) were increased by drought stress [5,14]. Yellowhorn with a stronger tolerance to drought has a higher water use efficiency (WUE), which is one of the decisive factors affecting its response to drought [5,15]. However, the molecular mechanisms of drought resistance in yellowhorn remain largely unknown.
Transcriptomic analysis is a widely used large-scale experimental approach to investigate genome function, and may contribute to clarifying the important pathways and genes related to the phenotype [16]. In this study, we conducted a comparative study of the gene expressions in four types of yellowhorn with different WUEs and growth performance under natural drought condition. Two co-expressed gene clusters associated with the WUE and growth trait were obtained, respectively, and several hub genes were predicted by transcriptome results, by using weighted gene co-expression network analysis (WGCNA). These findings identified the pathways and genes involved in drought stress responses in different types of yellowhorn, which should facilitate the elucidation of the regulation mechanisms of drought stress, and provide a valuable genetic resource for drought tolerance improvement in yellowhorn.

2. Materials and Methods

2.1. Plant Materials

Ten ten-year-old yellowhorn seedling trees selected from four types (water-saving and fast-growing germplasm resources (WSFG), water-consuming and fast-growing germplasm resources (WCFG), water-saving and slow-growing germplasm resources (WSSG), and water-consuming and slow-growing germplasm resources (WCSG)), which were previously identified according to the ground diameter and WUE (Supplemental Table S1; Supplemental Figure S1), were used. The WUE was measured by δ13C, one of the most reliable methods for testing WUE. These yellowhorn trees were in the yellowhorn Germplasm Resources Garden at Liaoning (122°52′ E; 42°42′ N), China, and had the same management level. The fresh and mature leaves in the same location of the yellowhorn trees were collected in June 2017, after this area had suffered severe drought for six months and had no artificial irrigation. The samples were frozen in liquid nitrogen and stored at −80 °C.

2.2. RNA Extraction, Library Construction, and Sequencing

The total RNA was extracted from the leaves of the yellowhorn using an RNAprep Pure Plant Plus Kit (polysaccharide- and polyphenolic-rich; Tiangen, Beijing, China) according to the manufacturer’s instructions. The RNA integrity and quality were verified by RNase-free agarose gel, Qubit 2.0 fluorometry (Life Technologies, Carlsbad, CA, USA), and an Agilent 2100 Bioanalyzer (Agilent Technologies, Santa Clara, CA, USA).
Sequencing libraries were constructed using the NEBNext Ultra RNA Library Prep Kit for Illumina (NEB, MA, USA), referring to the manufacturer’s recommendations. The mRNA purified by the oligo-(dT) magnetic beads was fragmented into smaller pieces and used as a template for the first-strand cDNA synthesis, which was followed by the second strand cDNA synthesis with DNA Polymerase I, dNTPs, and RNase H. After end repair and A-tailing, the double-stranded cDNAs were ligated to the NEBNext Adaptor for hybridization, and were purified with an AMPure XP system (Beckman Coulter, Beverly, MA, USA) in order to select target fragments of 150–200 bp. Then, the cDNA segments were enriched and screened by PCR amplification. The library was sequenced by Novogene Co., Ltd. (Beijing, China), using an Illumina HiSeq platform (Illumina, San Diego, CA, USA), and 2 × 150 bp paired-end reads were generated. The raw sequencing data were deposited in the National Center for Biotechnology Information (NCBI) under accession number PRJNA483857.

2.3. Transcriptome Assembly and Functional Annotation

The raw reads were filtered by removing the adapter sequences, which were the reads containing more than 10% ambiguous “N” bases and low-quality reads (Q ≤ 20). All of the clean reads were assembled by the transcriptome using the Trinity program and were mapped onto the Xanthoceras sorbifolium reference genome. To further understand the unigene functions, NCBI non-redundant protein sequences (Nr), Swiss-Prot, Kyoto Encyclopedia of Genes and Genomes (KEGG), clusters of orthologous groups of proteins (KOG/COG), gene ontology (GO), NCBI nucleotide sequences (Nt), and annotated protein family (Pfam) were used to annotate the unigenes, using the BLASTX with a cutoff E-value of ≤ 10−5.

2.4. Identification of Differentially Expressed Genes (DEGs)

The expression levels of the assembled unigenes were normalized by calculating the fragments per kb per million mapped reads (FPKM) values. Differential expression analyses between distinct samples were performed with the DESeq2 R package, which provides statistical routines for determining the differential expression in digital gene expression data using a model based on the negative binomial distribution. The resulting p-values were adjusted using the Benjamini–Hochberg approach to control the false discovery rate (FDR). The threshold for significant DEGs in a comparison was |log2Fold Change| ≥ 1 and FDR < 0.05.
The GO functional enrichment analysis and KEGG pathway analysis of the DEGs were implemented using the GOseq R package and KOBAS software, respectively, and the terms with a p-value ≤ 0.05 were defined as significantly enriched.

2.5. WGCNA and Hub Genes Analysis

The co-expression networks were built using the WGCNA (v1.69) package in R [17]. The traits of the WUE and growth index (increment of diameter) of four types of yellowhorn (Supplemental Table S1) and the relevant DEGs after removing the DEGs with too many missing values (>70% missing) were used for WGCNA. The expression level of the DEGs was log transformed using log2 (FPKM + 1). Pearson’s correlations coefficient was used to measure the co-expression relationship between each pair of genes. The WGCNA network was constructed with a soft thresholding power of β = 30, a minimum module size of 30 genes, and modules with a high correlation (r > 0.80). The module–trait relationship, gene significance (GS) of traits in the module, and the correlation coefficient between the module membership (MM) and GS were used to measure the association with WUE and the growth index. After the modules were identified, the candidate hub genes in the modules were picked by an intra-module connectivity (KME) > 0.9, then the hub genes, excluding the unannotated genes, were used to construct and visualize the gene co-expression network of the WUE and growth index (increment of diameter) with the Cytoscape (v3.7.1, https://cytoscape.org/) tool. GO and KEGG enrichment analyses were performed for these hub genes.

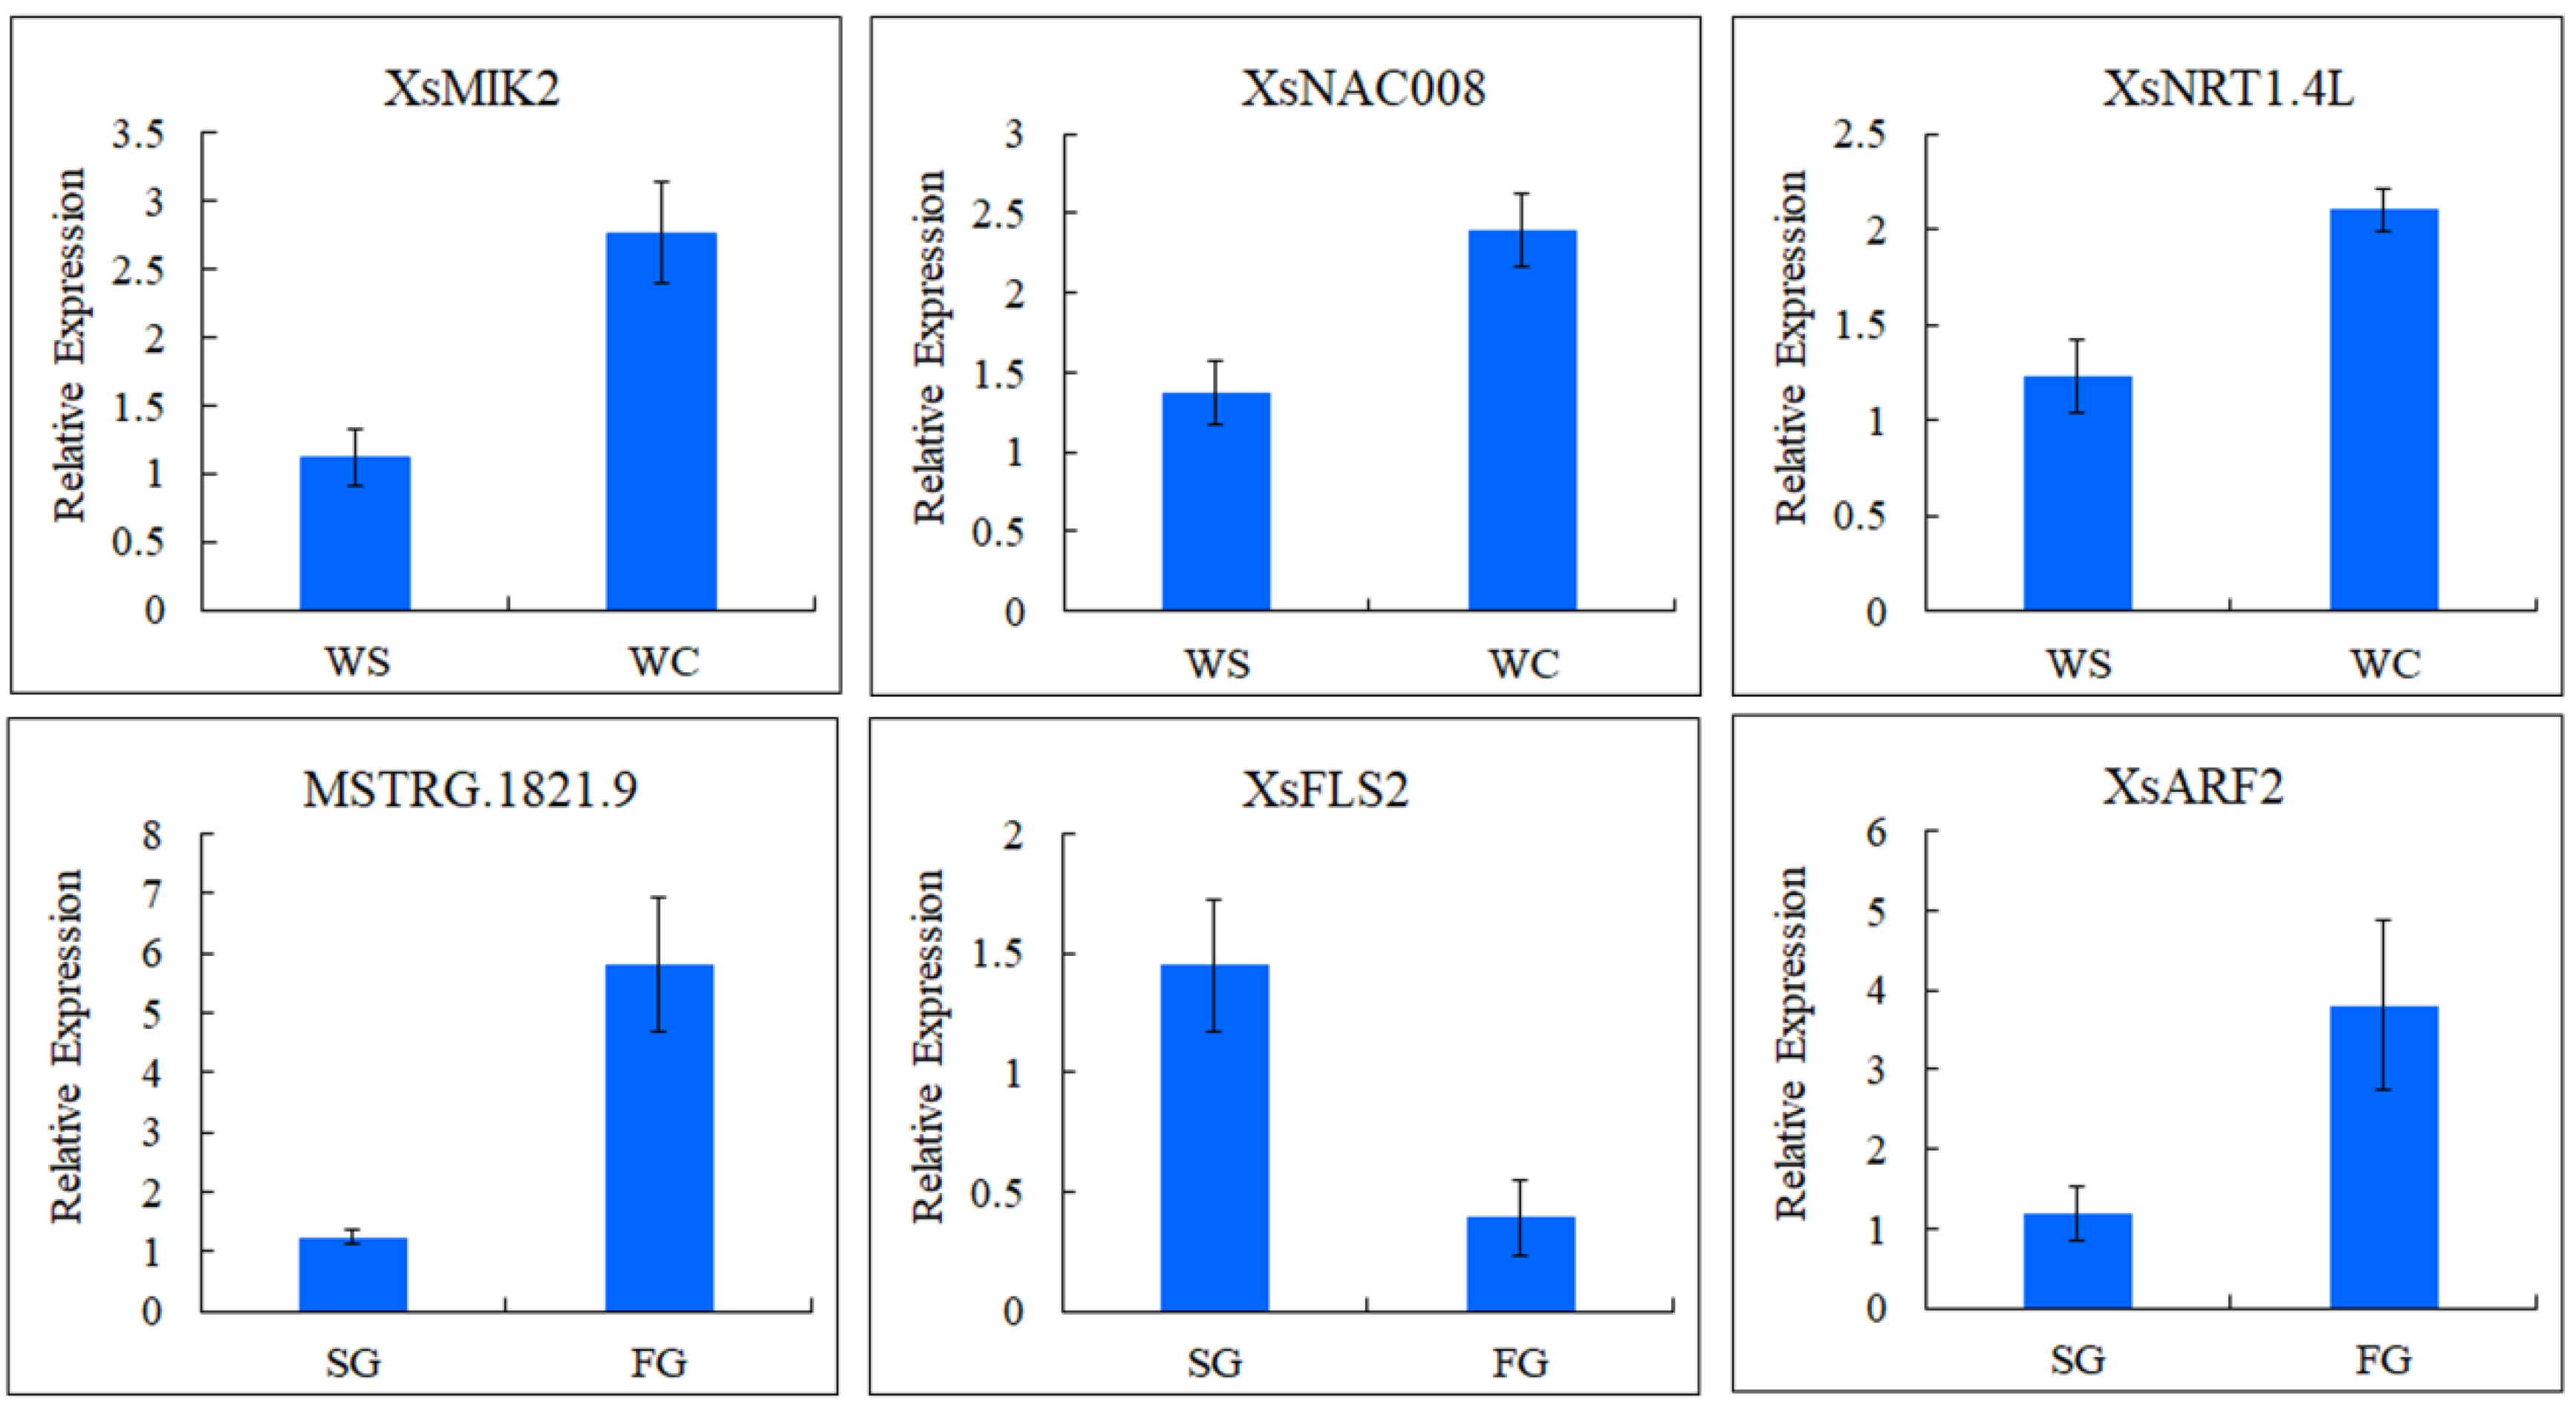
2.6. qRT-PCR Analysis

The reverse transcription assay of the total RNAs was performed using the PrimeScript first-strand cDNA synthesis kit (Takara, Dalian, China). A qRT-PCR was performed with 4 ng μL−1 cDNA using the UltraSYBR Mixture (SYBR Green I) (Takara, Dalian, China) in an ABI7500 qRT-PCR system, according to the manufacturer’s instructions. The 2−△△CT method was used to calculate the relative expression levels of genes, XsACTIN was used as the internal reference. The qRT-PCR primers are listed in Supplemental Table S4.

3. Results

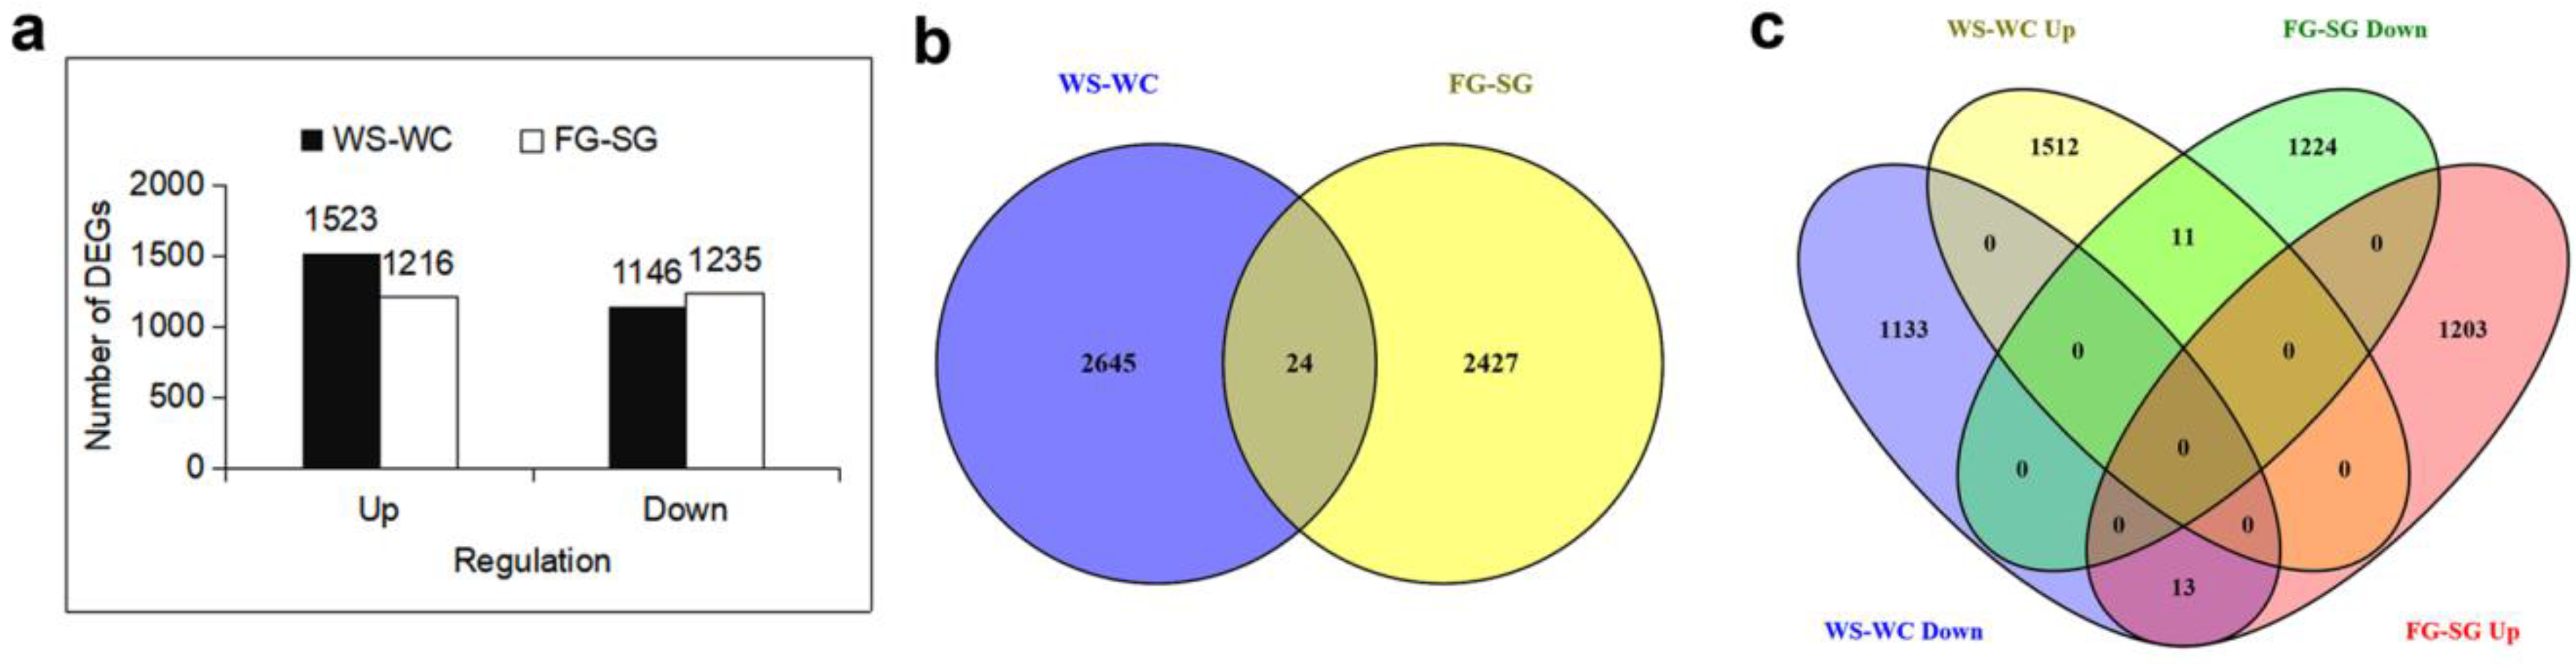
3.1. Identification of DEGs in the Four Types of Yellowhorn under Drought Conditions

To analyze the drought-responsive transcriptome in yellowhorn, ten RNA samples from the leaves of four types of yellowhorn (WSFG, WCFG, WSSG, and WCSG) with different WUEs and growth indexes (increment of diameter) were sequenced. After quality control and cleaning, 42.58 to 61.51 million clean reads were generated for each sample. The genome map rates of each sample ranged from 92.09 to 95.52% (Supplemental Table S2). In total, we identified 2669 DEGs between the water-saving (WS) and water-consuming (WC) samples upon drought stress, with 1523 upregulated and 1146 downregulated, and 2128 of them were matched to the reference genome. In addition, a total of 2451 DEGs between the fast-growing (FG) and slow-growing (SG) samples were identified, with 1216 upregulated and 1235 downregulated, and 1846 of them were matched to the reference genome (Figure 1a). There were 2645 and 2427 DEGs specifically in the WS-WC and FG-SG comparison in response to drought stress, respectively, and 24 overlapping DEGs between WS-WC and FG-SG (Figure 1b). There were 1512 upregulated and 1133 downregulated DEGs expressed in WS-WC, and 1224 downregulated and 1203 upregulated DEGs expressed in FG-SG. Eleven DEGs that were upregulated in WS-WC and downregulated in FG-SG, and 13 DEGs that were upregulated in FG-SG and downregulated in WS-WC, showed the opposite tendency, while no DEGs shared a common tendency for expression changes between the comparison of WS-WC and FG-SG (Figure 1c).

3.2. GO Enrichment Analysis of DEGs

To obtain insight into the functional categories of the DEGs in the water-saving and fast-growing yellowhorn, a GO enrichment analysis was performed. The WS-WC DEGs were mainly enriched in the biological processes (BPs), including cell wall biogenesis and biosynthetic processes (cell wall biogenesis, plant-type secondary cell wall biogenesis, cell wall polysaccharide and macromolecule biosynthetic processes, and glucuronoxylan and xylan biosynthetic processes), metabolic processes (macromolecules, protein, and nitrogen), and the regulation of anion transport, while FG-SG DEGs were mainly related to microtubule regulation processes (microtubule polymerization or depolymerization and microtubule cytoskeleton organization), inositol phosphate/hexakisphosphate biosynthetic and metabolic processes, transmembrane transport, and sugar metabolic processes (D-xylose, pentose, and polyol) (Figure 2a,b). These GO-BP terms in WS-WC and FG-SG suggest that there are some different biological processes regulating the WUE and growth of yellowhorn under long-term drought conditions.
In addition, the GO-BP enrichment terms of the overlapping DEGs between WS-WC and FG-SG were the NADP (nicotinamide adenine dinucleotide phosphate) metabolic process, carbohydrate metabolic processes (such as pentose-phosphate and polyol), protein-related processes (such as protein geranylgeranylation), and IAA (indole-3-acetic acid) biosynthetic and metabolic processes (Figure 2c). The processes enriched by the overlapping DEGs may have important biological significance in balancing the growth and water-saving capacity of yellowhorn under long-term drought conditions.

3.3. Pathway Enrichment Analysis of DEGs

In order to compare and summarize the pathways of WS-WC and FG-SG under drought stress, the DEGs were mapped to a KEGG database. As a result, there were seven and six pathways significantly enriched (p-value < 0.05) in WS-WC and FG-SG, respectively. The pathways of pantothenate and CoA biosyntheses, and the alpha-linolenic acid metabolism were enriched by the DEGs in WS-WC, while inositol phosphate metabolism and the phosphatidylinositol signaling system were enriched by the DEGs in FG-SG (Table 1). However, in addition to the autophagy and spliceosome pathways, there was no other pathway enriched by the overlapping DEGs between WS-WC and FG-SG (Table 1).

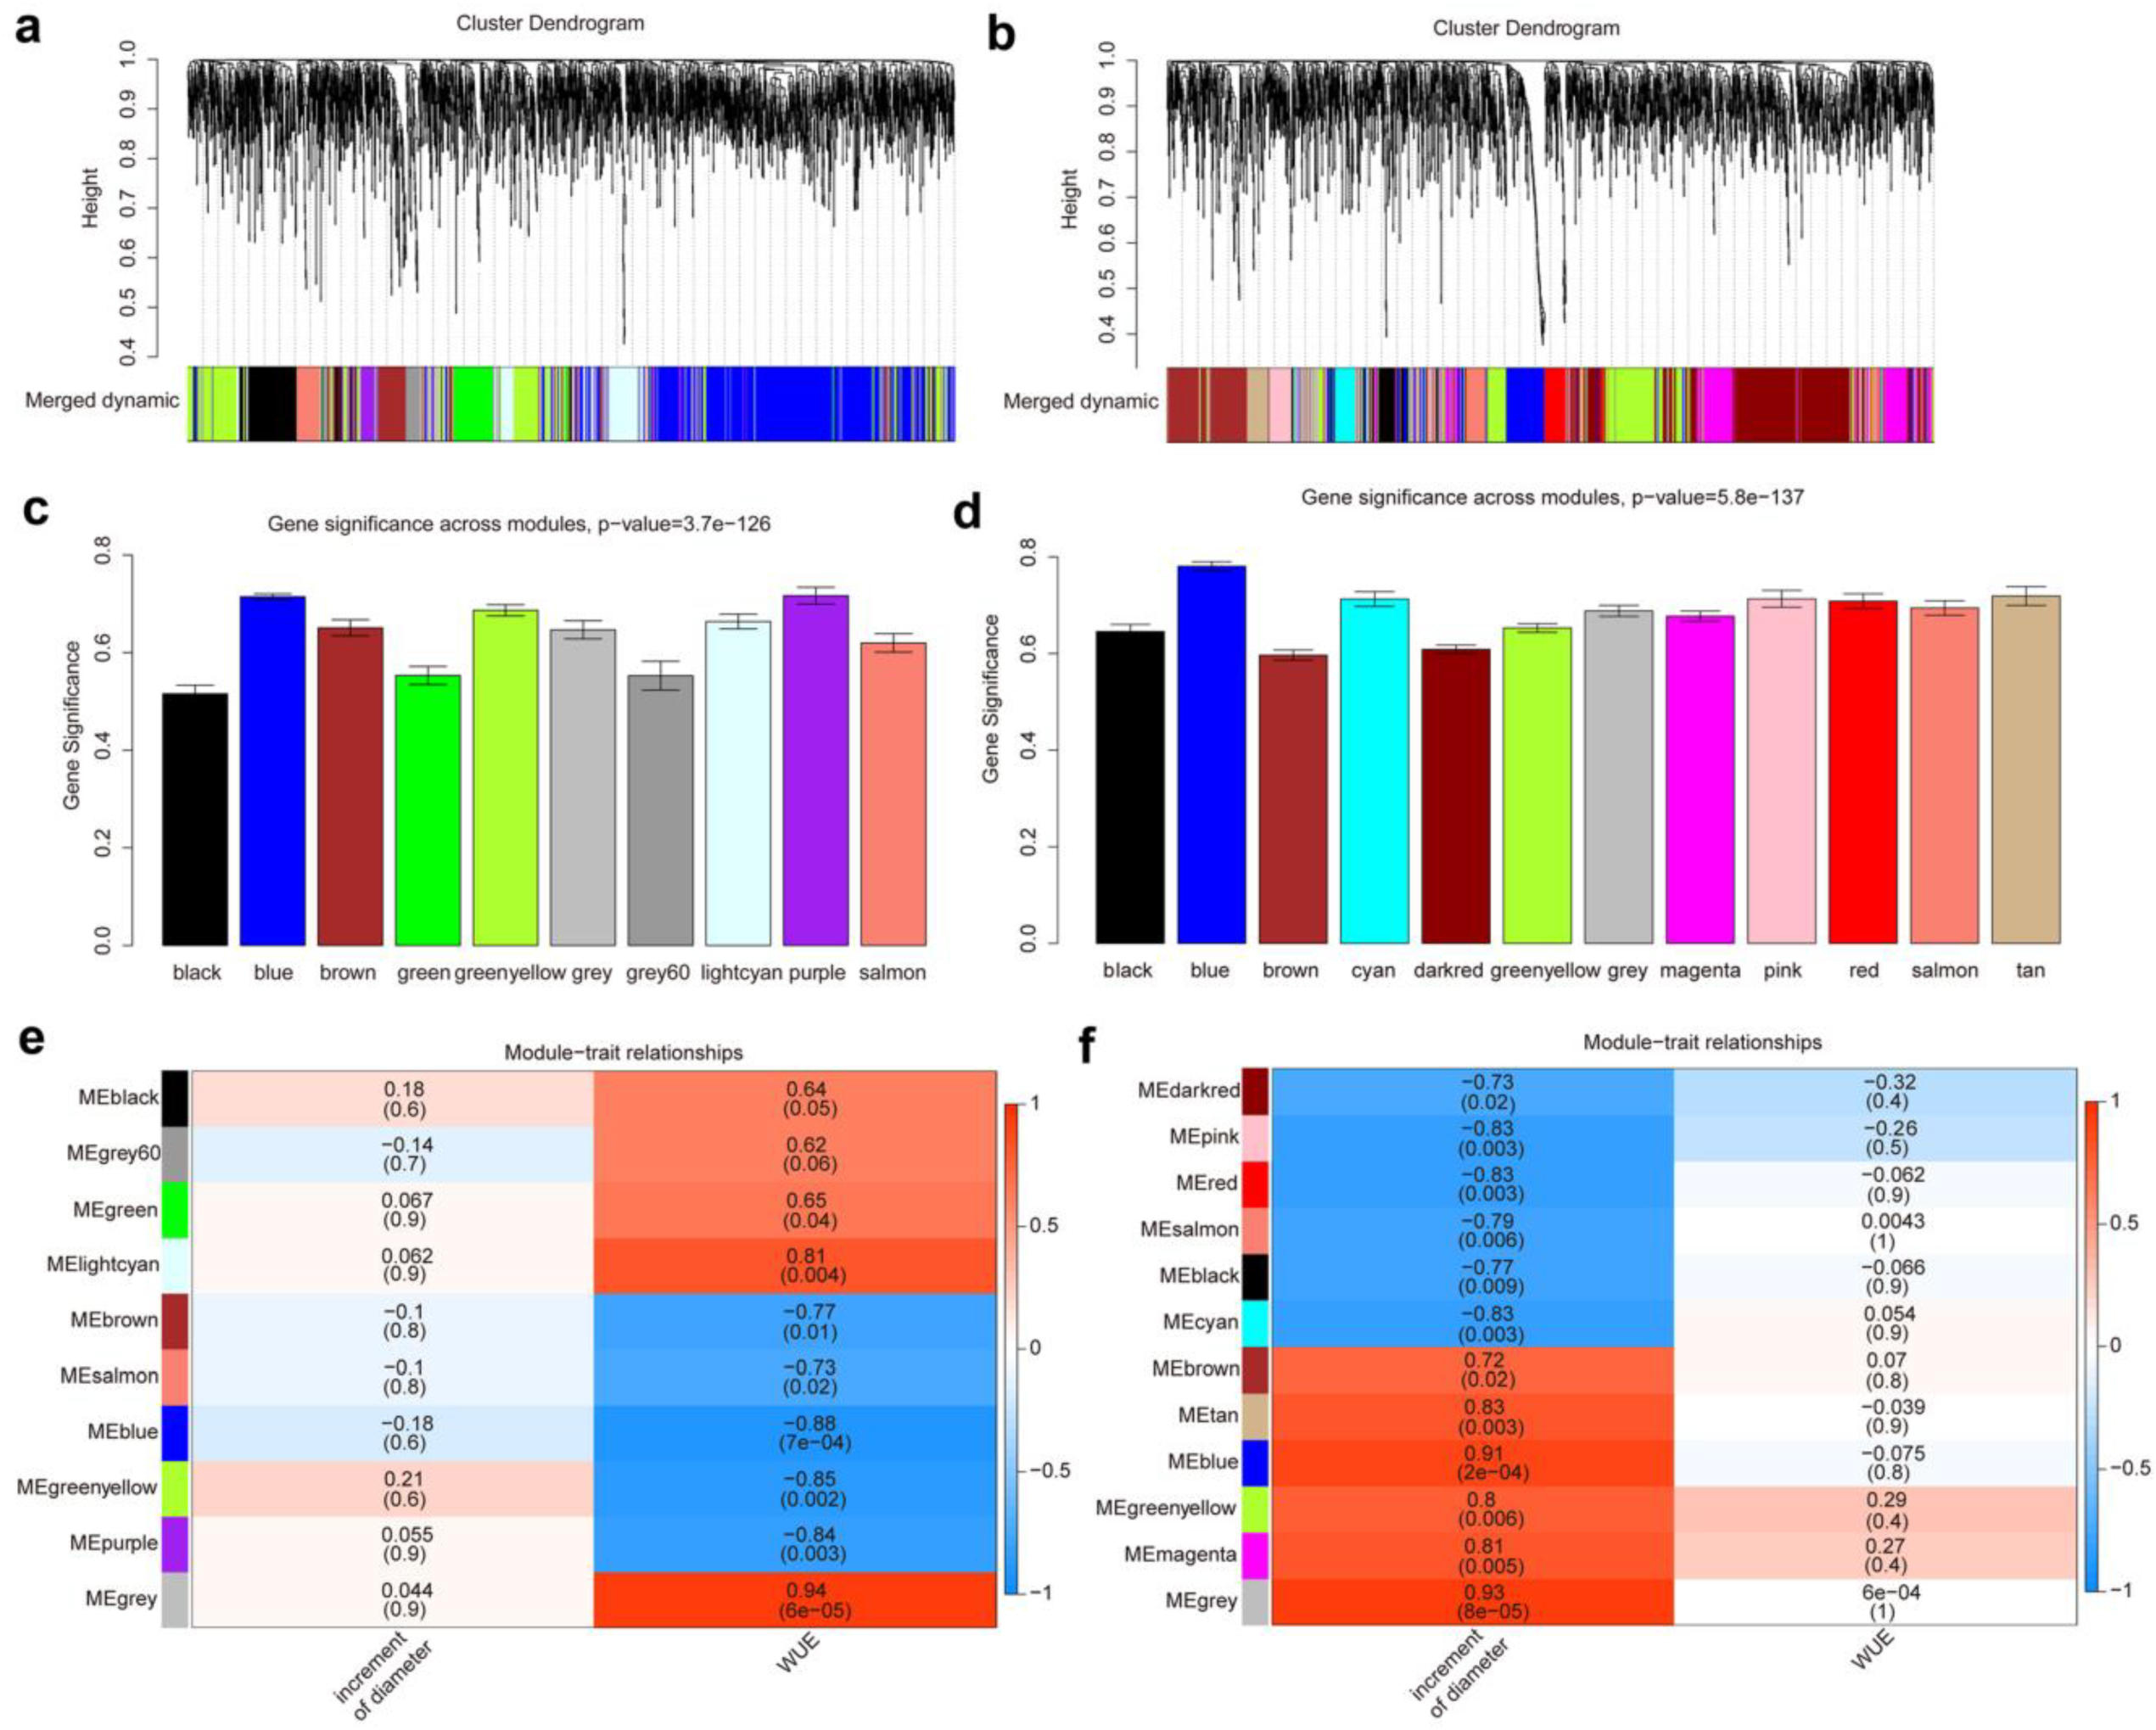
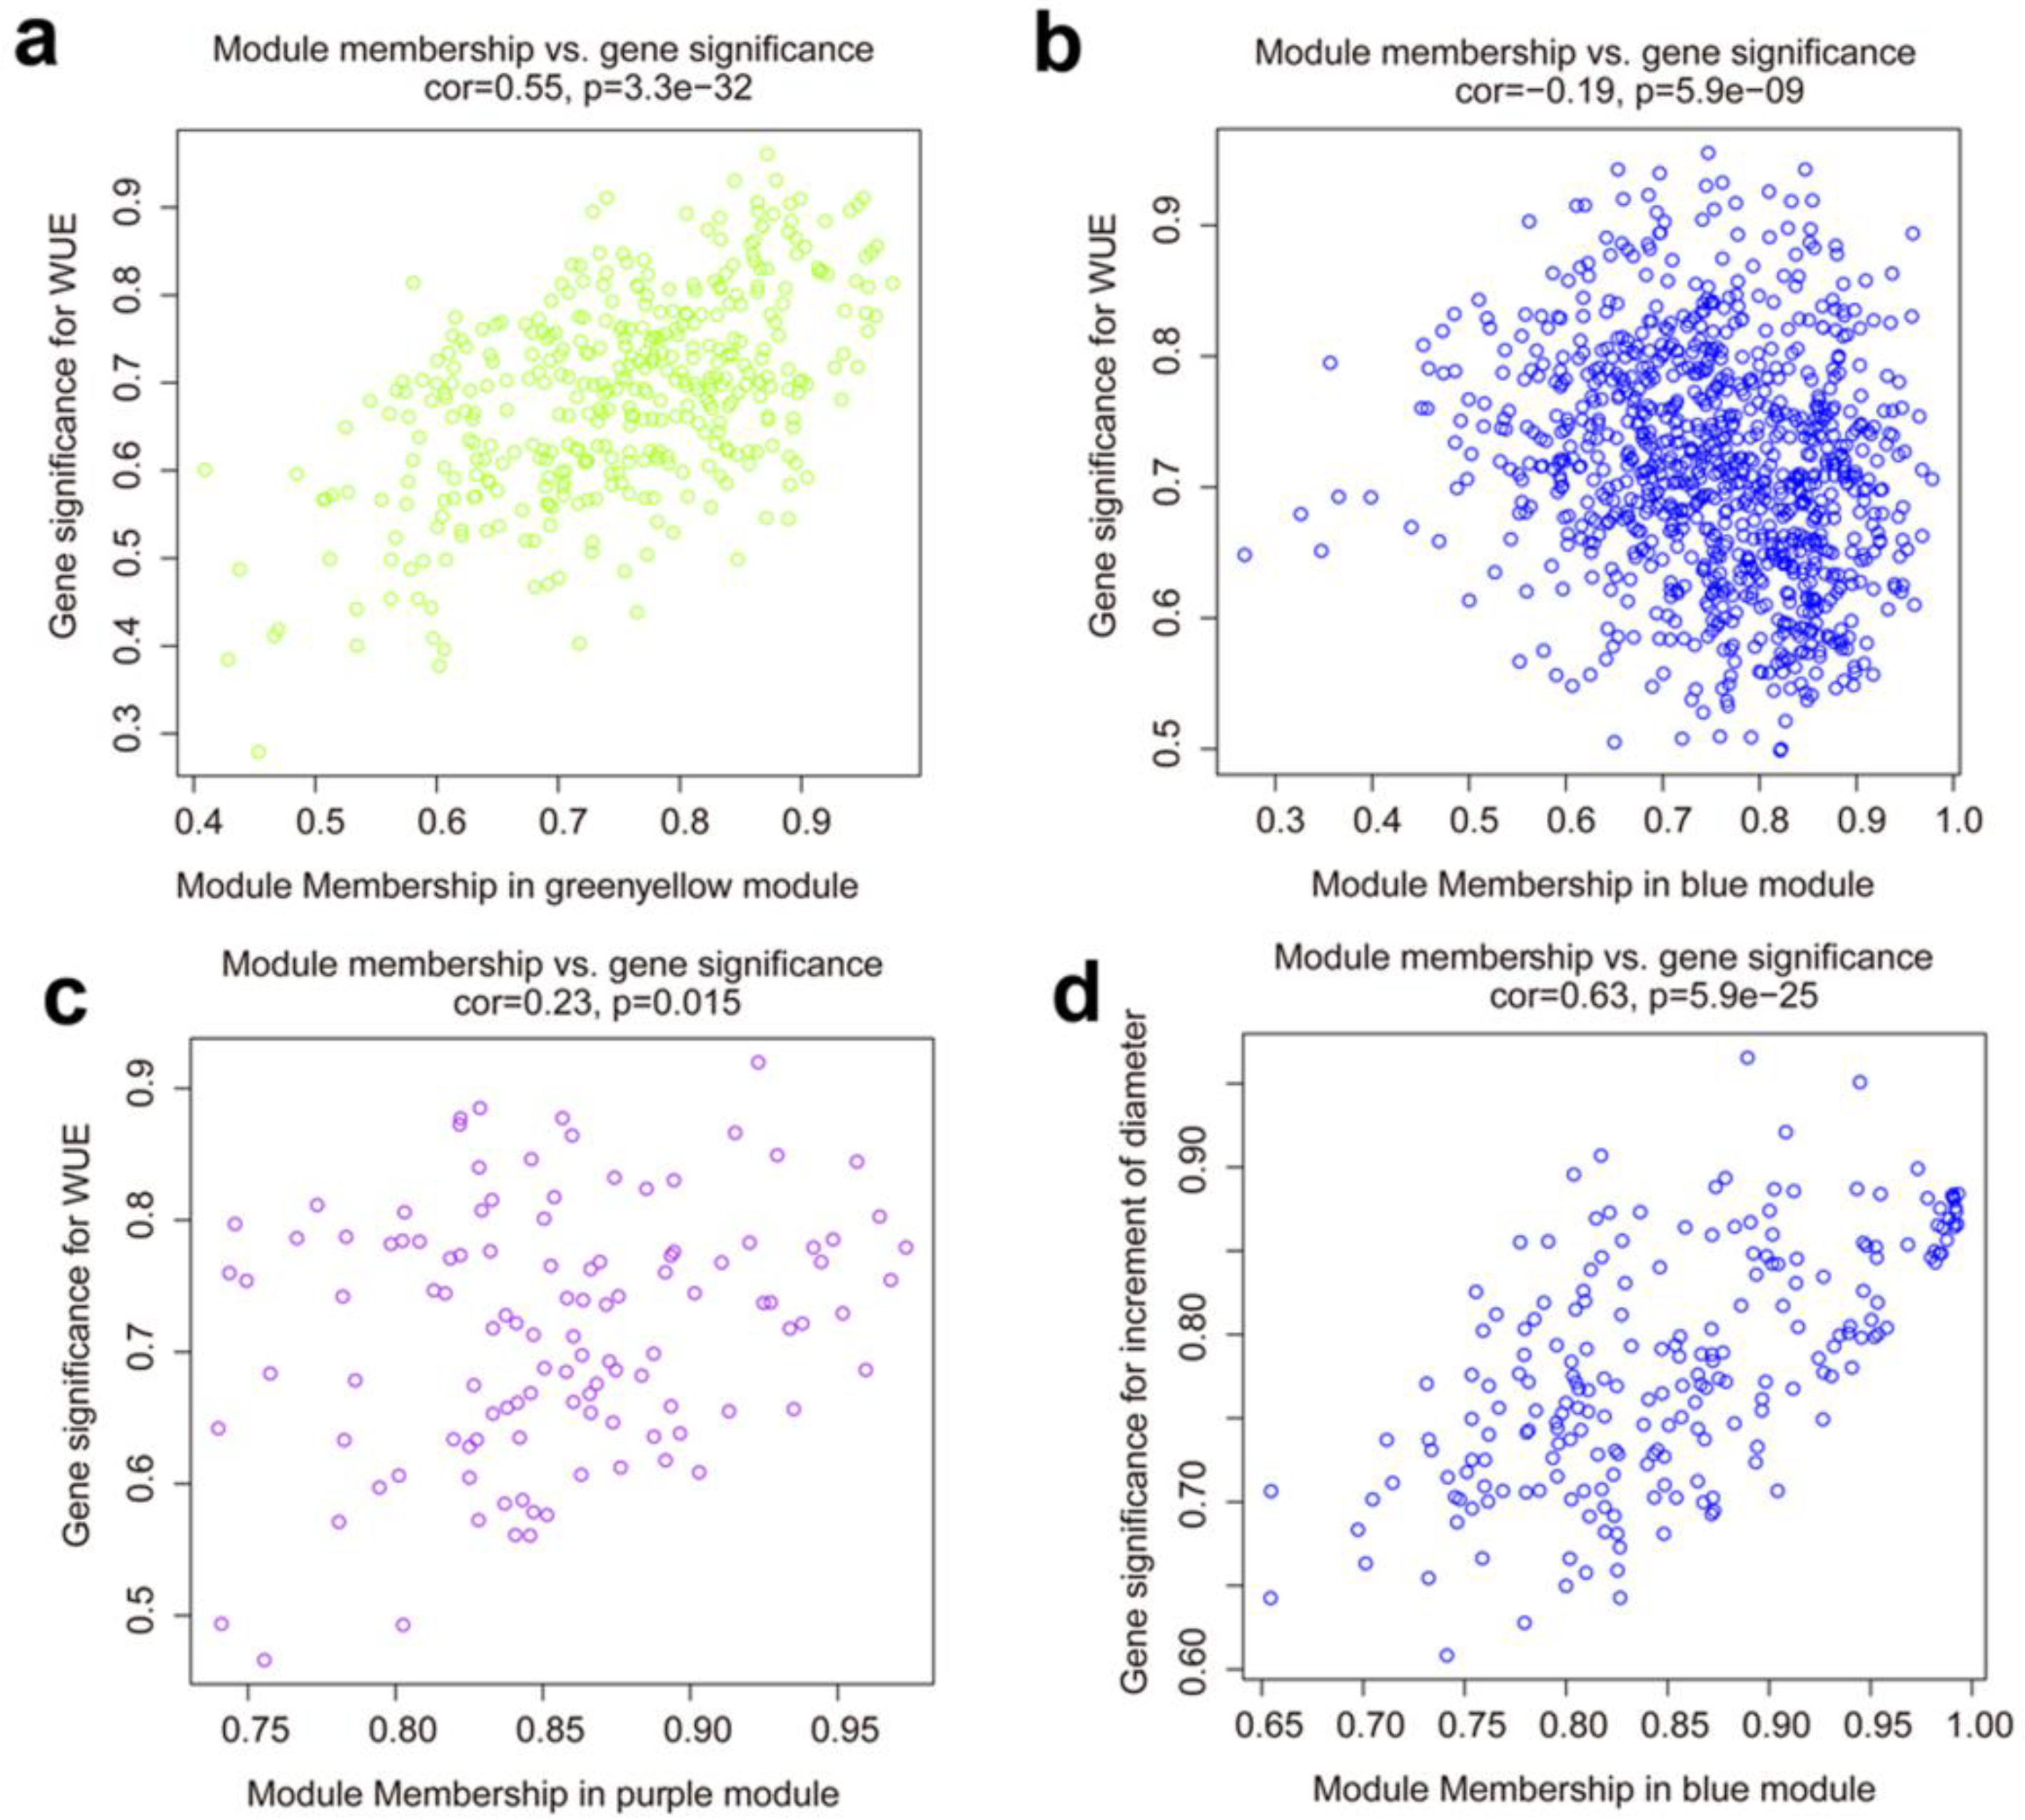
3.4. Co-Expression Network and Hub Genes Associated with the WUE and Growth under Drought Conditions

The gene expression profiles of yellowhorn in response to drought stress were examined using WGCNA to detect the gene regulatory network and hub genes potentially involved in the regulation of the WUE and growth (increment of diameter). After removing the DEGs with too many missing values (>70% missing), 2640 and 2451 DEGs were separately used to construct the co-expression networks. The genes were partitioned into ten and twelve co-expression modules according to the expression levels, respectively (Figure 3a,b). Then, the GS of traits in these modules, as well as the correlation coefficient between the module eigengenes (MEs) and traits were used to examine the relationship between each module and the traits of the WUE and increments in diameter. As a result, the GS value of three modules (blue, greenyellow, and purple) related to WUE, and that of the blue module related to the increments in diameter, were higher than those of any other modules (Figure 3c,d). Meanwhile, in addition to the dummy gray module, the ME of these four modules showed a higher correlation with the WUE or increments in diameter than the other modules, respectively (Figure 3e,f). Taken together, these results indicated that the blue (924 genes), greenyellow (390 genes), and purple (112 genes) modules were more relevant to WUE, and the blue module (213 genes) was more relevant to the increments in diameter under drought conditions. In addition, the correlation between the genes and WUE in the greenyellow module was 0.55 (Figure 4a), which was higher than that in the blue (−0.19) and purple (0.23) modules (Figure 4b,c). Meanwhile, the correlation between the genes and the increments of diameter in the blue module was 0.66, demonstrating that the genes in this module were significantly associated with the increments in diameter (Figure 4d). Therefore, the greenyellow (related to WUE) and blue (related to the increment in diameter) modules were selected for the subsequent analysis.
GO and KEGG enrichment analyses were carried out to investigate the functional categories of the DEGs in the greenyellow and blue modules. Based on the GO analysis, the greenyellow module genes related to WUE were involved in the BPs, such as cell wall components (xylan, hemicellulose, and glucuronoxylan), nitrogen (amide, organonitrogen, and nitrogen compounds), and peptide metabolic and biosynthetic processes, while the blue module genes related to the increment in diameter in the BPs were mainly related to the peroxisome and proton-transporting ATP synthase complex (Figure 5). The KEGG pathway analysis results showed that ubiquinone and other terpenoid-quinone biosynthesis genes were enriched in the greenyellow module related to WUE, while in the blue module, genes related to the increment in diameter and riboflavin metabolism were enriched (Table 2).
Hub genes within the modules, referring to the genes with a high KME, can be considered to play critical roles in the WUE and growth index (the increment in diameter) under drought stress. Excluding the genes not mapped to the genome, 31 and 35 genes (KME > 0.9) in the greenyellow and blue modules were selected as candidate hub genes, respectively (Supplemental Table S3). Then, 31 genes in the greenyellow module related to WUE, consisting of 31 nodes and 159 edges (Figure 6a), and 35 genes in the blue module related to the increment in diameter, consisting of 35 nodes and 530 edges (Figure 6b), were used to construct two co-expression networks. In the co-expression network associated with WUE, phosphatidylinositol/phosphatidylcholine transfer protein SFH9 (EVM0002865.1), two protein kinases (LRR receptor-like serine/threonine-protein kinase MIK2 (MSTRG.6225.1) and serine/threonine-protein kinase D6PKL2 (MSTRG.9513.1)), S-acyltransferase 22 (MSTRG.18351.2), and transcription factor NAC008 (MSTRG.20828.1) were highly connected within the greenyellow module (Figure 6a and Supplemental Table S3). Meanwhile, five protein kinases (G-type lectin S-receptor-like serine/threonine-protein kinase At4g03230-like (MSTRG.1821.9, MSTRG.1821.14 and MSTRG.1821.12) and two LRR receptor-like serine/threonine protein kinases, FLS2 (MSTRG.12443.3) and At1g06840-like (MSTRG.6266.3)), and phosphatase inhibitor 2 (MSTRG.5951.3) were found in the co-expression network of the hub genes in the blue module associated with the increments in diameter (Figure 6b and Supplemental Table S3). These findings indicate that the serine/threonine protein kinases play important roles in regulating the WUE and growth of yellowhorn under drought stress. In addition, auxin response factor 2 (ARF2; EVM0005533.1), inositol 1,4,5-trisphosphate 5-phosphatase 1 (MSTRG.13147.2), and cytochrome P450 CYP72A219 (MSTRG.8341.2) were also connected with the increment in diameter, suggesting that the auxin and inositol polyphosphate signal pathways and redox process may regulate yellowhorn growth under drought conditions.
To validate the accuracy of the transcriptome data, six hub genes related to the WUE and increment in diameter were selected for qRT-PCR analysis. The relative expression levels of XsMIK2, XsNAC008, and XsNRT1.4L decreased in WS type yellowhorn, and those of MSTRG.1821.9 and XsARF2 decreased in SG type yellowhorn, while those of XsFLS2 increased in SG type yellowhorn (Figure 7). These results exhibited similar expression patterns to the results of RNA-Seq.

4. Discussion

Climate change, such as global warming, which causes high temperatures and scarce rainfall, will create increasingly extreme and prolonged droughts [18]. Yellowhorn is one of the key woody oil plants in China, but it often faces serious drought stress due to its cultivation region. In this study, the transcriptome analysis based on the comparative transcriptome data and WGCNA is a first attempt to understand the key players and potential molecular mechanisms underlying the differences in drought resistance among different cultivars of yellowhorn.
We classified four types of yellowhorn (WSFG, WCFG, WSSG, and WCSG) under long-term drought conditions as WS/WC type or FG/SG type, according to a single variable, respectively. These two comparisons associated with the WUE and growth index (the increment in diameter) were used to perform the comparative transcriptome analyses. A total of 2669 and 2451 DEGs were identified in WS-WC and FG-SG, respectively, and 24 overlapping DEGs were identified between WS-WC and FG-SG (Figure 1), suggesting that they may contribute to regulating the WUE and growth of yellowhorn under long-term drought conditions.

4.1. Sugar and Nitrogen Metabolic and Biosynthetic Processes

When plants respond to drought, various biochemical and physiological processes are induced, such as the induction of stress proteins and the accumulation of various metabolites for the protection of cells from water deficit stress [19,20]. The sugar (such as sucrose and trehalose) and nitrogen metabolic processes are widely identified as maintaining cell osmotic potential, ensuring the supply of carbohydrates and regulating growth during drought stress [20,21,22,23]. Consistently, the organonitrogen compound metabolism process was enriched in WS-WC, as were sugar (D-xylose, pentose, and polyol) metabolism processes in FG-SG, which may be involved in tolerance to drought in yellowhorn (Figure 2). On the other hand, the GO terms of pentose-phosphate and polyol metabolic processes enriched in the overlapping DEGs between WS-WC and FG-SG imply that these processes may affect the tolerance to drought by regulating the WUE and growth of yellowhorn (Figure 2c).
Furthermore, the GO analysis further revealed the nitrogen (amide, organonitrogen, and nitrogen compound) metabolic and biosynthetic processes as the obvious enriched pathway of DEGs in the greenyellow module that was highly associated with WUE (Figure 5a). In the greenyellow module, nitrate transporter 1.4-like (NRT1.4L) (EVM0008747.1) was highly connected with WUE (Supplemental Table S3) and had a higher expression level in WC type trees than that in WS type trees. In Arabidopsis, a large portion of nitrate transporter 1s (NRT1s) are involved in plant abiotic stress tolerance. Among them, AtNRT1.1 was demonstrated to function in drought tolerance via regulating stomatal aperture and transpiration rates, and AtNRT1.2 functions as an ABA importer to regulate the stomatal aperture [24]. This suggests that NRT1.4L may link nitrogen and ABA signals to regulate the stomatal aperture and WUE to affect drought resistance of yellowhorn. Meanwhile, the co-expressed network of key genes in the greenyellow module identified three genes, S-acyltransferase 22 (MSTRG.18351.2), WD-40 repeat-containing protein MSI4 (EVM0022037.1), and NAC008 (MSTRG.20828.1), which showed relevance to NRT1.4L and all had higher expression levels in WC type trees than those in WS type trees (Figure 6). These genes may negatively regulate drought resistance through NRT1.4L-mediated nitrate signaling in yellowhorn.

4.2. Cell Wall- and Microtubule-Related Processes

Some cell structures are also involved in drought responses, such as the cell wall and microtubules. Several studies have indicated that the composition and structure of the cell wall play important roles for plants to adapt to abiotic stresses, for example, the tightening and loosening of the cell wall, as well as the abundance of xyloglucan and pectinain in the cell wall [25,26]. Plant microtubules have been proven to participate in regulating the plant stomatal movement, cell wall construction, and ABA accumulation [27,28], which are vital parts of the drought stress response. Our GO results demonstrated that the cell wall components’ (especially xylan) biosynthetic processes were significantly enriched in WS-WC, suggesting that the xylan content of the cell wall is closely related to WUE in yellowhorn. Moreover, in the GO analysis for FG-SG, the microtubule polymerization or depolymerization processes were highly enriched (Figure 2), indicating that the morphology of microtubules may regulate the drought stress response via the stomatal movement and ABA content in long-term drought conditions for yellowhorn.

4.3. Antioxidant Metabolic Processes

The overproduction of ROS is induced by drought stress, which damages the cellular components comprising cell membranes, proteins and lipids, and leads to cell death [29]. Excessive amounts of ROS are scavenged by enzymatic (such as CAT, SOD, and dehydroascorbate reductase (NADH)) and non-enzymatic (such as flavonoids, reduced glutathione, and ascorbic acid) defense mechanisms in plants, and a large number of genes, including MYB and bZIP transcription factors, as well as MAPK and CDPK kinases, have been confirmed to be involved in the oxidative defense process [13,29]. Drought tolerance in plants can be influenced by modifications in antioxidant enzyme metabolism. Based on GO-BP enrichment terms, the NADP metabolic process was enriched by the overlapping DEGs between WS-WC and FG-SG (Figure 2c), and peroxisome relative processes were enriched by the blue module genes associated with the increment in diameter (Figure 5b). These findings suggest that the antioxidant defense processes play vital roles in resistance to drought stress in yellowhorn. Meanwhile, two cytochrome P450 genes (EVM0008060.1 and MSTRG.8341.2) that participate in the redox process of substrates in plants [30] were connected with WUE and the increment in diameter, respectively (Supplemental Table S3).

4.4. IAA Biosynthetic and Metabolic Processes

IAA biosynthetic and metabolic processes, which play an important role in regulating root system growth [31], were enriched in the overlapped DEGs between WS-WC and FG-SG (Figure 2c), implying that IAA could regulate drought tolerance via root growth and WUE. Meanwhile, ARF2 in the blue module was highly connected with the growth index (the increments in diameter), and had a higher expression level in FG type trees than that in SG type trees (Figure 6). A previous study has shown that ARF2 in Arabidopsis is a negative regulator in the ABA response pathway, which has crosstalk with auxin signaling in regulating primary root growth [32]. There is a possibility that ARF2 in yellowhorn positively regulates root growth via the ABA and auxin signaling pathway. WGCNA revealed that it was co-expressed with G-type lectin S-receptor-like serine/threonine protein kinase (MSTRG.1821.9) and phosphatase inhibitor 2 (MSTRG.5951.3; Supplemental Table S3 and Figure 7), suggesting that phosphorylation modification may regulate the function of ARF2 during drought response in yellowhorn. These three genes may positively co-regulate the growth of yellowhorn via the ABA and IAA signal pathways in response to drought.

4.5. Phosphatidylinositol-Related Processes

In addition, based on the GO and KEGG results in FG-SG, the inositol phosphate/hexakisphosphate biosynthetic and metabolic processes, as well as the phosphatidylinositol signaling system, were also enriched (Figure 2 and Table 1). Phosphoinositides (PIs), derived from phosphatidylinositol by phosphorylation, are regulatory lipids that function in signal transduction and mediate numerous physiological processes, such as the regulation of gene expression and ion channel gating, and the responses to biotic and abiotic stresses [33,34]. In particular, myo-inositol hexakisphosphate (InsP6), acting as a second messenger, was shown to be increased in response to ABA, and the mutants in Arabidopsis that increase the InsP6 content decrease the tolerance to water stress [34,35]. In this study, SFH9 in the greenyellow module and inositol 1,4,5-trisphosphate 5-phosphatase 1 in the blue module exhibited a high connection with WUE and the increments in diameter, respectively, under long-term drought conditions (Supplemental Table S3), suggesting that phosphatidylinositol signaling may be implicated in the response to drought stress in yellowhorn. The higher expression level of inositol 1,4,5-trisphosphate 5-phosphatase 1 in FG type trees than that in SG type trees may promote InsP6 accumulation to effect ABA signaling and drought response. Three genes whose expression levels were relative to SFH9, including U-box domain-containing protein 6-like (EVM0012147.1), inactive leucine-rich repeat receptor-like protein kinase (EVM0014902.1), and copper amine oxidase (MSTRG.3896.8), exhibited opposite expression changes in FG-SG, suggesting that they had antagonistic effects on the regulation of drought response. Moreover, two G-type lectin S-receptor-like serine/threonine protein kinase At4g03230-likes (MSTRG.1821.9 and MSTRG.1821.14), co-expressed with inositol 1,4,5-trisphosphate 5-phosphatase 1 (Figure 6), which had the same expression change in FG-SG, may cooperatively function in drought response via the phosphatidylinositol signaling pathway.

4.6. Phosphorylation/Dephosphorylation Modification

Protein phosphorylation/dephosphorylation was found to be critical in response to drought stress, and a great deal of protein kinases and phosphatases were identified [13]. For example, SnRK2s, the vital regulator of ABA signaling, can phosphorylate the proteins involved in drought stress, such as abscisic acid-responsive element binding factor (ABI5/ABF) transcription factors and the anion channel SLAC1 [13,36]. Additionally, some CDPKs and MAPKs have also been reported to phosphorylate drought-responsive proteins, including ABFs, SLAC1, WRKY59 and catalase 1 (CAT1), to regulate stomatal movement and ABA signaling, thereby affecting the tolerance to drought [12,13]. In this study, four protein kinases (three LRR receptor-like serine/threonine protein kinases MIK2, FLS2, and At1g06840-like, and serine/threonine protein kinase D6PKL2), which were highly connected within the greenyellow or blue module and were downregulated in FG or WS type yellowhorn, were predicted to negatively regulate the drought tolerance of yellowhorn (Supplemental Table S3 and Figure 6). On the contrary, three G-type lectin S-receptor-like serine/threonine protein kinase At4g03230-likes and one phosphatase inhibitor 2 that were highly connected with the increment in diameter were upregulated in FG type yellowhorn, implying that they may positively regulate the drought tolerance of yellowhorn (Supplemental Table S3 and Figure 6). Moreover, five protein kinases and one phosphatase inhibitor 2 in the blue module were co-expressed with each other (Figure 6), implying that they may co-regulate the growth of yellowhorn in response to drought stress. In addition, WGCNA revealed their highly co-expressed genes in clusters (Figure 6), which may constitute a regulatory network to regulate drought tolerance. These findings indicate that phosphorylation plays an important role in the molecular mechanism regulating the WUE and growth of yellowhorn under long-term drought conditions.

5. Conclusions

We found the co-expressed networks, pathways, and hub genes that were related to two parameters (WUE and growth (the increment in diameter)) of drought resistance from the transcriptome datasets of four types of yellowhorn under long-term drought conditions. GO and KEGG analyses indicated nitrogen and cell wall components’ (xylan) biosynthetic and metabolic processes as key pathways involved in the WUE regulation, while sugar (D-xylose and polyol), microtubule, and phosphatidylinositol biological and metabolic processes were key pathways involved in the growth regulation. The IAA biosynthetic and metabolic processes and NADP metabolic process may regulate drought tolerance by changing the WUE and growth state. Furthermore, two co-expressed network analyses pinpointed several hub genes, including seven protein kinases, NAC008, ARF2, NRT1.4L, and phosphoinositide-related phosphatase, which may be key regulators of drought tolerance in yellowhorn.

Supplementary Materials

The following are available online at https://www.mdpi.com/1999-4907/11/8/840/s1, Table S1: Selected attributes of analyzed yellowhorn samples, Figure S1: PCA analysis of transcriptomes of four yellowhorn ecotypes, Table S2: The number of clean reads mapped to genomes of four types of yellowhorn, Table S3: Annotation and reference genes of hub genes in greenyellow and blue modules.

Author Contributions

L.W. and X.L. designed the experiments; X.L., Y.C., Z.W., and Y.Z. analyzed the data; X.H., S.Y., and Q.B. performed the experiments and identified four types of yellowhorn; X.L. wrote the manuscript; L.W. and X.L. revised the manuscript. All authors have read and agreed to the published version of the manuscript.

Funding

This work was financially supported by the National Natural Science Foundation of China (31901348 and 31800571).

Conflicts of Interest

The authors declare no conflict of interest.

References

  1. Wang, Q.; Yang, L.; Ranjitkar, S.; Wang, J.J.; Wang, X.R.; Zhang, D.X.; Wang, Z.Y.; Huang, Y.Z.; Zhou, Y.M.; Deng, Z.X.; et al. Distribution and in situ conservation of a relic Chinese oil woody species yellowhorn Xanthoceras sorbifolium Bunge. Can. J. For. Res. 2017, 47, 1450–1456. [Google Scholar] [CrossRef]
  2. Yu, H.; Fan, S.; Bi, Q.; Wang, S.; Hu, X.; Chen, M.; Wang, L. Seed morphology, oil content and fatty acid composition variability assessment in yellow horn (Xanthoceras sorbifolium Bunge) germplasm for optimum biodiesel production. Ind. Crops Prod. 2017, 97, 425–430. [Google Scholar] [CrossRef]
  3. Venegas-Calerón, M.; Ruíz-Méndez, M.V.; Martínez-Force, E.; Garcés, R.; Salas, J.J. Characterization of Xanthoceras sorbifolium Bunge seeds: Lipids, proteins and saponins content. Ind. Crops Prod. 2017, 109, 192–198. [Google Scholar] [CrossRef] [Green Version]
  4. Ruan, C.J.; Yan, R.; Wang, B.X.; Mopper, S.; Guan, W.K.; Zhang, J. The importance of yellow horn (Xanthoceras sorbifolium) for restoration of arid habitats and production of bioactive seed oils. Ecol. Eng. 2017, 99, 504–512. [Google Scholar] [CrossRef]
  5. Xie, Z.Y.; Zhang, W.H. Effects of drought and rewatering on growth and photosynthetic physioecological characteristics of Xanthoceras Sorbifolia. Chin. J. Appl. Ecol. 2018, 29, 1759–1767. [Google Scholar]
  6. Jin, H.; Zou, J.; Li, L.; Bai, X.; Zhu, T.; Li, J.; Xu, B.; Wang, Z. Physiological responses of yellowhorn seedlings to high temperatures under drought condition. Plant Biotechnol. Rep. 2019, 14, 111–120. [Google Scholar] [CrossRef]
  7. Basu, S.; Ramegowda, V.; Kumar, A.; Pereira, A. Plant adaptation to drought stress. F1000Research 2016, 5, 1554. [Google Scholar] [CrossRef] [PubMed]
  8. Lu, K.; Chen, N.; Zhang, C.; Dong, X.; Zhao, C. Drought enhances the role of competition in mediating the relationship between tree growth and climate in semi-arid areas of northwest China. Forests 2019, 10, 804. [Google Scholar] [CrossRef] [Green Version]
  9. Honda, M.D.; Ishihara, K.L.; Pham, D.T.; Borthakur, D. Identification of drought-induced genes in giant leucaena (Leucaena leucocephala subsp. glabrata). Trees 2018, 32, 571–585. [Google Scholar] [CrossRef]
  10. Shinozaki, K.; Yamaguchi-Shinozaki, K. Gene networks involved in drought stress response and tolerance. J. Exp. Bot. 2007, 58, 221–227. [Google Scholar]
  11. Ma, J.; Li, R.Q.; Wang, H.G.; Li, D.X.; Wang, X.Y.; Zhang, Y.C.; Zhen, W.C.; Duane, H.J.; Yan, G.J.; Li, Y.M. Transcriptomics analyses reveal wheat responses to drought stress during reproductive stages under field conditions. Front. Plant Sci. 2017, 8, 592. [Google Scholar] [CrossRef] [PubMed] [Green Version]
  12. Min, Y.X.; Hou, S.W. Research progress of protein phosphorylation under abiotic stresses in plants. Mol. Plant Breed. 2020, 18, 1176–1186. [Google Scholar]
  13. Mahmood, T.; Khalid, S.; Abdullah, M.; Ahmed, Z.; Shah, M.K.N.; Ghafoor, A.; Du, X.M. Insights into drought stress signaling in plants and the molecular genetic basis of cotton drought tolerance. Cells 2019, 9, 105. [Google Scholar] [CrossRef] [PubMed] [Green Version]
  14. Li, K.R.; Feng, C.H. Effects of brassinolide on drought resistance of Xanthoceras Sorbifolia seedlings under water stress. Acta Physiol. Plant 2011, 33, 1293–1300. [Google Scholar] [CrossRef]
  15. Blum, A. Drought resistance, water-use efficiency, and yield potential-are they compatible, dissonant, or mutually exclusive? Aust. J. Agric. Res. 2005, 56, 1159–1168. [Google Scholar] [CrossRef]
  16. Raherison, E.S.M.; Giguère, I.; Caron, S.; Lamara, M.; Mackay, J.J. Modular organization of the white spruce (Picea glauca) transcriptome reveals functional organization and evolutionary signatures. New Phytol. 2015, 207, 172–187. [Google Scholar] [CrossRef] [Green Version]
  17. Langfelder, P.; Horvath, S. WGCNA: An R package for weighted correlation network analysis. BMC Bioinform. 2008, 9, 559. [Google Scholar] [CrossRef] [Green Version]
  18. Hasanuzzaman, M.; Shabala, L.; Brodribb, T.J.; Zhou, M.; Shabala, S. Understanding physiological and morphological traits contributing to drought tolerance in barley. J. Agron. Crop Sci. 2019, 205, 129–140. [Google Scholar] [CrossRef]
  19. Kuromori, T.; Mizoi, J.; Umezawa, T.; Yamaguchi-Shinozaki, K.; Shinozaki, K. Drought stress signaling network. In Molecular Biology; Howell, S.H., Ed.; Springer: New York, NY, USA, 2014; pp. 383–409. [Google Scholar]
  20. Seki, M.; Umezawa, T.; Urano, K.; Shinozaki, K. Regulatory metabolic networks in drought stress responses. Curr. Opin. Plant Biol. 2007, 10, 296–302. [Google Scholar] [CrossRef]
  21. Das, A.; Rushton, P.; Rohila, J. Metabolomic profiling of soybeans (Glycine max L.) reveals the importance of sugar and nitrogen metabolism under drought and heat stress. Plants 2017, 6, 21. [Google Scholar] [CrossRef] [Green Version]
  22. Fàbregas, N.; Fernie, A.R. The metabolic response to drought. J. Exp. Bot. 2019, 70, 1077–1085. [Google Scholar] [CrossRef] [PubMed] [Green Version]
  23. Veres, S.; Zsombik, L.; Juhász, C. Regulation Effect of Different Water Supply to the Nitrogen and Carbon Metabolism. In Abiotic and Biotic Stress in Plants; de Oliveira, A.B., Ed.; IntechOpen: London, UK, 2019; p. 261. [Google Scholar]
  24. Zhang, G.; Meng, S.; Gong, J. The expected and unexpected roles of nitrate transporters in plant abiotic stress resistance and their regulation. Int. J. Mol. Sci. 2018, 19, 3535. [Google Scholar] [CrossRef] [PubMed] [Green Version]
  25. Moore, J.P.; Vicré-Gibouin, M.; Farrant, J.M.; Driouich, A. Adaptations of higher plant cell walls to water loss: Drought vs desiccation. Physiol. Plant. 2008, 134, 237–245. [Google Scholar] [CrossRef] [PubMed]
  26. Tenhaken, R. Cell wall remodeling under abiotic stress. Front. Plant Sci. 2015, 5, 771. [Google Scholar] [CrossRef] [PubMed] [Green Version]
  27. Ma, H.; Liu, M. The microtubule cytoskeleton acts as a sensor for stress response signaling in plants. Mol. Biol. Rep. 2019, 46, 5603–5608. [Google Scholar] [CrossRef]
  28. Yu, S.G.; Kim, J.H.; Cho, A.H.; Oh, T.R.; Kim, W.T. Arabidopsis RING E3 ubiquitin ligase JUL1 participates in ABA-mediated microtubule depolymerization, stomatal closure, and tolerance response to drought stress. Plant J. 2020, 103, 824–842. [Google Scholar] [CrossRef]
  29. de Carvalho, M.H.C. Drought stress and reactive oxygen species. Plant Signal. Behav. 2008, 3, 156–165. [Google Scholar] [CrossRef] [Green Version]
  30. Schuler, M. Functional genomics of p450s. Annu. Rev. Plant Biol. 2003, 54, 629–667. [Google Scholar] [CrossRef]
  31. Gupta, A.; Rico-Medina, A.; Caño-Delgado, A.I. The physiology of plant responses to drought. Science 2020, 368, 266–269. [Google Scholar] [CrossRef]
  32. Wang, L.; Hua, D.; He, J.; Duan, Y.; Chen, Z.; Hong, X.; Gong, Z. Auxin Response Factor2 (ARF2) and its regulated homeodomain gene HB33 mediate abscisic acid response in Arabidopsis. PLoS Genet. 2011, 7, e1002172. [Google Scholar] [CrossRef] [Green Version]
  33. Zhou, Q.; Liu, Z.L.; Ning, K.; Wang, A.; Zeng, X.; Xu, J. Genomic and transcriptome analyses reveal that mapk- and phosphatidylinositol-signaling pathways mediate tolerance to 5-hydroxymethyl-2-furaldehyde for industrial yeast Saccharomyces cerevisiae. Sci. Rep. 2014, 4, 6556. [Google Scholar] [CrossRef]
  34. Munnik, T.; Vermeer, J.E.M. Osmotic stress-induced phosphoinositide and inositol phosphate signalling in plants. Plant Cell Environ. 2020, 33, 655–669. [Google Scholar] [CrossRef] [PubMed]
  35. Kuang, R.; Chan, K.H.; Yeung, E.; Lim, B.L. Molecular and biochemical characterization of AtPAP15, a purple acid phosphatase with phytase activity, in Arabidopsis. Plant Physiol. 2009, 151, 199–209. [Google Scholar] [CrossRef] [PubMed] [Green Version]
  36. Acharya, B.R.; Jeon, B.W.; Zhang, W.; Assmann, S.M. Open Stomata 1 (OST1) is limiting in abscisic acid responses of Arabidopsis guard cells. New Phytol. 2013, 200, 1049–1063. [Google Scholar] [CrossRef] [PubMed]
Figure 1. Number of differentially expressed genes (DEGs) identified by pairwise comparisons. (a) Number of up-regulated and down-regulated DEGs in the comparisons of water-saving (WS) and water-consuming (WC) yellowhorn, as well as fast-growing (FG) and slow-growing (SG) yellowhorn under drought conditions. (b) Number of the overlapping and uniquely DEGs in the comparisons of WS-WC and FG-SG. (c) Venn diagrams of the overlapping and uniquely up-regulated and down-regulated DEGs in the comparisons of WS-WC and FG-SG.
Forests 11 00840 g001
Figure 2. Scatter plot of top 30 gene ontology (GO) terms enriched by differentially expressed genes (DEGs). (a) Top 30 GO enrichment terms by DEGs in WS-WC. (b) Top 30 GO enrichment terms by DEGs in FG-SG. (c) Top 30 GO enrichment terms by the overlapping DEGs between WS-WC and FG-SG. GO category includes green cellular component, blue molecular function and red biological process. WS-WC indicates the comparisons of water-saving and water-consuming yellowhorn; FG-SG indicates the comparisons of fast-growing and slow-growing yellowhorn.
Forests 11 00840 g002
Figure 3. WGCNA identification of transcriptomes correlated with water use efficiency (WUE) and growth index (increment of diameter). (a,b) Hierarchical cluster tree of differentially expressed genes (DEGs) in WS-WC (a) and FG-SG (b) produced 10 and 12 gene co-expression modules, respectively. (c,d) Gene significance of WUE (c) and increment of diameter (d) in modules. (e,f) Heatmap of relationships containing the corresponding correlation and p-value between modules and drought responsive parameters, WUE (e) and increment of diameter (f). The left panel corresponds to modules; The right color scale corresponds to module-trait correlation. WS-WC indicates the comparisons of water-saving and water-consuming yellowhorn; FG-SG indicates the comparisons of fast-growing and slow-growing yellowhorn.
Forests 11 00840 g003
Figure 4. Scatter plot of module membership and gene significance of identified modules. (ac) The correlation of module membership and gene significance of greenyellow (a), blue (b) and purple (c) modules that associated with water use efficiency (WUE). (d) The correlation of module membership and gene significance of blue module associated with increment of diameter.
Forests 11 00840 g004
Figure 5. Scatter plot of top 30 gene ontology (GO) terms enriched by differentially expressed genes (DEGs) in greenyellow and blue modules. (a) GO enrichment terms by DEGs in greenyellow module associated with water use efficiency (WUE). (b) GO enrichment terms by DEGs in blue module that associated with increment of diameter. GO category includes green cellular component, blue molecular function and red biological process.
Forests 11 00840 g005
Figure 6. Networks of hub genes in selected greenyellow (a) and blue (b) modules. Red nodes indicate up-regulated genes; green nodes indicate down-regulated genes. The size of nodes is determined by intra-modular connectivity (KME). The width of edges is determined by weight.
Forests 11 00840 g006
Figure 7. Relative expression levels of the six hub genes in four types yellowhorn under long term drought conditions. WS indicates water-saving type yellowhorn; WC indicates water-consuming type yellowhorn; FG indicates fast-growing type yellowhorn; SG indicates slow-growing type yellowhorn. XsACTIN was as internal control. The five trees in the same type yellowhorn were used as biological repeat. Error bars indicate SD.
Forests 11 00840 g007
Table 1. Kyoto encyclopedia of genes and genomes (KEGG) enrichment analysis of differentially expressed genes (DEGs) in WS-WC and FG-SG.
PathwayOut (349)All (3754)p-ValueQ value
WS-WCPantothenate and CoA biosynthesis7200.00150.1641
RNA degradation181100.01170.4968
mRNA surveillance pathway191200.01370.4968
Purine metabolism191250.02050.5307
Alpha-linolenic acid metabolism8390.02430.5307
Beta-alanine metabolism7340.03360.6113
Ribosome322560.04710.7333
FG-SGRibosome biogenesis in eukaryotes19853.47 × 10−50.0036
Spliceosome251620.00120.0516
Inositol phosphate metabolism9350.00150.0516
Phosphatidylinositol signaling system8350.00590.1546
Sphingolipid metabolism7300.00880.1835
Autophagy—other eukaryotes6300.03110.5400
Overlap of WS-WC and FG-SGAutophagy—other eukaryotes3300.00090.0245
Spliceosome51620.00370.0481
WS-WC indicates the comparisons of water-saving and water-consuming yellowhorn; FG-SG indicates the comparisons of fast-growing and slow-growing yellowhorn.
Table 2. The kyoto encyclopedia of genes and genomes (KEGG) enrichment analysis of differentially expressed genes (DEGs) in greenyellow and blue modules.
ModulePathwayOut (54)All (3754)p-ValueQ value
GreenyellowRibosome132564.50 × 10−50.0023
Ubiquinone and other terpenoid-quinone biosynthesis2220.03900.6290
BlueSNARE interactions in vesicular transport2410.01590.1889
Base excision repair2430.01750.1889
Riboflavin metabolism150.02380.1889
Ribosome42560.03020.1889

