Article

Integrating Plant Diversity Data into Mapping and Assessment of Ecosystem and Their Services (MAES) Implementation in Greece: Woodland and Forest Pilot

by
Konstantinos Kotsiras
1,
Ioannis P. Kokkoris
1,
Arne Strid
2 and
Panayotis Dimopoulos
1,*
1
Department of Biology, Laboratory of Botany, University of Patras, 26504 Patras, Greece
2
Bakkevej 6, DK-5853 Ørbæk, Denmark
*
Author to whom correspondence should be addressed.
Forests 2020, 11(9), 956; https://doi.org/10.3390/f11090956
Submission received: 1 August 2020 / Revised: 25 August 2020 / Accepted: 29 August 2020 / Published: 1 September 2020

Abstract

:
Research Highlights: This is the first approach that integrates biodiversity data into Mapping and Assessment of Ecosystem and their Services (MAES) implementation and natural capital accounting process, at the national scale, using an extensive vascular plant dataset for Greece. Background and Objectives: The study aims to support the MAES implementation in Greece, by assessing, as a pilot, the woodland and forest ecosystem type; the targets of the study are: (a) Identify and map ecosystem type extent; (b) identify ecosystem condition using biodiversity in terms of plant species richness (i.e., total, ecosystem exclusive, endemic, ecosystem exclusive endemic diversity); (c) develop ecosystem asset proxy indicators by combining ecosystem extent and ecosystem condition outcomes; (d) identify shortcomings; and (e) propose future steps and implications for the MAES implementation and natural capital accounting, based on biodiversity data. Materials and Methods: Following the national European Union’s and United Nations System of Environmental Economic Accounts-Experimental Ecosystem Accounting (SEEA-EEA) guidelines and the adopted National Set of MAES Indicators, we developed a set of four proxy ecosystem asset indicators to assess ecosystem types with respect to ecosystem area extent and ecosystem condition. This was as interpreted by its plant diversity in terms of species richness (total, ecosystem exclusive, endemic, and ecosystem exclusive endemic diversity). Results: The results revealed that when indicators use well-developed biodiversity datasets, in combination with ecosystem extent data, they can provide the baseline for ecosystem condition assessment, ecosystem asset delineation, and support operational MAES studies. Conclusions: The relation among biodiversity, ecosystem condition, and ecosystem services is not a linear equation and detailed, fine-scale assessments are needed to identify and interpret all aspects of biodiversity. However, areas of importance are pinpointed throughout Greece, and guidance is provided for case-study selection, conservation strategy, and decision-making under the perspective of national and EU environmental policies.

1. Introduction

The benefits that derive from economic, social, cultural, or other human activities performed on ecosystems are defined as Ecosystem Services (ES)—which have been introduced in the scientific forefront, during the 1970s and 1980s [1,2,3], and have been established as an environmental advisory tool for policy- and decision-making during the 2000s [4,5,6,7]. Biodiversity is in the epicenter of the ES approach (see Millennium Ecosystem Assessment (MEA) [8], Mapping and Assessment of Ecosystem and their Services (MAES) [7,9], Intergovernmental Science-Policy Platform on Biodiversity and Ecosystem Services (IPBES) [10]). It is considered as the cornerstone for future wellbeing, particularly with respect to equity and fairness in the socio-economic system, which guides the direct drivers of change [8]. In the European Union (EU), the EU Biodiversity Strategy for 2030 [11], and the EU Green Deal [12] highlight the important role of biodiversity, the need for its assessment and recording its spatial extent (i.e., mapping biodiversity and its attributes) to support conservation measures and management strategies needed for sustainable development. A growing concern on ES maintenance and its sustainable use is rising, since the documented biodiversity loss may affect ecosystem functioning and alter the provision of various ES threatening human wellbeing [1,2,3]. However, assessing and documenting the importance of ES delivery in the social sphere has proven difficult, with major challenges being the complexity of the topic and the availability of applicable approaches [13]. Moreover, the relationship between biodiversity and ES is considered as confused and is hindering the efforts for the development of coherent policy [14].
Braat and ten Brink [15] demonstrate how changes in biodiversity affect different types of ecosystem services, while Harrison et al. [16] in their literature review study found that the relationships between biodiversity attributes and ecosystem services are, in their majority, positively correlated. This is also highlighted by the work of Grunewald et al. [17], in which regulating ES is found to be usually positively correlated with higher biodiversity. However, detailed studies at various area-extent and dataset scales are needed to provide robust information; Steur et al. [18] studied plant diversity relationship with tropical forest ecosystem services, which were often found inconclusive, or showed both positive and negative correlations.
As the concept of ES gained popularity [6], the demand for appropriate indicators, quantification, and spatial localization methods has increased [19,20,21]. Various biodiversity indicators have been proposed to interpret ecosystem services provision at different ecosystems and at various spatial scales (e.g., [20,22]), as well as for ecosystem condition assessments (i.e., utilizing species diversity and abundance) as described by Maes et al. [23] in the analytical framework for mapping and assessment of ecosystem condition in the EU. In Europe, many EU Member States have already developed or are currently developing indicators to support MAES studies, some of which are focusing on different types of biodiversity and/or its spatial extent and distribution (e.g., [24,25,26]).
The need to measure ecosystems and their ES led to the broadly applicable system of the United Nations System of Environmental Economic Accounts-Experimental Ecosystem Accounting (SEEA-EEA) [27,28], which includes a set of accounts such as ecosystem extent, ecosystem services (supply and use), ecosystem assets, and biodiversity. The biodiversity accounts focus on species richness, abundance, and threats [29]. It is worth mentioning that biodiversity monitoring and biodiversity accounting systems have substantial differences; accounting methods are to be informative at an aggregated level with a limited set of indicators, that will capture biophysical information and at the same time the outcomes to be easily communicated to policy- and decision-makers [30].
In Greece, MAES implementation is already in progress, since 2018, via the LIFE-IP 4 NATURA project [31], which is coordinated by the Ministry of the Environment and Energy and incorporates a national set of indicators that includes six indicator groups, comprised by 40 indicators of which five are dealing with biodiversity, i.e., (i) diversity of agro-ecosystems with natural ecosystems, (ii) floristic diversity, (iii) micro-refugia of floristic and endemic diversity, (iv) network of crop limits with natural vegetation and (v) total biodiversity [26]. From the mentioned indicators, “floristic diversity” and “total biodiversity” are also considered as applicable for natural capital accounting, under the SEEA-EEA approach.
Woodland and forest is the dominant, natural terrestrial ecosystem type in Greece, covering ca. 29% [32] of the terrestrial area; woodland and forest ecosystem type is highlighted as of particular importance in Greece, including seven forest categories (Temperate deciduous forests, Mediterranean deciduous forests, Floodplain forests, Riparian forest/Fluvial forests, Temperate mountainous coniferous forests, Mediterranean coniferous forests, Mediterranean sclerophyllous forests, Mixed forests) [26,33], and distributed among 34 habitat types. Woodland and forests provide a variety of ecosystem services [34], which are proposed to be initially assessed by 20 indicators (three from Biodiversity, eight from Environmental Quality, one from Food, Material, and Energy, five from Forestry and three from Recreation indicator groups) [26].
This study aims to contribute to the efforts for overcoming the aforementioned challenges and support the MAES implementation in Greece, by assessing, as a pilot, woodland and forest ecosystem type; the EU and National guidelines for assessing and mapping ecosystem extent, ecosystem condition, and ecosystem asset, as described by SEEA-EEA and the relevant literature, e.g., [27,29,35,36] have been followed for the assessment. More precisely, the targets of the study are: (a) Identify and map ecosystem type extent; (b) identify ecosystem condition using biodiversity in terms of plant species richness (i.e., total, ecosystem exclusive, endemic, ecosystem exclusive endemic diversity); (c) develop ecosystem asset proxy indicators by combining ecosystem extent and ecosystem condition outcomes; (d) identify shortcomings; and (e) propose future steps and implications for the MAES implementation and natural capital accounting, based on biodiversity data.

2. Materials and Methods

Using the following guidance—(a) the analytical framework for mapping and assessment of ecosystems and their services in EU [7]; (b) the analytical framework for mapping and assessment of ecosystem condition in EU [23]; (c) SEEA and EU guidance on incorporating biodiversity into natural capital accounting (measuring the condition of ecosystem assets) [35,36]; and (d) the National Set of MAES Indicators for Greece [26]—we developed a species-richness based methodology to develop proxy indicators for ecosystem asset assessment and support the MAES implementation efforts in Greece. In general, the proposed methodology incorporates the ecosystem type area and the species richness in a given ecosystem type, at the 10 × 10 km European Environment Agency (EEA) reference grid [37] scale.

2.1. Datasets and Typology

For the analysis, we used the CORINE Land Cover (CLC) dataset for Greece [38] and the floristic records from the Flora of Greece Web project [39]. Species distribution, chorology, and habitat preferences follow Dimopoulos et al. [40,41] and the relevant information provided by the Flora of Greece Web portal [39]; the term ‘species’ includes both plant species and subspecies. Subsequently, a typology to assign species’ habitats and MAES level 2 ecosystem types [7] has been developed following the concept by Kokkoris et al. [26].

2.2. Methodological Procedure

The methodological procedure of the present study consists of the following three steps:
Step 1: Ecosystem extent. It includes the identification of each ecosystem types’ area spatial extent using the 10 × 10 km EEA reference grid for Greece [37] and based on the proposed typology for MAES [7], by which each CLC class is matched to one of the MAES level 2 ecosystem types and applied on the Greek terrestrial area using Geographic Information Systems (GIS). Subsequently, each grid cell includes one or more polygons of different ecosystem types. For the present study, we used two metrics for the ecosystem type extent per cell: (a) The actual area of the ecosystem type in the cell and (b) the relative area of the ecosystem type in the cell, with respect to the total area of the ecosystem type in the floristic region [39,42], where the cell belongs to. For example, and for interpretation purposes, let us assume that the cell of interest is as presented in Figure 1 and the ecosystem type of interest is D with the area at the given cell equal to d ha and its total area in the floristic region where the cell belongs to is x ha; thus, the relative ecosystem area extent for ecosystem type D in the given cell is d/x ha.
By this, the normalized, relative area of each MAES level 2 ecosystem type [32] is calculated in each grid cell, with respect to the total area extent of the given ecosystem type in each floristic region of Greece [29,33] and all cells are scored in a common scale (0 to 1). In the present study, we followed this procedure for the woodland and forest ecosystems.
Step 2: Ecosystem condition. It includes the identification and assessment of plant diversity with respect to species richness at each grid cell, including only species assigned to the under-assessment ecosystem type. For example, for woodland and forest ecosystem type assessment, we analyzed only records from species present in woodland and forests. This analysis continues to a more detailed assessment using species exclusively present in the given ecosystem type. The same analysis is applied for endemic species, as well as for endemic species present only in the given ecosystem type. All calculations refer to normalized (0 to 1), relative species number with respect to each category’s (i.e., total species richness, richness of species exclusively present in the ecosystem type, endemic species richness, richness of endemic species exclusively present in the ecosystem type) total species number in each floristic region of Greece. Table 1 provides a detailed description of the proposed calculations.
Step 3: Ecosystem asset proxy indicators. Normalized values of ecosystem type area extent and ecosystem condition (plant diversity) outcomes are combined per grid cell by summing their cell value. The sum has been subsequently normalized in a 0 to 1 scale, and the result is the proxy indicator for each one of the four possible combinations.
The abovementioned methodology for developing and assessing ecosystem asset proxy indicators is presented in Figure 2.
Thematic representation of the results has also been performed, by producing gradient maps in Geographic Information Systems (GIS), using a five-rating scale (i.e., very low, low, medium, high, very high). By this, areas of importance are highlighted, hotspots (i.e., areas where high concentration occurs of cells rated as “high” and/or “very high”) are identified, and the results are better communicated to the non-expert community.

3. Results

3.1. Plant Habitats Categories to MAES Ecosystem Types Typology

The eight habitat categories for the vascular plants of Greece and as identified for the Greek flora by Dimopoulos et al. [40,41] have been assigned to the relevant MAES level 2 ecosystem types [7]. For most ecosystem types, including woodland and forests, the correspondence is straightforward; only ‘heathland and shrub’ and ‘sparsely vegetated land’ ecosystem types correspond to two different habitat categories, i.e., (a) Temperate and sub-Mediterranean grasslands (G), Xeric Mediterranean phrygana and grasslands (P) and (b) Cliffs, rocks, walls, ravines, boulders (C) and Coastal habitats (M), respectively. Subsequently, the total number of species has been assigned to each ecosystem type (Table 2). The woodland and forest ecosystem type hosts 1506 species out of 6760 species present in Greece [39], i.e., 22% of the Greek flora.

3.2. Woodland and Forest Extent

Woodland and forest ecosystem type covers in total 40,735 km2 throughout the Greek territory. Mainland Greece hosts 89.82% of the ecosystem type’s area, while the remaining 10.18% is scattered throughout the island regions. More precisely and based on the floristic regions’ division of Greece, North-East Greece (NE) hosts the 25.82% of its area, followed by North Central Greece (NC) (14.64%) and North Pindos (NPi) (12.10%). Floristic regions with the smallest area cover are Kiklades (KiK) (0.05%), North Aegean islands (NAe) (0.43%), and Ionian Islands (IoI) (0.74%) (Table 3).
The distribution of woodland and forest ecosystem type is thematically presented in Figure 3a, under the EEA 10 × 10 km reference grid, and depicts the actual area cover of the ecosystem type at each grid cell under the “very low” to “very high” rating scale. Darker cells highlight areas where woodland and forest ecosystem type is abundant; mountain tops in the mainland host the majority of cells with “high” or “very high” designation, while lowlands and island regions follow. More precisely, the overwhelming majority of cells characterized as “Very high” (for woodland and forest) for area cover are located northern of Peloponnisos, and only two of them are present in Peloponnisos, at Mt. Menalo and Mt. Taygetos. We should pinpoint the presence of two cells characterized as “Very high” in the region of West Aegean Islands, and in particular, on the mountain ranges of northern Evia (WAe). In general, island regions are found to have a significantly low cover of woodland and forest area compared to the mainland regions; however at Evia (WAe), at three major EAe islands (i.e., Lesvos, Samos, and Rhodes) and in southwest Crete (at the surrounding area of Samaria river gorge) (KK) there are cells with a high area cover of woodland and forests.
In Figure 3b, each cell depicts the relative woodland and forest area with respect to a given floristic region total area cover for woodland and forest. Since all values are normalized to a 0 to 1 scale, the results of each cell can be directly compared with any other cell of the grid. This thematic representation highlights areas (cells) within each floristic region that are important for woodland and forest assessments in the region; and by this, each cell’s rating is considered as a score for MAES studies prioritization. The most characteristic example lies in the floristic region of Kiklades (KiK), where areas in the central and northern part (i.e., at Naxos, Tinos, and Andros islands) are scored as important (“medium” to “very high” scores) for their woodland and forest area cover in the region.
Detailed data information for each grid cell is provided in the Supplementary Materials (Table S1).

3.3. Ecosystem Condition and Plant Diversity

Plant diversity is considered as a proxy for ecosystem condition, and the results of the analyses are summarized, as follows.
Figure 4 depicts the thematic representation for total plant diversity, in terms of species richness within the woodland and forest ecosystem type. Figure 4a presents a gradient map for the total number of species present in each grid cell, classified under the “very low” to “very high” rating scale. Cells rated as “very high” or “high” consist of 3.2% (226 out of 7112 cells) of the total number, distributed scattered throughout all floristic regions, and highlight mountainous areas of various altitudes. When we applied a similar analysis using the relative total species richness, as described in the methodology, the pattern changes (Figure 4b) and 4.7% (337 out of 7112 cells) of the cells are rated as “very high” or “high”. More precisely, different cells are now considered important with respect to their relative species richness; characteristic examples are found in the regions of Kiklades (KiK), Peloponissos (Pe) and Kriti and Karpathos (KK), where cells with “low” or “very low” species richness (Figure 4a), are now pinpointed as of significant importance for the region (Figure 4b) (e.g., cells in Kiklades, southern Peloponnisos and northwestern Kriti). Detailed data information for each grid cell is provided in the Supplementary Materials.
Figure 5 presents the thematical representation of the assessment results for three additional biodiversity (plant diversity) categories selected for the present study. More precisely:
(a)
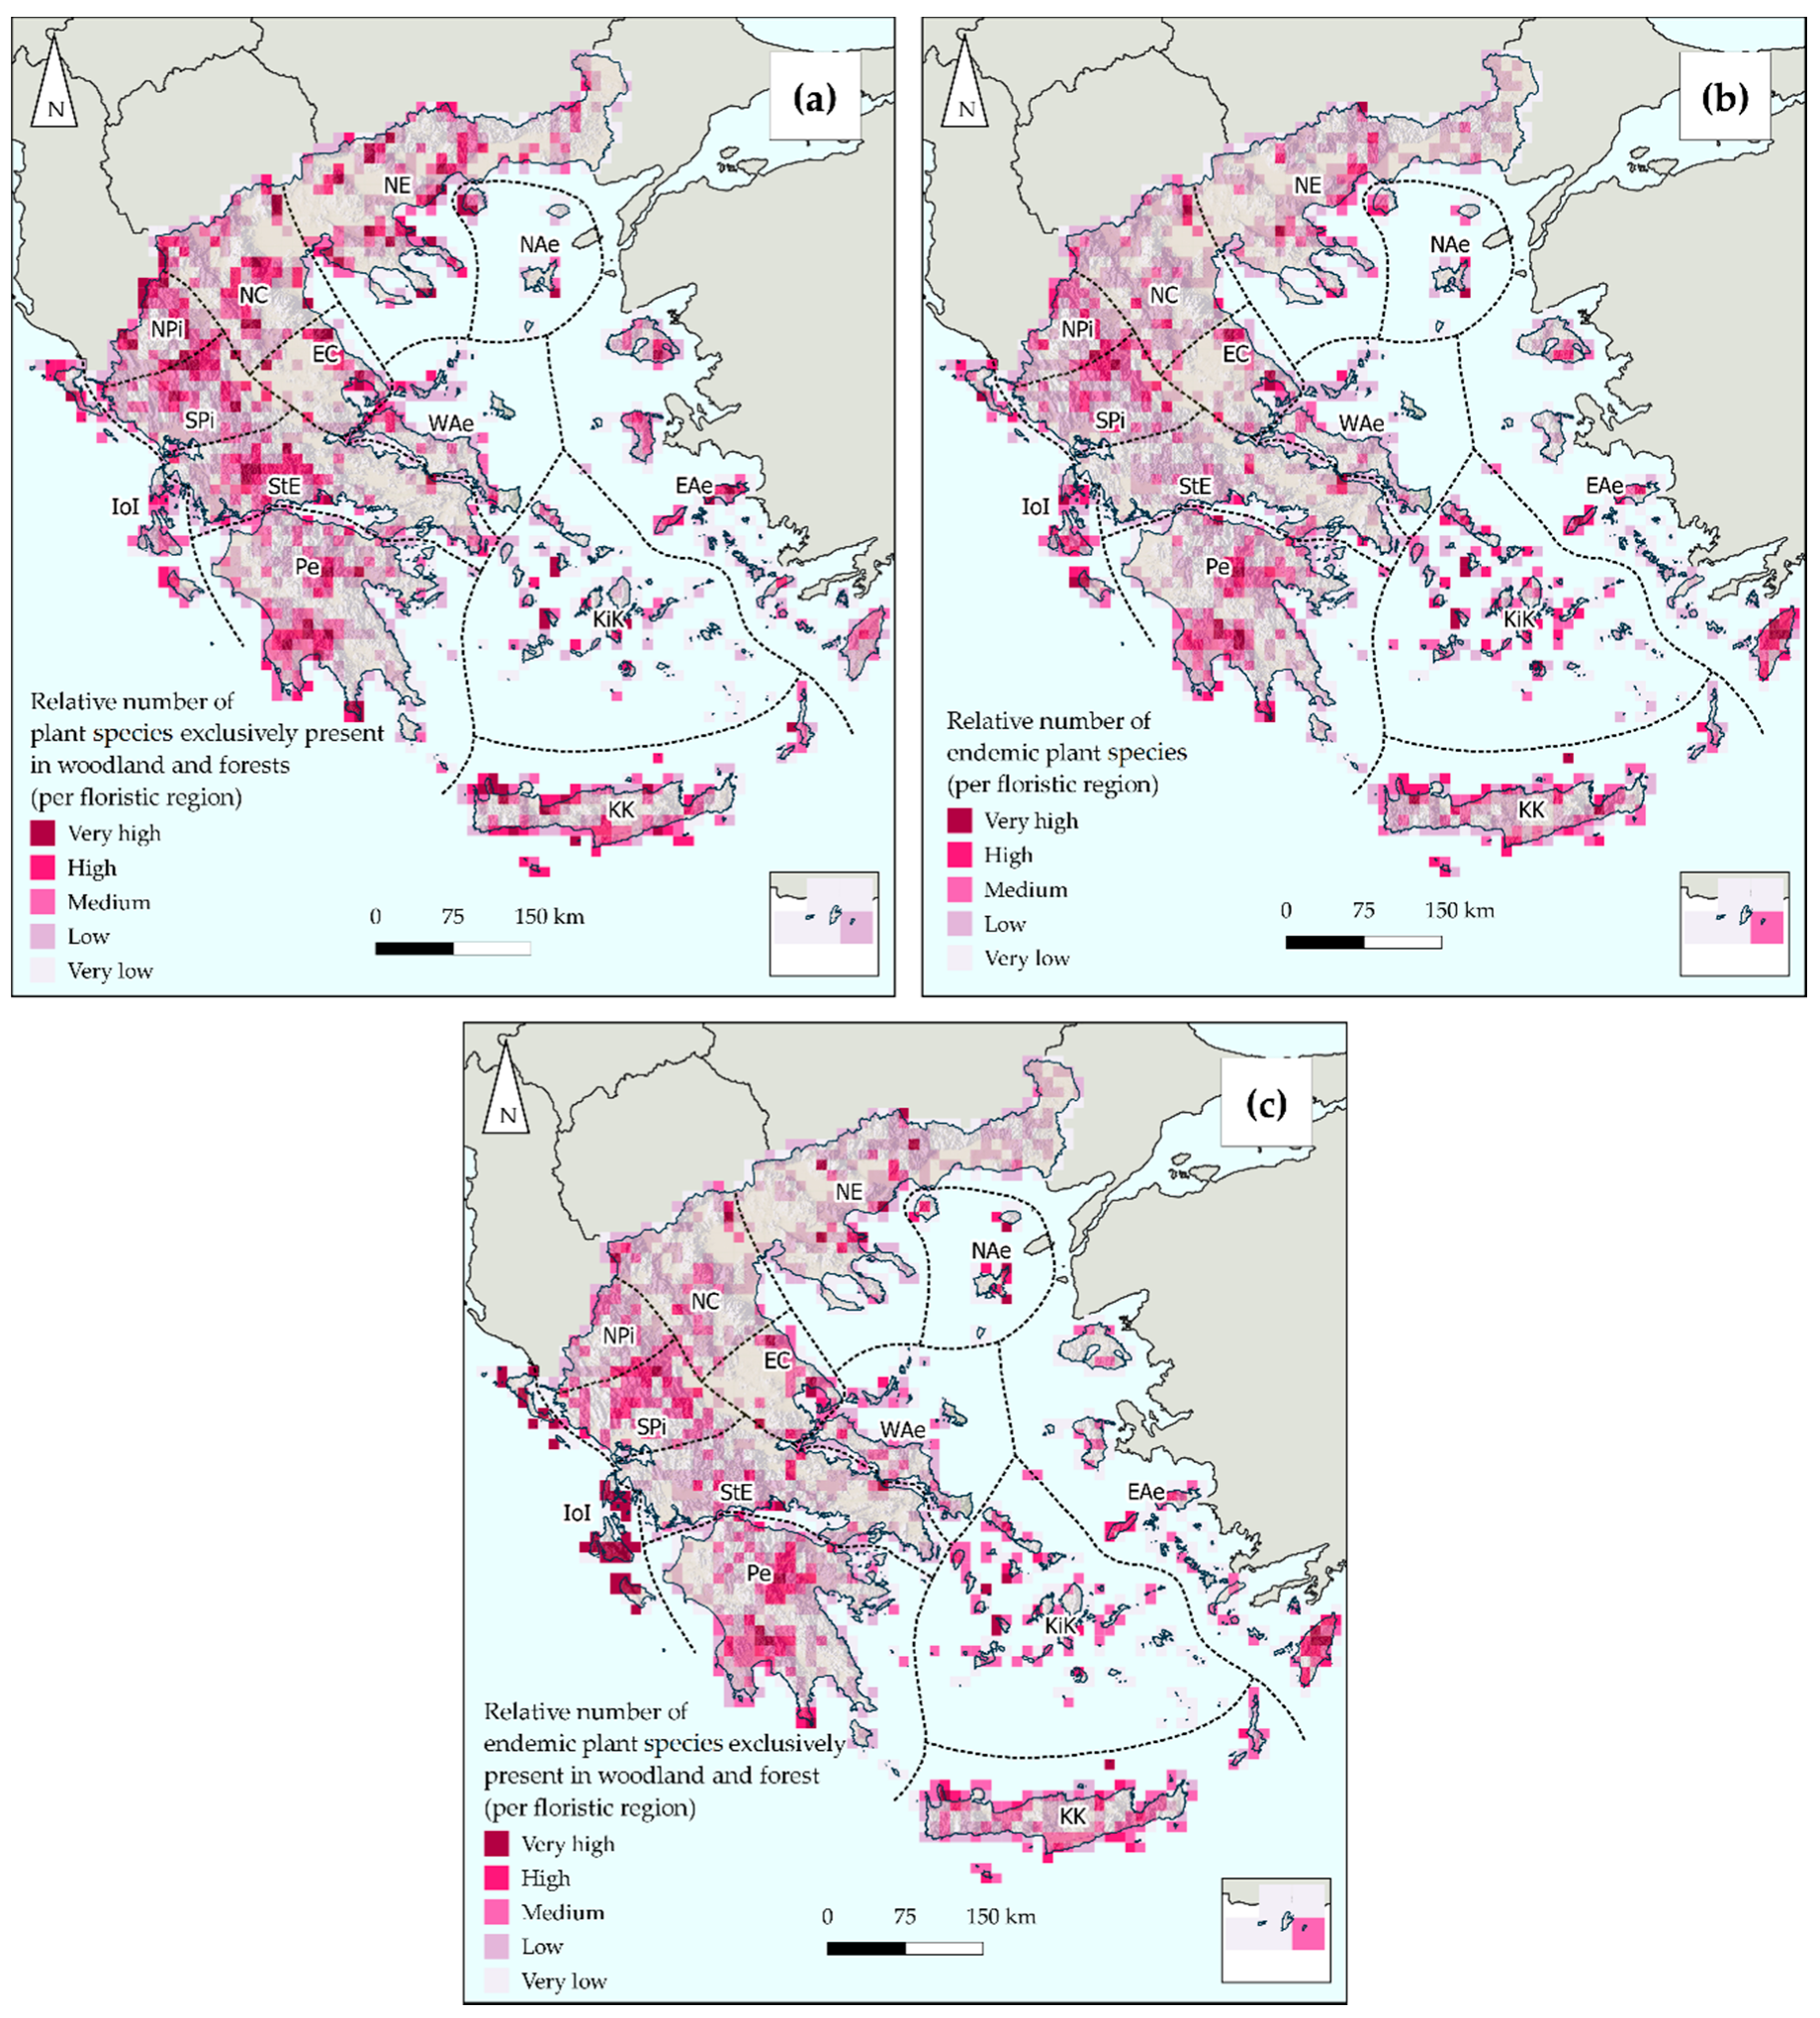
Relative number of plant species exclusively present in woodland and forest (Figure 5a): This analysis highlights 250 cells (3.5% of the total) as of “high” (165 cells) or “very high” (85 cells) importance. The distribution is scattered throughout the floristic regions, with a significant concentration in Pindos mountain range (NPi, SPi), North Central Greece (NC), Sterea Ellada (StE), southwestern Peloponisson (Pe) and in western Kriti (K). Thasos (NAe), Samos (EAe) and Kerkira (IoI) islands are considered as local hotspots.
(b)
Relative number of endemic plant species present in woodland and forest (Figure 5b): This analysis highlights 160 cells (2.2% of the total) as of “high” (126 cells) or “very high” (34 cells) importance considering Greek endemic species. The distribution pattern suggests as hotspots the central part of the Pindos mountain range (NPi, SPi), central and southern Peloponissos (Pe), Kriti (KK), Kiklades (KiK) and East Aegean Islands (EAe) and in particular the island of Rhodes in the southeastern part of the region.
(c)
Relative number of endemic plant species exclusively present in woodland and forest (Figure 5c): This analysis highlights 171 cells (2.4% of the total) as of “high” (105 cells) or “very high” (66 cells) importance considering Greek endemics exclusively present in woodland and forest. Cells of Ionian islands (IoI) include 50% (33 cells) of the cells rated as “very high” in the Greek territory, and it is notable that all cells in the IoI are rated as “very high”. The general pattern follows the one described for the endemic plant species (Figure 5b), suggesting almost identical hotspots among the floristic regions.
Detailed data information for each category per grid cell is provided in the Supplementary Materials.

3.4. Ecosystem Asset Proxy Indicators

The combination of the ecosystem extent (relative area cover) with the plant diversity categories resulted in the calculation of four relevant ecosystem asset proxy indicators and is thematically presented in Figure 6 and in detail is presented for each grid cell in the Supplementary Materials. For each proxy indicator the results are as follows:
(a)
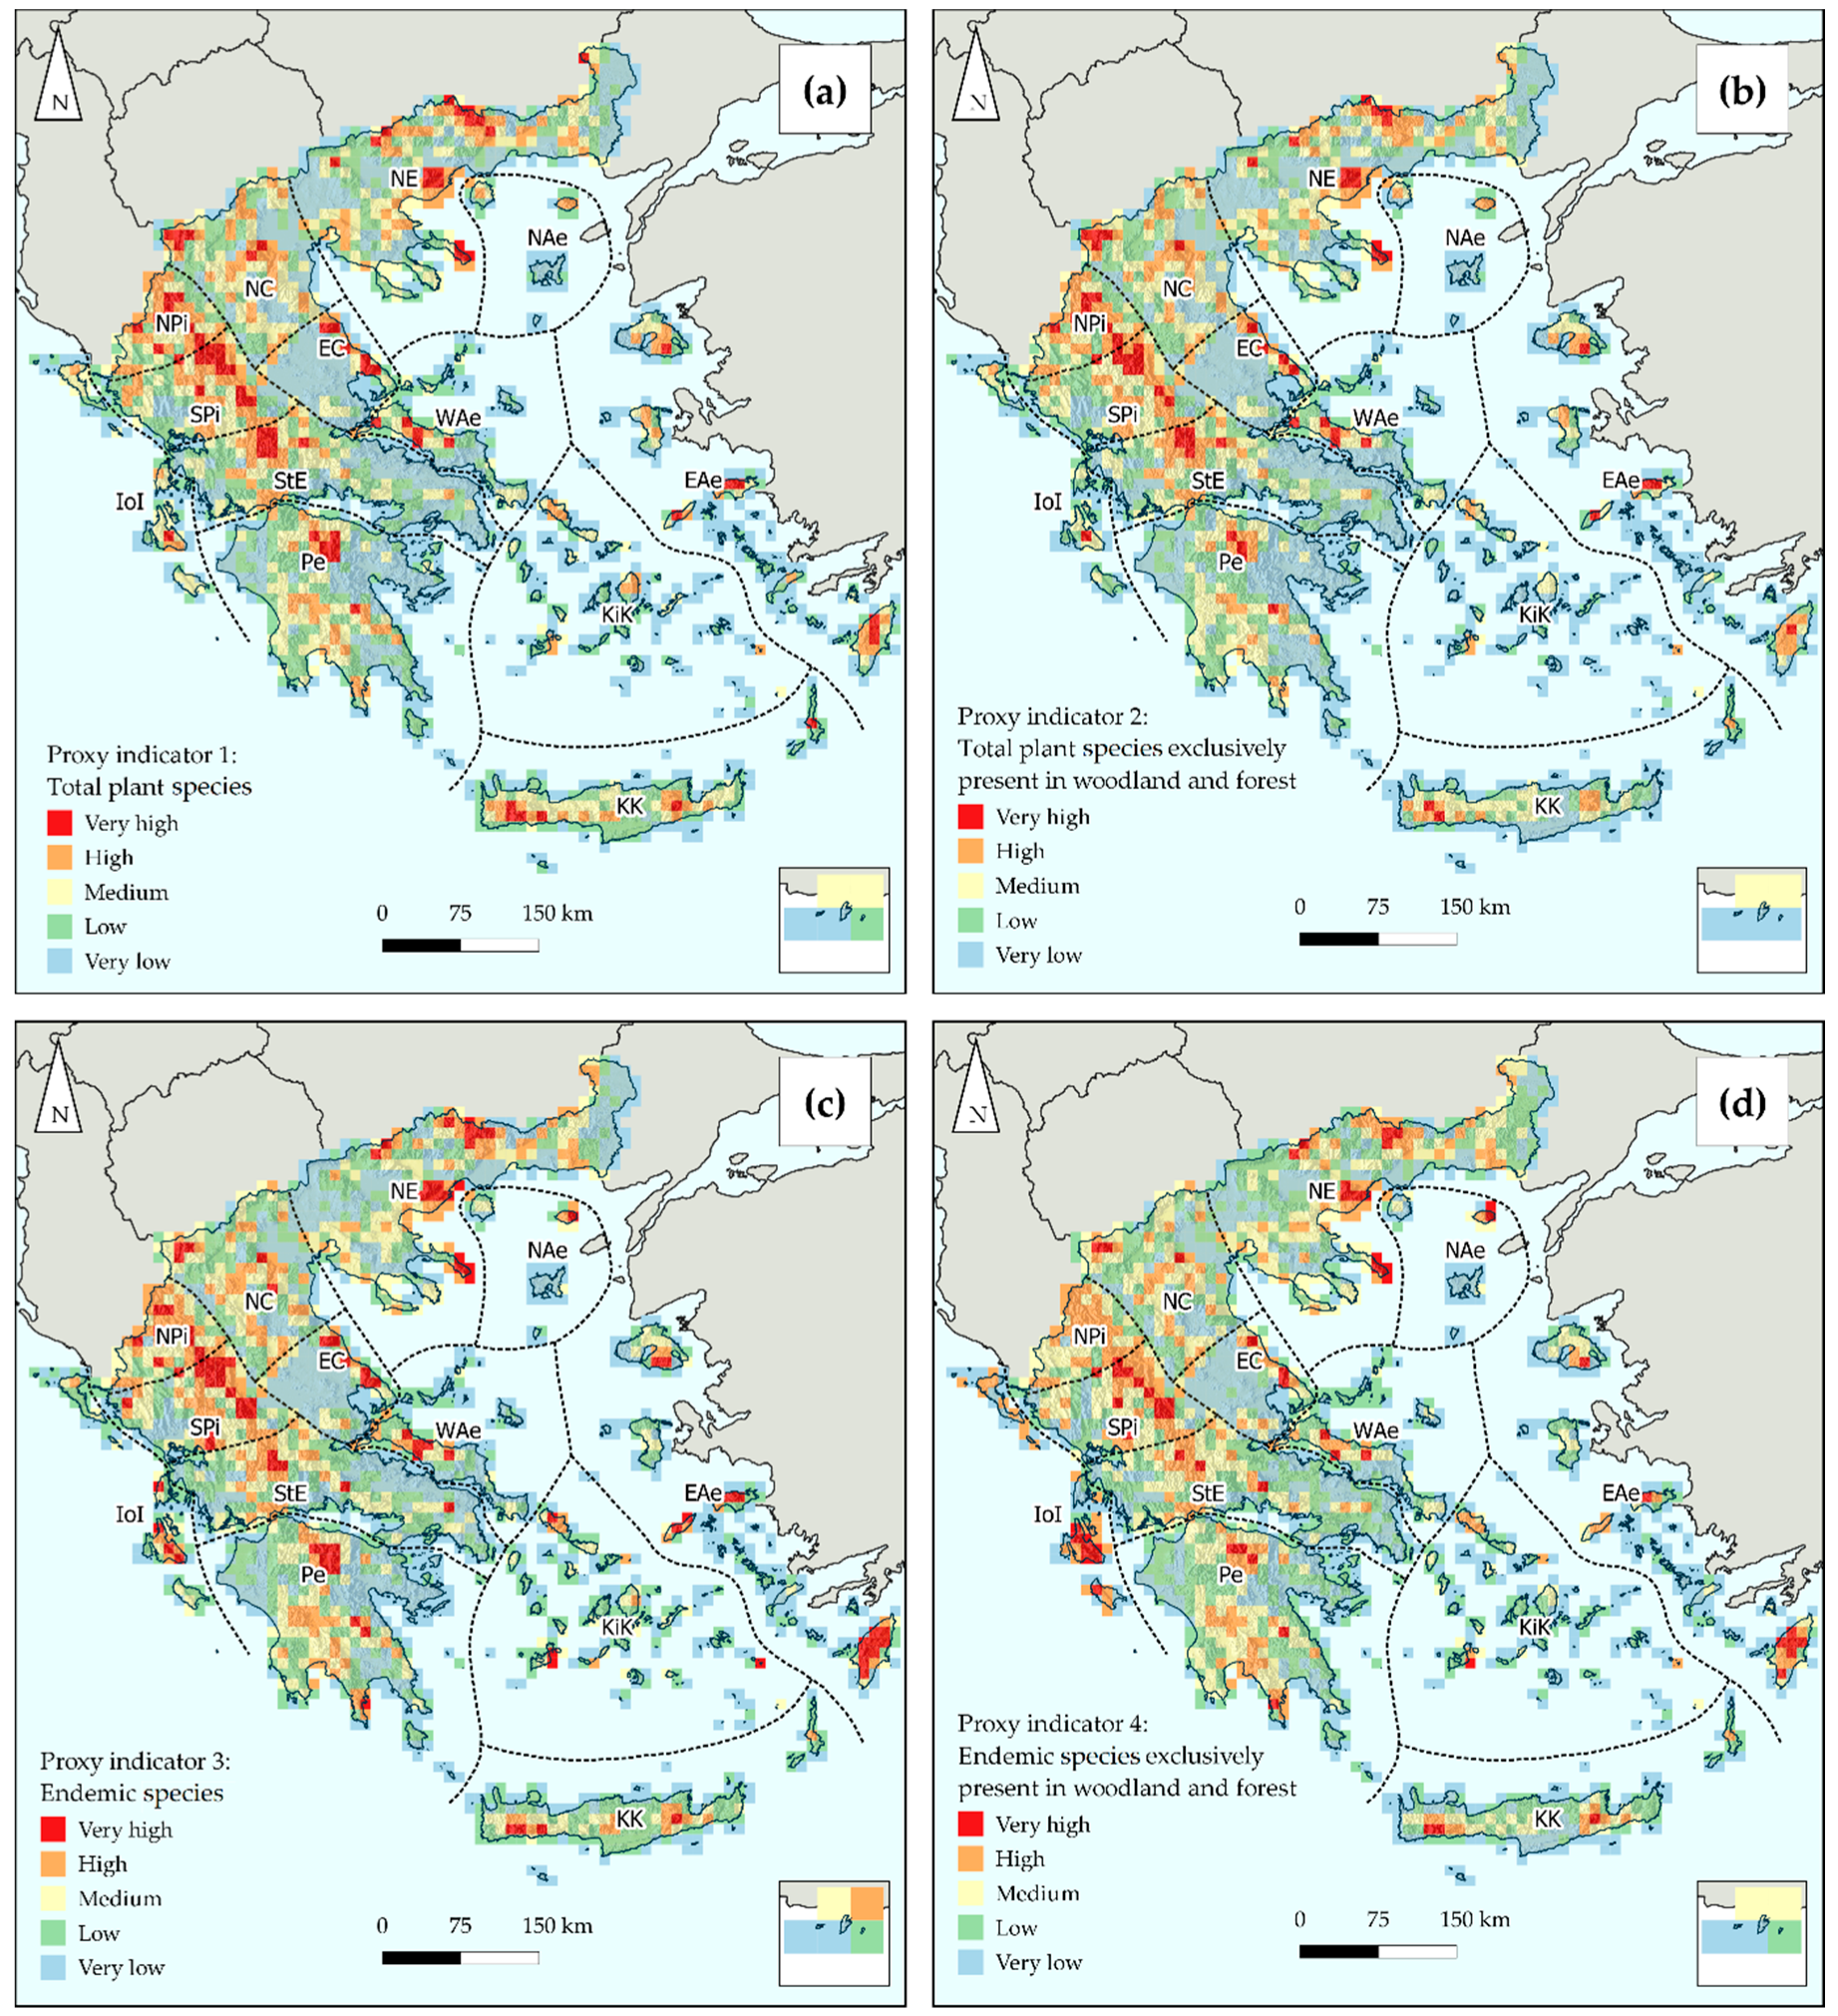
Proxy indicator 1 (total plant species): The application of this indicator highlights 337 cells (4.7%) as of “high” (252 cells) or “very high” (85 cells) importance. Hotspots are scattered throughout the mountainous areas of Greece and especially in the Pindos mountain range (Npi, Spi), in the northeastern mountains of Peloponnisos (Pe), in southern Evia (Wae), on Mts Pelion, Olympus (EC), Athos (NE), in southwestern Kriti (KK) and in Rhodes island (Eae) (Figure 6a).
(b)
Proxy indicator 2 (total plant species exclusively present in woodland and forest): The application of this indicator provides similar results with proxy indicator 1, i.e., 334 cells (4.75% of the total) are rated as of “high” (247 cells) or “very high” (87 cells) importance, following almost identical spatial patterns (Figure 6b).
(c)
Proxy indicator 3 (endemic species): The application of this indicator highlights 339 cells (4.8% of the total) as of “high” (234 cells) or “very high” (105 cells) importance. Similar spatial distribution patterns occur, and Pindos mountain range (NPi, SPi) continues to be the main hotspot; however secondary, but equally important hotspots are now more clearly highlighted and represented by cells rated as of “very high” importance, e.g., mountain tops of northeastern Peloponnisos (Pe) and Rhodes island (EAe) (Figure 6c).
(d)
Proxy indicator 4 (endemic species exclusively present in woodland and forest): The application of this indicator highlights 325 cells (4.5%) as of “high” (261 cells) or “very high” (64 cells) importance. The general spatial pattern of hotspots is similar to the results of the proxy indicators 2 and 3; particular importance of specific areas is highlighted, e.g., Kafalonia (IoI) and Samothraki islands (NAe).

4. Discussion

This is the first approach of a national-scale assessment that combines spatial, plant diversity data with area cover, and acts as a pilot, baseline assessment, and a starting point for future studies on the MAES implementation and natural capital accounting in Greece. It is highlighted how an extensive and detailed biodiversity dataset (i.e., vascular plants of Greece dataset [39]) can be incorporated into MAES procedure towards scientific documentation, environmental consulting, and decision-making. The development of proxy indicators adds value to the adopted National Set of MAES Indicators in Greece [26] and identifies advantages, limitations, and shortcomings, through the ‘woodland and forest’ ecosystem type pilot. Given the availability of the extensive floristic database in Greece, the selection of plant diversity for our study is also supported by the conclusions of Quijas et al. [44] who highlight the paramount role of plant diversity in the provision of ecosystem services and to conservation planning and management. Moreover, Balvanera et al. [45] pinpoint the role of plant diversity on ecosystem function and ecosystem services, while at large spatial scales, Costanza et al. [46] used plant species richness to show that over half of the spatial variation in net productivity in North America could be explained by biodiversity patterns (if the effects of temperature and precipitation were taken into account).

4.1. Ecosystem Extent and Condition

The baseline dataset for implementing any MAES related study is the ecosystem area extent and its condition, of which any kind of ES is supplied or potentially supplied. A key feature of the SEEA-EEA accounting model is the delineation of these spatial areas and their ecosystem assets within these areas [35]. In this study, we presented the actual area extent of woodland and forest at the cell level, which is a straightforward way to express the extent of the ecosystem. Moreover, the inclusion in the methodology of the relative ecosystem area with respect to total ecosystem area in each given floristic region is considered as of high importance, since it provides information for conservation and decision-making integrating each floristic regions’ specific characteristics. For example, cells including small woodland and forest areas in forest-poor regions are designated as of equal importance with cells including more extensive areas in forest-rich regions. This is also the case for the ecosystem condition based on plant diversity assessment, which highlights the importance for conservation and management even of areas (grid-cells) with minimum woodland and forest area cover, but of very high plant diversity (e.g., endemic species exclusively present in woodland and forest). Moreover, the integration in the analysis of total ecosystem area extent, as well as species richness based on each floristic region’s data, encapsulates a comparison to an ideal best-case situation, which can be considered as the reference value.

4.2. Ecosystem Services

The provision (or potential provision) of ecosystem services is directly related to ecosystem condition, which indicates the state of the ecosystem and its capacity to generate ES flows [47], and thus, is strongly linked to human wellbeing [7,23]. The results of the study suggest areas (rated as “high or “very high”) where fine-scale MAES studies should be implemented, including the potential to supply provisioning, regulating and maintenance and cultural services [48] and proceed to valuation methods for the prevailing and/or most important ones. Ecosystem services management and climatic scenarios should also be developed at the local and regional scale following the methods proposed by References [49,50,51].

4.3. Limitations of the Study

The ecosystem extent is calculated using the CORINE Land Cover dataset, which also provides time-series data since 1990, and thus, is useful for accounting purposes. However, this dataset can only be used for national and regional MAES studies, due to its scale. To overcome this limitation, Greece prepares the ecosystem type map of Greece, via the LIFE-IP 4 NATURA project [31], using a typology for ecosystem types, corresponding to 30 MAES level-3 ecosystem types [26]. Moreover, the use of various categories of plant species diversity may be a commonly used measure for biodiversity, however, more study is needed on the other dimensions of biodiversity, i.e., functional, structural, and taxonomic diversity [52], which should be integrated into the ecosystem condition studies.

4.4. Future Steps and Management Implications

Based on the results of the study, scientists and conservation practitioners should begin incorporating at the 10 × 10 km EEA reference grid-cell level, all available information for biodiversity in Greece. A characteristic example with ready-for-use, compatible data, is the recent work by Cheminal et al. [53] which provides the first review of existing knowledge on the Lamiaceae species in Greece and presents the results under the 10 × 10 km EEA reference grid-cell; it provides information for Lamiaceae diversity and its potential to provide services, based on each species components and characteristics. The results from endemic species categories should be further studied, due to their importance of hosting genetic, medicinal, functional, and morphological characteristics, most of them unexplored or underexplored; these results highlight areas where relevant studies should focus. Moreover, and as underlined by Kallimanis et al. [54], the adoption of higher-taxon surrogacy can be applied in cases when detailed biodiversity data are not available, or full biodiversity survey is not feasible. For instance, for other living organisms, such as the invertebrates, where extensive and detailed datasets are missing, diversity richness at the genus or family level can be used as an indicator and also contribute to the total biodiversity index development as proposed in the National Set of MAES Indicators in Greece [26]. Additionally, research on species abundance and relative abundance is also needed, as a proposed indicator for MAES assessments [23]; however, this information is missing at the scale of our study and is mainly available at a local level (e.g., from case-study assessments in conservation studies) and in most cases only for selected species (e.g., Annex II species of the Habitats’ Directive or for other endangered, e.g., Red Data Book species). One the other hand, it is also important to incorporate data that correspond to potential ecosystem disservices [55], such as ruderal and alien species information. For example, the work on ruderal plant species of Greece, also deployed under 10 × 10 km EEA reference grid-cell, highlights the positive correlation among the various ruderal species categories with the different ecosystem types (including forest) [56]. Simultaneously, alien tree species are found to have invasive behavior, threatening native plant communities; e.g., Eucalyptus camaldulensis Dehnh. poses a threat on alluvial forests [57], thus, its spatial distribution is needed for future ecosystem condition assessments. Subsequently, non-native plants are important to be assessed at all ecosystem types in terms of invasiveness, regarding ecosystem condition as well in terms of functioning (for non-invasive species) alongside native plants and other organisms. More efforts are also needed to identify the intra- and inter-ecosystem flows and in combination with ecosystem characteristics identification, e.g., extent, structure, and condition will provide the adequate information to delineate ecosystem asset, the baseline of the general ecosystem accounting model of SEEA-EEA [28] (Figure 7), which finally leads to individual and societal wellbeing.
This study also contributes to the thematic target for biodiversity set by the European Green Deal [12], as well as to the national forest policy, which sets forest biodiversity conservation among its priorities [58].

5. Conclusions

This study presents a methodological approach for integrating plant diversity data into MAES implementation, using woodland and forest ecosystem type as a pilot case-study. It is based on the national set of MAES indicators in Greece and provides the first test of its guidelines. The results revealed that indicators using well-developed biodiversity datasets in combination with ecosystem extent data could provide the baseline for ecosystem condition assessment, ecosystem asset delineation, and support operational MAES studies. The relation among biodiversity, ecosystem condition, and ecosystem services is not a linear equation and detailed, fine-scale assessments are needed to identify and interpret all aspects of biodiversity. The results pinpoint areas of importance throughout Greece and provide guidance for case-study selection, conservation strategy, and decision-making under the perspective of national and EU environmental policies.

Supplementary Materials

The following are available online at https://www.mdpi.com/1999-4907/11/9/956/s1, Table S1: Detailed data information for each grid cell used for the analyses.

Author Contributions

Conceptualization, K.K., I.P.K. and P.D.; methodology, K.K., I.P.K. and P.D.; validation, K.K., I.P.K. and P.D.; formal analysis, K.K. and I.P.K.; investigation, K.K. and I.P.K.; resources, A.S. and P.D.; data curation, K.K., I.P.K., A.S. and P.D.; writing—original draft preparation, K.K. and I.P.K.; writing—review and editing, K.K., I.P.K., A.S. and P.D.; visualization, K.K. and I.P.K.; supervision, P.D.; project administration, P.D.; funding acquisition, P.D. All authors have read and agreed to the published version of the manuscript.

Funding

This research was funded by the European Commission LIFE Integrated Project, LIFE-IP 4 NATURA “Integrated Actions for the Conservation and Management of Natura 2000 sites, species, habitats and ecosystems in Greece”, Grant Number: LIFE 16 IPE/GR/000002.

Conflicts of Interest

The authors declare no conflict of interest.

References

  1. Westman, W.E. How much are nature’s services worth? Science 1977, 197, 960–964. [Google Scholar] [CrossRef] [PubMed]
  2. Ehrlich, P.; Ehrlich, A. Extinction: The Causes and Consequences of the Disappearance of Species; Random House: New York, NY, USA, 1981. [Google Scholar]
  3. De Groot, R.S. Environmental functions as a unifying concept for ecology and economics. Environmentalist 1987, 7, 105–109. [Google Scholar] [CrossRef]
  4. Fisher, B.; Turner, R.K.; Morling, P. Defining and classifying ecosystem services for decision making. Ecol. Econ. 2009, 68, 643–653. [Google Scholar] [CrossRef] [Green Version]
  5. Costanza, R.; de Groot, R.; Sutton, P.; van der Ploeg, S.; Anderson, S.J.; Kubiszewski, I.; Farber, S.; Turner, R.K. Changes in the global value of ecosystem services. Glob. Environ. Chang. 2014, 26, 152–158. [Google Scholar] [CrossRef]
  6. Costanza, R.; de Groot, R.; Braat, L.; Kubiszewski, I.; Fioramonti, L.; Sutton, P.; Farber, S.; Grasso, M. Twenty years of ecosystem services: How far have we come and how far do we still need to go? Ecosyst. Serv. 2017, 28, 1–16. [Google Scholar] [CrossRef]
  7. Maes, J.; Teller, A.; Erhard, M.; Liquete, C.; Braat, L.; Berry, P.; Egoh, B.; Puydarrieus, P.; Fiorina, C.; Santos, F.; et al. Mapping and Assessment of Ecosystem and Their Services. An Analytical Framework for Ecosystem Assessments under Action 5 of the EU Biodiversity Strategy to 2020; Publications office of the European Union: Luxemburg, 2013; ISBN 9789279293696. [Google Scholar]
  8. Millennium Ecosystem Assessment. Ecosystems and Human Well-Being: Synthesis; Island Press: Washington, DC, USA, 2005; ISBN 1-59726-040-1. [Google Scholar]
  9. Czúcz, B.; Arany, I.; Potschin-Young, M.; Bereczki, K.; Kertész, M.; Kiss, M.; Aszalós, R.; Haines-Young, R. Where concepts meet the real world: A systematic review of ecosystem service indicators and their classification using CICES. Ecosyst. Serv. 2018, 29, 145–157. [Google Scholar] [CrossRef]
  10. IPEBS. Global Assessment Report on Biodiversity and Ecosystem Services of the Intergovernmental Science-Policy Platform on Biodiversity and Ecosystem Services; Brondizio, E.S., Settele, J., Díaz, S., Ngo, H., Eds.; IPBES Secretariat: Bonn, Germany, 2019. [Google Scholar]
  11. European Commission EU Biodiversity Strategy for 2030: Bringing Nature Back into Our Lives; Communication from the Commission to the European Parliament, the Council, the European Economic and Social Committee and the Committee of the Regions: Brussels, Belgium, 2020; pp. 1–22, COM/2020/380 final.
  12. The European Green Deal. Communication from the Commission to the European Parliament, the European Council, the Council, the European Economic and Social Committee and the Committee of the Regions; The European Green Deal: Brussels, Belgium, 2019. [Google Scholar]
  13. Willemen, L.; Burkhard, B.; Crossman, N.; Drakou, E.G.; Palomo, I. Editorial: Best practices for mapping ecosystem services. Ecosyst. Serv. 2015, 13, 1–5. [Google Scholar] [CrossRef]
  14. Mace, G.M.; Norris, K.; Fitter, A.H. Biodiversity and ecosystem services: A multilayered relationship. Trends Ecol. Evol. 2012, 27, 19–26. [Google Scholar] [CrossRef]
  15. Braat, L.; ten Brink, P. The Cost of Policy Inaction: The Case not Meeting the 2010 Biodiversity Target; Alterra: Wageningen, The Netherlands, 2008. [Google Scholar]
  16. Harrison, P.A.; Berry, P.M.; Simpson, G.; Haslett, J.R.; Blicharska, M.; Bucur, M.; Dunford, R.; Egoh, B.; Garcia-Llorente, M.; Geamănă, N.; et al. Linkages between biodiversity attributes and ecosystem services: A systematic review. Ecosyst. Serv. 2014, 9, 191–203. [Google Scholar] [CrossRef] [Green Version]
  17. Grunewald, K.; Syrbe, R.U.; Walz, U.; Richter, B.; Meinel, G.; Herold, H.; Marzelli, S. Germany’s Ecosystem Services–State of the Indicator Development for a Nationwide Assessment and Monitoring. One Ecosyst. 2017, 2, e14021. [Google Scholar] [CrossRef] [Green Version]
  18. Steur, G.; Verburg, R.W.; Wassen, M.J.; Verweij, P.A. Shedding light on relationships between plant diversity and tropical forest ecosystem services across spatial scales and plot sizes. Ecosyst. Serv. 2020, 43, 101107. [Google Scholar] [CrossRef]
  19. Alkemade, R.; Burkhard, B.; Crossman, N.D.; Nedkov, S.; Petz, K. Quantifying ecosystem services and indicators for science, policy and practice. Ecol. Indic. 2014, 37, 161–162. [Google Scholar] [CrossRef]
  20. Crossman, N.D.; Burkhard, B.; Nedkov, S.; Willemen, L.; Petz, K.; Palomo, I.; Drakou, E.G.; Martín-Lopez, B.; McPhearson, T.; Boyanova, K.; et al. A blueprint for mapping and modelling ecosystem services. Ecosyst. Serv. 2013, 4, 4–14. [Google Scholar] [CrossRef]
  21. Burkhard, B.; Crossman, N.; Nedkov, S.; Petz, K.; Alkemade, R. Mapping and modelling ecosystem services for science, policy and practice. Ecosyst. Serv. 2013, 4, 1–3. [Google Scholar] [CrossRef]
  22. Feld, C.K.; Sousa, J.P.; da Silva, P.M.; Dawson, T.P. Indicators for biodiversity and ecosystem services: Towards an improved framework for ecosystems assessment. Biodivers. Conserv. 2010, 19, 2895–2919. [Google Scholar] [CrossRef]
  23. Maes, J.; Teller, A.; Erhard, M.; Grizzetti, B.; Barredo, J.I.; Paracchini, M.L.; Condé, S.; Somma, F.; Orgiazzi, A.; Jones, A.; et al. Mapping and Assessment of Ecosystems and their Services: An Analytical Framework for Mapping and Assessment of Ecosystem Condition in EU; Publications office of the European Union: Luxemburg, 2018; ISBN 978-92-79-74288-0. [Google Scholar]
  24. Van Reeth, W. Ecosystem Service Indicators in Flanders: Are We Measuring What We Want to Manage? Rapporten van het Instituut voor Natuur-en Bosonderzoek; Instituut voor Natuuren Bosonderzoek: Belgium, Brussel, 2014. [Google Scholar]
  25. Bratanova-Doncheva, S.; Chipev, N.; Gocheva, K.; Stoyan, V.; Fikova, R. Methodological Framework for Assessment and Mapping of Ecosystem Condition and Ecosystem Services in Bulgaria. Conceptual Bases and Principles of Application. 2017. Available online: https://www.researchgate.net/publication/329773739_METHODOLOGICAL_FRAMEWORK_FOR_ASSESSMENT_AND_MAPPING_OF_ECOSYSTEM_CONDITION_AND_ECOSYSTEM_SERVICES_IN_BULGARIA_Part_A_Conceptual_basis_and_principles_of_application (accessed on 30 July 2020).
  26. Kokkoris, I.P.; Mallinis, G.; Bekri, E.S.; Vlami, V.; Zogaris, S.; Chrysafis, I.; Mitsopoulos, I.; Dimopoulos, P. National set of MAES indicators in Greece: Ecosystem services and management implications. Forests 2020, 11, 595. [Google Scholar] [CrossRef]
  27. Hein, L.; Obst, C.; Edens, B.; Remme, R.P. Progress and challenges in the development of ecosystem accounting as a tool to analyse ecosystem capital. Curr. Opin. Environ. Sustain. 2015, 14, 86–92. [Google Scholar] [CrossRef]
  28. United Nations; European Commission; Food and Agricultural Organization of the United Nations; Organization for Economic Co-operation and Development; World Bank. System of Environmental-Economic Accounting 2012: Experimental Ecosystem Accounting; The World Bank: Washington, DC, USA, 2014; ISBN 9789210559263. [Google Scholar]
  29. United Nations. Technical Recommendations in Support of the System of Environmental-Economic Accounting 2012-Experimental Ecosystem Accounting; United Nations: New York, NY, USA, 2019. [Google Scholar]
  30. Remme, R.P.; Hein, L.; Van Swaay, C.A.M. Exploring spatial indicators for biodiversity accounting. Ecol. Indic. 2016, 70, 232–248. [Google Scholar] [CrossRef]
  31. LIFE-IP 4 Natura-Integrated Actions for the Conservation and Management of Natura 2000 Sites, Species, Habitats and Ecosystems in Greece (LIFE16 IPE/GR/000002). Available online: https://ec.europa.eu/environment/life/project/Projects/index.cfm?fuseaction=search.dspPage&n_proj_id=6520 (accessed on 30 July 2020).
  32. European Environment Agency Forest Information System for Europe: Greece. Available online: https://forest.eea.europa.eu/countries/greece (accessed on 30 July 2020).
  33. Kokkoris, I.P.; Dimopoulos, P.; Xystrakis, F.; Tsiripidis, I. National scale ecosystem condition assessment with emphasis on forest types in Greece. One Ecosyst. 2018, 3, e25434. [Google Scholar] [CrossRef] [Green Version]
  34. Kokkoris, I.P.; Drakou, E.G.; Maes, J.; Dimopoulos, P. Ecosystem services supply in protected mountains of Greece: Setting the baseline for conservation management. Int. J. Biodivers. Sci. Ecosyst. Serv. Manag. 2018, 14, 45–59. [Google Scholar] [CrossRef] [Green Version]
  35. Obst, C.; Brooks, T.; Maes, J.; Czucz, B.; Nicholson, E.; Alfieri, A.; Javorsek, M. Options for Incorporating biodiversity in the SEEA. In Proceedings of the 2019 Forum of Experts in SEEA Experimental Ecosystem Accounting, Glen Cove, NY, USA, 26–27 June 2019; United Nations, UN Environment, The World Bank, European Union: Geln Cove, NY, USA, 2019; pp. 1–12. [Google Scholar]
  36. European Comission. Natural Capital Accounting: Overview and Progress in the European Union (6th Report–Final); Publications office of the European Union: Luxemburg, 2019; ISBN 978-92-79-89744-3. [Google Scholar]
  37. EEA Reference Grid. Available online: https://www.eea.europa.eu/data-and-maps/data/eea-reference-grids-2 (accessed on 12 April 2020).
  38. CORINE Land Cover. Available online: https://land.copernicus.eu/pan-european/corine-land-cover (accessed on 12 April 2020).
  39. Dimopoulos, P.; Raus, T.; Strid, A. Flora of Greece Web: Vascular Plants of Greece an Annotated Checklist. Available online: http://portal.cybertaxonomy.org/flora-greece/intro (accessed on 12 May 2020).
  40. Dimopoulos, P.; Raus, T.; Bergmeier, E.; Constantinidis, T.; Iatrou, G.; Kokkini, S.; Strid, A.; Tzanoudakis, D. Vascular plants of Greece: An annotated checklist. Englera 2013, 31, 370. [Google Scholar]
  41. Dimopoulos, P.; Raus, T.; Bergmeier, E.; Constantinidis, T.; Iatrou, G.; Kokkini, S.; Strid, A.; Tzanoudakis, D. Vascular plants of Greece: An annotated checklist. Supplement. Willdenowia 2016, 46, 301–347. [Google Scholar] [CrossRef] [Green Version]
  42. Arne, S.; Tan, K. Flora Hellenica; Koeltz: Königstein, Germany, 1997. [Google Scholar]
  43. European Union CORINE Land Cover Nomeclature. Available online: https://land.copernicus.eu/user-corner/technical-library/corine-land-cover-nomenclature-guidelines/html (accessed on 30 July 2020).
  44. Quijas, S.; Schmid, B.; Balvanera, P. Plant diversity enhances provision of ecosystem services: A new synthesis. Basic Appl. Ecol. 2010, 11, 582–593. [Google Scholar] [CrossRef] [Green Version]
  45. Balvanera, P.; Pfisterer, A.B.; Buchmann, N.; He, J.S.; Nakashizuka, T.; Raffaelli, D.; Schmid, B. Quantifying the evidence for biodiversity effects on ecosystem functioning and services. Ecol. Lett. 2006, 9, 1146–1156. [Google Scholar] [CrossRef] [PubMed] [Green Version]
  46. Costanza, R.; Fisher, B.; Mulder, K.; Liu, S.; Christopher, T. Biodiversity and ecosystem services: A multi-scale empirical study of the relationship between species richness and net primary production. Ecol. Econ. 2007, 61, 478–491. [Google Scholar] [CrossRef]
  47. Hein, L.; Bagstad, K.; Edens, B.; Obst, C.; De Jong, R.; Lesschen, J.P. Defining ecosystem assets for natural capital accounting. PLoS ONE 2016, 11, e0164460. [Google Scholar] [CrossRef] [Green Version]
  48. Haines-Young, R.; Potschin, M. Common International Classification of Ecosystem Services (CICES): 2011 Update. In Report to the European Environmental Agency; The University of Nottingham: Nottingham, UK, 2011. [Google Scholar]
  49. Kokkoris, I.P.; Bekri, E.S.; Skuras, D.; Vlami, V.; Zogaris, S.; Maroulis, G.; Dimopoulos, D.; Dimopoulos, P. Integrating MAES implementation into protected area management under climate change: A fine-scale application in Greece. Sci. Total Environ. 2019, 695, 133530. [Google Scholar] [CrossRef]
  50. Kougioumoutzis, K.; Kokkoris, I.P.; Panitsa, M.; Trigas, P.; Strid, A.; Dimopoulos, P. Plant Diversity Patterns and Conservation Implications under Climate-Change Scenarios in the Mediterranean: The Case of Crete (Aegean, Greece). Diversity 2020, 12, 270. [Google Scholar] [CrossRef]
  51. Kougioumoutzis, K.; Kokkoris, I.P.; Panitsa, M.; Trigas, P.; Strid, A.; Dimopoulos, P. Spatial Phylogenetics, Biogeographical Patterns and Conservation Implications of the Endemic Flora of Crete (Aegean, Greece) under Climate Change Scenarios. Biology 2020, 9, 199. [Google Scholar] [CrossRef]
  52. Lyashevska, O.; Farnsworth, K.D. How many dimensions of biodiversity do we need? Ecol. Indic. 2012, 18, 485–492. [Google Scholar] [CrossRef]
  53. Cheminal, A.; Kokkoris, I.P.; Strid, A.; Dimopoulos, P. Medicinal and aromatic lamiaceae plants in greece: Linking diversity and distribution patterns with ecosystem services. Forests 2020, 11, 661. [Google Scholar] [CrossRef]
  54. Kallimanis, A.S.; Mazaris, A.D.; Tsakanikas, D.; Dimopoulos, P.; Pantis, J.D.; Sgardelis, S.P. Efficient biodiversity monitoring: Which taxonomic level to study? Ecol. Indic. 2012, 15, 100–104. [Google Scholar] [CrossRef]
  55. Lyytimäki, J.; Sipilä, M. Hopping on one leg-The challenge of ecosystem disservices for urban green management. Urban For. Urban Green. 2009, 8, 309–315. [Google Scholar] [CrossRef]
  56. Panitsa, M.; Iliadou, E.; Kokkoris, I.; Kallimanis, A.; Patelodimou, C.; Strid, A.; Raus, T.; Bergmeier, E.; Dimopoulos, P. Distribution patterns of ruderal plant diversity in Greece. Biodivers. Conserv. 2020, 29, 869–891. [Google Scholar] [CrossRef]
  57. Badalamenti, E.; Cusimano, D.; La Mantia, T.; Pasta, S.; Romano, S.; Troia, A.; Ilardi, V. The ongoing naturalisation of Eucalyptus spp. in the Mediterranean Basin: New threats to native species and habitats. Aust. For. 2018, 81, 239–249. [Google Scholar] [CrossRef]
  58. Spanos, K.; Gaitanis, D.; Skouteri, A.; Petrakis, P.; Meliadis, I. Implementation of Forest Policy in Greece in Relation to Biodiversity and Climate Change. Open J. Ecol. 2018, 8, 174–191. [Google Scholar] [CrossRef] [Green Version]
Figure 1. Graphical representation of a 10 × 10 EEA (Experimental Ecosystem Accounting) reference grid cell that includes four different ecosystem types, i.e., A, B, C, D.
Forests 11 00956 g001
Figure 2. Methodological flowchart for developing and assessing ecosystem asset proxy indicators.
Forests 11 00956 g002
Figure 3. Thematic representation for ‘woodland and forest’ ecosystem type extent at the 10 × 10 EEA reference grid level: (a) Ecosystem extent expressed as the total area of woodland and forest per cell; (b) ecosystem extent expressed as the relative area of woodland and forest per cell, i.e., woodland and forest area per cell divided by the total area of woodland and forest in each floristic region (normalized). Floristic regions of Greece [40,42] are also depicted: East Aegean islands (EAe), East Central Greece (EC), Ionian Islands (IoI), Kriti and Karpathos (KK), Kiklades (KiK), North Aegean islands (Nae), North Pindos (Npi), North Central Greece (NC), North-East Greece (NE), Peloponnisos (Pe), South Pindos (Spi), Sterea Ellas (StE), West Aegean islands (Wae).
Forests 11 00956 g003
Figure 4. Thematic representation for ‘woodland and forest’ ecosystem type species richness at the 10 × 10 EEA reference grid level: (a) Number of species present in woodland and forest per cell; (b) relative number of species present in woodland and forest per cell, i.e., number of plant species present in woodland and forest per cell divided by the number of plant species present in woodland and forest in each floristic region (normalized). Floristic regions of Greece [40,42] are also depicted: East Aegean islands (EAe), East Central Greece (EC), Ionian Islands (IoI), Kriti and Karpathos (KK), Kiklades (KiK), North Aegean islands (NAe), North Pindos (NPi), North Central Greece (NC), North-East Greece (NE), Peloponnisos (Pe), South Pindos (SPi), Sterea Ellas (StE), West Aegean islands, (WAe).
Forests 11 00956 g004
Figure 5. Thematic representation for ‘woodland and forest’ ecosystem type species richness categories at the 10 × 10 EEA reference grid level: (a) Relative number of species exclusively present in woodland and forest per cell, i.e., number of plant species exclusively present in woodland and forest per cell divided by the number of plant species exclusively present in woodland and forest in each floristic region (normalized); (b) relative number of endemic plant species present in woodland and forest per cell, i.e., number of plant species present in woodland and forest per cell divided by the number of endemic plant species present in woodland and forest in each floristic region (normalized); (c) relative number of endemic plant species exclusively present in woodland and forest per cell, i.e., number of endemic plant species exclusively present in woodland and forest per cell divided by the number of endemic plant species exclusively present in woodland and forest in each floristic region (normalized). Floristic regions of Greece [40,42] are also depicted: East Aegean islands (EAe), East Central Greece (EC), Ionian Islands (IoI), Kriti and Karpathos (KK), Kiklades (KiK), North Aegean islands (Nae), North Pindos (Npi), North Central Greece (NC), North-East Greece (NE), Peloponnisos (Pe), South Pindos (Spi), Sterea Ellas (StE), West Aegean islands, (Wae).
Forests 11 00956 g005
Figure 6. Thematic representation of the four ecosystem asset proxy indicators: (a) Total plant species index; (b) total plant species exclusively present in woodland and forest index; (c) endemic species index; (d) endemic species exclusively present in woodland and forest index. Floristic regions of Greece [31,34] are also depicted: East Aegean islands (EAe), East Central Greece (EC), Ionian Islands (IoI), Kriti and Karpathos (KK), Kiklades (KiK), North Aegean islands (NAe), North Pindos (NPi), North Central Greece (NC), North-East Greece (NE), Peloponnisos (Pe), South Pindos (SPi), Sterea Ellas (StE), West Aegean islands, (WAe).
Forests 11 00956 g006
Figure 7. The general ecosystem accounting model, as proposed by SEEA-EEA [28] (redesigned).
Forests 11 00956 g007
Table 1. Description of the proposed method for species-richness calculations for the four plant diversity categories.
Plant Diversity CategoriesCalculation
Total species richness N u m b e r   o f   s p e c i e s   s u p p o r t e d   b y   t h e   e c o s y s t e m   a t   t h e   c e l l   l e v e l N u m b e r   o f   s p e c i e s   s u p p o r t e d   b y   t h e   e c o s y s t e m   i n   t h e   f l o r i s t i c   r e g i o n
Richness of species exclusively present in the ecosystem type N u m b e r   o f   s p e c i e s   p r e s e n t   e x c l u s i v e l y   i n   t h e   e c o s y s t e m   a t   t h e   c e l l   l e v e l N u m b e r   o f   s p e c i e s   p r e s e n t   e x c l u s i v e l y   i n   t h e   e c o s y s t e m   i n   t h e   f l o r i s t i c   r e g i o n
Endemic species richness N u m b e r   o f   e n d e m i c   s p e c i e s   p r e s e n t   i n   t h e   e c o s y s t e m   a t   t h e   c e l l   l e v e l N u m b e r   o f   e n d e m i c   s p e c i e s   p r e s e n t   i n   t h e   e c o s y s t e m   i n   t h e   f l o r i s t i c   r e g i o n
Richness of endemic species exclusively present in the ecosystem type N u m b e r   o f   e n d e m i c   s p e c i e s   e x c l u s i v e l y   p r e s e n t   i n   t h e   e c o s y s t e m   a t   t h e   c e l l   l e v e l N u m b e r   o f   e n d e m i c   s p e c i e s   e x c l u s i v e l y   p r e s e n t   i n   t h e   e c o s y s t e m   a t   t h e   f l o r i s t i c   r e g i o n
Table 2. Correspondence between ecosystem types (MAES level 2), Corine Land Cover classes ecosystem types, and habitats of the vascular plants of Greece. The total number of species present in each category is also presented.
Ecosystem Types (MAES Level 2) [7]CORINE Land Cover Classes [7,43]Habitats of Vascular Plants of Greece (Code) [39,40,41]Plant Species (Number)
Cropland2.1.1., 2.1.2., 2.1.3., 2.2.1., 2.2.2., 2.2.3., 2.4.1., 2.4.2., 2.4.3., 2.4.4.Agricultural and ruderal habitats (R)1868
Grassland2.3.1., 3.2.1.High mountain vegetation (H)1385
Woodland and forest3.1.1., 3.1.2., 3.2.4.Woodlands and scrub (W)1506
Heathland and shrub3.2.2., 3.2.3Temperate and sub-Mediterranean grasslands (G)1927
Xeric Mediterranean phrygana and grasslands (P)1608
Sparsely vegetated land3.3.2., 3.3.3., 3.3.4.Cliffs, rocks, walls, ravines, boulders (C)959
3.3.1.Coastal habitats (M)483
Wetlands4.1.1., 4.1.2., 4.2.1., 4.2.2.Freshwater habitats (A)931
Table 3. Woodland and forest area (km2) and cover (%) in each floristic region of Greece.
Floristic Regions of Greece (Code)Woodland and Forest Area Per Floristic Region (km2)Woodland and Forest Cover Per Region (%)
East Aegean islands (EAe)1398.723.43%
East Central Greece (EC)1119.012.75%
Ionian Islands (IoI)301.120.74%
Kriti and Karpathos (KK)680.631.67%
Kiklades (KiK)20.080.05%
North Aegean islands (NAe)175.340.43%
North Pindos (NPi)4927.7212.10%
North Central Greece (NC)5961.8314.64%
North-East Greece (NE)10,518.5225.82%
Peloponnisos (Pe)4610.1711.32%
South Pindos (SPi)4911.5112.06%
Sterea Ellas (StE)4539.9511.15%
West Aegean islands (WAe)1570.033.85%
Total40,734.63100.00%
Data source: CORINE Land Cover dataset, 2018 [38].

