Article

Variability among Sites and Climate Models Contribute to Uncertain Spruce Growth Projections in Denmark

1
Collaborative Innovation Center of Sustainable Forestry in Southern China of Jiangsu Province, Bamboo Research Institute, Nanjing Forestry University, Nanjing 210037, China
2
Department of Geosciences and Natural Resource Management, The University of Copenhagen, Rolighedsvej 23, DK-1958 Frederiksberg C, Denmark
3
Swiss Federal Institute for Forest, Snow and Landscape Research WSL, Zürcherstrasse 111, CH-8903 Birmensdorf, Switzerland
4
Nanjing Forestry University, Nanjing 210037, China
*
Author to whom correspondence should be addressed.
Forests 2021, 12(1), 36; https://doi.org/10.3390/f12010036
Submission received: 12 December 2020 / Revised: 23 December 2020 / Accepted: 24 December 2020 / Published: 30 December 2020
(This article belongs to the Section Forest Ecology and Management)

Abstract

:
Projecting trees species growth into future climate is subject to large uncertainties and it is of importance to quantify the different sources (e.g., site, climate model) to prioritize research efforts. This study quantifies and compares sites and climate model-induced uncertainties in projected Norway spruce growth from Denmark. We analyzed tree-rings from 340 Norway spruce trees sampled in 14 planted stands (1. Plantation; period 1950–1987) and additionally 36 trees from six trials in a common garden experiment (2. Common garden; period 1972–2012). Growth-climate correlations were estimated and multiple linear and nonlinear regression models relating growth with climate were tested. Tree growth was projected up to 2100 applying multiple linear or quadratic regression models based on the 15 Atmosphere-Ocean General Circulation Models (AOGCMs) of the Coupled Model Inter-comparison Project Phase 5 (CMIP5). The climate-growth models showed that summer drought and warm previous-year late-summer and early-autumn constrain growth. In some stands, warm springs affected growth positively. The projections of growth under future climates on average showed from no to slightly negative changes in growth compared to present growth rates. However, projections showed a very large variation, ranging from highly positive to highly negative growth changes. The uncertainties due to variation in site responses and in climate models were substantial. A lesser degree of uncertainty was related to the emission scenarios. Even though our projections on average suggest that Norway spruce may experience a growth reduction in the future, the tremendous variation in growth predictions due to differences between stands and climate models calls for further research and caution when projections are interpreted. These results also suggest that forest managers in general should avoid the use of Norway spruce on exposed and drought prone sites and as an additional resilience measure primarily use it in mixtures with other more climate tolerant species.

1. Introduction

During the recent decades, there has been a continuous effort to develop models simulating future climate considering diversified scenarios of greenhouse gas and aerosol concentrations [1,2]. For example, the Coupled Model Inter-comparison Project Phase 5 (CMIP5) has integrated a larger number of more complex models including more external forces, running at higher resolution, and considering more scenarios and diagnostics compared with CMIP3 [3]. These scenarios have become important tools for assessing the impact of climate change, including forests ecosystems. Based on such frameworks, many studies have projected that climate change will lead to tree species distribution shifts [4,5,6,7], increases or decreases of growth [8,9,10] and changes in tree species composition [11].
Climate model predictions, however, are subject to various uncertainties. On the one hand, climate models have challenges in predicting climate extremes due to internal and inter-model variability [12]. In addition, bias was showed in the study on 24 CMIP5 models by comparing the observed and simulated data during 1901–2005, as 12 models overestimated the warming trend by 1–3 °C, and others underestimated the warming by 0–1 °C in Northern Eurasia [2]. On the other hand, the differences between climate model outputs can be considerable.
As projections of future forest growth, distribution and composition are usually based on these climate models, they inherently carry these uncertainties. However, there are also other sources of uncertainties in predictions related to tree and stand sampling design, such as imbalances across regional transects, altitudinal gradients and other ecological gradients, or due to stands having different ages, levels of competition or structure [8,13,14,15,16,17,18,19]. Yet another source of variation can be that the climatic signal in tree rings change over time. For example, the increasing concentrations of CO2 could change how trees react to climate [20,21], and it is possible that a changed climate itself will lead to changed climate-growth responses.
Recent studies based on the assessment of current associations between climate and tree growth via multilinear regression models have been able to estimate future growth changes at intra-seasonal level using climate projections from model ensembles [8,9,10]. However, neither the components of uncertainties related to differing climate model nor the effects of differing site conditions have been quantified. Assessing the relative contribution into the projected growth of these two components is of relevance for quantifying the role of active management decisions (e.g., site and provenance selection and silvicultural measures).
Norway spruce (Picea abies (L.) Karst.) is one of the most common and important tree species in the Boreal and subalpine forests [22], and distributed widely from central (both in mountain habitats and lowland sites) to Northern and Eastern Europe [6,23]. In Denmark, Norway spruce is an exotic tree species, but widely planted at more poor and sandy soil land in west Denmark [24]. It grows on 19% of the forest area in Denmark and outperforms two indigenous tree species, beech (Fagus sylvatica L.) and oak (Quercus robur L. and Quercus petraea (Matt.) Liebl.) [25].
Previous studies have found that Norway spruce growth is sensitive to drought [9,26,27,28] and elevated temperatures [29]. In Europe, drought-induced mortality and growth reduction have been reported in this species from the Mediterranean regions to Central Europe and even further to northern Scandinavia [28,30,31,32,33,34]. In addition, its growth might be negatively affected by the high late summer and early autumn temperatures [9,29,35,36,37].
The aim of the current study is to project future Norway spruce growth across both plantation and common garden sites within Denmark (a relatively small and homogeneous geographical region compared to the full distribution area of the species), and to attribute uncertainties in projections to variation among climatic models and site-related climate responses.

2. Materials and Methods

2.1. Sampled Sites and Trees

For our analysis, we applied two sets of data. The first set of data (dataset 1) was based on increment cores collected in 1987 from 340 trees in 14 planted stands of eight Norway spruce sites (forests and plantations). An overview of the sampling locations is given in Figure 1. The trees were selected to start a new breeding population in the Danish breeding program of Norway spruce. The selected plus-trees were dominant or codominant in the stands. At the time of sampling, ages of the stands ranged from 28 to 53 y since establishment (Table 1). The stands are located in the western parts of Denmark and consist of at least the second generation of Danish landraces, presumably of different provenances of German origin. Ten of the stands are located in plantations established on heathland with sandy podzols (Fårhus Plantage, Lundbæk plantage, Kelstrup plantage, Bommerlund plantage and Rens Hedegård). The remaining four stands (Buderupholm / Hollandshus, Silkeborg and Mattrup) are located in forest areas with sandy moraine and presumably better nutrient status and water holding capacity compared to the 10 stands at sandy podzols. Mean annual temperatures at the sites range between 7.4 and 7.8 °C, and annual precipitation vary from 651 to 823 mm based on E-OBS estimates from 0.25° grids over the period 1950–1987 [38].
The second set of data (dataset 2; in total 36 sampled trees) originates from Norway spruce stem discs taken from a Danish common garden experiment with 8–10 commonly used tree species in Danish forestry, covering six trials in Denmark sampled in winter 2012 [9]. At the time of sampling, these trees were 48 years old. Mean annual temperature at the trials ranges between 8.0 °C and 8.7 °C, and annual precipitation ranges between 536 and 748 mm based on E-OBS estimates over period 1961–2012. In total, four of the experiments were established on cropland with sandy soils and sandy loam, one experiment was established near the west coast on sandy soil/dunes, and the last was established on heathland (see Huang et al. [9] for more information).

2.2. Tree-Ring Width Measurements and Analysis

The first set of data was obtained from two bark-to-bark wood cores sampled at stem breast height of each tree for ring-width measurements. Ring width was measured on all the increment cores from the 340 plus-trees and at that time using a stereomicroscope with a ruler etched on it. For the climate response modeling we used the years 1950 to 1987.
The second set of data was obtained from stem discs taken at breast height from six trees per site. A flatbed distortion-free scanner (Epson, Expression 11000XL) was used to collect digital images of the disc surfaces and the ring width was measured using the WinDendro software [39]. For the climate response modeling we used the years 1972 to 2012, making all the series cover the same period [9].
Each individual time-series was visually cross-dated and dating was verified using the computer program COFECHA [40]. Individual tree-ring width series were detrended using a 10-year cubic smoothing spline to preserve high-frequency climatic information, while removing age/size trends [41]. Chronologies were built using a bi-weight robust mean of the detrended tree-ring width (RWI) series [42]. The mean inter-tree correlation (Rbar) and the expressed population signal (EPS) were estimated to evaluate the degree of common yearly variations in the detrended chronologies. Data processing and analysis were performed with the R-package Dendrochronology Program Library R (dplR) within the R environment [43].

2.3. Climate-Growth Relationships

Mean monthly temperature (Tg) and sum of monthly precipitation (P) were obtained from E-OBS 0.25° grid estimates [38]. Monthly drought indices (DI) were calculated as DI = P (in mm) / (Tg (in °C) + 10) according to De Martonne [44] and used along with monthly temperatures as explanatory climate variables. The sites of Fårhus (Faarh), Bommerlund (Bom) and Kelstrup (Ke) as well as Lundbæk (Lundb) plantage and Rens Hedegård (Rh) shared the same climate grid cell (Table 1 and Figure 1).
Correlations between RWI and monthly climate variables from previous year June to current year September were estimated using the R package “bootRes”, which contains functions for calculating bootstrapped response and correlation functions for use in dendroclimatology [45]. The statistical significances of the estimated correlation coefficients were assessed by calculating 95% confidence levels based on 1000 bootstrapped resamples.

2.4. Multiple Regression Models to Assess the Climatic Response

For the growth projections into future climate scenarios, we used multiple regression models based on monthly or multi-months climatic variables to achieve the best fits to the ring-width indices of each stand/trial.
As climatic variables, we used monthly or multi-months average temperatures (Tg) and cumulated drought indices (DI) observed over the period 1950–1987 (1. Plantation) and 1972–2012 (2. Common garden). Due to the large number of explanatory variables, a pre-selection of climate variables was performed based on climate-growth regressions and the Akaike information criterion (AIC) [46]. The MIXED procedure of SAS [47] was used to estimate AIC. Based on the response correlations from bootstrapping, the monthly temperatures were sorted into three groups, i.e., group 1, from previous June to current January; group 2, current March to May; group 3, current June to August. Monthly drought indices were sorted into three groups, i.e., group 1, from previous March to November; group 2, previous December to current January; group 3, current March to September.
The models we developed for pre-selecting climate variables was performed as follows:
R W I j = η + θ 1 x 1 j + λ 1 x 1 j 2 + ε j
where R W I j is the mean tree-ring index in each stand and year j, η is the general mean, x 1 j is the climate variable in year j, θ 1 is the coefficient for the climate variable, x 1 j 2 is the quadratic climate variable in year j, λ 1 is the coefficient for the quadratic climate variable, and ε j is the error item. Monthly and multi-months average temperatures and cumulated drought indices with lowest AIC value within each group (in total six groups) were selected for model (2).
To select the climatic variables best explaining Norway spruce growth, we tested a number of linear models and polynomials with increasing number of explanatory climate variables. The additional explaining climate variables were considered if they improved the AIC, derived from the Log-likelihood and number of variables of the model [46]. The MIXED procedure of SAS [47] was used to estimate AIC.
The models we developed for each stand relating RWI to climate variables had the form:
R W I j = µ + β 1 X 1 j + α 1 X 1 j 2 + β 2 X 2 j + α 2 X 2 j 2   +   β 6 X 6 j + α 6 X 6 j 2 + e j
where R W I j is the mean tree-ring index in each stand and year j, µ is the general mean, X 1 j X 6 j are climate variables 1 to 6 in year j, β 1 β 6 are coefficients for climate variables 1 to 6, X 1 j 2 X 6 j 2 are the quadratic climate variable 1 to 6 in year j, α 1 α 6 are coefficients for quadratic climate variables 1 to 6, and e j is the error item.
Regression coefficients from univariate analysis with the selected explanatory variables were compared with those from the multiple regression analysis to check multicollinearity in the models and were supported by estimation of variance inflation factors (VIF) using the procedure REG of SAS, which was also used to estimate R2-values [47,48]. Plots of residuals as a function of the predicted values revealed no heteroscedasticity and the residuals plotted as function of predicted values did not indicate any non-linear relationship not explained by polynomials. Plots of residuals as a function of age did not show any signs of bias in the residuals for younger or older ages (not shown). According to Burnham and Anderson [46], models can be considered if the difference between the AIC-values of the models is less than 2 (Δi ≤ 2) from the model with lowest AIC-value. Thus, results are shown for models with lowest AIC-values as well as models with higher AIC-values, but with Δi ≤ 2.

2.5. Prediction of Future Growth of Norway Spruce

The projections of tree growth under future climatic conditions were made for each stand by using the regression models with the lowest AICs, provided that all the climate variables included were significant (P < 0.05). Thus site 1013, whose projection included only non-significant climate variables, was not used. Furthermore, the projection model of stand Ma was omitted since the quadratic lag1tg612 variable (mean temperature June-December previous year) made the projected growth negative.
Climate estimates used for the projections of future climate for the different sites were taken from the 15 Atmosphere-Ocean General Circulation Model (AOGCMs) of the CMIP5 multi-model (corresponding to the 5th IPCC Assessment Report [49]) considering the emission scenarios RCP4.5 and 8.5 (Representative Concentration Pathway 4.5 and 8.5), which are available at http://tinyurl.com/ClimateEU. The climate estimates were given by ClimateEU v4.63 software package, based on methodology described by Hamann et al. [50]. The projection models above were applied to predict the percentage deviation of future mean RWI in comparison to the most recent 20-year reference period from 1991–2009 available from the ClimateEU v4.63 software package, i.e.,
F D ( % ) = ( P D f   P D c )   ×   100 P D c
where FD (%) is the percentage change in growth for the three periods 2011–2040, 2041–2070 and 2071–2100 compared with the reference period 1991–2009; P D f is the predicted growth in the future three-time windows; P D c is the predicted growth for the reference period (1991–2009) applying the regression model.
To evaluate how much of the variation between the projections depended on the stands compared to the fifteen CMIP5 climatic models, a simple linear model was applied:
Y i j = C i + S j + e i j
where Y i j is the projected change in RWI for the periods 2020s (2011–2040), 2050s (2041–2070) and 2080s (2071–2100) in percentage for climate model i and stand j, C i is the random effect of climate model i, S j is the random effect of stand j, and e i j is the error item.

3. Results

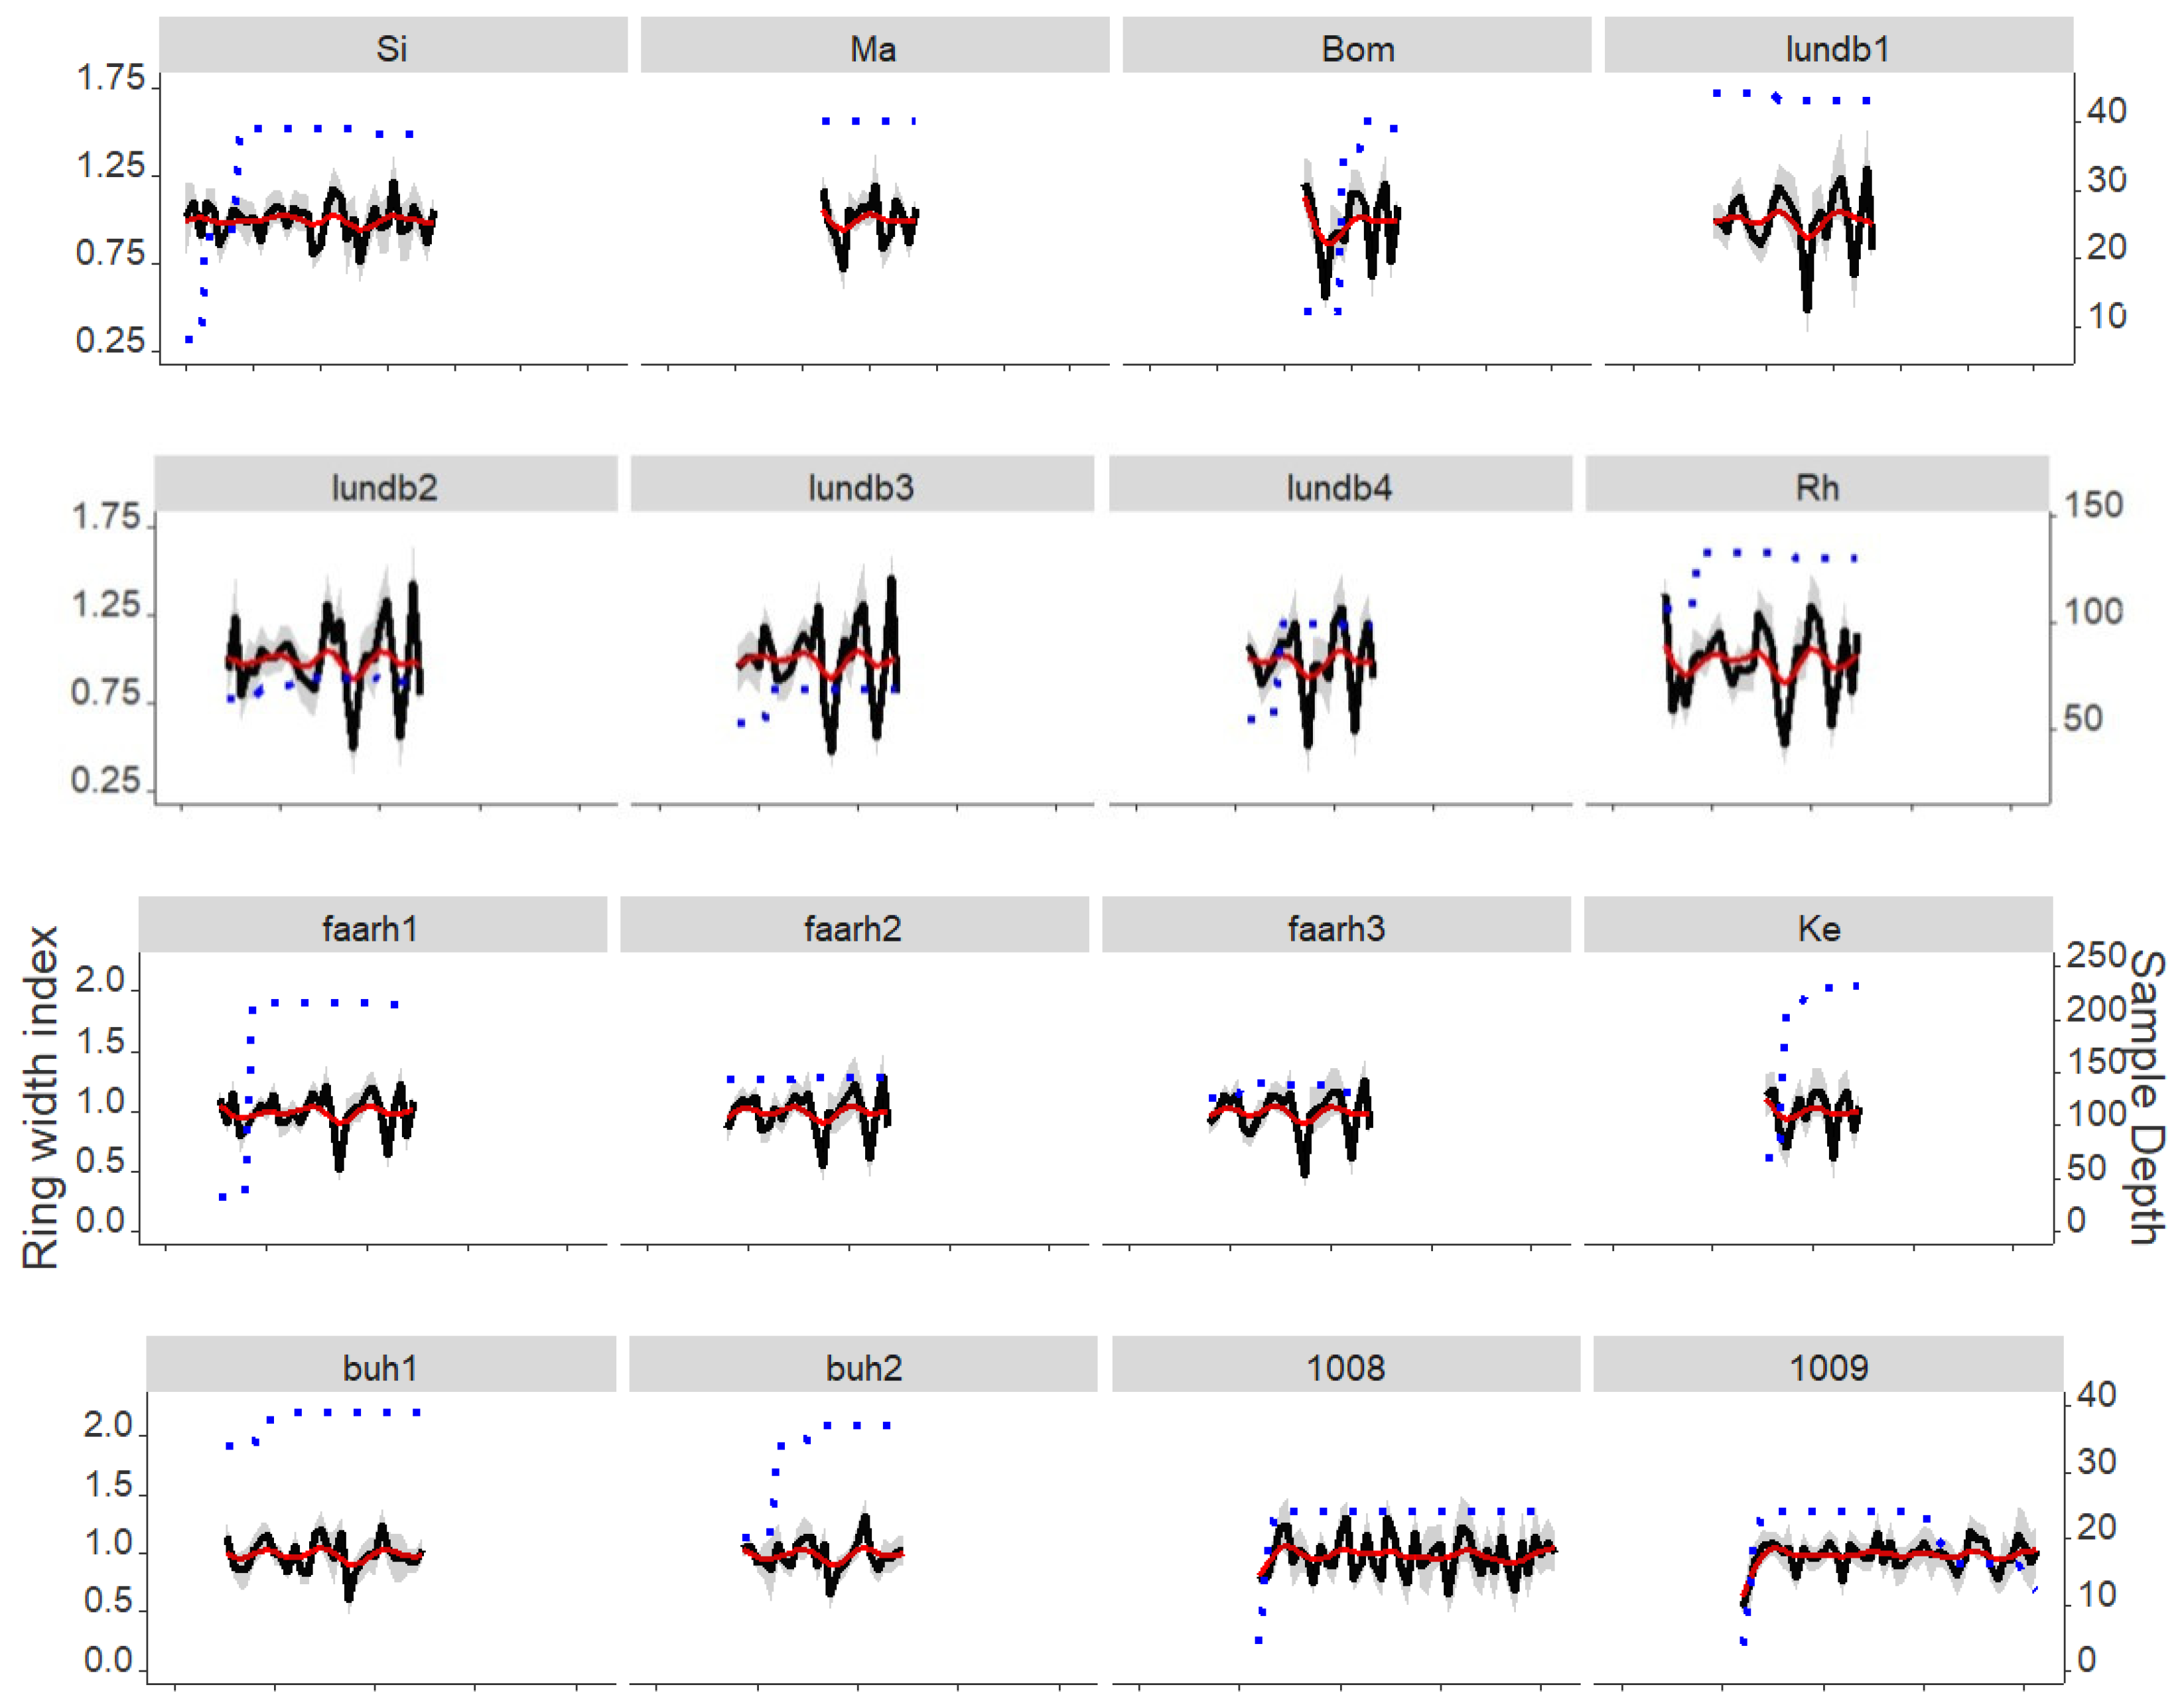
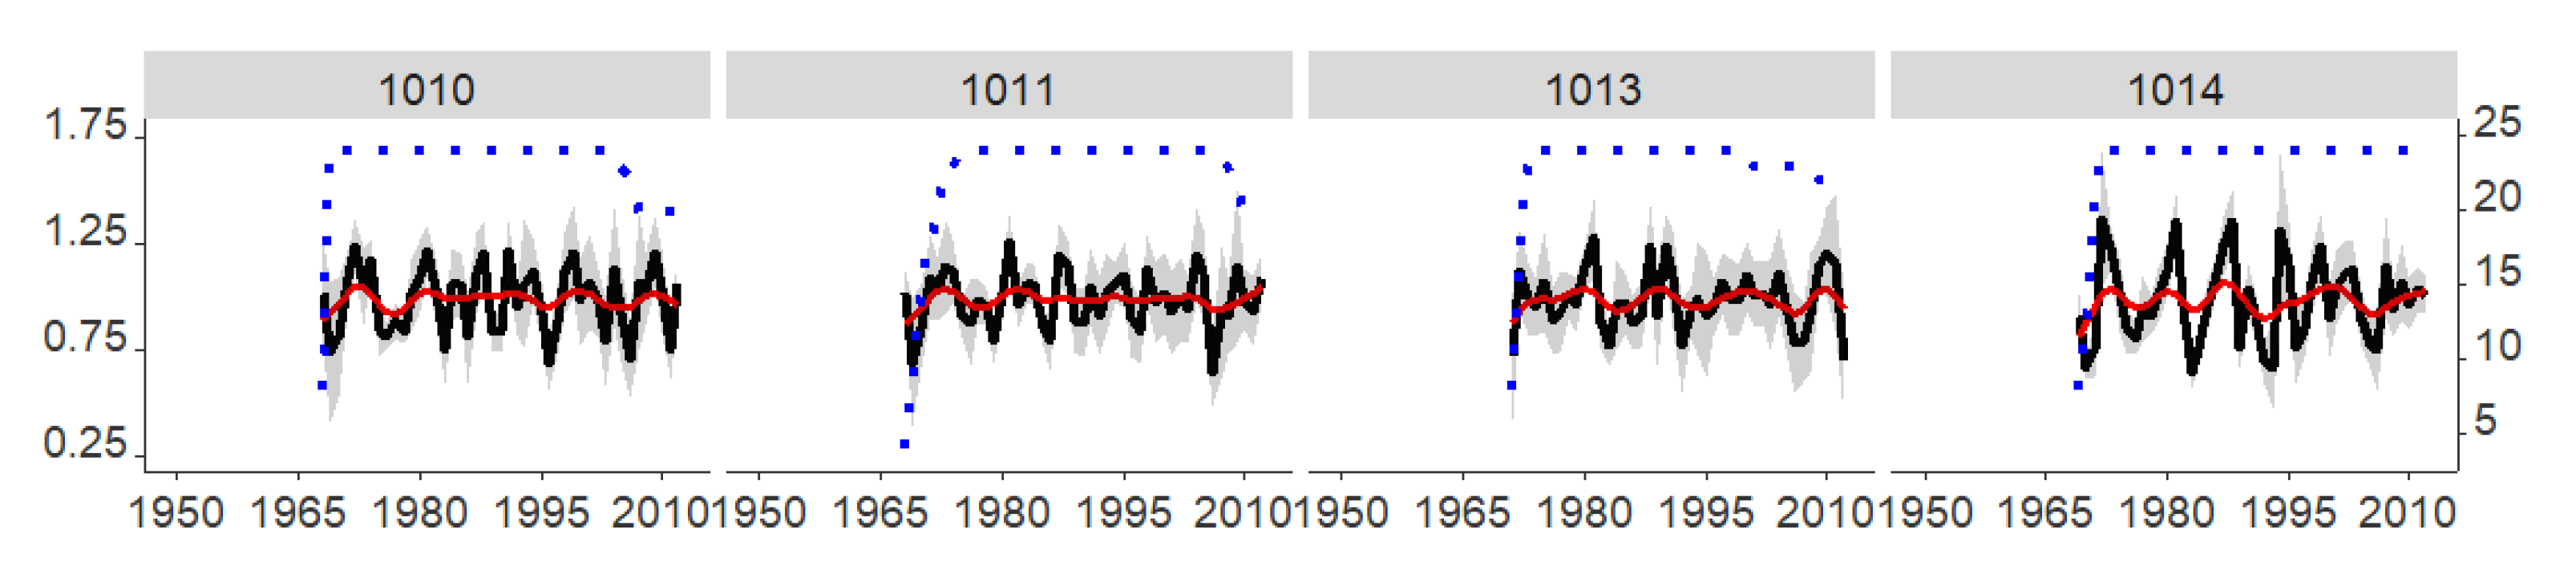
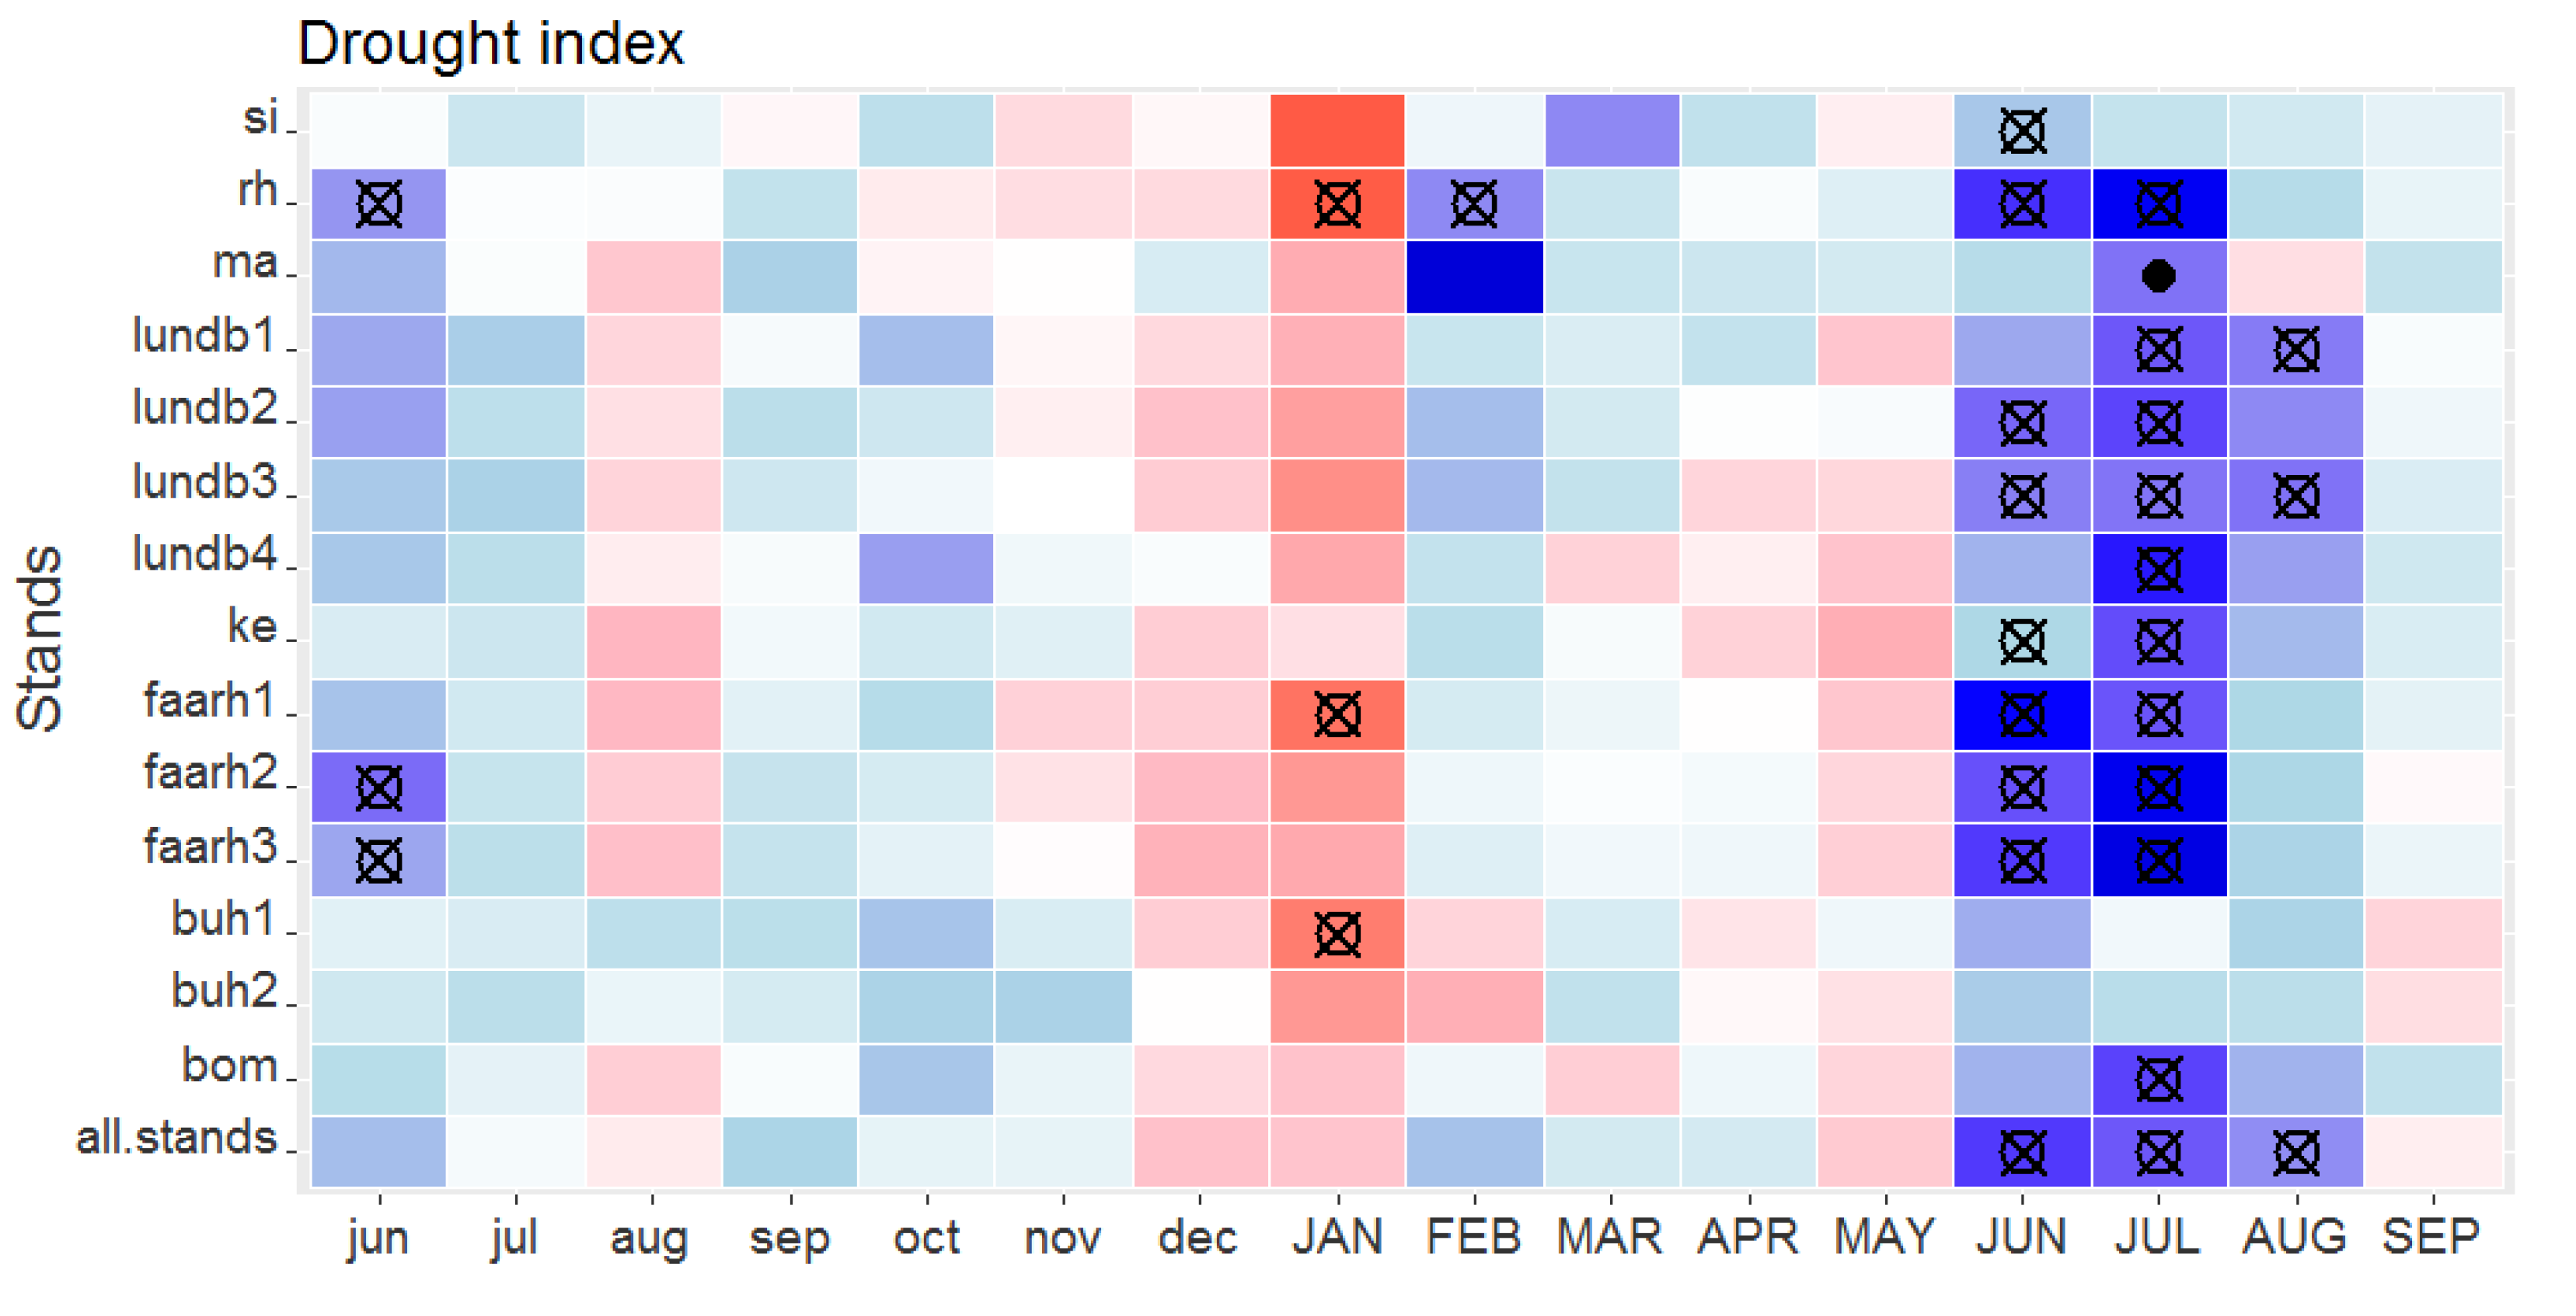
3.1. Annual Growth Rates, Common Signals, Main Climatic Drivers and Stand/Trial-Climatic Relationship Variation

The length of the tree-ring chronology at the different plantation stands of the first dataset varied from 1950–1987 to 1973–1987 depending on the age of different stands. The mean radial growth ranged from 2.90 to 4.29 mm per year (Figure 2 and Table 1). The common signal, i.e., a quantification of the overall agreement of the tree-ring width variation between the trees, was high. Specifically, the mean correlation between the trees (Rbar) from all sites ranged between 0.55 and 0.74, while the Expressed Population Signal (EPS) always reached values above 0.91, which is far above the critical value of 0.85 [51] (Table 1). The length of the tree ring chronology from the common garden experiment (2. Common garden) ranged from 1969–2012 to 1972–2012 (Figure 2 and Table 1).
The correlations between the detrended tree-ring width chronologies (i.e., the tree-ring width indices RWI) and the monthly climate variables indicated that different stands generally showed similar climatic responses (Figure 3). Radial growth was significantly and positively correlated with current year June, July and August drought index (DI) in the majority of the stands. Three stands (Rh, faarh2 and faarh3) exhibited significantly positive correlation between growth and previous year’s June DI (p < 0.001), whereas three (Rh, faarh1 and buh1) showed a negative correlation (p < 0.001) between growth and current year’s January DI. With respect to temperature, radial growth showed a significant negative correlation with the previous year’s September temperature across all stands (Figure 3). Though non-significant at the level of individual months, the colors of the chart indicate that RWI tends to correlate negatively with previous autumn and current summer temperatures and positively with spring temperatures.
The results of multiple regression models analyzing Norway spruce tree-ring data (period 1972–2012) of the six trials from the common garden experiment confirmed the negative effects of previous year’s August to October temperature and the positive effects of cumulated DI from June to July of the current year on radial growth (Table 2).
Cumulated DI in the current growing period was the climatic variable selected in the final climatic models with lowest AIC for all stands/trials except Ma, buh1, 1010 and 1011 (Table 2). In the model selection process, different cumulated DI were selected for different stands/trials. The effect of temperature in the current summer was included in the final model with the lowest AIC for the site 1011. The site 1010 showed a tendency to negative effects of current summer temperature (Table 2).
In the final models for plantation stands, 3 of the 14 stands showed negative effects of previous year autumn temperatures, as was also the case for one of the six field trials from dataset 2 (2. Common garden). If models with higher AIC-values were accepted (Δi ≤ 2), 6 of the 14 plantation stands in dataset 1 showed negative effects of previous year autumn temperature. Similarly, there was a negative effect of autumn temperature in four of the six field trials from dataset 2 (Δi ≤ 2; Table 2).
Spring temperature in the current growing season was selected for the final climate-growth response model in three of the fourteen stands of dataset 1. In 7 of the 14 stands, current spring temperature showed a positive effect, if models with larger AIC-values, but Δi ≤ 2, were accepted (Table 2). Spring temperature was not selected in any of the models with lowest AIC-values for the field trials in dataset 2. Effects of drought index changes on growth were not strikingly different between stands in dataset 1 and 2 (Table S1).

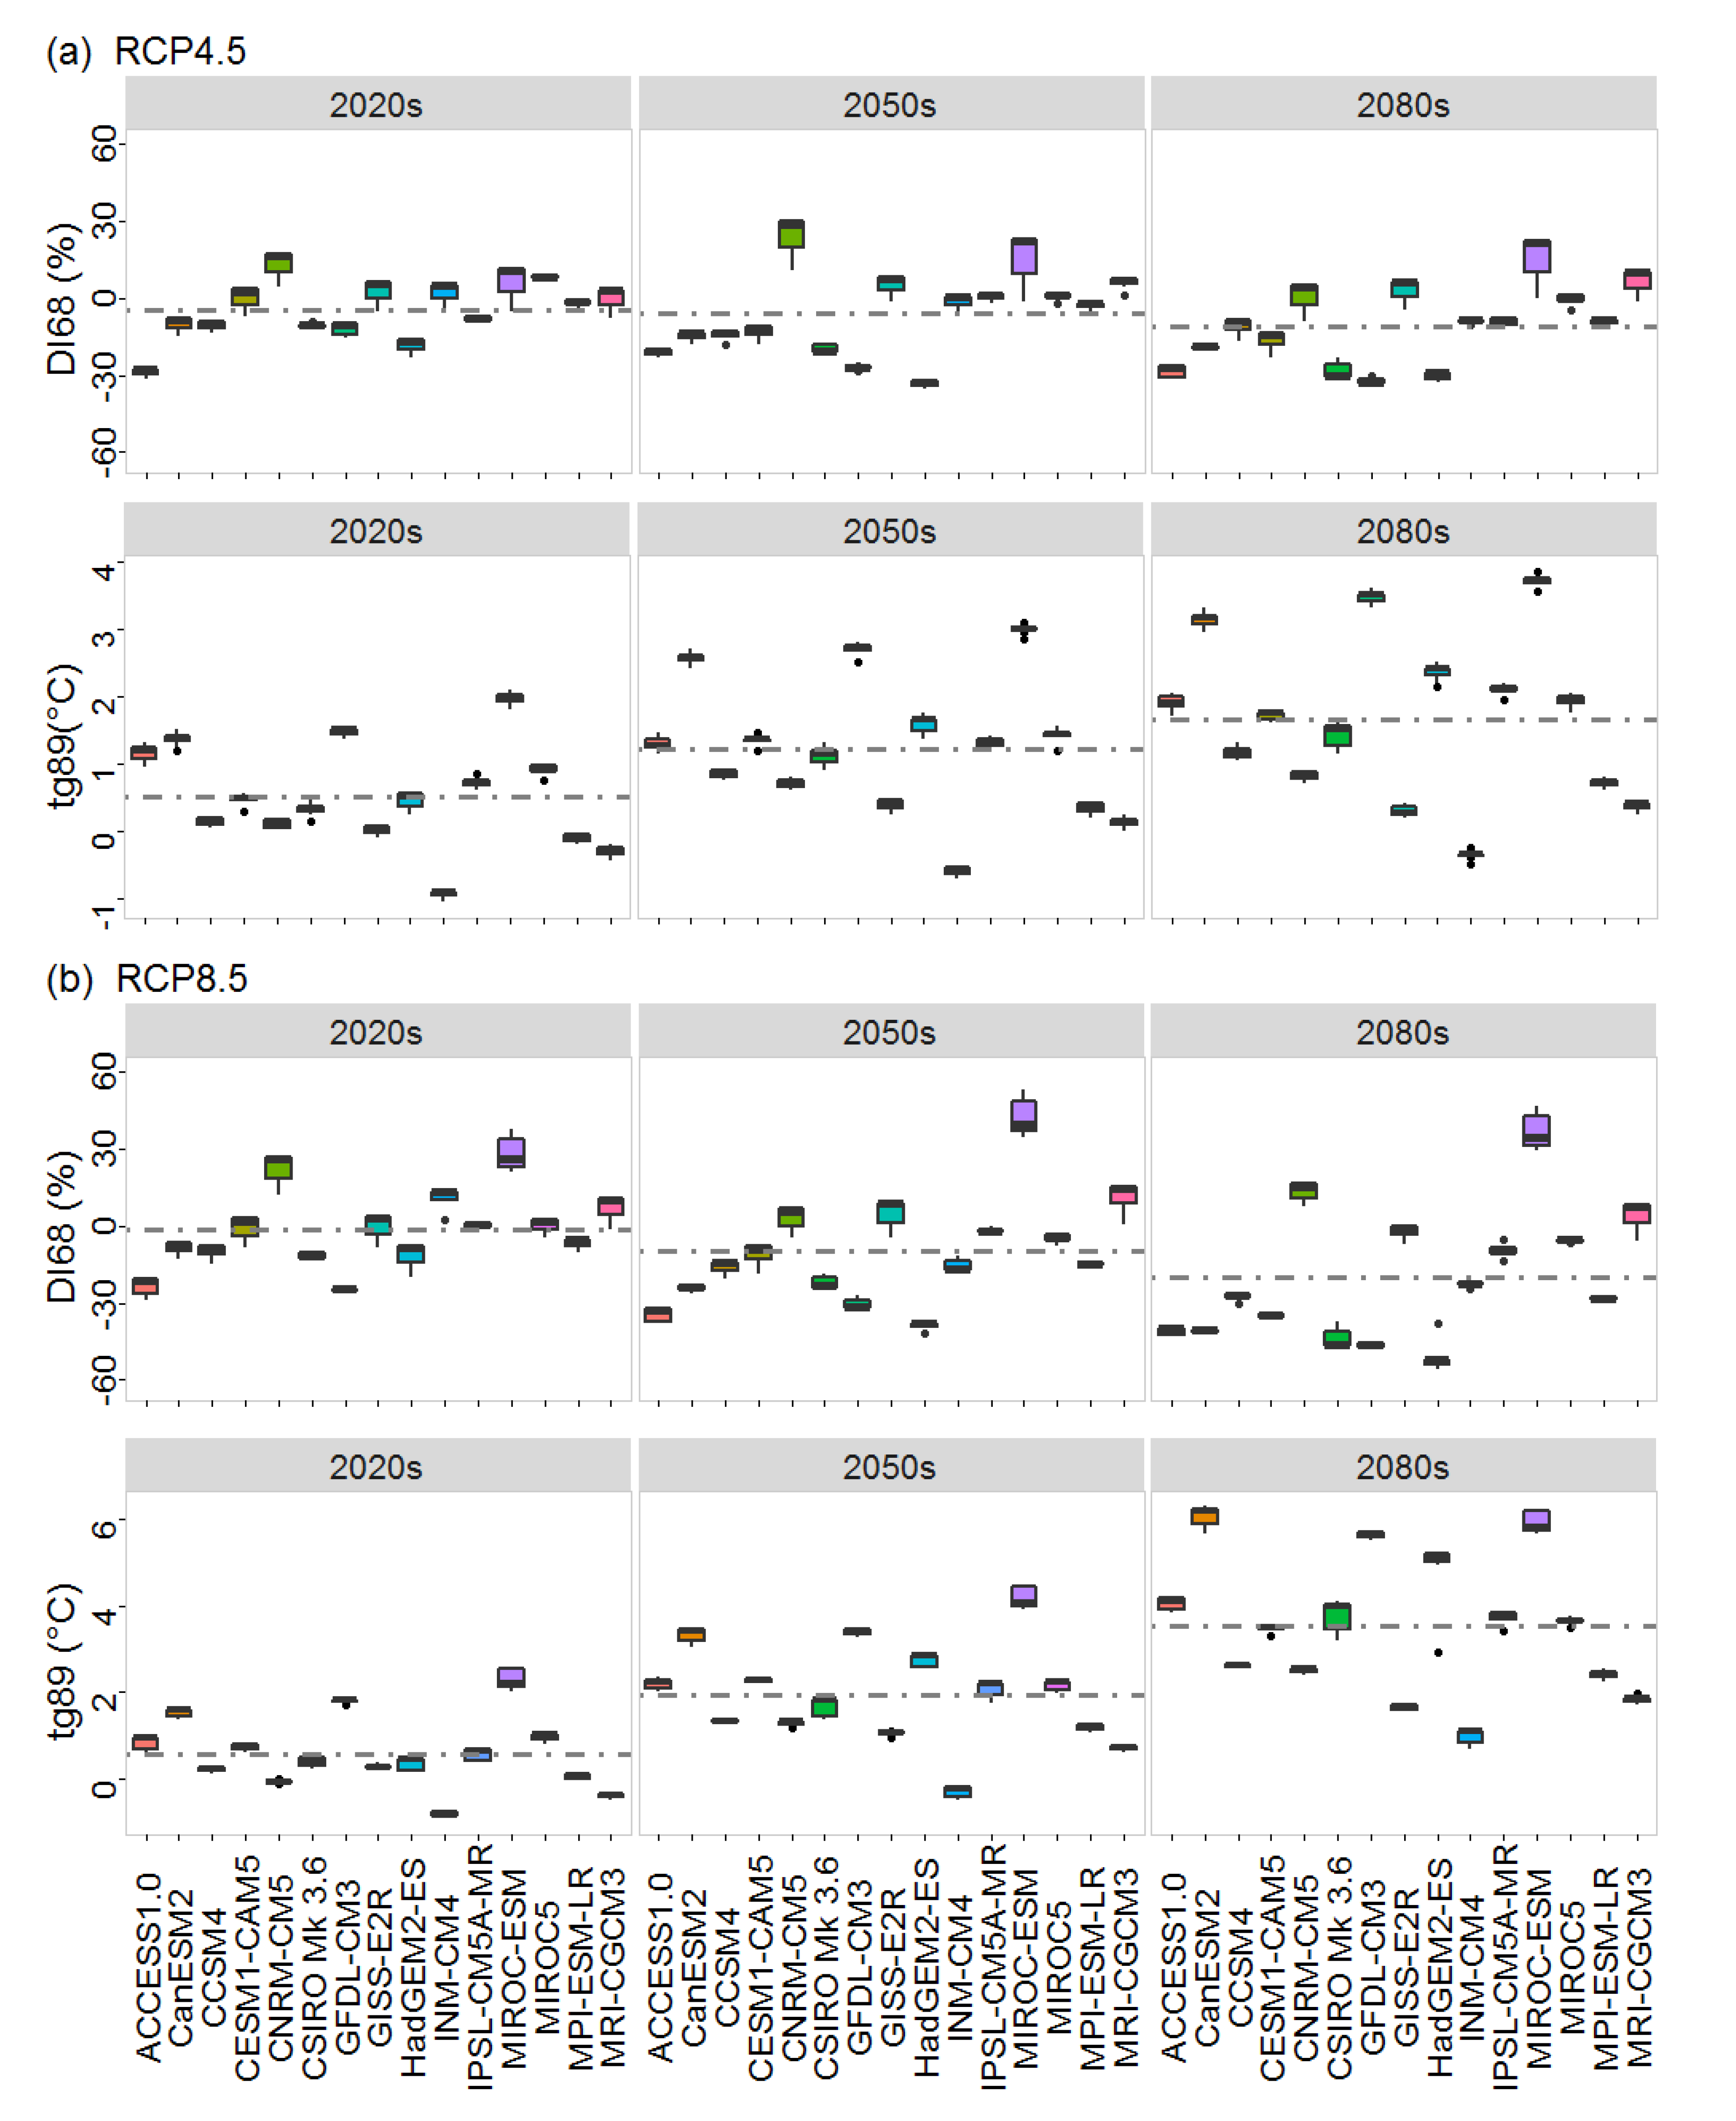
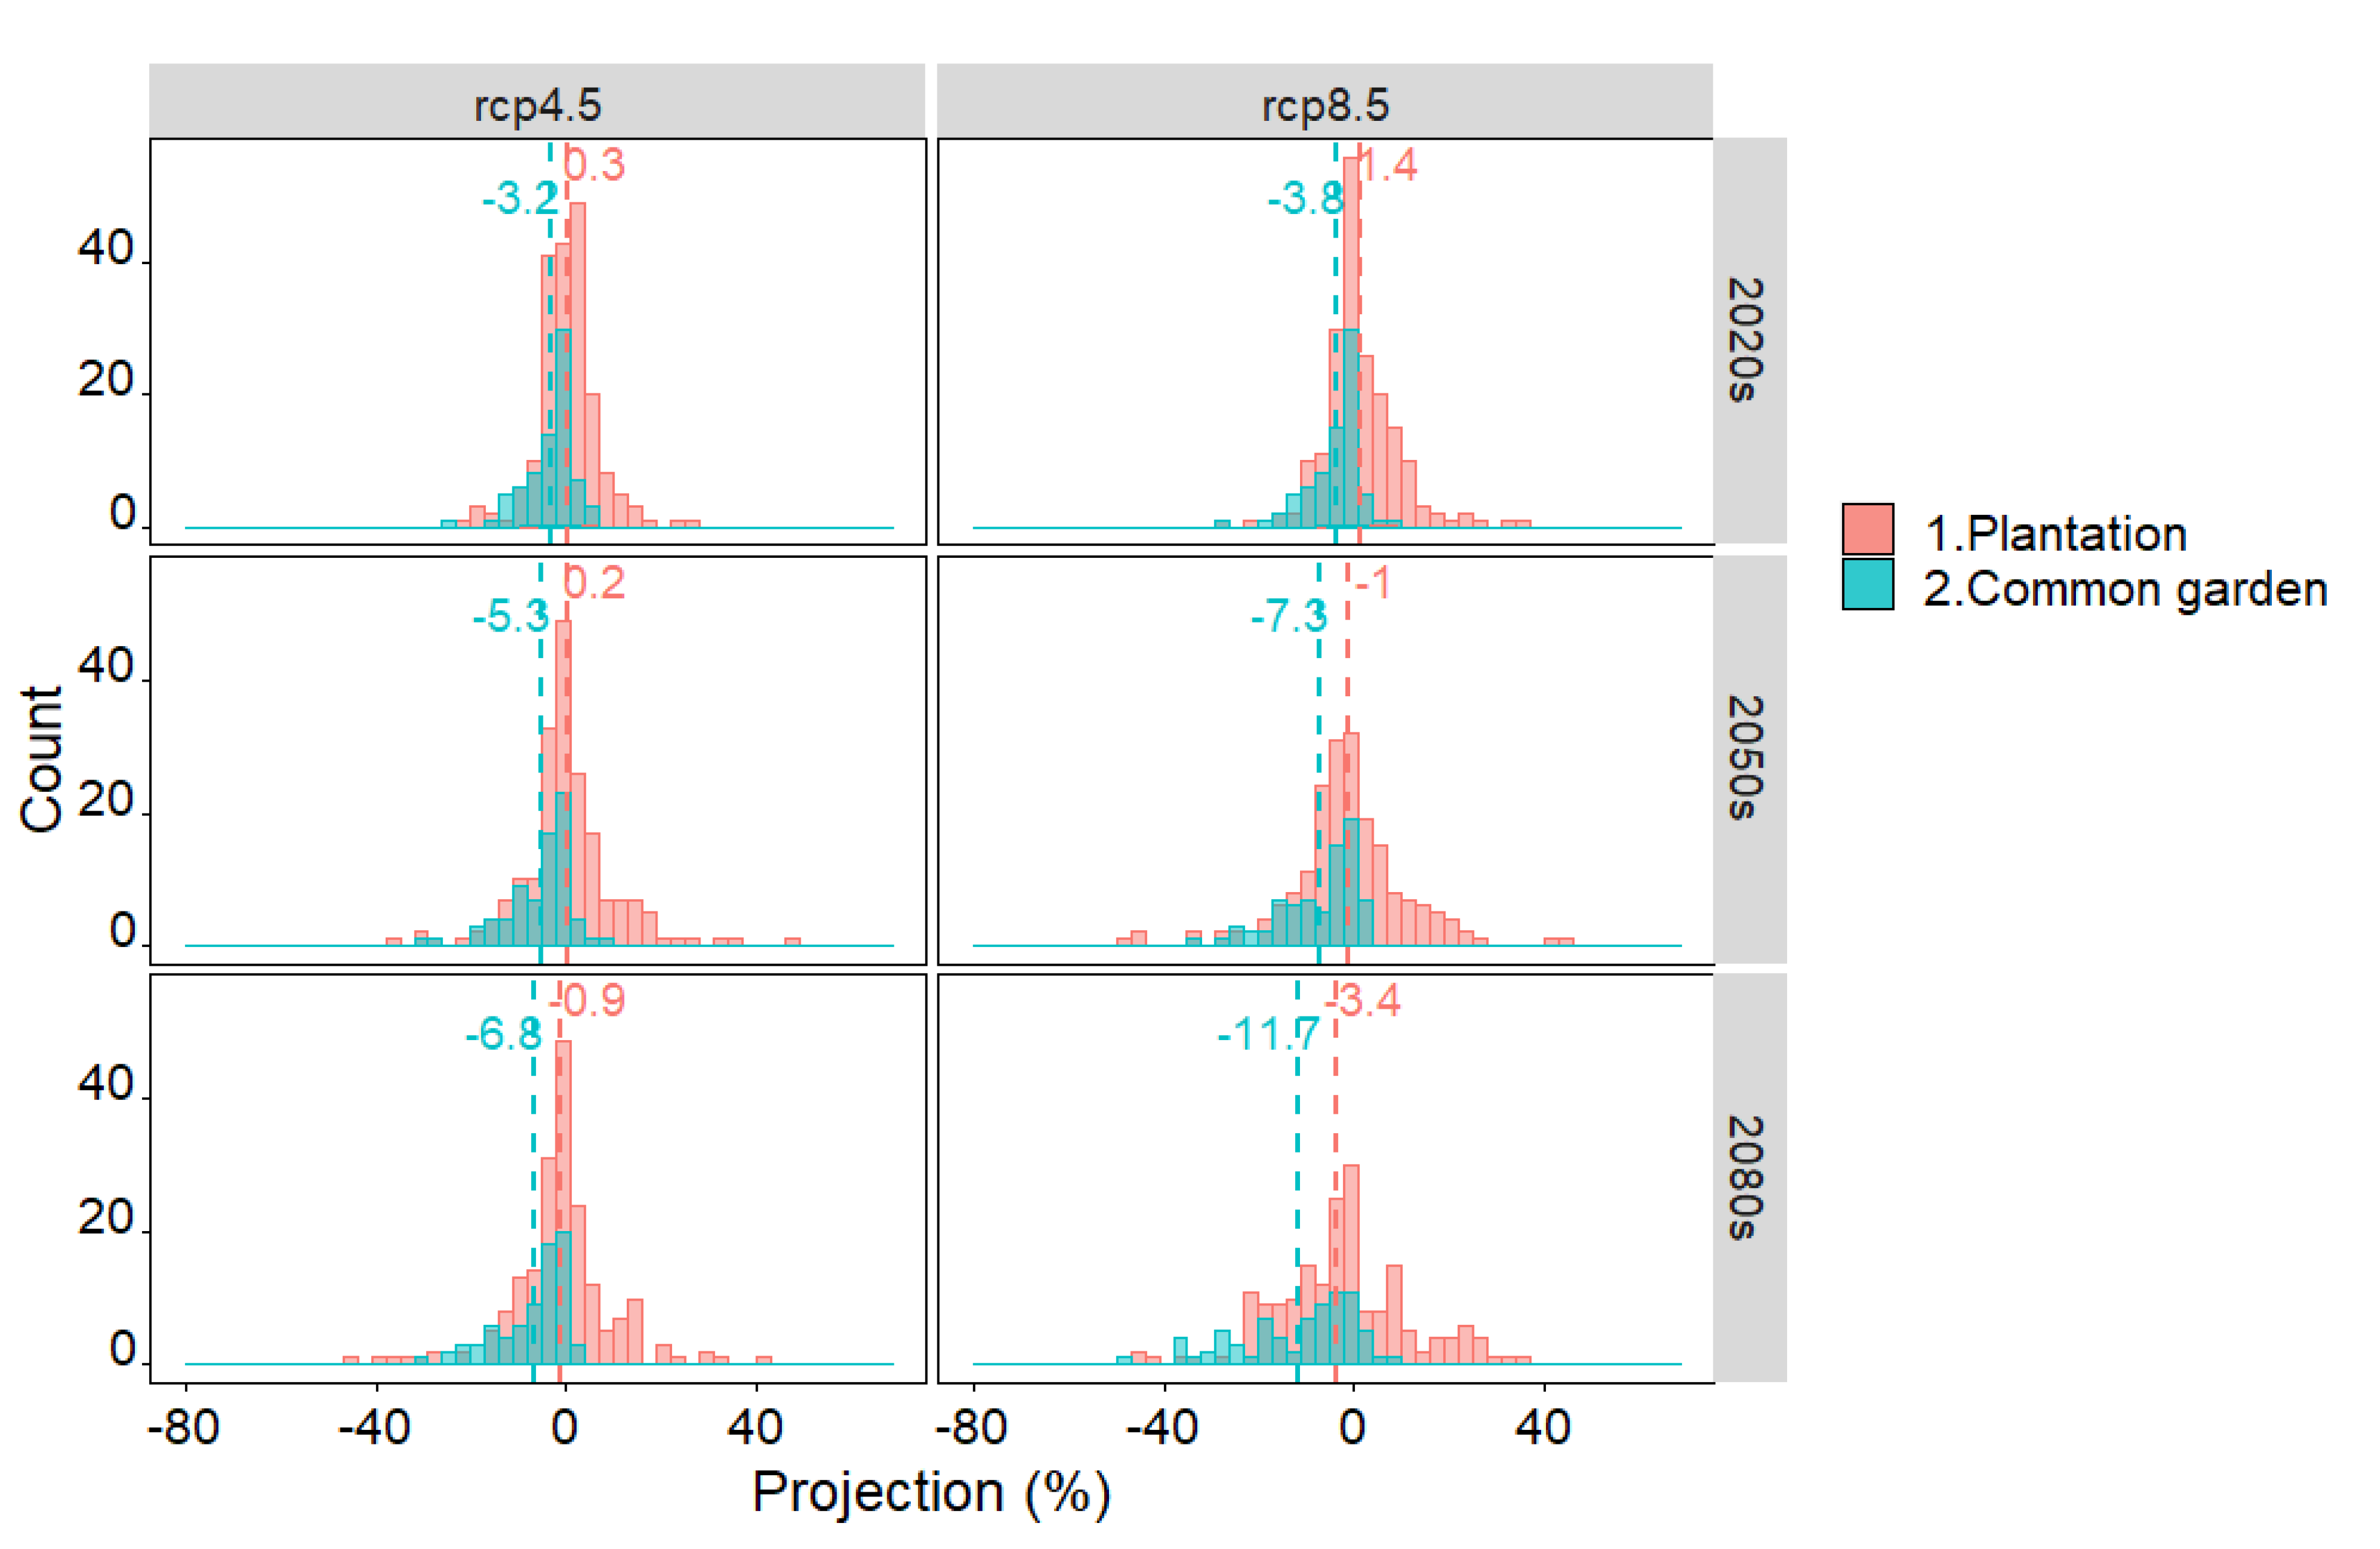
3.2. Future Growth, Common Tendency and Dissimilarity

In the final step, we applied the multiple regression models to project Norway spruce growth in the 14 plantation stands with selected plus-trees and the six common garden field trials for three time periods in the twenty-first century, i.e., for the 2020s, 2050s and 2080s. Half of the 15 CMIP5 models, both under scenarios RCP4.5 and RCP8.5, projected a drier summer (DI68 and DI67), while almost all of the 15 CMIP5 projected warmer late summer and autumn (tg89 and tg910) within the study area over this century (tg89 up to + 7 °C and tg910 up to + 6 °C by 2080s under RCP8.5; Figure 4 and Supplementary Figure S1). The selected temperature variables in the calibration periods of the different stands did not in any case cover the maximum projected changes in average temperatures in future climate 2050s and 2080s scenarios (Table S1).
On average, our models forecast that Norway spruce growth in Denmark will decrease over this century as a result of drier summers and warmer summers and autumns. In the projections based on plantation stands (13 stands with exception of Ma, period 1950–1987) and the 15 AOGCMs, growth was on average predicted to change by +0.3%, +0.2% and −0.9% for the 2020s, 2050s and 2080s periods under the RCP4.5 scenario, compared with +1.4%, −1.0% and −3.4% under the RCP8.5 scenario, respectively (Figure 5). A slightly higher decrease was projected using the common garden dataset (five trials excepts 1013, period 1972–2012), where the growth for the 2020s, 2050s and 2080s on average was projected to decrease by −3.2%, −5.3% and −6.8%, and −3.8%, −7.3% and −11.7% under the RCP4.5 and RCP8.5 scenarios, respectively.
Projections of future growth show considerable variation depending on stand projection model and climatic model. The variation range is larger in the RCP8.5 scenario compared with RCP4.5 and tends to increase in the last period (2071–2100). The variations in growth projections are large: The smallest was observed in period 2020s under RCP4.5 with a range from −22% to +26% for plantation stands and −25% to +7% for the common garden trials, and the largest was observed for the period 2080s under RCP8.5 ranging from −80 % to +69% for plantation stands and −47 % to +8% for the common garden trials (Figure 5). Much of this variation (22–73%) is due to differences in projection models for different stands (Figure 6). In general, the variation was relatively unaffected by the emission scenarios (RCP4.5 and 8.5). However, as the time periods change from the 2020s to the 2080s, the variation tends to increase. In addition, there were differences in the relative proportions of variation due to climate models and stands between the two studied datasets. Stand explained more of the variation in projected growth of the common garden trials ranging from 54 to 73% compared with the plantation stands ranging from 22 to 66%. The climate models and residual variation were larger in the projections based on the plantation stands compared with the common garden trials.

4. Discussion

4.1. Spruce Growth is Mainly Determined by Summer Drought, Previous Autumn and Spring Warmth

In boreal and temperate climate species, the cambial growth is initiated when a temperature sum exceeds a threshold [52,53]. In regards to the bud burst of Norway spruce in the spring, it depends on the temperature sum, day length and genetic material [54,55]. In the recent half century, spring temperature increased significantly in Denmark (Supplementary Figure S2). The current study showed that high spring temperature seems to promote Norway spruce growth for several plantation stands if we considered the models with larger AIC-values (but respecting that Δi ≤ 2, Table 2). The radial increments of Norway spruce trees from southwestern and eastern Germany, Norway and Finland were also promoted by warm May temperatures [56]. Several studies showed that a warmer spring can induce an earlier resumption of cell production in the cambium and a consequent earlier onset of xylogenesis of tree in temperate climates, and result in larger earlywood cells and wider rings [57,58,59,60]. Nevertheless, in this study the importance of spring temperature was only indicated at site 1013 in dataset 2. The low significance of spring temperatures in sites of dataset 2 contrasts the significance in many of stands of dataset 1 (Table 2) and might reflect that the importance of higher spring temperatures is reduced at milder sites. This may change if new genetic material demanding smaller temperature sums thresholds to flush and start cambium growth is introduced.
The climate growth relationships confirm that summer drought (June, July and August) constrains the growth of Norway spruce [9,26,32,61,62]. The significant effects of previous year DI on the growth in six stands (Table 2 and Figure 3) could indicate poor resilience. A tendency to poor resilience was reported by Zang et al. [62], who found that Norway spruce from southern Germany and Austria showed a prolonged growth reduction after the dry years 1947, 1976 and 2003, while Norway spruce grown in Switzerland and northern Italy recovered to the pre-drought growth level already the first year after drought events [63]. Indeed, this species is considered to be shallow-rooted [64] and thus to have limited access to deep soil water resources [32,63]. During dry summers, the species strongly reduces stomatal conductance and photosynthesis to protect against excessive water loss, which further affects the biological processes of carbohydrate assimilation and transfer [65], hereby reducing radial growth. A comparison between stands in growth response to changes in drought indices did not indicate any pronounced differences in growth responses between stands/trials of dataset 1 and dataset 2 in response to drought (Table S1).
High late summer/autumn temperatures of previous years negatively affected the width of the annual rings if models with higher AIC-value were accepted (Table 2). This negative influence of temperature from previous August and September is consistent with the results from a range of studies on Norway spruce [9,29,35,36,37]. It is uncertain if warm autumns have a negative effect on the net carbon storage due to reduced carbon assimilation mainly caused by increasing respiration. After initiation of cambial dormancy, continued photosynthesis in Norway spruce from boreal forest during late summer and autumn will store carbohydrates [66]. However, it has also been suggested that high respiration rates triggered by high late summer and early autumn temperatures may decrease the carbohydrate reserves, which is a key factor driving leaf expansion and cambium growth initiation during early phases of the following growing season [26]. In addition, if the elevated temperature is superposed by long period of drought, the increased respiration might induce mortality due to carbon starvation [67,68]. A tendency of positive effects from wet autumns was observed for the stand Buh1, which has also been reported in other previous studies [34,37,69]. Increased water availability in the previous September has been found to trigger wider annual rings, but also to induce a higher hydraulic vulnerability [34]. We speculate that the seemingly negative growth response of warm autumns is due to combined effects of high evapotranspiration, poor soil water availability occurring at the end of the growing season and high respiration, which collectively lead to a negative carbon balance [9].
Some of the above likely negative effects of climate change for growth could potentially be balanced by higher CO2 concentrations and interactions between higher CO2 concentrations and higher temperatures [70,71,72,73,74,75,76,77]. Experiments show generally positive effects of elevated CO2 on growth of Norway spruce [70,73,74], while effects of CO2 are not always evident for other species [71,78]. It is still uncertain to what extent there will be improvements of water use efficiency at the forest ecosystem level due to higher CO2 concentrations [79,80].

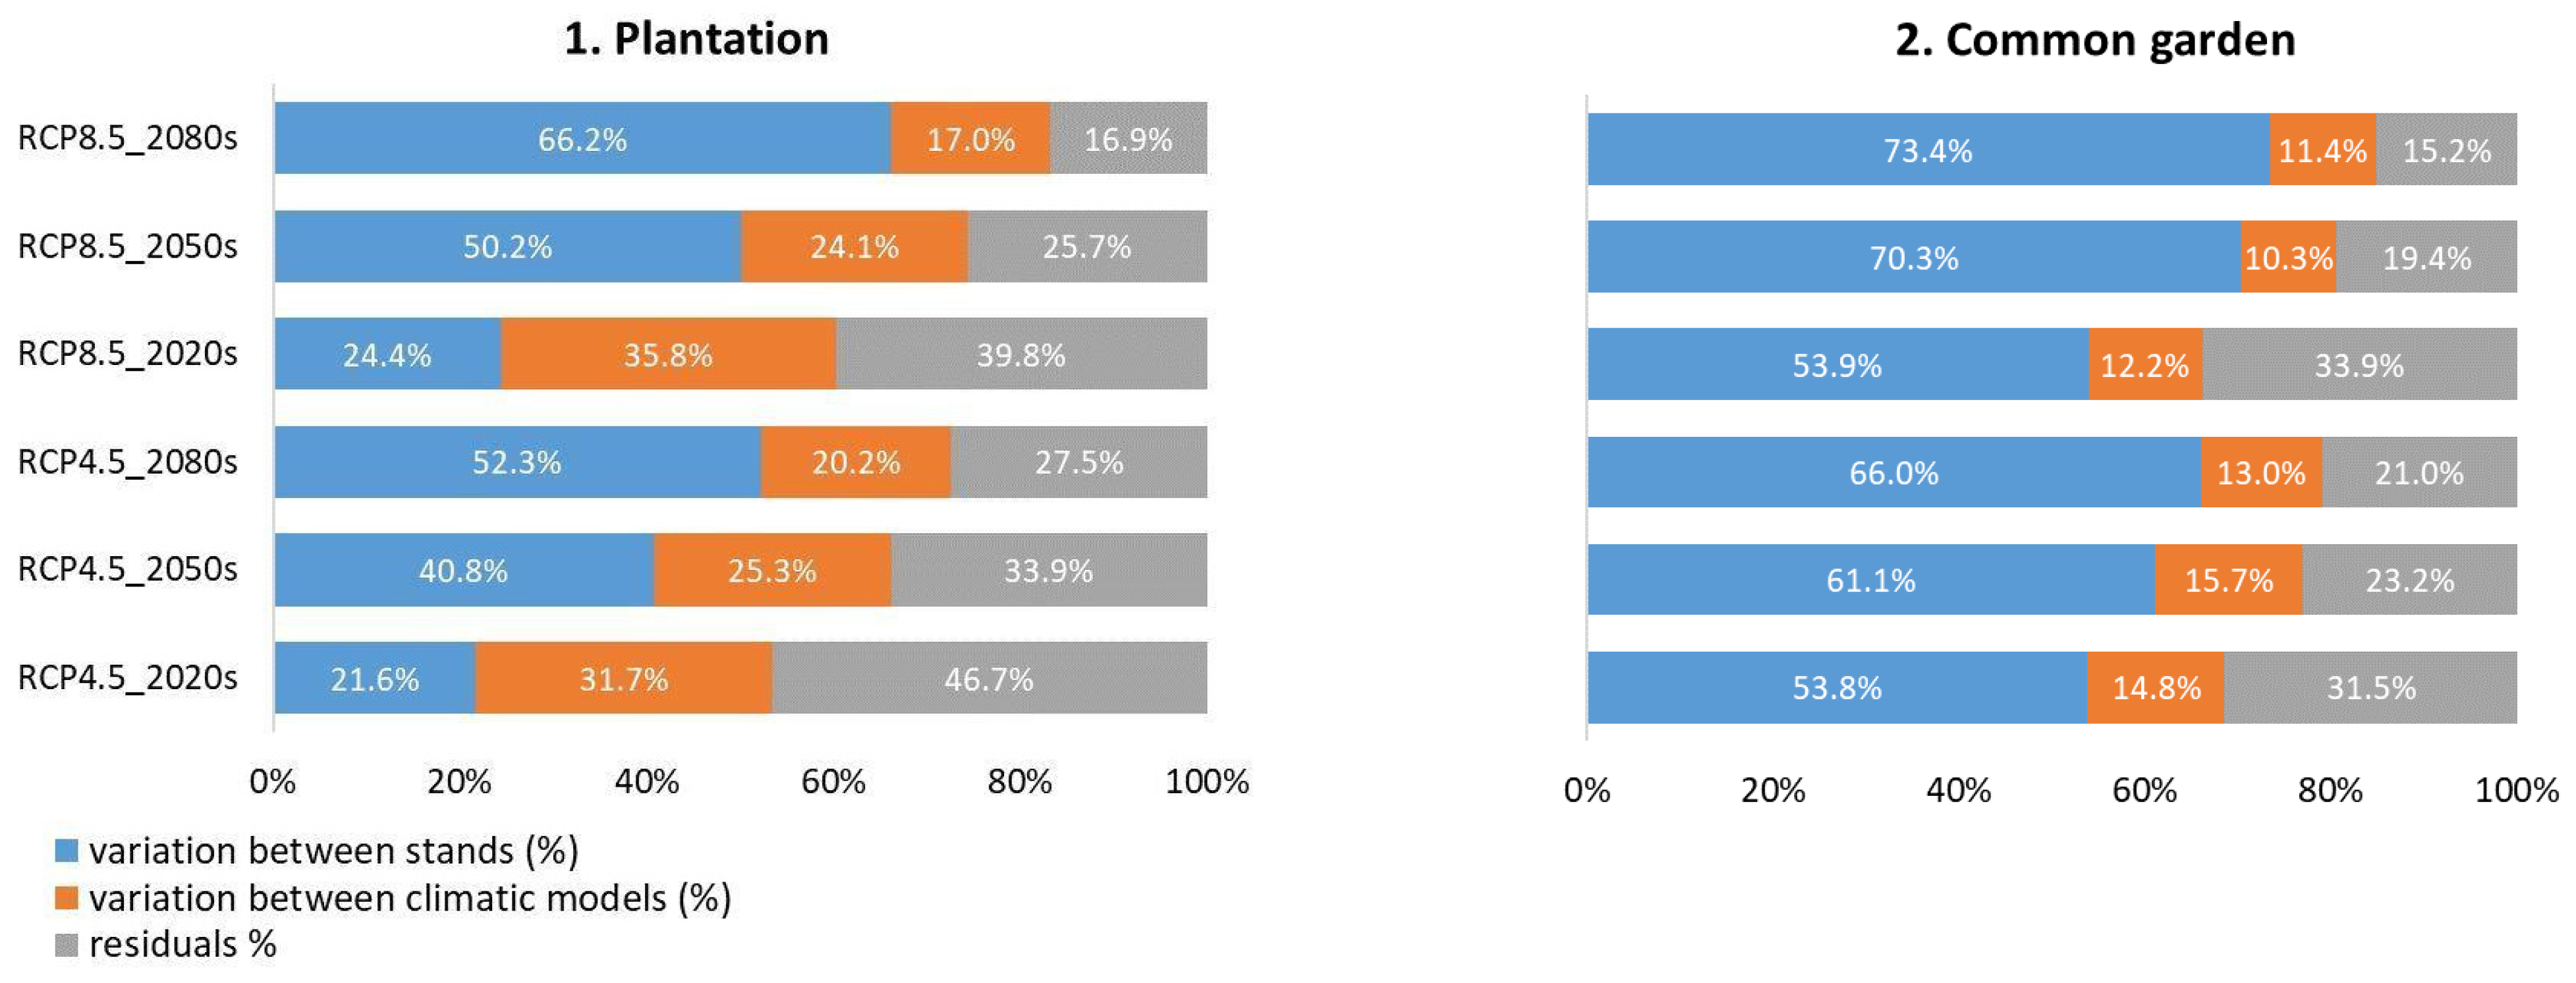
4.2. Growth Projections and Sources of Variation

Projecting outside of the range of the calibration period may be delicate since it assumes stable relationships over time. Our results indicate that, depending on dataset and emission scenario applied, the average growth reductions ranged from −0.9% to −11.7%. This percentage corresponds to decreases in annual ring width from 0.03 mm to 0.33 mm. Reductions are larger than those estimated for Norway spruce grown in Black Forest region in Central Europe, which were projected to decrease by 0.05–0.1 mm under RCP4.5 and 0.1–0.15 mm under RCP8.5 until 2090 [10]. The difference could be due to the fact that our study considers quite young trees, which usually display larger ring width. We have however to keep in mind that the projections for the period 2071–2100, and especially the RCP8.5 scenario, are based on extrapolations of the climate response models, since the trees used for the climate response modelling have not experienced the high future temperature regimes predicted by the climate models (Table S1 in Supplemental Materials). Thus, growth projections for the most extreme scenarios are beyond the validation area of the models.
The risk for severe drought spells will likely increase in the future in Denmark [81] and could lead to long-term reduced growth [62]. This is indicated by some stands showing effects of previous-year DI on Norway spruce current-year growth (Table 2 and Figure 3). Increased frequency of drought spells and higher temperatures could lead to changes in the severity of pests and diseases in Norway spruce [82,83].
Our results also showed that the projected growth change for each time period and for both RCP4.5 and 8.5 scenarios were on average lower for the common garden trials compared to the plantation stands (Figure 5). Moreover, comparisons between the predictions of plantation stands versus common garden trials (datasets 1 and 2) showed the relative importance of site and provenance selection, as the common garden trials had lesser variation than the plantation stands (Figure 5). Indeed, the plantation stands, presumed to display a larger genetic basis, showed a larger spectrum of growth changes [84,85]. In addition, the dataset 1 (plantation stands) had a larger sample size with in total 340 trees from fourteen stands compared with the dataset 2 (common garden trials) had 36 trees from six trials. However, since dataset 1 and dataset 2 include stands/sites with different age and sample size, it is hard to evaluate how much the differences in periods of these two datasets have influenced the selection of variables and the regression coefficients of the climate response models. Projections based on dataset 1 may be less certain, as they reflect climate responses for a time period where CO2 concentrations were lower compared to dataset 2, and where temperatures were generally lower (Supplementary Figure S2). Differences in projections could also be related to the fact that the positive effect of increasing spring temperature was found only in the projections of the plantation stands (Table 2). However, because autumn temperatures increased since the late 1990s (Supplementary Figure S2), we speculate that the negative influence of high autumn temperatures will be a major constraint for Norway spruce growth under future climate change due to its apparently negative effect on spruce growth [9,36,37].
It is important to notice that the growth predictions show a tremendous variation (Figure 5 and Figure 6) depending on the climate model and scenario of emission. Growth change predictions for individual stands and climate models ranged from highly positive to highly negative. Thus, considering this level of uncertainty, it is difficult to confidently conclude whether Norway spruce will reduce or increase growth in the future (Figure 5). Besides variation among climate models, climate scenarios were also importantly affecting the growth projection [11,75,86]. In Germany, scenarios with increases in precipitation resulted in up to a 7% increase in productivity of three out of four main species, whereas under a drier scenario all species were projected to decline in productivity by −4 to −16% [87]. Compared with RCP4.5, drier summers and warmer autumns are predicted under RCP8.5, meaning that growth was projected to decrease more compared with RCP4.5 (Figure 4 and Figure 5, Supplementary Figure S1). Furthermore, climate models based on RCP8.5 showed larger variation compared with RCP4.5, leading to larger variation in growth projections. This was amplified when combined with the climate response model variation among stands. Yet, our results also show that different climate models based on the same emission scenario can lead to larger variations in projected growth responses compared to variation caused by different emission scenarios. This result confirms the conclusions of Buisson et al. [88] and Reyer et al. [75] who found that effects of using different climate models are more important than choice of the CO2 emission scenario, and that the inter-model variation of the climate models are higher. Improving the downscaled climate predictions should thus remain a priority. However, it is still crucial to include different emission scenarios since so far CO2 emissions seem to continue unabated [89].
Much variation in the growth projection is also observed among the selected sites within the same climatic model. This clearly indicate that site selection (and not only the climate model) plays an important role in determining the final result. The primary source of variation in the common garden trials appeared to be variation between stands, whereas variation between climatic models was less important (Figure 6). For plantation stands, the proportion of variation caused by differences between sites were more important for 2050s and 2080s compared to variation due to climate models, while climatic models for the 2020s were more important and exceeded the variation caused by stands (Figure 6). The decreasing relative influence of climatic models with time may reflect that the temperature signal becomes more prominent in all models. This increase in temperature contributes considerably to the variation among both plantation stands and the common garden trials, since some growth projection models do not include any effects of temperatures, some include positive effects of spring temperature, and some include negative effects of autumn temperature (Table 2). The variation of temperatures between sites becomes slightly larger along the future period until 2100 (Figure 4 and Supplementary Figure S1). Further, the genetic variation among populations in response to drought plays a significant role in growth resilience [90]. Norway spruce from the Central and South-eastern Europe showed a higher adaptive variation to drought compared with the provenances from Alpine region [91]. The study on Picea glauca (Moench) populations established in a common garden experiment in Quebec, Canada showed that populations from drier geographical origins had higher resilience to extreme drought events, compared to populations from more humid geographical origins [90]. In order to highlight the site variations, decrease the degree of freedom and select the most significant climate variables which could represent the site general level. The mean RWI chronology of each stand/trial was used in the projection model in the current study. Thus, individual tree variations were ignored. In future research, uncertainty in individual tree responses should be considered, especially if there are multiple phenotypes with divergent responses to climate within local stands.
The large variation in growth projections and the relatively large contribution from differences in projection models for the stands stress two important elements. On the one hand, there is an increasing need for a representative sampling strategy that encompass several stands to get reasonably reliable climate response models, even for smaller regions. On the other hand, it is also clear that forest managers, through their selection of genetic material or silvicultural measures, partly can mitigate negative effects of climate change. For example, a genetic potential to improve drought tolerance in Norway spruce was indicated in a drought experiment on seedlings [92], and other authors found provenance variation in physiological response to drought and in resistance to drought events [91,93]. Furthermore, through epigenetics affecting the phenology [94,95,96], new generations of Norway spruce might take advantage of longer growing seasons. Over time, it might be a possibility to take advantage of a longer growing season by planting genetic material with earlier bud burst and later senescence—both highly heritable traits in Norway spruce [55,97].

5. Conclusions

In this study, we show that over the past 60 years Norway spruce growth across Denmark was negatively impacted by summer drought, and by high late-summer and early-autumn temperatures. In some stands, warm springs positively affected the growth, but the latter with some indications of reduced importance in a warmer climate. Our average projections suggest that Norway spruce may experience a growth reduction in the future.
However, the large variation in projections due to differences between stands and climate models calls for further research and caution when projections are interpreted. Much of the variation among stands may be ascribed to variability in stand and site conditions not accounted for, suggesting that forest managers should in general avoid the use of Norway spruce in large pure stands on exposed and drought prone sites and as an additional resilience measure primarily use it in mixtures with other more climate tolerant species. A main problem with many projections is that they are inevitably based on past climates, where even climate extremes might reach the average future climate. Reciprocal common garden experiments including the same genetic material growing at several and especially extreme sites are of high value in this respect.

Supplementary Materials

The following are available online at https://www.mdpi.com/1999-4907/12/1/36/s1, Table S1: Mutiple regression model relating RWI with climate for Norway spruce from 14 stands and 6 field trials in this study and the period mean climate for 2020s (2011–2040), 2050s (2041–2070) and 2080s (2071–2100) based on the RCP4.5 and RCP8.5 scenario, Figure S1: Future summer drought index (DI67, cumulated drought index from June to July) and autumn temperature (tg910, average temperature for August and September) relative to 1991–2009 considering the emission scenario RCP4.5 (a) and RCP8.5 (b), Figure S2: Development of most growth relevant climatic factors across stands/trials for these two datasets over period 1950 to 2012.

Author Contributions

Conceptualization, W.H. and J.K.H.; methodology, H.W. and W.H.; validation, W.H.; formal analysis, W.H.; writing—original draft preparation, W.H.; visualization, W.H.; writing—review and editing, W.H., P.F., A.R., J.B.L., H.W. and J.K.H. All authors have read and agreed to the published version of the manuscript.

Funding

The research was funded by the China Scholarship Council (CSC, No.201306910037), the Glud foundation (Gluds Legat), the Villum Foundation, the Natural Science Foundation of the Jiangsu Higher Education Institutions of China (No.18KJB220005), the Nanjing Forestry University Landmark Achievements Cultivation Project of China. This study profited from discussions within the framework of the COST Action STReESS (COST-FP1106).

Conflicts of Interest

The authors declare no conflict of interest. The funders had no role in the design of the study; in the collection, analyses, or interpretation of data; in the writing of the manuscript, or in the decision to publish the results.

References

  1. Buser, C.M.; Künsch, H.R.; Lüthi, D.; Wild, M.; Schär, C. Bayesian multi-model projection of climate: Bias assumptions and interannual variability. Clim. Dyn. 2009, 33, 849–868. [Google Scholar] [CrossRef] [Green Version]
  2. Miao, C.; Duan, Q.; Sun, Q.; Huang, Y.; Kong, D.; Yang, T.; Ye, A.; Di, Z.; Gong, W. Assessment of CMIP5 climate models and projected temperature changes over Northern Eurasia. Environ. Res. Lett. 2014, 9, 055007. [Google Scholar] [CrossRef]
  3. Knutti, R.; Sedláček, J. Robustness and uncertainties in the new CMIP5 climate model projections. Nat. Clim. Chang. 2013, 3, 369–373. [Google Scholar] [CrossRef]
  4. McKenney, D.W.; Pedlar, J.H.; Lawrence, K.; Campbell, K.; Hutchinson, M.F. Potential impacts of climate change on the distribution of North American trees. BioScience 2007, 57, 939–948. [Google Scholar] [CrossRef]
  5. Kramer, K.; Degen, B.; Buschbom, J.; Hickler, T.; Thuiller, W.; Sykes, M.T.; De Winter, W. Modelling exploration of the future of European beech (Fagus sylvatica L.) under climate change—Range, abundance, genetic diversity and adaptive response. For. Ecol. Manag. 2010, 259, 2213–2222. [Google Scholar] [CrossRef]
  6. Hanewinkel, M.; Cullmann, D.A.; Schelhaas, M.; Nabuurs, G.; Zimmermann, N.E. Climate change may cause severe loss in the economic value of European forest land. Nat. Clim. Chang. 2013, 3, 203–207. [Google Scholar] [CrossRef]
  7. Thurm, E.A.; Hernandez, L.; Baltensweiler, A.; Ayan, S.; Rasztovits, E.; Bielak, K.; Zlatanov, T.M.; Hladnik, D.; Balic, B.; Freudenschuss, A.; et al. Alternative tree species under climate warming in managed European forests. For. Ecol. Manag. 2018, 430, 458–497. [Google Scholar] [CrossRef]
  8. Huang, J.; Bergeron, Y.; Berninger, F.; Zhai, L.; Tardif, J.C.; Denneler, B. Impact of future climate on radial growth of four major boreal tree species in the eastern Canadian boreal forest. PLoS ONE 2013, 8, e56758. [Google Scholar] [CrossRef] [Green Version]
  9. Huang, W.; Fonti, P.; Larsen, J.B.; Ræbild, A.; Callesen, I.; Pedersen, N.B.; Hansen, J.K. Projecting tree-growth responses into future climate: A study case from a Danish-wide common garden. Agric. For. Meteorol. 2017, 247, 240–251. [Google Scholar] [CrossRef]
  10. Vitali, V.; Büntgen, U.; Jürgen, B. Seasonality matters—The effects of past and projected seasonal climate change on the growth of native and exotic conifer species in Central Europe. Dendrochronologia 2018, 48, 1–9. [Google Scholar] [CrossRef]
  11. Buras, A.; Menzel, A. Projecting tree species composition changes of European forests for 2061–2090 under RCP 4.5 and RCP 8.5 scenarios. Front. Plant Sci. 2019, 9, 1986. [Google Scholar] [CrossRef] [PubMed] [Green Version]
  12. Chen, H.; Sun, J.; Chen, X. Projection and uncertainty analysis of global precipitation-related extremes using CMIP5 models. Int. J. Climatol. 2014, 34, 2730–2748. [Google Scholar] [CrossRef]
  13. Lindholm, M.; Lehtonen, H.; Kolström, T.; Meriläinen, J.; Eronen, M.; Timonen, M. Climatic signals extracted from ring-width chronologies of Scots pines from the northern, middle and southern parts of the boreal forest belt in Finland. Silva Fenn. 2000, 34, 317–330. [Google Scholar] [CrossRef] [Green Version]
  14. Andreassen, K.; Solberg, S.; Tveito, O.E.; Lystad, S.L. Regional differences in climatic responses of Norway spruce (Picea abies L. Karst) growth in Norway. For. Ecol. Manag. 2006, 222, 211–221. [Google Scholar] [CrossRef]
  15. Lapointe-Garant, M.-P.; Huang, J.-G.; Gea-Izquierdo, G.; Raulier, F.; Bernier, P.; Berninger, F. Use of tree rings to study the effect of climate change on trembling aspen in Québec. Glob. Chang. Biol. 2010, 16, 2039–2051. [Google Scholar] [CrossRef]
  16. Nehrbass-Ahles, C.; Babst, F.; Klesse, S.; Nötzli, M.; Bouriaud, O.; Neukom, R.; Dobbertin, M.; Frank, D. The influence of sampling design on tree-ring-based quantification of forest growth. Glob. Chang. Biol. 2014, 20, 2867–2885. [Google Scholar] [CrossRef] [PubMed]
  17. Primicia, I.; Camarero, J.J.; Janda, P.; Čada, V.; Morrissey, R.C.; Trotsiuk, V.; Bače, R.; Teodosiu, M.; Svoboda, M. Age, competition, disturbance and elevation effects on tree and stand growth response of primary Picea abies forest to climate. For. Ecol. Manag. 2015, 354, 77–86. [Google Scholar] [CrossRef]
  18. Rabbel, I.; Neuwirth, B.; Bogena, H.; Diekkrüger, B. Exploring the growth response of Norway spruce (Picea abies) along a small-scale gradient of soil water supply. Dendrochronologia 2018, 52, 123–130. [Google Scholar] [CrossRef]
  19. Häusser, M.; Szymczak, S.; Garel, E.; Santoni, S.; Huneau, F.; Bräuning, A. Growth variability of two native pine species on Corsica as a function of elevation. Dendrochronologia 2019, 54, 49–55. [Google Scholar] [CrossRef]
  20. Bazzaz, F.A. The response of natural ecosystems to the rising global CO2 levels. Annu. Rev. Ecol. Syst. 1990, 21, 167–196. [Google Scholar] [CrossRef]
  21. Cole, C.T.; Anderson, J.E.; Lindroth, R.L.; Waller, D.M. Rising concentrations of atmospheric CO2 have increased growth in natural stands of quaking aspen (Populus tremuloides). Glob. Chang. Biol. 2010, 16, 2186–2197. [Google Scholar] [CrossRef]
  22. Savva, Y.; Oleksyn, J.; Reich, P.B.; Tjoelker, M.G.; Vaganov, E.A.; Modrzynski, J. Interannual growth response of Norway spruce to climate along an altitudinal gradient in the Tatra Mountain, Poland. Trees Struct. Funct. 2006, 20, 735–766. [Google Scholar] [CrossRef]
  23. Caudullo, G.; Tinner, W.; de Rigo, D. Picea abies in Europe: Distribution, habitat, usage and threats. In European Atlas of Forest Tree Species; San-Miguel-Ayanz, J., de Rigo, D., Caudullo, G., Houston Durrant, T., Mauri, A., Eds.; Publications Office of the European Union: Luxembourg, 2016; pp. 114–116. [Google Scholar]
  24. Nord-Larsen, T.; Johannsen, V.K.; Riis-Nielsen, T.; Thomsen, I.M.; Bentsen, N.S.; Gundersen, P.; Jørgensen, B.B. Skove og Plantager 2017: Forest Statistics 2017; Institut for Geovidenskab og Naturforvaltning, Københavns Universitet: Frederiksberg, Denmark, 2018. [Google Scholar]
  25. Nord-Larsen, T.; Pretzch, H. Biomass production dynamics for common forest tree species in Denmark–Evaluation of a common garden experiment after 50 yrs of measurements. For. Ecol. Manag. 2017, 400, 645–654. [Google Scholar] [CrossRef]
  26. Bouriaud, O.; Popa, I. Comparative dendroclimatic study of Scots pine, Norway spruce, and silver fir in the Vrancea Range, Eastern Carpathian Mountains. Trees Struct. Funct. 2009, 23, 95–106. [Google Scholar] [CrossRef]
  27. Boden, S.; Kahle, H.; Von Wilpert, K.; Spiecker, H. Resilience of Norway spruce (Picea abies (L.) Karst) growth to changing climatic conditions in Southwest Germany. For. Ecol. Manag. 2014, 315, 12–21. [Google Scholar] [CrossRef]
  28. Hentschel, R.; Rosner, S.; Kayler, Z.E.; Andreassen, K.; Børja, I.; Solberg, S.; Tveito, O.E.; Priesack, E.; Gessler, A. Norway spruce physiological and anatomical predisposition to dieback. For. Ecol. Manag. 2014, 322, 27–36. [Google Scholar] [CrossRef]
  29. Lebourgeois, F.; Rathgeber, C.B.K.; Ulrich, E. Sensitivity of French temperate coniferous forests to climate variability and extreme events (Abies alba, Picea abies and Pinus sylvestris). J. Veg. Sci. 2010, 21, 364–376. [Google Scholar] [CrossRef]
  30. Solberg, S. Summer drought: A driver for crown condition and mortality of Norway spruce in Norway. For. Pathol. 2004, 34, 93–104. [Google Scholar] [CrossRef]
  31. Bouriaud, O.; Leban, J.-M.; Bert, D.; Deleuze, C. Intra-annual variations in climate influence growth and wood density of Norway spruce. Tree Physiol. 2005, 25, 651–660. [Google Scholar] [CrossRef] [Green Version]
  32. Lévesque, M.; Saurer, M.; Siegwolf, R.; Eilmann, B.; Brang, P.; Bugmann, H.; Rigling, A. Drought response of five conifer species under contrasting water availability suggests high vulnerability of Norway spruce and European larch. Glob. Chang. Biol. 2013, 19, 3184–3199. [Google Scholar] [CrossRef]
  33. Panayotov, M.; Kulakowski, D.; Tsvetanov, N.; Krumm, F.; Barbeito, I.; Bebi, P. Climate extremes during high competition contribute to mortality in unmanaged self-thinning Norway spruce stands in Bulgaria. For. Ecol. Manag. 2016, 369, 74–88. [Google Scholar] [CrossRef]
  34. Rosner, S.; Světlík, J.; Andreassen, K.; Børja, I.; Dalsgaard, L.; Evans, R.; Luss, S.; Tveito, O.E.; Solberg, S. Novel hydraulic vulnerability proxies for a boreal conifer species reveal that opportunists may have lower survival prospects under extreme climatic events. Front. Plant Sci. 2016, 7, 831. [Google Scholar] [CrossRef] [PubMed] [Green Version]
  35. Büntgen, U.; Frank, D.C.; Schmidhalter, M.; Neuwirth, B.; Seifert, M.; Esper, J. Growth/climate response shift in a long subalpine spruce chronology. Trees Struct. Funct. 2006, 20, 99–110. [Google Scholar] [CrossRef] [Green Version]
  36. Carrer, M.; Motta, R.; Nola, P. Significant mean and extreme climate sensitivity of Norway spruce and Silver fir at mid-elevation mesic sites in the Alps. PLoS ONE 2012, 7, e50755. [Google Scholar] [CrossRef] [PubMed] [Green Version]
  37. Castagneri, D.; Petit, G.; Carrer, M. Divergent climate response on hydraulic-related xylem anatomical traits of Picea abies along a 900-m altitudinal gradient. Tree Physiol. 2015, 35, 1378–1387. [Google Scholar] [CrossRef] [PubMed] [Green Version]
  38. Haylock, M.R.; Hofstra, N.; Klein Tank, A.M.G.; Klok, E.J.; Jones, P.D.; New, M. A European daily high-resolution gridded data set of surface temperature and precipitation for 1950–2006. J. Geophys. Res. 2008, 113, D20119. [Google Scholar] [CrossRef] [Green Version]
  39. Regent Instruments Canada Inc. WINDENDRO for Tree-Ring Analysis; Regent Instruments Canada Inc.: Québec City, QC, Canada, 2012. [Google Scholar]
  40. Holmes, R.L. Computer-assisted quality control in tree-ring dating and measurement. Tree-Ring Bull. 1983, 43, 69–78. [Google Scholar]
  41. Cook, E.R.; Peters, K. The smoothing spline: A new approach to standardizing forest interior tree-ring width series for dendroclimatic studies. Tree-Ring Bull. 1981, 41, 45–53. [Google Scholar]
  42. Cook, E.R.; Kairiukstis, L.A. (Eds.) Methods of Dendrochronology: Applications in the Environmental Sciences; Springer: Dordrecht, The Netherlands, 1990. [Google Scholar]
  43. Bunn, A.G. A dendrochronology program library in R (dplR). Dendrochronologia 2008, 26, 115–124. [Google Scholar] [CrossRef]
  44. De Martonne, E. Une nouvelle fonction climatologique: L’indice d’aridité. Meteorologie 1926, 2, 449–458. [Google Scholar]
  45. Zang, C.; Biondi, F. Dendroclimatic calibration in R: The bootRes package for response and correlation function analysis. Dendrochronologia 2013, 31, 68–74. [Google Scholar] [CrossRef]
  46. Burnham, K.P.; Anderson, D.R. Model Selection and Multi-Model Inference: A Practical Information-Theoretic Approach; Springer: Heidelberg, Germany, 2002; pp. 60–74. [Google Scholar]
  47. SAS Institute Inc. SAS/STAT® 14.1 User’s Guide; SAS Institute Inc.: Cary, NC, USA, 2015. [Google Scholar]
  48. Chatterjee, S.; Hadi, A.S. Analysis of Collinear Data. In Regression Analysis by Example, 4nd ed.; John Wiley & Sons, Inc.: Hoboken, NJ, USA, 2006. [Google Scholar]
  49. IPCC. Climate Change 2013: The Physical Science Basis; Part of Working Group I Contribution to the Fifth Assessment Report of the Intergovernmental Panel on Climate Change; Cambridge University Press: Cambridge, UK; New York, NY, USA, 2013; 1535p. [Google Scholar]
  50. Hamann, A.; Wang, T.; Spittlehouse, D.L.; Murdock, T.Q. A comprehensive, high-resolution database of historical and projected climate surfaces for western North America. Bull. Am. Meteorol. Soc. 2013, 94, 1307–1309. [Google Scholar] [CrossRef]
  51. Wigley, T.M.L.; Briffa, K.R.; Jones, P.D. On the average value of correlated time series, with applications in dendroclimatology and hydrometeorology. J. Clim. Appl. Meteorol. 1984, 23, 201–213. [Google Scholar] [CrossRef]
  52. Schmitt, U.; Jalkanen, R.; Eckstein, D. Cambium dynamics of Pinus sylvestris and Betula spp. in the northern boreal forest in Finland. Silva Fenn. 2004, 38, 167–178. [Google Scholar] [CrossRef] [Green Version]
  53. Rossi, S.; Deslauriers, A.; Anfodillo, T.; Carraro, V. Evidence of threshold temperatures for xylogenesis in conifers at high altitudes. Oecologia 2007, 152, 1–12. [Google Scholar] [CrossRef] [PubMed]
  54. Partanen, J.; Koski, V.; Hänninen, H. Effects of photoperiod and temperature on the timing of bud burst in Norway spruce (Picea abies). Tree Physiol. 1998, 18, 811–816. [Google Scholar] [CrossRef] [PubMed]
  55. Carneros, E.; Yakovlev, I.; Viejo, M.; Olsen, J.E.; Fossda, C.G. The epigenetic memory of temperature during embryogenesis modifies the expression of bud burst-related genes in Norway spruce epitypes. Planta 2017, 246, 553–566. [Google Scholar] [CrossRef] [PubMed]
  56. Mäkinen, H.; Nöjd, P.; Kahle, H.-P.; Neumann, U.; Tveite, B.; Mielikäinen, K.; Röhle, H.; Spiecker, H. Large-scale climatic variability and radial increment variation of Picea abies (L.) Karst. in central and northern Europe. Trees Struct. Funct. 2003, 17, 173–184. [Google Scholar] [CrossRef]
  57. Begum, S.; Nakaba, S.; Bayramzadeh, V.; Oribe, Y.; Kubo, T.; Funada, R. Temperature responses of cambial reactivation and xylem differentiation in hybrid poplar (Populus sieboldii x P. grandidentata) under natural conditions. Tree Physiol. 2008, 28, 1813–1819. [Google Scholar] [CrossRef] [Green Version]
  58. Deslauriers, A.; Rossi, S.; Anfodillo, T.; Saracino, A. Cambial phenology, wood formation and temperature thresholds in two contrasting years at high altitude in southern Italy. Tree Physiol. 2008, 28, 863–871. [Google Scholar] [CrossRef] [Green Version]
  59. Lupi, C.; Morin, H.; Deslauriers, A.; Rossi, S. Xylem phenology and wood production: Resolving the chicken-or-egg dilemma. Plant Cell Environ. 2010, 33, 1721–1730. [Google Scholar] [CrossRef] [PubMed]
  60. Lenz, A.; Hoch, G.; Körner, C. Early season temperature controls cambial activity and total tree ring width at the alpine treeline. Plant Ecol. Divers. 2013, 6, 365–375. [Google Scholar] [CrossRef]
  61. Zang, C.; Pretzsch, H.; Rothe, A. Size-dependent responses to summer drought in Scots pine, Norway spruce and common oak. Trees Struct. Funct. 2012, 26, 557–569. [Google Scholar] [CrossRef]
  62. Zang, C.; Hartl-Meier, C.; Dittmar, C.; Rothe, A.; Menzel, A. Patterns of drought tolerance in major European temperate forest trees: Climatic drivers and levels of variability. Glob. Chang. Biol. 2014, 20, 3767–3779. [Google Scholar] [CrossRef] [PubMed]
  63. Lévesque, M.; Rigling, A.; Bugmann, H.; Weber, P.; Brang, P. Growth response of five co-occurring conifers to drought across a wide climatic gradient in Central Europe. Agric. For. Meteorol. 2014, 197, 1–12. [Google Scholar] [CrossRef]
  64. Schmid, I.; Kazda, M. Root distribution of Norway spruce in monospecific and mixed stands on different soils. For. Ecol. Manag. 2002, 159, 37–47. [Google Scholar] [CrossRef]
  65. Zweifel, R.; Rigling, A.; Dobbertin, M. Species-specific stomatal response of trees to drought—A link to vegetation dynamics? J. Veg. Sci. 2009, 20, 442–454. [Google Scholar] [CrossRef]
  66. Stinziano, J.R.; Hüner, N.P.A.; Way, D.A. Warming delays autumn declines in photosynthetic capacity in a boreal conifer, Norway spruce (Picea abies). Tree Physiol. 2015, 35, 1303–1313. [Google Scholar] [CrossRef] [Green Version]
  67. McDowell, N.; Pockman, W.T.; Allen, C.D.; Breshears, D.D.; Cobb, N.; Kolb, T.; Plaut, J.; Sperry, J.; West, A.; Williams, D.G.; et al. Mechanisms of plant survival and mortality during drought: Why do some plants survive while others succumb to drought? New Phytol. 2008, 178, 719–739. [Google Scholar] [CrossRef]
  68. Atkin, O.K.; Macherel, D. The crucial role of plant mitochondria in orchestrating drought tolerance. Ann. Bot. 2009, 103, 581–597. [Google Scholar] [CrossRef] [Green Version]
  69. Gričar, J.; Prislan, P.; De Luis, M.; Gryc, V.; Hacurová, J.; Vavrčík, H.; Čufar, K. Plasticity in variation of xylem and phloem cell characteristics of Norway spruce under different local conditions. Front. Plant Sci. 2015, 6, 730. [Google Scholar] [CrossRef] [PubMed] [Green Version]
  70. Sigurdsson, B.D.; Roberntz, P.; Freeman, M.; Næss, M.; Saxe, H.; Thorgeirsson, H.; Linder, S. Impact studies on Nordic forests: Effects of elevated CO2 and fertilization on gas exchange. Can. J. For. Res. 2002, 32, 779–788. [Google Scholar] [CrossRef]
  71. Handa, I.T.; Körner, C.; Hättenschwiler, S. Conifer stem growth at the altitudinal treeline in response to four years of CO2 enrichment. Glob. Chang. Biol. 2006, 12, 2417–2430. [Google Scholar] [CrossRef]
  72. Bellassen, V.; Viovy, N.; Luyssaert, S.; Le Maire, G.; Schelhaas, M.-J.; Ciais, P. Reconstruction and attribution of the carbon sink of European forests between 1950 and 2000. Glob. Chang. Biol. 2011, 17, 3274–3292. [Google Scholar] [CrossRef]
  73. Sigurdsson, B.D.; Medhurst, J.L.; Wallin, G.; Eggertsson, O.; Linder, S. Growth of mature boreal Norway spruce was not affected by elevated [CO2] and/or air temperature unless nutrient availability was improved. Tree Physiol. 2013, 33, 1192–1205. [Google Scholar] [CrossRef] [PubMed] [Green Version]
  74. Wallin, G.; Hall, M.; Slaney, M.; Räntfors, M.; Medhurst, J.; Linder, S. Spring photosynthetic recovery of boreal Norway spruce under conditions of elevated [CO2] and air temperature. Tree Physiol. 2013, 33, 1177–1191. [Google Scholar] [CrossRef] [Green Version]
  75. Reyer, C.; Lasch-Born, P.; Suckow, F.; Gutsch, M.; Murawski, A.; Pilz, T. Projections of regional changes in forest net primary productivity for different tree species in Europe driven by climate change and carbon dioxide. Ann. For. Sci. 2014, 71, 211–225. [Google Scholar] [CrossRef]
  76. Baig, S.; Medlyn, B.E.; Mercado, L.M.; Zaehle, S. Does the growth response of woody plants to elevated CO2 increase with temperature? A model-oriented meta-analysis. Glob. Chang. Biol. 2015, 21, 4303–4319. [Google Scholar] [CrossRef] [Green Version]
  77. Schaphoff, S.; Reyer, C.P.O.; Schepaschenko, D.; Gerten, D.; Shvidenko, A. Tamm Review: Observed and projected climate change impacts on Russia’s forests and its carbon balance. For. Ecol. Manag. 2016, 361, 432–444. [Google Scholar] [CrossRef] [Green Version]
  78. Asshoff, R.; Zotz, G.; Körner, C. Growth and phenology of mature temperate forest trees in elevated CO2. Glob. Chang. Biol. 2006, 12, 848–861. [Google Scholar] [CrossRef]
  79. Leuzinger, S.; Bader, M.K.F. Experimental vs. modeled water use in mature Norway spruce (Picea abies) exposed to elevated CO2. Front. Plant Sci. 2012, 3, 229. [Google Scholar] [CrossRef] [PubMed] [Green Version]
  80. Lavergne, A.; Graven, H.; De Kauwe, M.G.; Keenan, T.F.; Medlyn, B.E.; Prentice, I.C. Observed and modelled historical trends in the water-use efficiency of plants and ecosystems. Glob. Chang. Biol. 2019, 25, 2242–2257. [Google Scholar] [CrossRef] [PubMed] [Green Version]
  81. Olesen, M.; Madsen, K.S.; Ludwigsen, C.A.; Boberg, F.; Christensen, T.; Cappelen, J.; Christensen, O.B.; Andersen, K.K.; Christensen, J.H. Fremtidige Klimaforandringer i Danmark [Future Climate Changes in Denmark]; Danmarks Klimacenter, Rapport No. 6; Danmarks Meteorologiske Institut: Copenhagen, Denmark, 2014. [Google Scholar]
  82. Marini, L.; Økland, B.; Jönsson, A.M.; Bentz, B.; Carroll, A.; Forster, B.; Grégoire, J.-C.; Hurling, R.; Nageleisen, L.M.; Netherer, S.; et al. Climate drivers of bark beetle outbreak dynamics in Norway spruce forests. Ecography 2017, 40, 1426–1435. [Google Scholar] [CrossRef]
  83. Holuša, J.; Lubojacký, J.; Čurn, V.; Tonka, T.; Lukášová, K.; Horák, J. Combined effects of drought stress and Armillaria infection on tree mortality in Norway spruce plantations. For. Ecol. Manag. 2018, 427, 434–445. [Google Scholar] [CrossRef]
  84. Neto, O.C.; Aguiar, A.V.; Twyford, A.D.; Neaves, L.E.; Pennington, R.T.; Lopes, A.V. Genetic and ecological outcomes of Inga vera Subsp. affinis (Leguminosae) tree plantations in a fragmented tropical landscape. PLoS ONE 2014, 9, e99903. [Google Scholar] [CrossRef] [Green Version]
  85. Ivetić, V.; Devetaković, J.; Nonić, M.; Stanković, D.; Šijačić-Nikolić, M. Genetic diversity and forest reproductive material—From seed source selection to planting. iForest 2016, 9, 801–812. [Google Scholar] [CrossRef] [Green Version]
  86. Iverson, L.R.; Prasad, A.M.; Matthews, S.N.; Peters, M. Estimating potential habitat for 134 eastern US tree species under six climate scenarios. For. Ecol. Manag. 2008, 254, 390–406. [Google Scholar] [CrossRef]
  87. Lasch, P.; Badeck, F.W.; Lindner, M.; Suckow, F. Sensitivity of simulated forest growth to changes in climate and atmospheric CO2. Forstwiss. Centralbl. 2002, 121, 155–171. [Google Scholar]
  88. Buisson, L.; Thuiller, W.; Casajus, N.; Lek, S.; Grenouillet, G. Uncertainty in ensemble forecasting of species distribution. Glob. Chang. Biol. 2010, 16, 1145–1157. [Google Scholar] [CrossRef]
  89. Monastersky, R. Global carbon dioxide levels near worrisome milestone. Nature 2013, 497, 13–14. [Google Scholar] [CrossRef] [Green Version]
  90. Depardieu, C.; Girardin, M.P.; Nadeau, S.; Lenz, P.; Bousquet, J.; Isable, N. Adaptive genetic variation to drought in a widely distributed conifer suggests a potential for increasing forest resilience in a drying climate. New Phytol. 2020, 227, 427–439. [Google Scholar] [CrossRef] [PubMed] [Green Version]
  91. Trujillo-Moya, C.; George, J.-P.; Fluch, S.; Geburek, T.; Grabner, M.; Karanitsch-Ackerl, S.; Konrad, H.; Mayer, K.; Sehr, E.M.; Wischnitzki, E.; et al. Drought sensitivity of Norway spruce at the species’ warmest fringe: Quantitative and molecular analysis reveals high genetic variation among and within provenances. G3 Genes Genom. Genet. 2018, 8, 1225–1245. [Google Scholar] [CrossRef] [PubMed] [Green Version]
  92. Sonesson, J.; Eriksson, G. Genetic variation in drought tolerance in Picea abies seedlings and its relationship to growth in controlled and field environments. Scand. J. For. Res. 2003, 18, 7–18. [Google Scholar] [CrossRef]
  93. Jamnická, G.; Fleischer, P., Jr.; Konôpková, A.; Pšidová, E.; Kučerová, J.; Kurjak, D.; Živčák, M.; Ditmarová, L’. Norway spruce (Picea abies L.) provenances use different physiological strategies to cope with water deficit. Forests 2019, 10, 651. [Google Scholar] [CrossRef] [Green Version]
  94. Yakovlev, I.; Fossdal, C.G.; Johnsen, Ø. MicroRNAs, the epigenetic memory and climatic adaptation in Norway spruce. New Phytol. 2010, 187, 1154–1169. [Google Scholar] [CrossRef]
  95. Yakovlev, I.; Asantea, D.K.A.; Fossdal, C.G.; Junttila, O.; Johnsen, Ø. Differential gene expression related to an epigenetic memory affecting climatic adaptation in Norway spruce. Plant Sci. 2011, 180, 132–139. [Google Scholar] [CrossRef]
  96. Kijowska-Oberc, J.; Staszak, A.M.; Kamiński, J.; Ratajczak, E. Adaptation of forest trees to rapidly changing climate. Forests 2020, 11, 123. [Google Scholar] [CrossRef] [Green Version]
  97. Nakamura, M.; Batista, R.A.; Köhler, C.; Hennig, L. Polycomb Repressive Complex 2-mediated histone modification H3K27me3 is associated with embryogenic potential in Norway spruce. J. Exp. Bot. 2020, 71, 6366–6378. [Google Scholar] [CrossRef]
Figure 1. Map of Denmark with site locations. Site codes are explained in Table 1.
Forests 12 00036 g001
Figure 2. Standardized tree-ring width indices for each studied plantation stand and common garden trial. The black line refers to the average chronologies; the grey-shaded area indicates the standard deviation of single time-series; and the red line shows the 10-year cubic spline function used for standardization. Sample depth is indicated by the blue dotted line related to the second y-axis.
Forests 12 00036 g002aForests 12 00036 g002b
Figure 3. Bootstrapped response correlation coefficients between the tree-ring indexes and monthly drought index (DI) and monthly mean temperature (Tg) for the fourteen plantation stands (see Table 1 for stand codes). Months in capital letters indicate the current year of ring formation, and months in lower case refers to climate variables during the year preceding ring formation. Significant correlations are represented by black solid dot (p < 0.05), black circle (p < 0.01) and black circle with cross (p < 0.001). Bootstrapped response correlation coefficients for the six field trials (e.g., 1008, 1009, 1010, 1011, 1013 and 1014) are referred to Huang et al. [9].
Forests 12 00036 g003aForests 12 00036 g003b
Figure 4. Future summer drought index (DI68, cumulated drought index from June to August) and autumn temperature (tg89, average temperature for August and September) relative to 1991–2009 considering the emission scenario RCP4.5 (a) and RCP8.5 (b). Each box indicates the climate changes compared to the reference period for the 14 Norway spruce plantation stands (dataset 1) in west Denmark (mean, one standard deviation, and minimum to maximum range) are given for the periods 2020s (2011–2040), 2050s (2041–2070) and 2080s (2071–2100) for 15 Global Climate Models (AOGCMs) of the CMIP5 multi-model (i.e., ACCESS1.0, CanESM2, CCSM4, CESM1-CAM5, etc.). The grey dashed horizontal line indicates the mean value of the 15 Global Climate Models.
Forests 12 00036 g004
Figure 5. Histograms of predicted future growth of Norway spruce expressed as percentage of the growth for the reference period of 1991–2009. The variation in predicted growth is due to different climate response models between 13 different stands in west Denmark (dataset 1, plantation, red bars) and 5 field trials across Denmark (dataset 2, common garden, green bar), and among the 15 regional climate prediction models (based on either the RCP4.5 or the RCP8.5 scenarios). The periods 2011–2040 (2020s), 2041–2070 (2050s) and 2071–2100 (2080s) are shown. The projection of stand Ma and site 1013 were not included (see Section 2.5). The projected climate data were obtained from 15 Global Climate Models (AOGCMs) of the CMIP5 multi-model considering the emission scenario RCP4.5 and RCP8.5, as available at http://tinyurl.com/ClimateEU. For further information about the calculation of the projections, please see supplementary Table S1 and Table 5 in Huang et al. [9].
Forests 12 00036 g005
Figure 6. Shares of explained covariance among stands (trials), Global Climate Models (AOGCMs) and residuals for both the plantation stands and the common garden trials (13 plantation stands; 5 field trials) for two different emission scenarios (RCP4.5 and RCP8.5) and three projections periods. The projections of stand Ma and site 1013 were not included (see Section 2.5).
Forests 12 00036 g006
Table 1. Overview and main characteristics of the studied Norway spruce sites.
Sites (Forests)AbbreviationNumber of StandsYear of EstablishmentLatitude (N)Longitude (E)Mean Annual Temperature a
(°C)
Annual Precipitation a (mm)Trees/RadiiPeriodAverage Ring Width (mm)Rbar bEPS b
Fourteen Norway spruce stands (1. Plantation)Buderupholm HollandshusBuh21942–194356.89.97.465120/761958–19872.90 ± 1.280.670.97
Fårhus plantageFaarh3195154.99.37.8814127/5051958–19873.44 ± 1.300.681.00
Lundbæk plantageLundb41942–195254.99.27.882372/2861957–19863.10 ± 1.320.640.99
Kelstrup plantageKe1195154.99.47.881458/2321973–19873.48 ± 1.600.630.99
SilkeborgSi1193256.19.57.767910/401950–19872.98 ± 1.130.550.91
Bommerlund plantageBom1195954.99.47.881410/401973–19874.08 ± 1.600.690.94
MattrupMa1195055.99.57.867310/401973–19874.29 ± 1.480.740.97
Rens HedegårdRh1193454.99.17.882333/1321958–19873.03 ± 1.290.730.99
Six trials from a Danish common garden experiment. For further information, please see Huang et al. [9]. (2. Common garden)1008-11964–196556.510.58.16356/241969–20123.34 ± 1.760.420.94
1009-11964–196555.99.28.27486/241970–20123.35 ± 1.590.320.90
1010-11964–196555.511.88.75366/241969–20123.04 ± 1.840.460.95
1011-11964–196556.012.48.65746/241970–20123.05 ± 1.470.380.93
1013-11964–196557.29.58.06446/241972–20122.05 ± 1.490.330.91
1014-11964–196556.38.48.57406/241971–20122.17 ± 1.120.590.97
a For the 14 Norway spruce stands: average data refer to the period 1950–1987; for the six trials from the common garden experiment the data refer to the period 1961–2012. b Rbar.bt, mean inter-series correlation between all individual tree ring width time series; EPS is the expressed population signal.
Table 2. Overview of the selected best multi-regressed climate-growth models fitted to each studied Norway spruce stand/trial.
Stand/TrialModel aAIC bΔiAIC cR2
Si(+) DI38−62.000.25
(−) lag1tg89−60.11.90.15
Rh(+) DI58 (−) lag1tg89−17.900.58
(+) DI58−16.01.90.47
Ma(+) lag1DI56 (+) lag1tg612 (−) lag1tg6122 −19.300.84
(+) lag1DI56 (−) lag1DI562 (+) lag1tg612 −19.300.52
lundb1 (+) DI78 (+) Tg35−26.700.69
lundb2 (+) DI58−17.000.48
(+) DI58 (+) Tg5 −16.40.60.56
(+) DI58 (+) lag1tg7_1 (−) lag1tg7_12 −15.91.10.62
(+) DI58 (−) DI582 (−) lag1tg7_1 −15.91.10.49
lundb3 (+) DI78 (+) Tg5−14.700.70
lundb4 (+) DI78 (+) Tg35−19.70.00.78
Ke(+) DI78−15.10.00.74
(+) DI78 (−) Tg45 (+) Tg452 −13.81.30.83
(+) DI78 (−) DI782 (+) Tg45 −13.81.30.88
(+) DI78 (+) lag1DI46−13.31.80.83
faarh1(+) DI67−31.60.00.53
faarh2(+) DI67−24.40.00.59
(+) DI67 (−) lag1tg6_1−23.90.50.66
(+) DI67 (+) lag1tg6_1 (−) lag1tg6_12−23.21.20.72
(+) DI67 (−) DI672 (−) lag1tg6_1−23.21.20.74
faarh3(+) DI67 (−) DI672−29.20.00.80
(+) DI67−28.01.20.66
buh1 (+) lag1DI811 (−) lag1tg710−35.20.00.51
buh2 (+) DI67−28.80.00.33
(+) Tg45−27.90.90.21
(+) lag1DI611−27.01.80.31
Bom(+) DI78−12.00.00.73
(+) DI78 (−) Tg45 (+) Tg452 −10.41.60.81
(+) DI78 (−) DI782 (+) Tg45−10.41.60.78
1008(+) DI67−42.600.46
(+) DI67 (−) lag1tg910−42.40.20.54
1009(+) DI67−58.900.15
1010(−) lag1tg810−28.900.12
(−) Tg6−28.70.20.13
1011(−) Tg6−46.500.19
1013(−) DI45−34.000.09
(−) lag1tg612−33.50.50.05
(+) Tg45−33.30.70.04
(+) lag1DI11−32.81.20.06
1014(+) DI67−27.800.42
(+) DI67 (−) lag1tg69−26.90.90.48
(+) DI67 (−) lag1tg69 (+) lag1tg692 −25.91.90.55
(+) DI67 (−) DI672 (−) lag1tg69−25.91.90.49
a (+) indicates positive effect and (−) indicates negative effect. DI: cumulated drought indices for different periods. E.g. DI67 is the cumulated drought index from June to July. Tg: mean temperatures for different periods, e.g., Tg35 is the average temperature for March, April and May current year. Previous year temperatures or previous year cumulated drought indices were given the prefix lag1, thus lag1tg6_1 is the average of previous year mean temperatures from June-December and the mean temperature in January current year. All the current-year spring temperatures and previous- and current-year growing season drought indices showed positive effects on tree ring indices across all the stands/trials, and previous-year autumn and winter temperatures showed negative effects. In addition, the effect of Tg6 at site 1011 is negative. The models with lowest AICs (in bold) were used for projection for each stand/trial. b AIC is the Akaike information criterion (AIC) of the model. c Δi: difference in Akaike information criterion (AIC) with respect to the best model with lowest AIC-value. A model with a higher AIC-value was considered if the difference is less than 2 (Δi ≤ 2) according to Burnham and Anderson [46]. Only the models with Δi ≤ 2 are showed in this table.
Publisher’s Note: MDPI stays neutral with regard to jurisdictional claims in published maps and institutional affiliations.

