Abstract
There has been a severely negative impact on soil water resources in temperate forests caused by the introduction of the type of heavy machinery in the forestry sector used for forest harvesting operations. These soil disturbances increase the raindrop impact on bare mineral soil, decrease infiltration rate, detach soil particles, and enhance surface flow. According to several studies, the role of slope gradient influence on runoff and soil loss continues to be an issue, and therefore more study is needed in both laboratory simulations and field experiments. It is important to define and understand what the impacts of slope gradient in harvesting practices are, so as to develop guidelines for forest managers. More knowledge on the key factors that cause surface runoff and soil loss is important in order to limit any negative results from timber harvesting operations performed on hilly terrains in mountainous forests. A field setting using a runoff plot 2 m2 in size was installed to individualize the effects of different levels of slope gradient (i.e., 5, 10, 15, 20, 25, 30, 35, and 40%) on the surface runoff, runoff coefficient, and sediment yield on the skid trails under natural rainfall conditions. Runoff and sediment yield were measured with 46 rainfall events which occurred during the first year after machine traffic from 17 July 2015 to 11 July 2016 under natural conditions. According to Pearson correlation, runoff (r = 0.51), runoff coefficient (r = 0.55), and sediment yield (r = 0.51) were significantly correlated with slope gradient. Results show that runoff increased from 2.45 to 6.43 mm as slope gradient increased from 5 to 25%, reaching to the critical point of 25% for slope. Also, further increasing the slope gradient from 25 to 40% led to a gradual decrease of the runoff from 6.43 to 4.62 mm. Runoff coefficient was significantly higher under the plot with a slope gradient of 25% by 0.265, whereas runoff coefficient was lowest under the plot with a slope gradient of 5%. Results show that sediment yield increased by increasing the slope gradient of plot ranging 5% to 30%, reaching to the critical point of 30%, and then decreased as the slope gradient increased from 35% to 40%. Runoff plot with a slope gradient of 30% (4.08 g m−2) ≈ plot length of 25% (3.91 g m−2) had a significantly higher sediment yield, whereas sediment yield was lowest under the plot with a slope gradient of 5% and 10%. A regression analysis of rainfall and runoff showed that runoff responses to rainfall for plots with different slope gradients were linearly and significantly increased. According to the current results, log skidding operations should be planned in the skid trails with a slope gradient lower than the 25 to 30% to suppress the negative effect of skidding operations on runoff and sediment yield.
1. Introduction
Vegetation plays an intercepting role with canopy cover, thus protecting soil from erosion. The forest-covered basin has relatively little surface erosion, but timber harvesting changes canopy cover and exposes mineral soil to water and wind, resulting in a lower amount of evapotranspiration [1,2,3]. In addition, the change of vegetation has a profound effect on the water cycle and the reduction of vegetation, which are caused by logging operations increases surface runoff volume and overall water yield [4]. The change in land use can significantly affect the hydrology of a forested watershed [5]. Furthermore, the processes of erosion depend on crucial elements such as rainfall intensity, slope, type of soil, and silvicultural practices [1,6,7].
Many cases of ground-based extraction systems, as well as forest harvesting, have appeared to result in adverse effects on forest soils. In particular, skidding operations could lead to increased surface runoff, detachment, and deposition of eroded materials into urban infrastructures, resulting in even more natural hazards such as floods and landslides on the lowland coastlines [7].
Forest soils play a crucial role in ecosystem functionality and forest health of [3,8,9], but any disturbance or modification on soil parameters—including physio-chemical and biological properties—can cause a drastic change in the functional resiliency of forest soils, which has negative consequences such as compaction, surface flow, and soil erosion [10,11]. Severity and extent of soil damage generally depends on the method of forest operations and the machines used specifically on their weight, load, and number of passes [12].
The introduction of heavy, but not specialized machinery in the forestry sector used for forest harvesting operations has resulted, in some circumstances, in a severe impact on soil and water resources [13,14]. Some adverse effects of skidding operations are soil compaction, rutting, and soil disturbance [11,12,15,16]. These soil disturbances increase the raindrop impact on bare mineral soil, decrease infiltration rate, detache soil particles, and enhance surface flow, which could potentially increase in the amount of eroded materials moved and then deposited in downstream infrastructures [11]. Moreover, soil compaction has detrimental effects on soil physio-chemical and biological properties [7], which generates negative consequence by impeding plant growth [8,17,18]. Removal of the intact litter layer, herbaceous cover, and reduction of organic matter content on surface soil are the main influencing factors which expose bare soil to raindrop impact, making the soil prone to material detachment, and resulting in a loss of soil [19].
Several factors are known to be effective on surface runoff and soil erosion, including slope gradient, length, shape, and slope aspect [19,20,21,22,23]. Moreover, slope gradient is an important driver in the Revised Universal Soil Loss Equation (RUSLE) as a length-slope factor [24,25]. Previous studies have addressed the role of surface slope on the processes of runoff generation and soil loss in both rainfall simulator experiments [26,27] and under natural rainfall in field studies [19]. Some studies have shown that runoff/sediment yield increased as slope gradient increased [19,25,28,29,30]; however, some others have stated that runoff and soil loss declined by increasing slope angle [23,31].
The significantly increasing correlation between runoff and sediment yield and rainfall intensity in both experimental simulations and natural setting was reported by Nord and Esteves [28], El Kateb et al. [29], Zhang et al. [30], Jourgholami et al. [32], and Jourgholami and Labelle [33]. Hence, rainfall intensity may add to the slope length effect on surface flow generation and soil loss.
In the Hyrcanian forest (Northern Iran), Jourgholami et al. [19] reported that runoff and sediment yield significantly increased as the longitudinal gradient (i.e., 15, 25, and 35%) on skid trails increased. By applying rainfall simulation on the slope angle in the range of 5 to 25°, Khan et al. [27] concluded that water infiltration rate was reduced according to the increase in slope angle. In the rainfall simulator experiments on the tray with a slope angle ranging from 1.5 to 21.5°, Fox et al. [26] observed that the infiltration rate of water decreased as the slope degree increased to 11.5°; however, it then remained unchanged as the slope angle continued to increase over 11.5°. Accordingly, Morbidelli et al. [34] stated that the erosion process and sealing formation on bare mineral soil can affect slope efficacy in terms of water infiltration and surface flow. However, the effect of slope on water infiltration under natural conditions was controlled by important factors such as soil type, rainfall intensity, surface roughness, and litter layer, as well as herbaceous cover [35]. By studying the effect of slope gradient including 5°, 10°, 15°, 20°, and 25° under a plot length of 10 m, Zhang et al. [30] found that runoff and soil loss show a bell-shaped trend as slope gradient increased; there was an increasing trend towards reaching the 15° critical slope gradient point, and then there was a decreasing trend with the increase of the slope gradient in the range of 15° to 25°. Similar results were also reported by Liu and Singh [31], who concluded that the flow velocity and shear stress increased when reaching a critical point as slope gradient increased, then decreased with further increase in slope gradient. In terms of slope gradient, a critical point (or critical state) is the endpoint of a process or trend equilibrium curve, where the function is neither differentiable nor is the derivative equal to zero. Similarly, Nord and Esteves [28] emphasized that slope gradient significantly led to an increase in sediment yield. Furthermore, they [28] concluded that transport capacity and flow detachment rate were attributed to slope energy and shear stress that was influenced by slope gradient. In the field experiment with a plot size of 7 m2 at three levels of slope gradient (i.e., 10–20, 20–30, and >30%), El Kateb et al. [29] concluded that slope gradient significantly affected surface runoff and soil loss, stressing the effect of steeper slope gradient, which has a greater impact on increasing runoff and soil loss.
Among these factors, the steepness of hill slope surfaces has a key role in partitioning throughfall in terms of surface hydrology especially in infiltration and surface flows [36]. However, among the influencing factors not only compacted soil surface, but the slope of forest hills was also reported in the literature to affect water infiltration [36]. According to several studies, the role of slope gradient influence on runoff and soil loss is an issue which requires more study in both laboratory simulations and field experiments. More knowledge about the effects of slope gradient on runoff generation and soil loss is critically necessary to limit the negative effects of machine traffic on steep slopes in the mountainous forests. The objective of this study was to examine the effect of slope gradient on runoff, sediment yield, and runoff coefficient on experimental field plots under natural rainfall conditions following ground-based skidding operations on the skid trails. The hypothesis examined was that slope gradient has a significant influence on runoff, runoff coefficient, and sediment yield under natural rainfall conditions.
2. Materials and Methods
2.1. Site Description
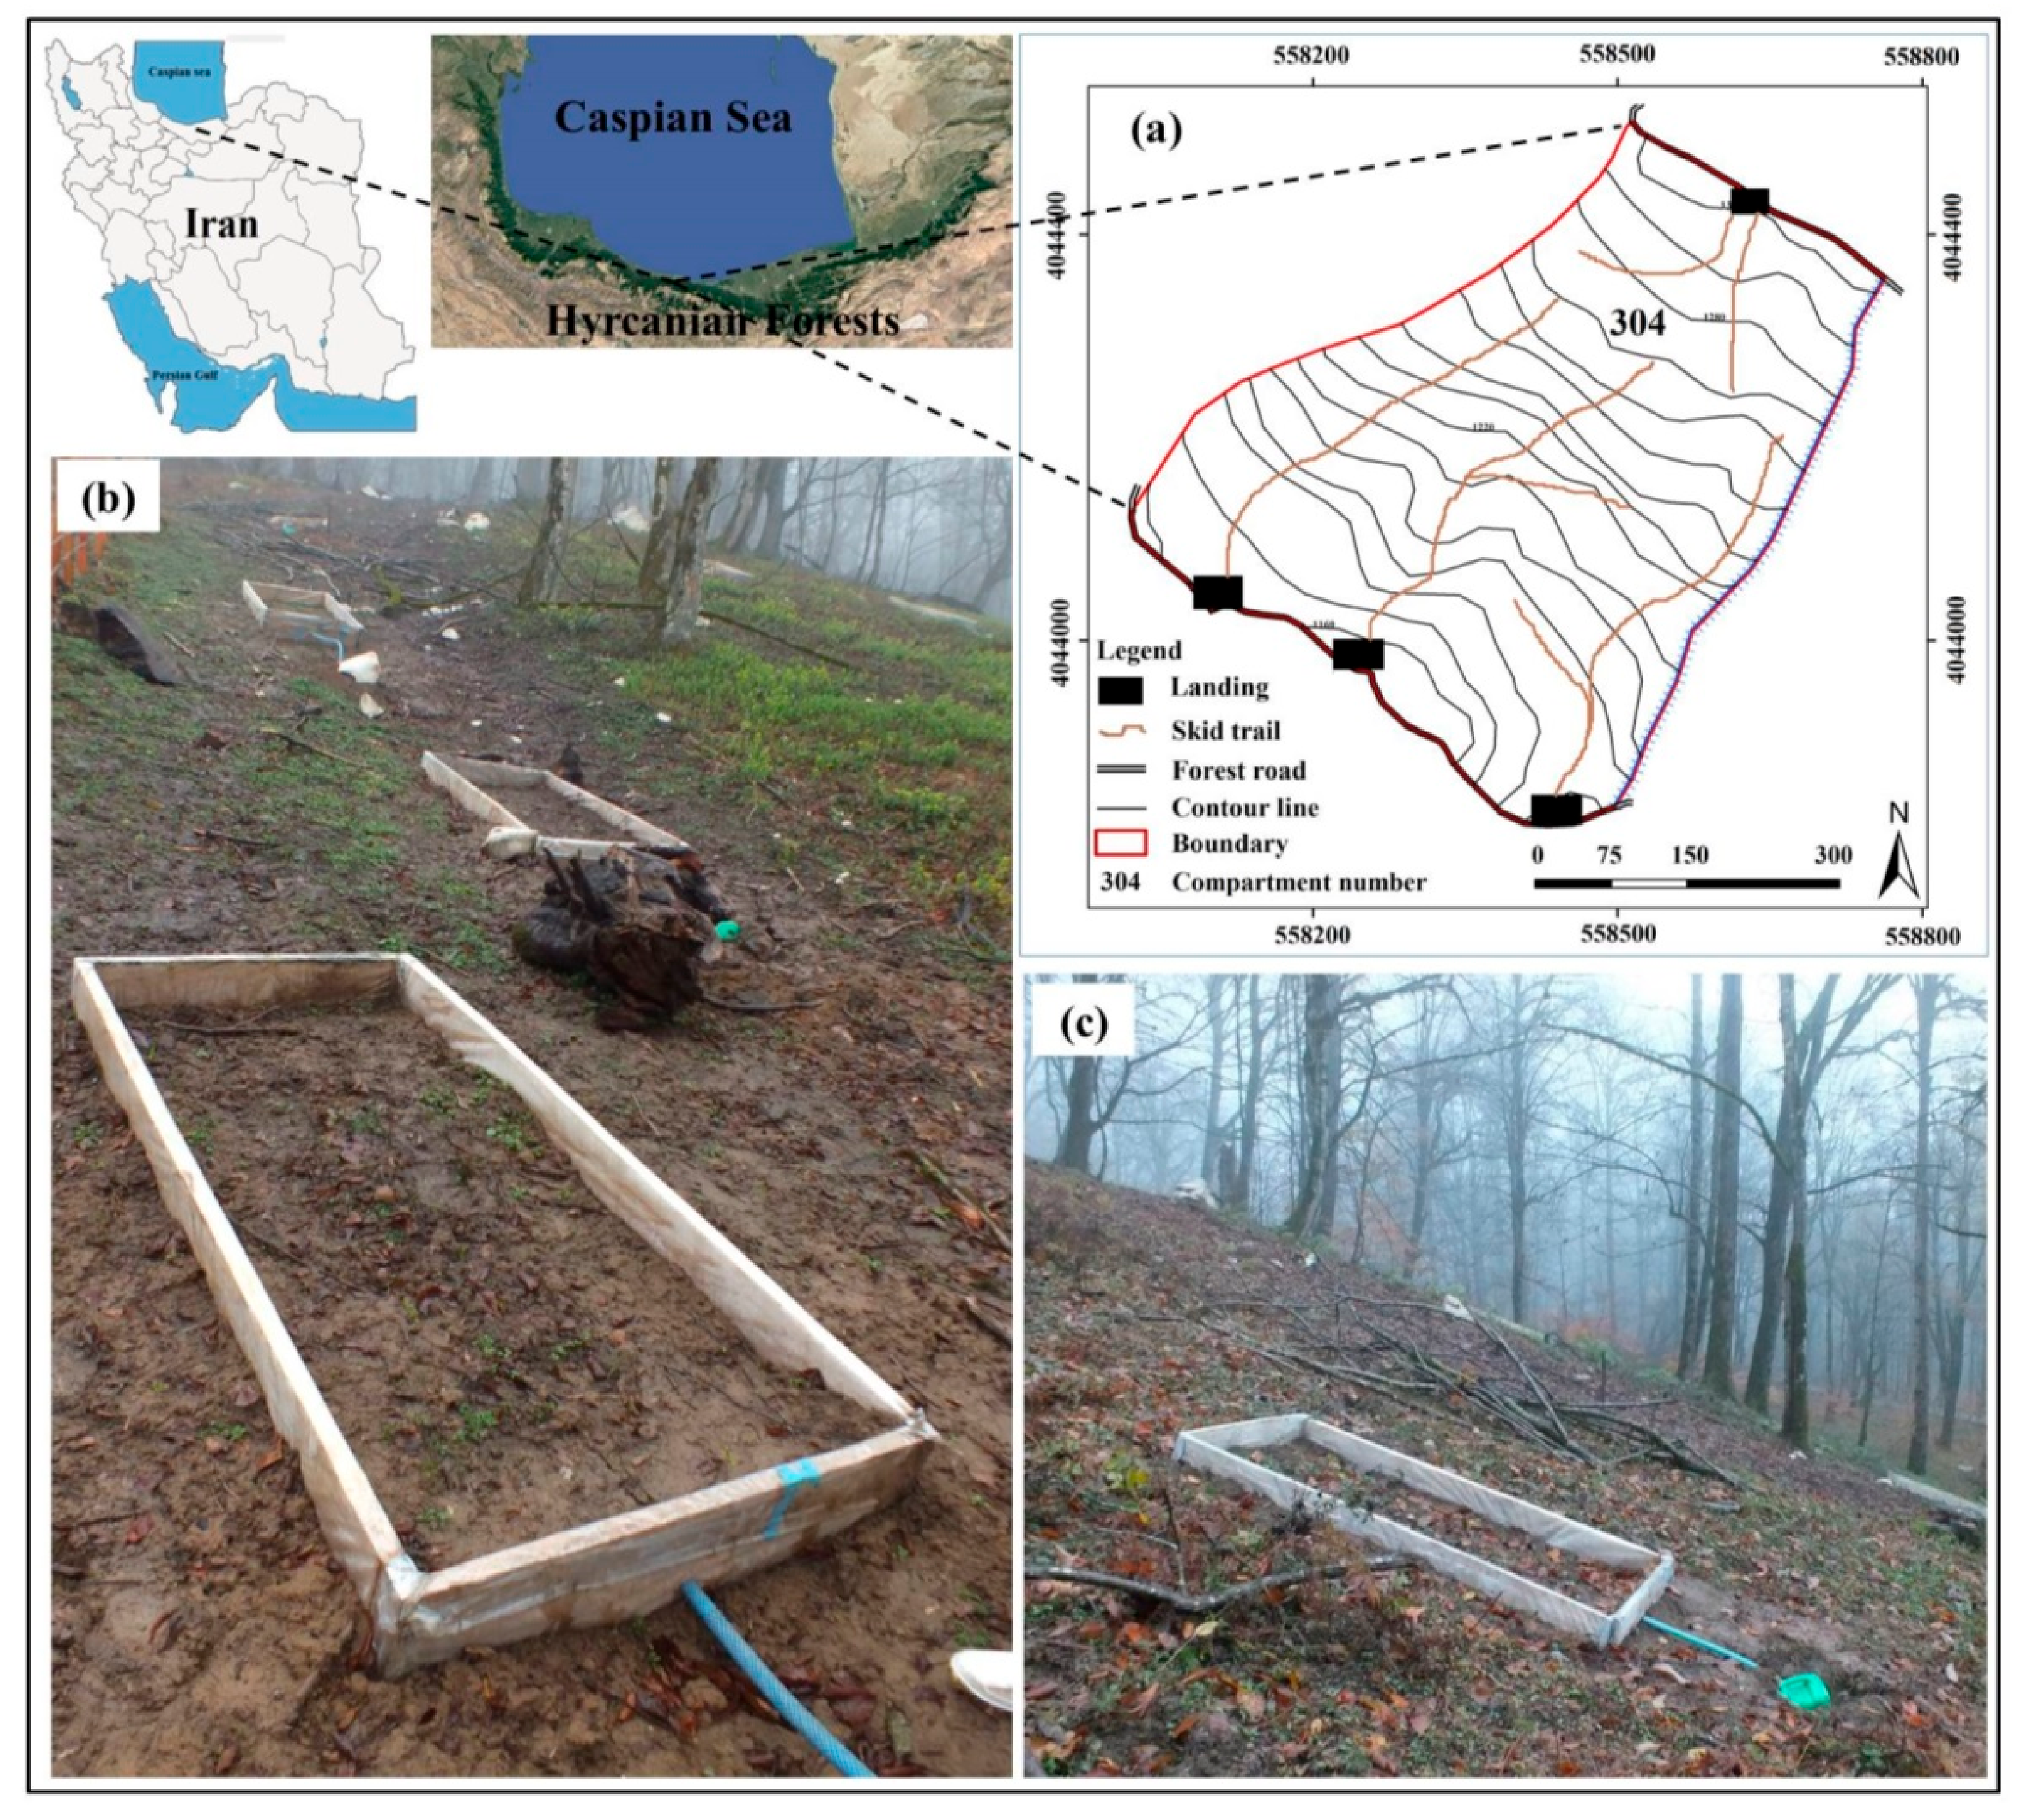
The study site is located in the mixed deciduous beech-hornbeam stands in the Forest Research Station of the University of Tehran (Kheyrud, compartment number: 304), which is part of the Hyrcanian forests in northern Iran (Figure 1a) at 36°32′22″ and 36°32′11″ latitude, 51°38′53″ and 51°39′15″ longitude. The Hyrcanian mountainous forests area stretches as a green belt on the southern coast of the Caspian Sea comprising the mixed deciduous forest with a high spot of floristic biodiversity (i.e., relict, endangered and endemic flora species) and ecological value. It also has temperate broad-leaved forests and the evolutionary process of these forests has been in constant progress since the Quaternary glaciations [37]. It is also worth noting that some parts of the Hyrcanian forests were included in the International Union for Conservation of Nature (IUCN) World Heritage list in 2019.
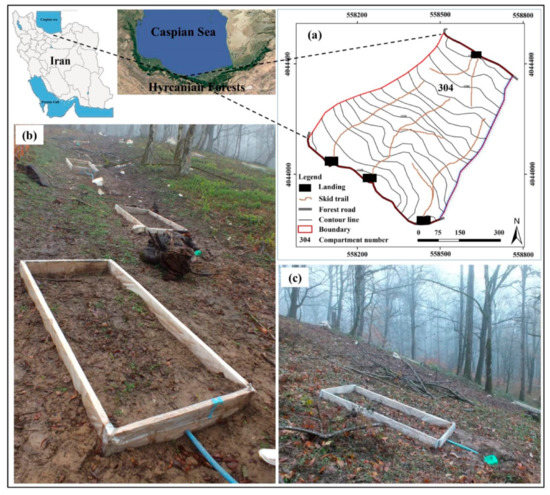
Figure 1.
(a) Location of the study area in the Hyrcanian forest, Northern Iran. (b) Runoff plot establishment on the different slope gradient of the skid trail segment, (c) runoff plot on the slope gradient of 35%.
The slope of site ranges from 5 to 40% with a southern aspect. The study stands are located at an elevation ranging from 1160 to 1300 m a.s.l. The climate of the study area is characterized as humid cold with a mean annual precipitation of 1376 mm and mean annual temperature of 7.8 °C. The maximum and minimum of rainfall occurs in October and July with the monthly amounts of 255.1 mm and 56.5 mm, respectively. Average monthly temperatures range from −0.4 °C in February to 18.1 °C in July. The soils at the investigated site are classified as Inceptisols with loam texture according to the USDA Soil Taxonomy and Cambisols according to the World Reference Base for Soil Resources (WRB). The study area is dominated with hornbeam (Carpinus betulus L., 50%), which is accompanied with oriental beech (Fagus orientalis Lipsky, 30%), chestnut-leaved oak (Quercus castaneifolia C.A.M., 10%), velvet maple (Acer velutinum Boiss., 5%), and Caucasian alder (Alnus subcordata C.A.M., 5%). The study area is covered by the main herbaceous species including Euphorbia amygdaloides, Cyclamen coum, Prunella vulgaris, Galium odoratum, Mercurialis perennis, Oplismenus undulatifolius, and Hypericum androsaemum. The average growing stock is 336.4 m3 ha−1 and stand density is 205.9 stem ha−1.
In the study area, two silvicultural treatments—including group and single tree selection—were used. Tree felling and processing were done by chainsaw in March 2015. Timberjack 450C wheeled skidder was employed to extract logs from the stump area to roadside landings in July 2015. The characteristics of a Timberjack 450C skidder are: An empty weight of 10.3 tons, tire pressure 220 kPa, average load volume of 2.67 cubic meters, and skid trail width of 3.4 m.
This study area was chosen due to similar environmental and management conditions, which can potentially be projected to many other contexts of temperate forests in the northern hemisphere. Setting up an experimental design in this sense allowed us to obtain data and results that could be valid and applicable in various international contexts.
2.2. Experimental Design and Measurements
In this study, three skid trails with the same traffic intensity (exposed to a high level of machine traffic (>20 machine cycles) were chosen after machine traffic for the setting up of the runoff plots (Figure 1b). In each selected skid trail, the segments of skid trails with a slope gradient of 5, 10, 15, 20, 25, 30, 35, and 40% were identified. Then, runoff plots with a width of 1 m and a length of 2 m (2 m2 area) were installed on slope gradients of 5, 10, 15, 20, 25, 30, 35 (Figure 1c), and 40% in each skid trail. The amounts of runoff volume were measured with 46 rainfall events which occurred during the first year after machine traffic from 17 July 2015 to 11 July 2016. The area of runoff plots was enclosed with wooden boards. These wooden boards were covered with plastic and dogged into the soil at a depth of 20 cm and 20 cm above to prevent water from entering into the plot area. A reservoir tank of 0.05 m3 was installed at the end of plot to collect the surface runoff. The generated surface runoff in each plot was transferred through a plastic (PVC) pipe. The collected runoff at the reservoir tank was gauged at each rainfall event via a measuring gauge. The total amount of runoff was divided by plot area of 2 m2 to determine runoff in mm. The stored runoff was stirred before sampling and a one-liter sub-sample was taken from every plot at each rainfall event to measure the eroded sediment. Runoff sub-samples were filtered via a 2-μm-filter paper, oven-dried at 105 °C for 24 h, and weighed to determine the sediment for each rainfall event. The dry weight of eroded sediment in sub-samples was multiplied with the total collected runoff in the reservoir tank to calculate the total eroded sediment [30]. The total sediment yield was divided by 2-square meters of plot area to calculate the sediment yield in gram per m2.
Runoff coefficient (RC) was estimated by Equation (1) [38]:
where RV (mm) is the runoff volume and TR (mm) is the total rainfall.
To measure gross rainfall, a rainfall gauge was installed in an area without canopy cover. The net rainfall was measured under canopy cover to consider the leaf-off period during the seasonal change in the deciduous forest stand. To measure the amount of throughfall above each runoff plot (net rainfall), a manual rain collector with a diameter of 9 cm and height of 20 cm was setup beside the runoff plot. After plot setting, some related variables including soil bulk density, total porosity, organic matter content, soil particle-size distribution, and canopy cover were measured in each runoff plot. One soil sample was taken beside each runoff plot from the surface soil with a depth of 0–10 cm using a steel cylinder (with a length of 100 mm and a diameter of 56 mm). Soil samples were placed in plastic bags, labeled, and transported to the laboratory. The soil properties and methods of analyzing are presented in the Table 1. Visual observation was applied to anticipate the canopy cover in three points at each runoff plot.

Table 1.
Methods of analyzing soil properties and calculations.
2.3. Statistical Analyses
Firstly, the normality of the data of each variable and the equality of variances between variables were confirmed by Kolmogorov-Smirnov test (α = 0.05) and Levene’s test (α = 0.05), respectively. The normality and homoscedasticity of the model residuals were also tested for ANOVA. One-way analysis of variance (ANOVA) was performed to compare soil properties and canopy cover among the different slope gradient plots. One-way analysis of variance (ANOVA) was used to compare runoff, runoff coefficient, and sediment yield to the different slope gradients of runoff plot (i.e., 5, 10, 15, 20, 25, 30, and 40%). The post hoc test was used to check the statistically significant differences among the treatments (slope gradient) by the Duncan test at P ≤ 0.05. Pearson correlation was applied to determine the relationship among treatments (slope gradient), runoff, runoff coefficient, sediment yield, some soil properties, and canopy cover. The parameters can be considered as a significant correlation when P ≤ 0.05. All statistical tests were performed using the SPSS software package (release 20; SPSS, Chicago, IL, USA). The polynomial regression model was used to predict the relationship between runoff, runoff coefficient, and sediment yield with the amount of rainfall and plot slope gradient by the Curve Expert Professional 1.6 software.
3. Results
3.1. Rainfall and Plot Characteristics
During the sampling period (17 July 2015–11 July 2016), a total of 1060 mm rainfall was recorded in the study area from 78 rainfall events. However, precipitation events <2 mm were not recorded since the events less than 2 mm did not pass through canopy cover. Hence, a total of 32 events were categorized in the class <2 mm and a total of 46 events were ≥2 mm. The rainfall average was at 23.04 (sd ± 24.79 mm) mm ranging from 2.6 to 106.8 mm.
ANOVA and Duncan’s test did not find any significant differences among soil properties including bulk density, total porosity, organic matter, soil particle size distribution (clay, sand, silt), and canopy cover in each plot length (Table 2). Pearson correlation analysis showed that slope gradient was significantly correlated with runoff (r = 0.51, P < 0.01), runoff coefficient (r = 0.55, P < 0.05), and sediment yield (r = 0.51, P < 0.01). Also, runoff was positively and significantly correlated with runoff coefficient (r = 0.93, P < 0.01) and sediment yield (r = 0.78, P < 0.01), whereas negatively correlated with silt (r = −0.46, P < 0.05). However, the sediment yield was positively and significantly correlated with runoff (r = 0.78, P < 0.01) and runoff coefficient (r = 0.83, P < 0.01) (Table 3). Furthermore, runoff and runoff coefficient were significantly negatively correlated with the percentage of soil silt, while the correlation of these values with the percentage of soil clay was significantly positive.

Table 2.
ANOVA results (Mean values ± sd) of different soil physical properties before the experiment started in 2015 in the runoff sample plots with different slope gradients (i.e., 5, 10, 15, 20, 25, 35, 30, and 40%).

Table 3.
Pearson correlation between slope gradient, runoff, runoff coefficient, sediment yield, some soil properties, and canopy cover.
3.2. Runoff, Runoff Coefficient, and Sediment Yield
ANOVA results showed that runoff, runoff coefficient, and sediment yield were significantly affected by slope gradients in runoff plots (P < 0.01) (Table 4).

Table 4.
ANOVA for the effect of slope gradient on runoff, runoff coefficient, and sediment yield. ** P < 0.01.
Results show that runoff increased as slope gradient (ranging from 2.45 to 6.43 mm) reaching the critical point of 25% for slope, then runoff decreased with an increasing slope gradient from 25% to 40%. The greatest value of runoff was 6.43 mm, which observed at a slope of 25%, it was not significantly different from runoff on the slope of 30% (6.07 mm). Runoff was lowest at the slope of 5% by 2.45 mm (Table 5).

Table 5.
Mean (±sd. Error) of runoff, runoff coefficient, and sediment yield on different slope gradient of plot (i.e., 5, 10, 15, 20, 25, 30, 35, and 40%).
Runoff coefficient was significantly higher at the slope of 25% by 0.265; where runoff coefficient was lowest on the plot with a slope of 5% (Table 5).
Results show that sediment yield increased with increasing slope gradient, ranging from 5% to 30%, reaching the critical point at 30%, and then decreased as slope increased from 35% to 40%. Plots with a slope of 30% (4.08 g m−2) and of 25% (3.91 g m−2) had the highest sediment yield (Table 5). Runoff and runoff coefficient increased slightly on plots with slope ranging from 5% to 10%, while their increase becomes remarkable with increasing slope from 15% to 30%. On the other hand, in plots with a slope greater than 30%, and slightly over than 40%, a decreasing trend is observed in runoff and the runoff coefficient, but with values that remained higher than those recorded on slopes <15%.
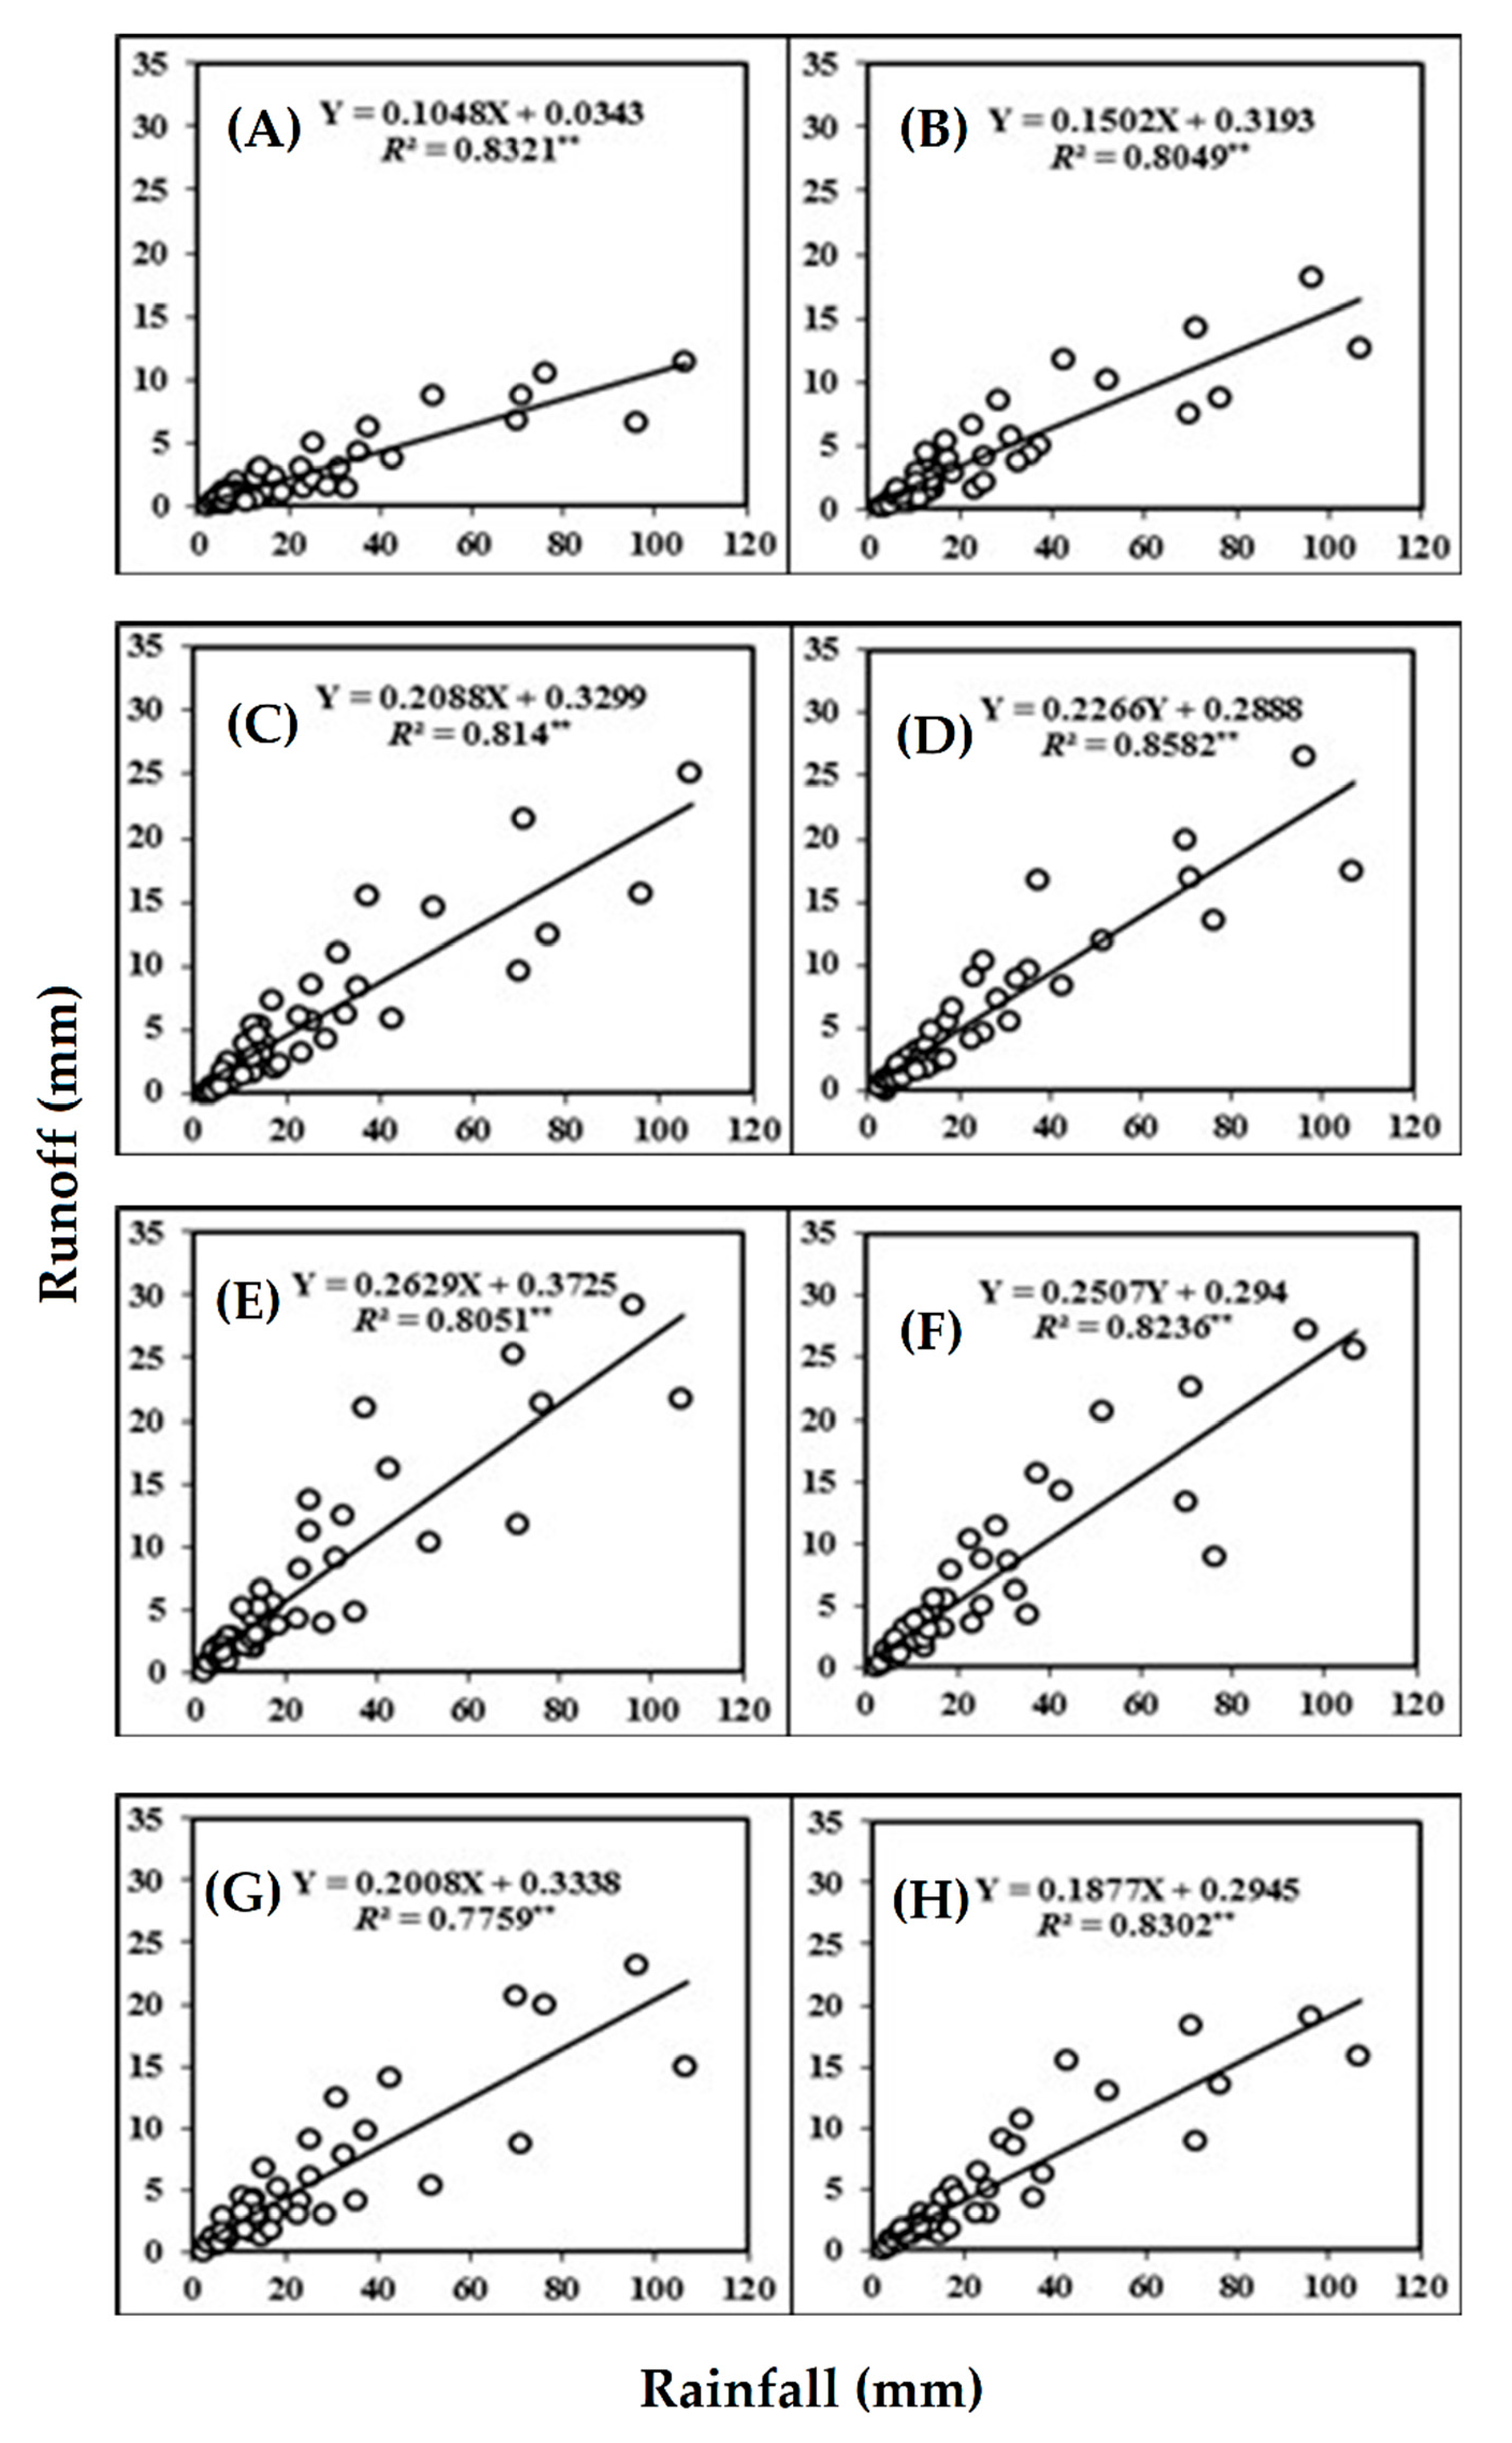
Regression analysis showed that runoff response to rainfall for plots with different slope gradients show a significant linear increase (Figure 2).
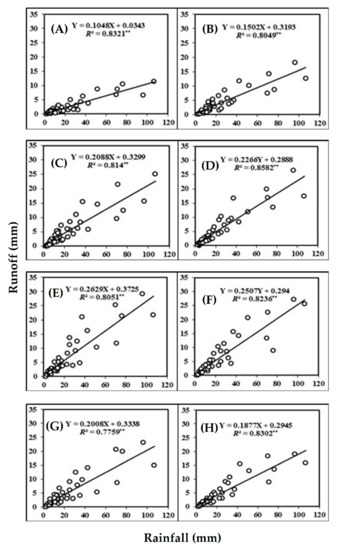
Figure 2.
Relationship between rainfall versus runoff on plots with different slope gradients of (A) 5%, (B) 10%, (C) 15%, (D) 20%, (E) 25%, (F) 30%, (G) 35% and (H) 40%. For each graph, the regression equation and the coefficient of determination (R2) are given. Note: ** P < 0.01.
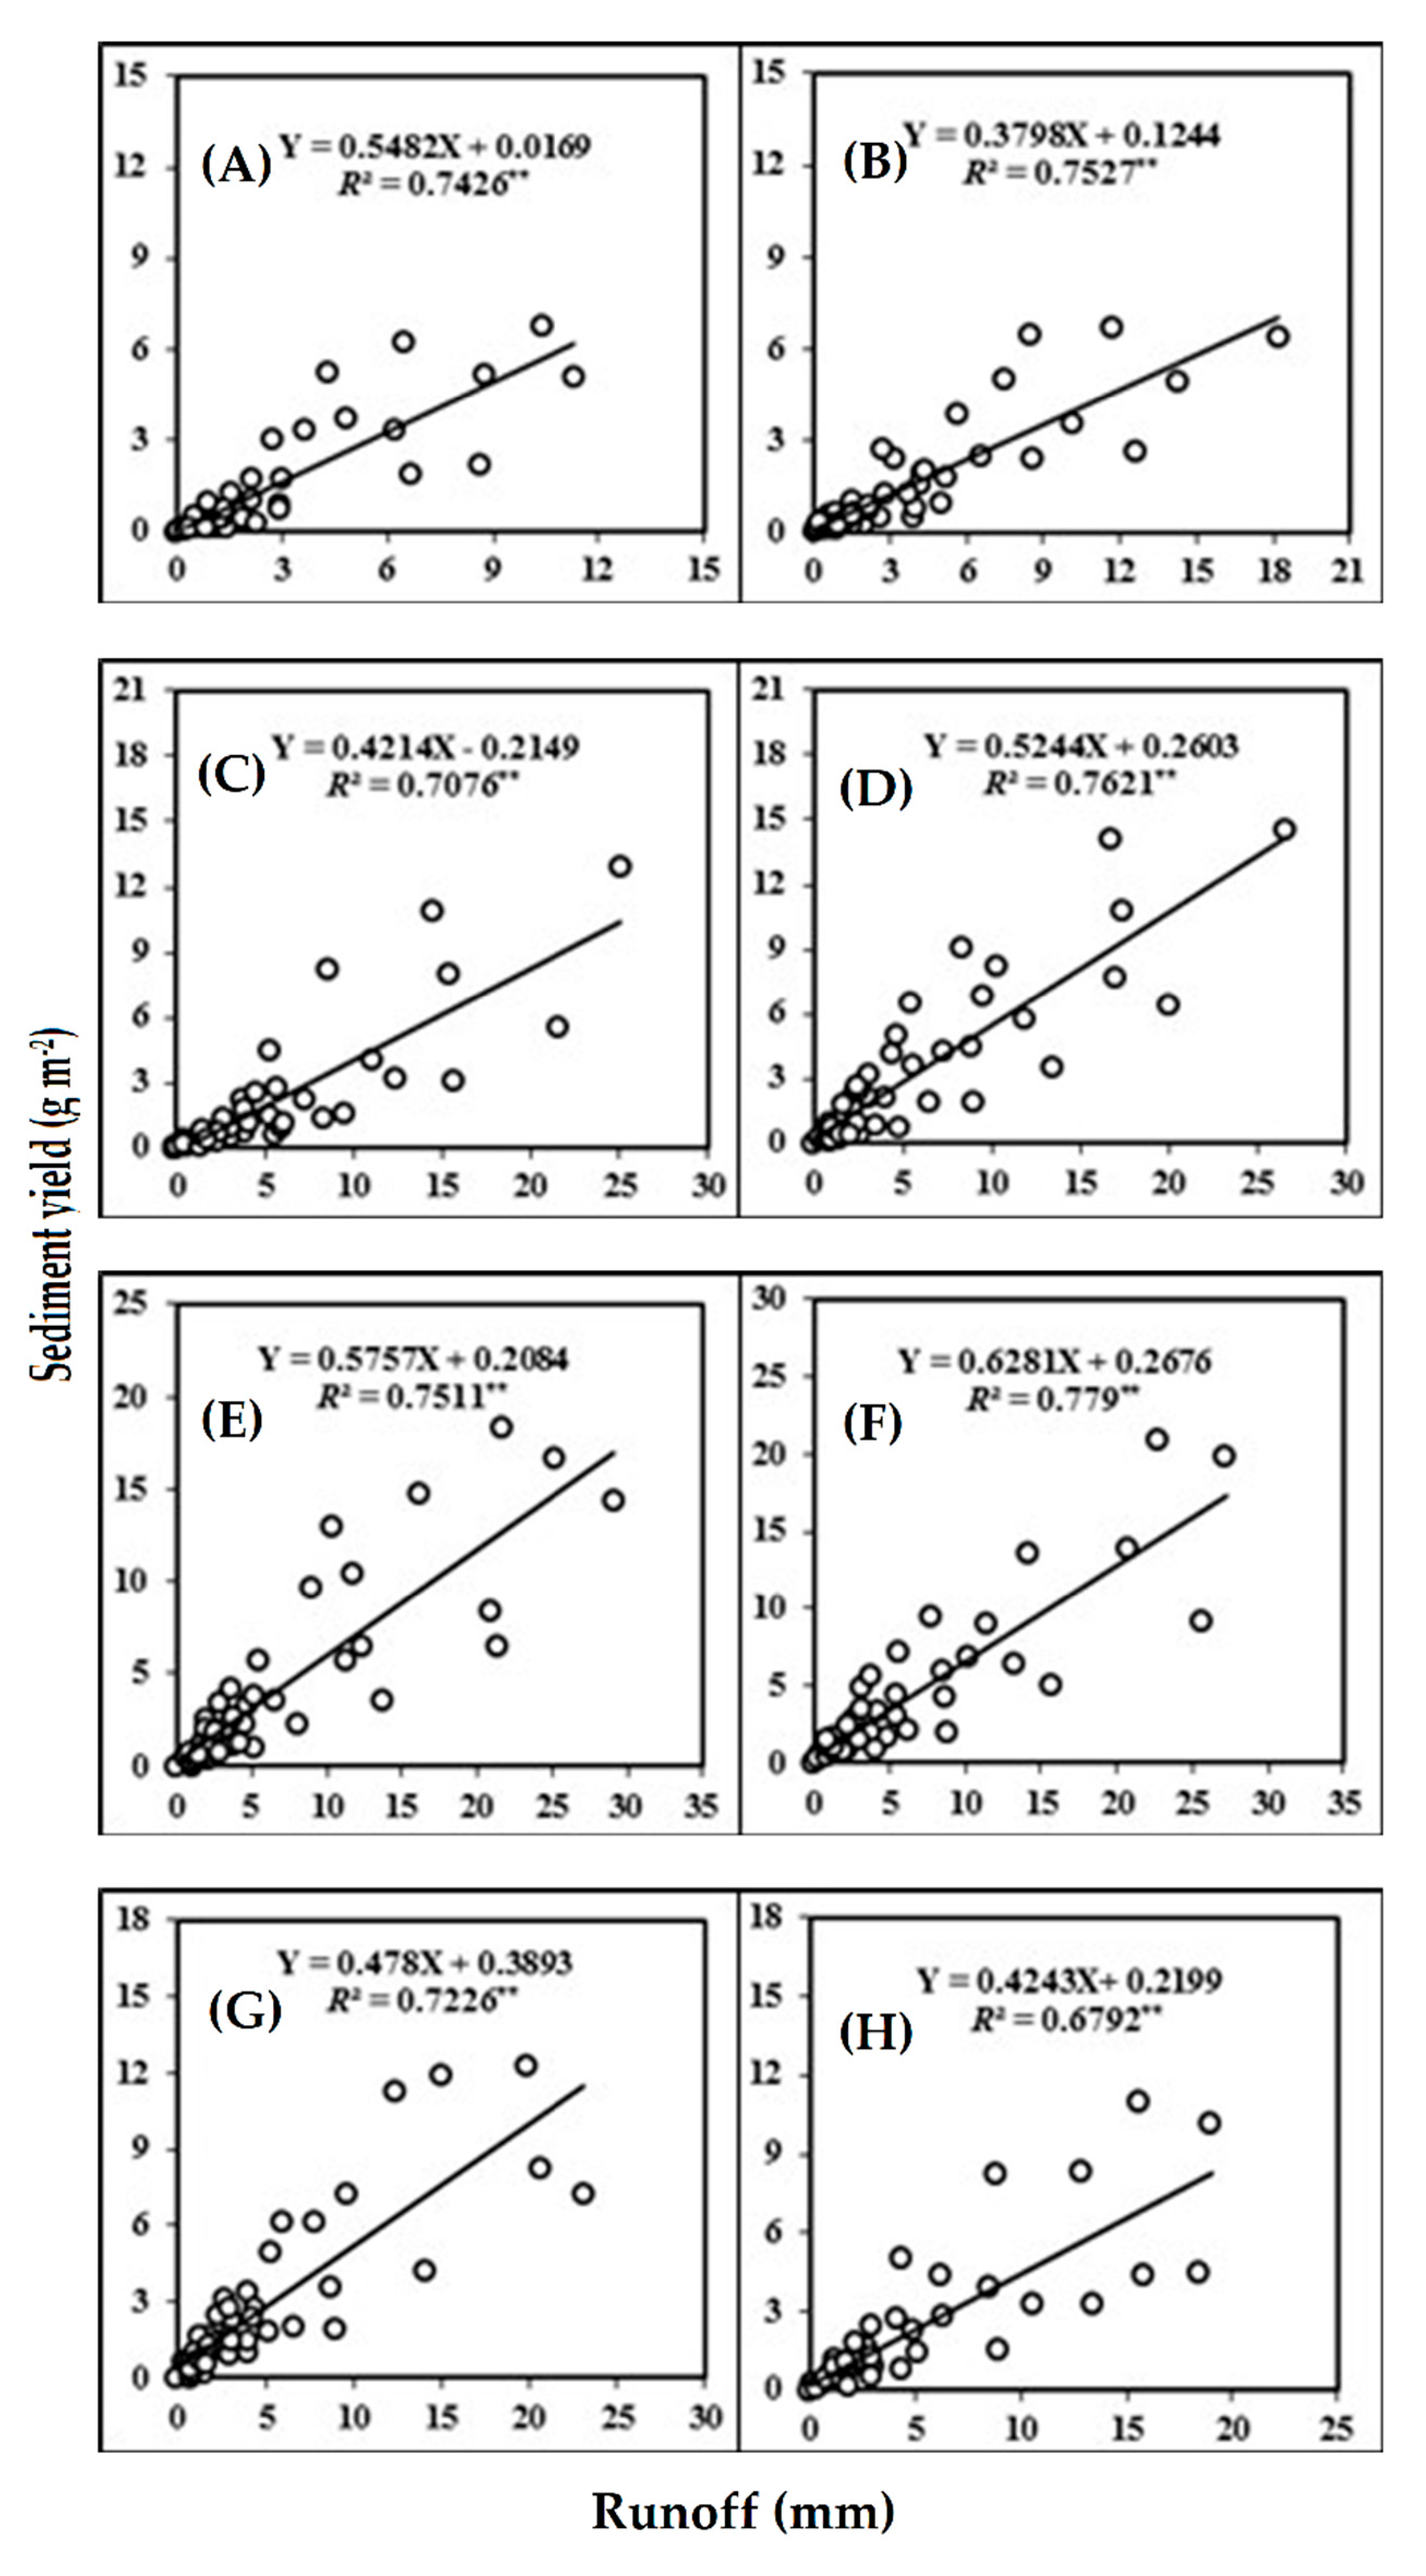
Results of regression analysis showed a significantly linear relationship among runoff versus sediment yield at slope gradients of 5, 10, 15, 20, 25, 30, 35, and 40% (Figure 3).
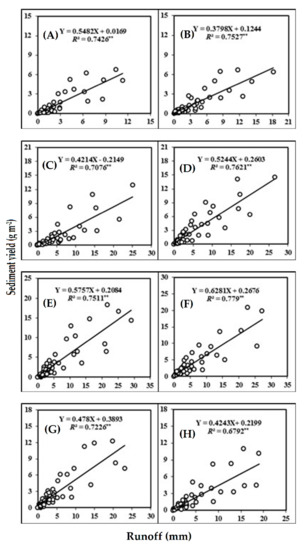
Figure 3.
Relationship between runoff versus sediment yield on plot with different slope gradients (A) 5%, (B) 10%, (C) 15%, (D) 20%, (E) 25%, (F) 30%, (G) 35% and (H) 40%. For each graph, the regression equation and the coefficient of determination (R2) are given. Note: ** P < 0.01.
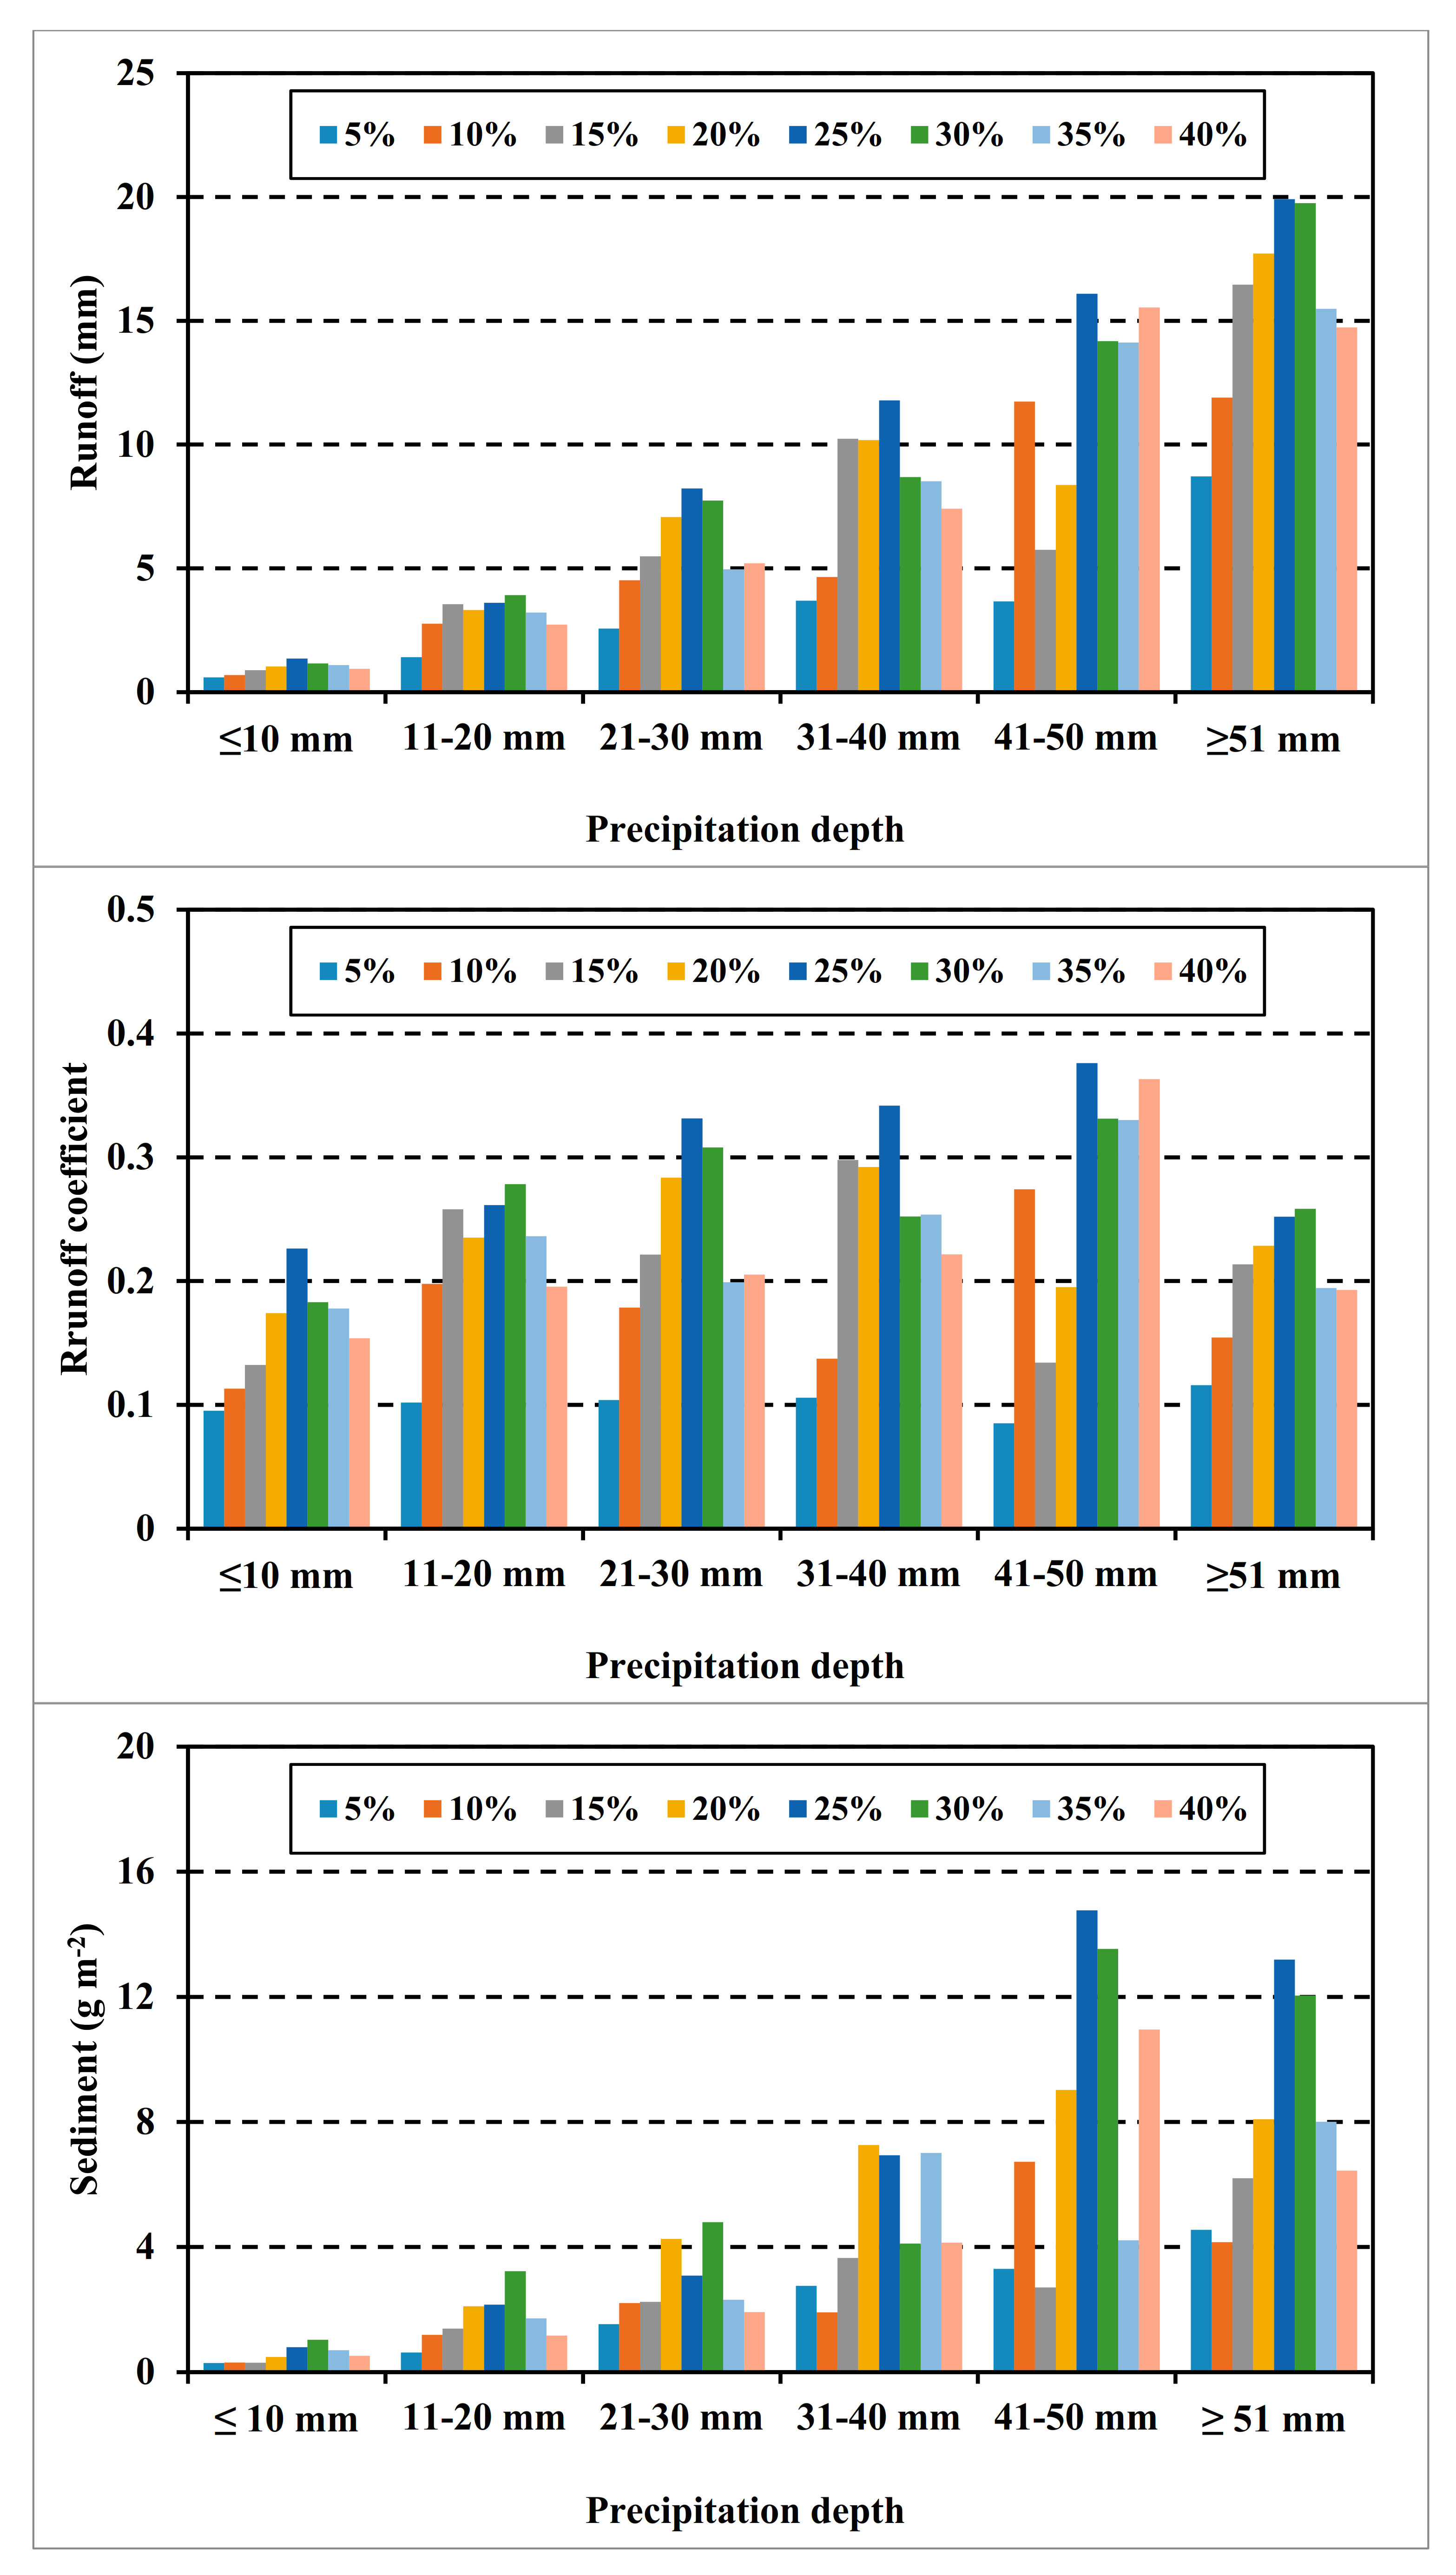
In each value of precipitation depth, there was a bell-shaped trend between runoff, runoff coefficient, and sediment yield and slope; initially there was an increase with slope gradient, and then a decrease after a critical slope gradient, indicating that greater values of runoff, runoff coefficient, and sediment yield were found at the slope gradient of 25% (Figure 4).
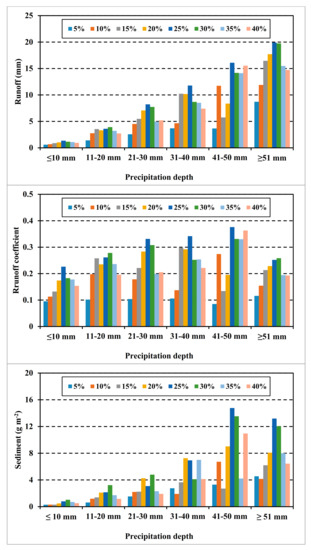
Figure 4.
Average runoff, runoff coefficient, and sediment on the slope gradient (showed by different colors) at different value of precipitation depth.
3.3. Runoff and Sediment Yield Model
Results of the full cubic and log normal polynomial regression model for the relationship between runoff, runoff coefficient, and sediment yield, slope gradient (SG) and amount of rainfall (R) were as follows (Equations (2)–(4)):
Runoff model for plot with different slope gradients:
Runoff coefficient model for plot with different slope gradient:
Sediment yield model for plot with different slope gradient:
where, SG is slope gradient (%) and R is amount of rainfall (mm).
The coefficients of determination for the Equations (2)–(4) were 74.4, 34.1, and 64.7%, respectively.
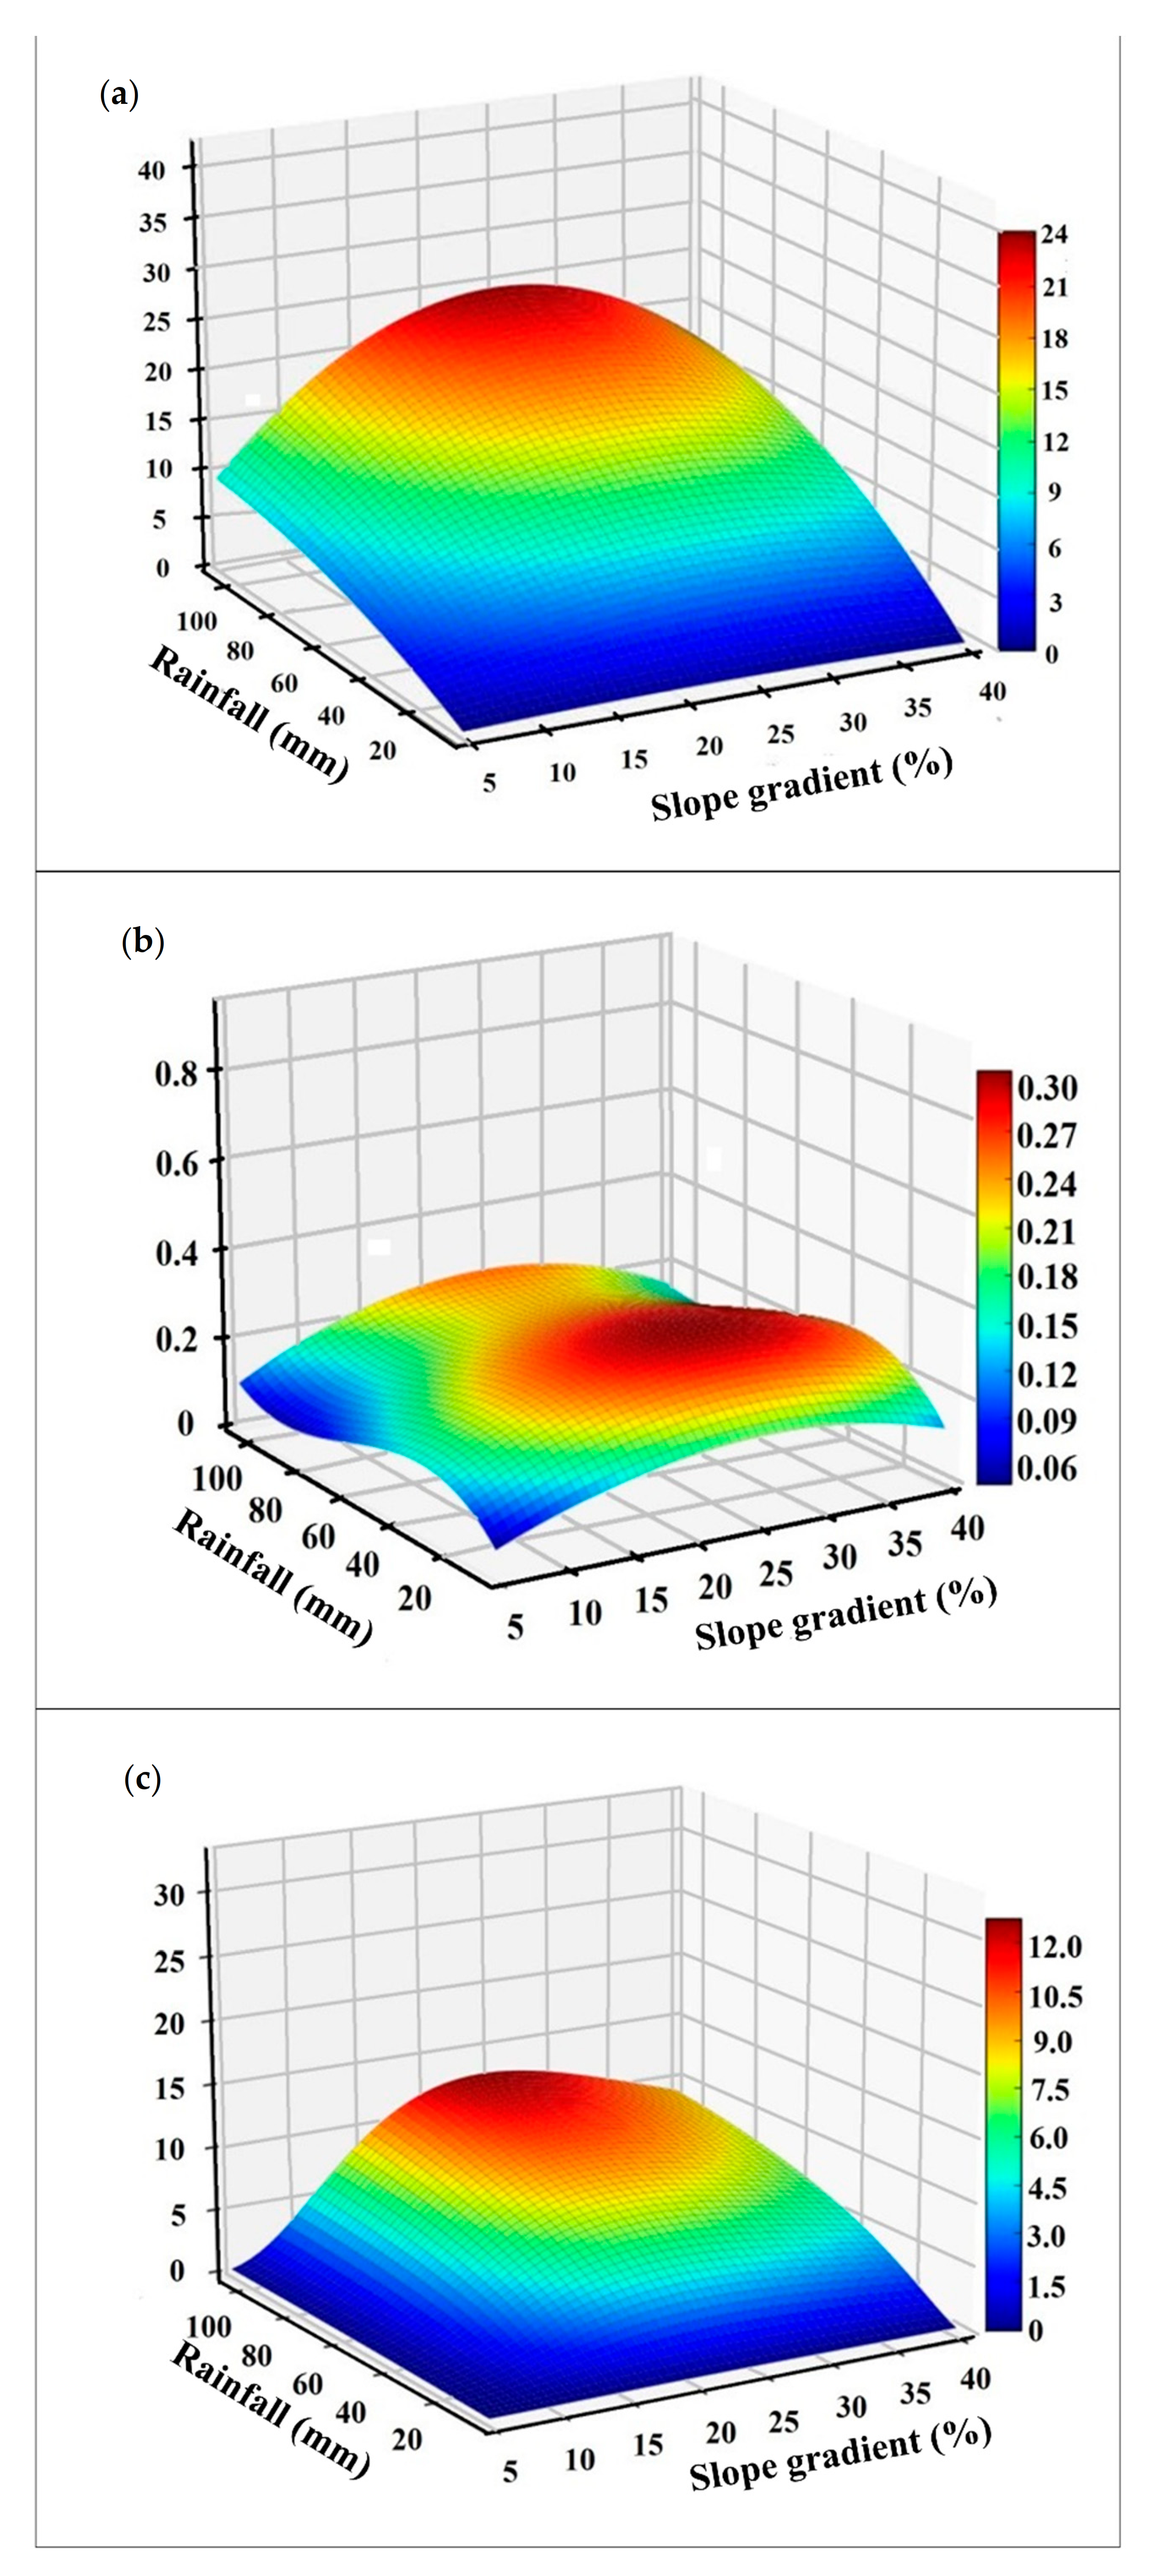
The runoff, runoff coefficient, and sediment yield at the runoff plots with different slopes (SG) and with diverse ranges of rainfall (R) are shown in Figure 5. The runoff increased and then decreased with the increasing slope of plot, ranging from 1.0 to 25 mm. The changes in runoff were drastically influenced by the amount of rainfall. In each slope gradient of plot, runoff increased substantially as the amount of rainfall increased (Figure 5a). For a rainfall amount >60 mm, this result revealed that slope had a greater effect in changing the value of runoff than the amount of rainfall. Changes in runoff coefficient were moderate by increasing slope gradient and amount of rainfall (Figure 5b). Under the same amount of rainfall, the change in sediment yield were found to have an increasing and then a decreasing trend with an increasing slope gradient of runoff plots. However, these changes in sediment yield were greater in the low values of rainfall than those under the high values of rainfall (Figure 5c).
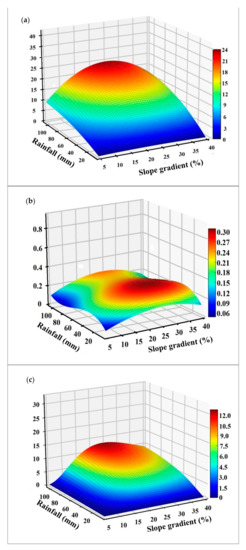
Figure 5.
(a) Predicted runoff, (b) runoff coefficient, and (c) sediment yield at plots with different slope gradient along skid trail under various amounts of rainfall based on polynomial regression analysis.
4. Discussion
The diverse hydrological effects are due to the change in land cover type because they can affect many components of the hydrological cycle [2,5]. The amount of water that penetrates into soil profile or flows away from soil surface as runoff depends on various factors such as soil properties, vegetation type and root system [5,6]. Several studies under various environmental conditions show that vegetation has a positive effect on the reduction of runoff and soil erosion [4,6]. Vegetation reduces runoff through the root system, canopy and leaves, as well as litter components via interception and evapotranspiration processes [5]. In the study area, it was shown that ground-based skidding operations intensify the adverse effects caused by machinery traffic on forest soil, thus intensifying surface flow and soil loss. These conditions have a negative influence on infrastructures in urban areas at the lowland and coastal line of the Caspian Sea. Previous studies have observed that forest machinery traffic had a negative impact on soil bulk density, removal of litter layer, and decrease in total porosity [3,7,11,14,15,16,18,29]. This, in turn, led to exposure of the fine mineral soil with aggregates destroyed due to the raindrop impact. This was confirmed by the results of the current study, as the logging operations with wheeled skidder had a significant influence on soil bulk density and organic matter content.
In the present study, plot-scale study with an area of 2 m2 was applied at different levels of slope in the skid trails under natural rainfall conditions. In previous studies, different plot dimension ranging from 0.25 to 100 m2 were installed to elucidate the effect of different treatments on surface runoff and soil loss [7,19,25,29,32,33,43,44,45,46]. The application of a 2 m2 plot in this study demonstrated to be the optimal solution to assess the effects of slope gradient on runoff and soil loss on the skid trails where soil compaction occurred. However, slope length is an important factor that can worsen the effects of slope gradient in increasing surface flow and soil loss [21,33]. In accordance with these results, Jourgholami and Labelle [33] showed that the increasing plot length within a range from 2 to 40 m decreased runoff and increased sediment yield.
In the current study, the effects of slope gradient on runoff and sediment yield were characterized in the machine-induced compacted soil on the skid trails. In line with the current study, previous studies have discussed forest harvesting operations using mechanized systems [8,15,33]. In particular, ground-based logging operations were found to induce surface runoff and sediment yield since soil disturbances lead to a decrease in infiltration rate and enhance soil erodability. Hence, both the production and protection functions of the litter layer in forest soil were negatively influenced after machine traffic [3,11,13,16]. Furthermore, previous studies found that leaf litter plays a crucial role in intercepting raindrop impact and augmenting the soil organic matter content as a result of decomposition processes, which significantly enhances the quality of soil properties, increases surface roughness, accelerates water infiltration into soil, and reduces surface water flow and soil loss [7,47,48,49,50,51].
Previous studies have found that slope gradient had a significant effect on runoff and soil loss [19,23,25,26,27,28,29,30,31,34,35,52]. This was confirmed by the results of the current study, as slope gradient drastically changed surface runoff, runoff coefficient, and sediment yield on the compaction-induced bare soil in the skid trails.
Our findings demonstrated that runoff, runoff coefficient, and sediment yield were significantly influenced by slope gradient in runoff plot. The effects of slope gradient on surface runoff and sediment yield is an argumentative issue, as there are several influencing factor such as rainfall intensity, amount of organic matter, herbaceous cover, soil type, particle size distribution, and heterogeneity of soil parameters [25,53].
Our study demonstrated that runoff increased in the range from 2.45 to 6.43 mm as slope gradient increased from 5 to 25%, hence, the critical point for slope was 25%. Also, further increase in slope gradient from 25 to 40% led to gradually decrease in runoff from 6.43 to 4.62 mm. Since plot length was 2 m in the present study, the concentration time for surface runoff instantly decreased and the eroded materials of different size were easily delivered to the outlet of the plot. These results are consistent with other studies [26,27,30,31,34,54], which state that there is a bell-shaped trend between runoff and slope; firstly runoff increase with slope gradient, and then there is a decrease after a critical slope angle. In contrast to our results, Liu et al. [23] found that runoff shows a decreasing trend by increasing slope gradient. Likewise, in contrast to the present study, El Kateb et al. [29] indicated that the steeper slope gradient resulted in a further increase in runoff and soil loss due to the longer plot size in their research (7 m2; 2 m in width and 3.28 m in length). In the current study, runoff plots were established on the compacted soil surface of skid trails. As a result, soil surface conditions such as increased soil bulk density, decreased porosity, and low permeability were effective drivers in runoff and sediment response, which were different from the other studies [23,29]. Regarding the difference between the results obtained and other studies, Wu et al. [54] and Puntenney-Desmond et al. [55] indicated that soil critical shear stress, rainfall intensity, soil type, hydraulic conductivity, and antecedent soil moisture have a key role on the slope effect trend.
According to our results, a similar trend was also observed relating to the runoff coefficient that showed an increasing-decreasing trend by increasing the slope gradient; with the evidence of a threshold in slope gradient (i.e., 25%) showing a bell-shaped trend. Results show that runoff coefficient changes from 0.004 to 0.93. In accordance with the present results, Chen et al. [56] and Guastini et al. [57] reported that runoff coefficient ranged from 0.29 to 1.46 and from 0.01 to 0.37 in the hillslope and catchment scales, respectively. In contrast, Jourgholami and Labelle [33] found that runoff coefficient ranged from 0.001 to 0.08 in the plot-scale study on the skid trails with plot length ranging from 2 to 40 m. A wide range of runoff coefficient in the current study can be attributed to the small-scale plot area, surface roughness, and soil conditions. Similar to plot scale in this study, plots with shorter slope length have a significant effect on concentration time [33]. In fact, the time needed for surface flow to discharge increases from the uppermost point on a large-scale hillslope to outlet due to flow continuity [30]. Moreover, Puntenney-Desmond et al. [55] concluded that the microtopographic features, hydrophobic conditions (water repellency), soil bulk density (soil compaction), surface cover, and plot length have a great influence on runoff and sediment responses in the plot-scale under the harvested area. Water-repellency in the harvested area is a prevalent phenomenon resulting in pond formation on the soil surface and delay in flow continuity [55]. Also, microtopographic features lead to an increase in infiltration rate, resulting in a decreased runoff coefficient [46].
According to the results of the present study, sediment yield shows two distinct trends by an increase in slope gradient, such as: initially increased from 1.36 to 4.08 g m−2 reaching the critical point of 30%; then decreased, ranging 4.08 to 2.18 g m−2 with an increase in slope gradient ranging from 30 to 40%. In line with the above mentioned results, previous rainfall simulations and field setting studies confirmed that sediment yield shows a bell-shape trend as slope angle increases; increasing trend to the slope of distinct threshold as a critical point, then decreasing trend by further increasing in slope angle [26,27,30,34,54]. Furthermore, soil-wheel interactions led to disturbance and incorporated surface layers and the subsurface layer of soil emerged after machine traffic. These results are seen as small size particles such as clay appearance, and can be found in surface soil, which are moved by the velocity force of surface flow [33]. Accordingly, Defersha et al. [58] found that the splash process and sediment yield increased by increasing slope gradient from 9 to 25%. In contrast to the current results, Liu and Singh [31] and Liu et al. [23] proved that runoff and sediment yield decreased by increasing the slope angle. In an attempt to explain this different trend observed in this study, Arjmand Sajjadi and Mahmoodabadi [59] concluded that the breakdown of soil aggregates, sealing, and crusting on surface soil were significantly affected by rainfall intensity and slope, which were important factors that govern the rate of water infiltration into soil resulting in changes in runoff and soil loss.
Previous studies have found that rainfall intensity has a momentary effect on runoff and sediment yield [7,25,28,29,30,33,60], as confirmed by the results of the current study, rainfall intensity resulted in an increase in the runoff, runoff coefficient, and sediment yield for the plots with different slopes. Also in line with our study, Kinnell [25] proved that rainfall intensity was more important than other rainfall characteristics to partitioning surface water to be infiltrated or flow away. Accordingly, rainfall intensity led to an enhancement in the kinetic energy of rain drops, which resulted in an increase in detachment of breakdown aggregates and increase in flow velocity combined with eroded materials.
The hypothesis of the present study stating that the slope can have a significant influence on runoff, runoff coefficient, and sediment yield under natural rainfall conditions is supported with our data. One key issue that should be taken into account in analyzing and comparing the results of the current study with the abovementioned studies is that this study was applied on the bare mineral soil exposed to machinery traffic, hence, water infiltration rate was exceptionally reduced and the erodability of impaired aggregates highly enhanced. In line with the current results, Parsons et al. [60] confirmed that the small-size particles show a faster velocity than the greater ones. According to Picchio et al. [15], El Kateb et al. [29], Kinnell [25], Jourgholami et al. [19], Zhang et al. [30] and Morbidelli et al. [34], the litter-humus layer has a crucial role intercepting the impact of raindrops and improving the infiltration of water into soil layers, which decreases the surface water flow and the consequent decrease in sediment yield in the skid trails.
The larger side of the runoff plot (2 m length) was laid out on the inclined surface; therefore, the runoff plot in each treatment did not receive equal amounts of throughfall. This is particularly true in the runoff plots at the steeper surface, which can influence the runoff collected at the outlet. By projecting the horizontal length on the inclined slope, each plot with a different slope receives the equal amount of rainfall that can help to avoid this heterogeneity.
Jourgholami et al. [18,61], Jourgholami and Etehadi Abari [46], and Jourgholami and Labelle [33] proved that using organic mulch (i.e., harvesting residues, leaf litter, straw, sawdust) on skid trails and applying Best Management Practices (BMPs) such as the installation of water diversion structures (contour-felled logs) across the skid trail results in a decrease in the amount of eroded materials. Hence, these eroded materials can be trapped before deposited in downhill infrastructures, streams, and dams.
Within this context, precision forestry techniques and technologies could address the correct approach to reduce impact, through rationalized planning of logging operations [62]. The design and application of low impact logging methods [12,63,64,65] and sustainable forest operations (SFO) criteria, together with operator training, are the mainstay of reduced impact logging, much more than the level of mechanization.
One of the most important characteristics of sediment is particle size distribution, which provides the extensive information on sediment transport and sedimentation, geomorphic data, and sediment geochemistry [66]. Hence, the particle size distribution of sediment should be considered in future research projects.
When rainfall is greater than the infiltration rate, surface flow increases with a consequent increase in runoff. One important generator of runoff is soil particle size distribution. Fine-textured soils, such as clay soils, have slow infiltration rates leading to increased surface runoff. In line with the current study, Jourgholami and Labelle [33] reported that higher runoff, runoff coefficient, and sediment yield were observed in the clayey soil than those in the loamy soil. Furthermore, clayey soils are more prone to start surface flow and subsequent soil loss. In consistency with these results, Jourgholami et al. [19] and Ekwue and Harrilal [67] concluded that soil texture does play a crucial role in surface flow and soil loss responses.
However, Puntenney-Desmond et al. [55] concluded that instead of slope, dominant factors such as surface cover, litter, and soil exposure were the main drivers in runoff and sediment production in one-square meter plots. In contrast to these same results, Mohr et al. [68] reported that water repellency and soil moisture appeared to result in decreased surface flow and soil erosion in small plots.
5. Conclusions
Slope gradient is one important factor that influences runoff, runoff coefficient, and sediment yield. In the present study, runoff plots with a width of 1 m and a length of 2 m (2 m2) were installed on skid trails with a slope gradient (5, 10, 15, 20, 25, 30, 35, and 40%) to characterize the effects on runoff, runoff coefficient, and sediment yield during the first year following machine traffic, specifically from 17 July 2015 to 11 July 2016 under natural rain conditions. The important key results are delineated as follows: (1) Runoff increased ranging from 2.45 to 6.43 mm as slope gradient increased from 5 to 25%, and further increase in slope gradient led to gradually decreasing runoff. (2) Runoff coefficient showed an increasing to decreasing trend by an increase in slope gradient, with a threshold in the slope gradient of 25%. (3) Sediment yield shows two distinct trends by increasing in slope as: initially increased to the critical point of 30%, then decreased. (4) Our findings demonstrate that the fluctuation of runoff and sediment yield were greater under the low values of rainfall than those in high rainfall.
Our study highlights that logging operations (mainly skidding) should be limited in the area with a slope gradient that is lower than the critical point of 25 to 30%. This is needed as a threshold to limit the adverse effect of soil compaction on runoff and sediment yield. However, it is important to state clearly that there may be some limitations in this study, and therefore any conclusions should be interpreted with due caution, especially when it comes to generalization. It is worth saying that some limitations should be noted. Firstly, runoff and sediment yield responses were measured on plots two-square meters in size or with a slope length of 2 m, which were significantly influenced by scale. Hence, hillslope length is an important factor that changes runoff and sediment responses. Secondly, the projection of these results significantly depends on the similarity of factors such as geology, soil texture and type, and vegetation. Even if the analyses were carried out with statistical normalization and standardized methodologies, some residual limitations are still to be taken into account, in particular those which are related to environmental situations and human factors.
Currently, productive forest systems are often questioned about their environmental impacts, and the importance of studies such as this one exists in the opportunity to extend and update the guidelines, criteria, and indicators for sustainable forest management, as is expected for a multitasking forest management system.
Author Contributions
Conceptualization, M.J. and S.K.; methodology, M.J. and R.P.; software, M.J. and S.K.; validation, M.J., S.K., F.T. and A.L.M.; formal analysis, M.J., S.K., F.T., A.L.M. and R.P.; investigation, M.J. and S.K.; resources, M.J., F.T., A.L.M. and R.P.; data curation, M.J. and S.K.; writing—original draft preparation, M.J. and S.K.; writing—review and editing, M.J., F.T., A.L.M. and R.P; visualization, M.J., S.K., F.T., A.L.M. and R.P.; supervision, M.J., F.T., A.L.M. and R.P.; funding acquisition, M.J. and S.K. All authors have read and agreed to the published version of the manuscript.
Funding
This research was funded by University of Tehran, grant number 28514.
Acknowledgments
Authors would like to acknowledge the assistance of Jaafar Fathi, Ghodrat Daneshvar and Asghar Ghomi of the Kheyrud Forest Research Station, Nowshahr. We thank to University College of Agriculture & Natural Resources, University of Tehran (Grant No. 28514) for providing the financial support and funding. We are also grateful to the editor and the anonymous reviewers who provided useful comments and constructive suggestions which improved a previous version of this manuscript.
Conflicts of Interest
The authors declare no conflict of interest.
References
- Giadrossich, F.; Cohen, D.; Schwarz, M.; Seddaiu, G.; Contran, N.; Lubino, M.; Valdés-Rodrŕguez, O.A.; Niedda, M. Modeling bio-engineering traits of Jatropha curcas L. Ecol. Eng 2016, 89, 40–48. [Google Scholar] [CrossRef]
- Vergani, C.; Giadrossich, F.; Buckley, P.; Conedera, M.; Pividori, M.; Salbitano, F.; Rauch, H.S.; Lovreglio, R.; Schwarz, M. Root reinforcement dynamics of European coppice woodlands and their effect on shallow landslides: A review. Earth-Sci. Rev. 2017, 167, 88–102. [Google Scholar] [CrossRef]
- Jourgholami, M.; Khajavi, S.; Labelle, E.R. Recovery of forest soil chemical properties following soil rehabilitation treatments: An assessment six years after machine impact. Croat. J. For. Eng. 2020, 41, 163–175. [Google Scholar] [CrossRef]
- Giadrossich, F.; Cohen, D.; Schwarz, M.; Ganga, A.; Marrosu, R.; Pirastru, M.; Capra, G.F. Large roots dominate the contribution of trees to slope stability. Earth Surf. Process. Landf. 2019, 44, 1602–1609. [Google Scholar] [CrossRef]
- Giadrossich, F.; Schwarz, M.; Cohen, D.; Cislaghi, A.; Vergani, C.; Hubble, T.; Phillips, C.; Stokes, A. Methods to measure the mechanical behaviour of tree roots: A re-view. Ecol. Eng. 2017, 109, 256–271. [Google Scholar] [CrossRef]
- Vergani, C.; Schwarz, M.; Soldati, M.; Corda, A.; Giadrossich, F.; Chiaradia, E.A.; Morando, P.; Bassanelli, C. Root reinforcement dynamics in subalpine spruce forests following timber harvest: A case study in Canton Schwyz, Switzerland. Catena 2016, 143, 257–288. [Google Scholar] [CrossRef]
- Jourgholami, M.; Labelle, E.R.; Feghhi, J. Efficacy of leaf litter mulch to mitigate runoff and sediment yield following mechanized operations in the Hyrcanian mixed forests. J. Soils Sediments 2019, 19, 2076–2088. [Google Scholar] [CrossRef]
- Cambi, M.; Certini, G.; Neri, F.; Marchi, E. The impact of heavy traffic on forest soils: A review. For. Ecol. Manag. 2015, 338, 124–138. [Google Scholar] [CrossRef]
- Marchi, E.; Picchio, R.; Mederski, P.S.; Vusić, D.; Perugini, M.; Venanzi, R. Impact of silvicultural treatment and forest operation on soil and regeneration in Mediterranean Turkey oak (Quercus cerris L.) coppice with standards. Ecol. Eng. 2016, 95, 475–484. [Google Scholar] [CrossRef]
- Picchio, R.; Mercurio, R.; Venanzi, R.; Gratani, L.; Giallonardo, T.; Lo Monaco, A.; Frattaroli, A.R. Strip clear-cutting application and logging typologies for renaturalization of pine afforestation—A case study. Forests 2018, 9, 366. [Google Scholar] [CrossRef]
- Jourgholami, M.; Ghassemi, T.; Labelle, E.R. Soil physio-chemical and biological indicators to evaluate the restoration of compacted soil following reforestation. Ecol. Indic. 2019, 101, 102–110. [Google Scholar] [CrossRef]
- Picchio, R.; Mederski, P.S.; Tavankar, F. How and how much, do harvesting activities affect forest soil, regeneration and stands? Curr. For. Rep. 2020, 6, 115–118. [Google Scholar] [CrossRef]
- Marchi, E.; Chung, W.; Visser, R.; Abbas, D.; Nordfjell, T.; Mederski, P.S.; McEwan, A.; Brink, M.; Laschi, A. Sustainable Forest Operations (SFO): A new paradigm in a changing world and climate. Sci. Total Environ. 2018, 634, 1385–1397. [Google Scholar] [CrossRef] [PubMed]
- Sohrabi, H.; Jourgholami, M.; Tavankar, F.; Venanzi, R.; Picchio, R. Post-Harvest Evaluation of Soil Physical Properties and Natural Regeneration Growth in Steep-Slope Terrains. Forests 2019, 10, 1034. [Google Scholar] [CrossRef]
- Picchio, R.; Neri, F.; Petrini, E.; Verani, S.; Marchi, E.; Certini, G. Machinery-induced soil compaction in thinning two pine stands in central Italy. For. Ecol. Manag. 2012, 285, 38–43. [Google Scholar] [CrossRef]
- Sohrabi, H.; Jourgholami, M.; Jafari, M.; Shabanian, N.; Venanzi, R.; Tavankar, F.; Picchio, R. Soil recovery assessment after timber harvesting based on the Sustainable Forest Operation (SFO) perspective in Iranian temperate forests. Sustainability 2020, 12, 2874. [Google Scholar] [CrossRef]
- Picchio, R.; Tavankar, F.; Nikooy, M.; Pignatti, G.; Venanzi, R.; Lo Monaco, A. Morphology, growth and architecture response of Beech (Fagus orientalis Lipsky) and Maple tree (Acer velutinum Boiss.) seedlings to soil compaction stress caused by mechanized logging operations. Forests 2019, 10, 771. [Google Scholar] [CrossRef]
- Jourgholami, M.; Fathi, K.; Labelle, E.R. Effects of litter and straw mulch amendments on compacted soil properties and Caucasian alder (Alnus subcordata) growth. New. For. 2020, 51, 349–365. [Google Scholar] [CrossRef]
- Jourgholami, M.; Labelle, E.R.; Feghhi, J. Response of runoff and sediment on skid trails of varying gradient and traffic intensity over a two-year period. Forests 2017, 8, 472. [Google Scholar] [CrossRef]
- Bracken, L.J.; Kirkby, M.J. Differences in hillslope runoff and sediment transport rates within two semi-arid catchments in southeast Spain. Geomorphology 2005, 68, 183–200. [Google Scholar] [CrossRef]
- Moreno de las Heras, M.; Nicolau, J.M.; Merino-Martin, L.; Wilcox, B.P. Plot-scale effects on runoff and erosion along a slope degradation gradient. Water Resour. Res. 2010, 46, 4503. [Google Scholar] [CrossRef]
- Fu, S.; Liu, B.; Liu, H.; Xu, L. The effect of slope on interrill erosion at short slopes. Catena 2011, 84, 29–34. [Google Scholar] [CrossRef]
- Liu, D.; She, D.; Yu, S.; Shao, G.; Chen, D. Rainfall intensity and slope gradient effects on sediment losses and splash from a saline–sodic soil under coastal reclamation. Catena 2015, 128, 54–62. [Google Scholar] [CrossRef]
- Kinnell, P.I.A. Slope length factor for applying the USLE-M to erosion in grid cells. Soil Tillage Res. 2001, 58, 11–17. [Google Scholar] [CrossRef]
- Kinnell, P.I.A. A review of the design and operation of runoff and soil loss plots. Catena 2016, 145, 257–265. [Google Scholar] [CrossRef]
- Fox, D.M.; Bryan, R.B.; Price, A.G. The influence of slope angle on final infiltration rate for interrill conditions. Geoderma 1997, 80, 181–194. [Google Scholar] [CrossRef]
- Khan, M.N.; Gong, Y.; Hu, T.; Lal, R.; Zheng, J.; Justine, M.F.; Azhar, M.; Che, M.; Zhang, H. Effect of slope, rainfall intensity and mulch on erosion and infiltration under simulated rain on purple soil of south-western Sichuan province, China. Water 2016, 8, 528. [Google Scholar] [CrossRef]
- Nord, G.; Esteves, M. The effect of soil type, meteorological forcing and slope gradient on the simulation of internal erosion processes at the local scale. Hydrol. Process. 2010, 24, 1766–1780. [Google Scholar] [CrossRef]
- El Kateb, H.; Zhang, H.; Zhang, P.; Mosandl, R. Soil erosion and surface runoff on different vegetation covers and slope gradients: A field experiment in Southern Shaanxi Province, China. Catena 2013, 105, 1–10. [Google Scholar] [CrossRef]
- Zhang, X.; Hu, M.; Guo, X.; Yang, H.; Zhang, Z.; Zhang, K. Effects of topographic factors on runoff and soil loss in Southwest China. Catena 2018, 16, 394–402. [Google Scholar] [CrossRef]
- Liu, Q.; Singh, V.P. Effect of microtopography, slope length and gradient, and vegetative cover on overland flow through simulation. J. Hydrol. Eng. 2004, 9, 375–382. [Google Scholar] [CrossRef]
- Jourgholami, M.; Fathi, K.; Labelle, E.R. Effects of foliage and traffic intensity on runoff and sediment in skid trails after trafficking in a deciduous forest. Eur. J. For. Res. 2018, 137, 223–235. [Google Scholar] [CrossRef]
- Jourgholami, M.; Labelle, E.R. Effects of plot length and soil texture on runoff and sediment yield occurring on machine-trafficked soils in a mixed deciduous forest. Ann. For. Sci. 2020, 77, 19. [Google Scholar] [CrossRef]
- Morbidelli, R.; Saltalippi, C.; Flammini, A.; Cifrodelli, M.; Picciafuoco, T.; Corradini, C.; Govindaraju, R.S. Laboratory investigation on the role of slope on infiltration over grassy soils. J. Hydrol. 2016, 543, 542–547. [Google Scholar] [CrossRef]
- Morbidelli, R.; Corradini, C.; Saltalippi, C.; Flammini, A.; Dari, J.; Govindaraju, R.S. A New Conceptual Model for Slope-Infiltration. Water 2019, 11, 678. [Google Scholar] [CrossRef]
- Morbidelli, R.; Saltalippi, C.; Flammini, A.; Govindaraju, R.S. Role of slope on infiltration: A review. J. Hydrol. 2018, 557, 878–886. [Google Scholar] [CrossRef]
- Sagheb-Talebi, K.; Sajedi, T.; Pourhashemi, M. Forests of Iran: A Treasure from the Past, a Hope for the Future. Plant Veg. 2014, 10, 1–152. [Google Scholar]
- Li, X.; Niu, J.; Xie, B. The effect of leaf litter cover on surface runoff and soil erosion in northern China. PLoS ONE 2014, 9, e107789. [Google Scholar] [CrossRef]
- Kemper, W.D.; Rosenau, R.C. Aggregate Stability and Size Distribution. In Methods of Soil Analysis. Physical and Mineralogical Properties. Part I, 2nd ed.; Klute, A., Ed.; ASA-SSSA: Madison, WI, USA, 1986; pp. 425–442. [Google Scholar]
- Thien, S.J.; Graveel, J.G. Laboratory Manual for Soil Science: Agriculture & Environmental Principles; McGraw-Hill Companies, Inc.: Boston, MA, USA, 2008; p. 218. [Google Scholar]
- Gee, G.W.; Bauder, J.W. Particle-size Analysis. In Methods of Soil Analysis, Part 1. Physical and Mineralogical Methods; Klute, A., Ed.; Soil Science Society of America: Madison, WI, USA, 1983; pp. 383–411. [Google Scholar]
- Walkley, A.; Black, I.A. An examination of the Degtjareff method for determining soil organic matter and a proposed modification of chromic acid titration method. Soil Sci. 1934, 37, 29–38. [Google Scholar] [CrossRef]
- Prats, S.A.; Wagenbrenner, J.; Malvar, M.C.; Martins, M.A.S.; Keizer, J.J. Mid-term and scaling effects of forest residue mulching on post-fire runoff and soil erosion. Sci. Total Environ. 2016, 573, 1242–1254. [Google Scholar] [CrossRef]
- Xing, W.; Yang, P.; Ren, S.; Ao, C.; Li, X.; Gao, W. Slope length effects on processes of total nitrogen loss under simulated rainfall. Catena 2016, 139, 73–81. [Google Scholar] [CrossRef]
- Etehadi Abari, M.; Majnounian, B.; Malekian, A.; Jourgholami, M. Effects of forest harvesting on runoff and sediment characteristics in the Hyrcanian forests, northern Iran. Eur. J. For. Res. 2017, 136, 375–386. [Google Scholar] [CrossRef]
- Jourgholami, M.; Etehadi Abari, M. Effectiveness of sawdust and straw mulching on postharvest runoff and soil erosion of a skid trail in a mixed forest. Ecol. Eng. 2017, 109, 1–9. [Google Scholar] [CrossRef]
- Tsiko, C.T.; Makurira, H.; Gerrits, A.M.J.; Savenije, H.H.G. Measuring forest floor and canopy interception in a savannah ecosystem. Phys. Chem. Earth 2012, 47–48, 122–127. [Google Scholar] [CrossRef]
- Kim, J.K.; Onda, Y.; Kim, M.S.; Yang, D.Y. Plot-scale study of surface runoff on well-covered forest floors under different canopy species. Quat. Int. 2014, 344, 75–85. [Google Scholar] [CrossRef]
- Du, J.; Niu, J.; Gao, Z.; Chen, X.; Zhang, L.; Li, X.; Zhu, Z. Effects of rainfall intensity and slope on interception and precipitation partitioning by forest litter layer. Catena 2019, 172, 711–718. [Google Scholar] [CrossRef]
- Zagyvainé, K.K.A.; Kalicz, P.; Szilágyi, J.; Gribovszki, Z. On the specific water holding capacity of litter for three forest ecosystems in the eastern foothills of the Alps. Agric. For. Meteorol. 2019, 278, 107656. [Google Scholar] [CrossRef]
- Zhao, L.; Hou, R.; Fang, Q. Differences in interception storage capacities of undecomposed broad-leaf and needle-leaf litter under simulated rainfall conditions. For. Ecol. Manag. 2019, 446, 135–142. [Google Scholar] [CrossRef]
- Koulouri, M.; Giourga, C. Land abandonment and slope gradient as key factors of soil erosion in Mediterranean terraced lands. Catena 2007, 69, 274–281. [Google Scholar] [CrossRef]
- Han, Z.; Zhong, S.; Ni, J.; Shi, Z.; Wei, C. Estimation of soil erosion to define the slope length of newly reconstructed gentle-slope lands in hilly mountainous regions. Sci. Rep. 2019, 9, 46–76. [Google Scholar] [CrossRef]
- Wu, S.; Yu, M.; Chen, L. Nonmonotonic and spatial-temporal dynamic slope effects on soil erosion during rainfall-runoff processes. Water Resour. Res. 2017, 53, 1369–1389. [Google Scholar]
- Puntenney-Desmond, K.C.; Bladon, K.D.; Silins, U. Runoff and sediment production from harvested hillslopes and the riparian area during high intensity rainfall events. J. Hydrol. 2020, 582, 124452. [Google Scholar] [CrossRef]
- Chen, B.; Krajewski, W.F.; Helmers, M.J.; Zhang, Z. Spatial variability and temporal persistence of event runoff coefficients for cropland hillslopes. Water Resour. Res. 2019, 55, 1583–1597. [Google Scholar] [CrossRef]
- Guastini, E.; Zuecco, G.; Errico, A.; Castelli, G.; Bresci, E.; Preti, F.; Penna, D. How does streamflow response vary with spatial scale? Analysis of controls in three nested Alpine catchments. J. Hydrol. 2019, 570, 705–718. [Google Scholar] [CrossRef]
- Defersha, M.B.; Quraishi, S.; Mellese, A.M. The effect of slope steepness and antecedent moisture content on interrill erosion, runoff and sediment size distribution in the highlands of Ethiopia. Hydrol. Earth Syst. Sci. 2011, 15, 2367–2375. [Google Scholar] [CrossRef]
- Arjmand Sajjadi, S.; Mahmoodabadi, M. Aggregate breakdown and surface seal development influenced by rain intensity, slope gradient and soil particle size. Solid Earth 2015, 6, 311–321. [Google Scholar] [CrossRef]
- Parsons, A.J.; Brazier, R.E.; Wainwright, J.; Powell, D.M. Scale relationships in hillslope runoff and erosion. Earth Surf. Process. Landf. 2006, 31, 1381–1393. [Google Scholar] [CrossRef]
- Jourgholami, M.; Nasirian, A.; Labelle, E. Ecological restoration of compacted soil following the application of different leaf litter mulches on the skid trail over a five-year period. Sustainability 2018, 10, 2148. [Google Scholar] [CrossRef]
- Picchio, R.; Proto, A.R.; Civitarese, V.; Di Marzio, N.; Latterini, F. Recent contributions of some fields of the electronics in development of forest operations technologies. Electronics 2019, 8, 1465. [Google Scholar] [CrossRef]
- Jourgholami, M.; Ramineh, A.; Zahedi Amiri, G.; Labelle, E.R. The Influence of slope positions on the recovery response of compacted soil properties and enzyme activity in an Oriental beech stand in the Hyrcanian forests, Iran. Sustainability 2019, 11, 1940. [Google Scholar] [CrossRef]
- Venanzi, R.; Picchio, R.; Spinelli, R.; Grigolato, S. Soil disturbance and recovery after coppicing a Mediterranean Oak stand: The effects of silviculture and technology. Sustainability 2020, 12, 4074. [Google Scholar] [CrossRef]
- Jourgholami, M.; Feghhi, J.; Picchio, R.; Tavankar, F.; Venanzi, R. Efficiency of leaf litter mulch in the restoration of soil physiochemical properties and enzyme activities in temporary skid roads in mixed high forests. Catena 2020, 105012. [Google Scholar] [CrossRef]
- Wang, C.; Chen, M.; Qi, H.; Intasen, W.; Kanchanapant, A. Grain-Size Distribution of Surface Sediments in the Chanthaburi Coast, Thailand and Implications for the Sedimentary Dynamic Environment. J. Mar. Sci. Eng. 2020, 8, 242. [Google Scholar] [CrossRef]
- Ekwue, E.I.; Harrilal, A. Effect of soil type, peat, slope, compaction effort and their interactions on infiltration, runoff and raindrop erosion of some Trinidadian soils. Biosyst. Eng. 2010, 105, 112–118. [Google Scholar] [CrossRef]
- Mohr, C.H.; Coppus, R.; Iroume, A.; Huber, A.; Bronstert, A. Runoff generation and soil erosion processes after clear cutting. J. Geophys. Res. Earth Surf. 2013, 118, 814–831. [Google Scholar] [CrossRef]
Publisher’s Note: MDPI stays neutral with regard to jurisdictional claims in published maps and institutional affiliations. |
© 2020 by the authors. Licensee MDPI, Basel, Switzerland. This article is an open access article distributed under the terms and conditions of the Creative Commons Attribution (CC BY) license (http://creativecommons.org/licenses/by/4.0/).

