Article

Allometric Equations for Estimating Biomass and Carbon Stocks in Afforested Open Woodlands with Black Spruce and Jack Pine, in the Eastern Canadian Boreal Forest

1
Carbone Boréal Research Infrastructure, Université du Québec à Chicoutimi, Chicoutimi, QC G7H 2B1, Canada
2
Département des Sciences Fondamentales, Université du Québec à Chicoutimi, Chicoutimi, QC G7H 2B1, Canada
*
Author to whom correspondence should be addressed.
Forests 2021, 12(1), 59; https://doi.org/10.3390/f12010059
Submission received: 18 December 2020 / Accepted: 31 December 2020 / Published: 6 January 2021
(This article belongs to the Section Forest Inventory, Modeling and Remote Sensing)

Abstract

:
Allometric equations use easily measurable biometric variables to determine the aboveground and belowground biomasses of trees. Equations produced for estimating the biomass within Canadian forests at a large scale have not yet been validated for eastern Canadian boreal open woodlands (OWs), where trees experience particular environmental conditions. In this study, we harvested 167 trees from seven boreal OWs in Quebec, Canada for biomass and allometric measurements. These data show that Canadian national equations accurately predict the whole aboveground biomass for both black spruce and jack pine trees, but underestimated branches biomass, possibly owing to a particular tree morphology in OWs relative to closed-canopy stands. We therefore developed ad hoc allometric equations based on three power models including diameter at breast height (DBH) alone or in combination with tree height (H) as allometric variables. Our results show that although the inclusion of H in the model yields better fits for most tree compartments in both species, the difference is minor and does not markedly affect biomass C stocks at the stand level. Using these newly developed equations, we found that carbon stocks in afforested OWs varied markedly among sites owing to differences in tree growth and species. Nine years after afforestation, jack pine plantations had accumulated about five times more carbon than black spruce plantations (0.14 vs. 0.80 t C·ha−1), highlighting the much larger potential of jack pine for OW afforestation projects in this environment.

1. Introduction

Forest ecosystems cover about 31% of the global land area [1], of which 347 million ha (nearly 9% of world’s total forest area) are located in Canada [2], particularly in the boreal zone (270 million ha) [3]. The forest sector can play a major role in mitigating greenhouse gas (GHG) emissions by increasing the C sink of forests through adapted sylvicultural practices and afforestation of unproductive lands [4]. It is also important for forestry actors and countries to have precise estimates of the amount of C sequestered in their forests when evaluating whether GHG emission targets are being met. Forest growth dynamics, productivity, and C stocking can be estimated at a large scale through models that use measurements of woody biomass collected in the field [5,6,7]. These models rely partly on allometric equations that estimate the aboveground and belowground biomasses of trees from easily measurable biometric variables.
The power law model (in the form Y = β1 Xβ2) has been widely used to describe the relationship between tree diameter at breast height (DBH) or height (H) and biomass because it is simple and yields accurate results among species and sites [8,9]. The method for adjusting this model to data has however been the subject of debates. Using Monte Carlo simulations, Xiao et al. [10] demonstrated that the error distribution determines which method performs better, with non-linear regression better characterizing data with additive, homoscedastic, normal error, and linear regression on log-transformed data better characterizing data with multiplicative, heteroscedastic, log-normal error.
National-scale equations have been developed for Canada from data collected as part of the ENFOR research program [11]. These data have been used to produce a new series of equations that split tree aboveground biomass (AGBM) into four compartments (foliage, wood, branches, and bark). These equations use either DBH only or a combination of DBH and H as allometric variables [12,13]. Although these national equations are well suited for large-scale studies, locally derived equations may be more appropriate for regional-scale assessments of biomass or C stocks [12,13,14]. The national equations produced by Lambert et al. [12] were developed for species-specific, closed-canopy forests. Other sets of equations have been produced regionally to estimate the biomass of black spruce and jack pine aboveground biomass [15,16,17,18] or roots [19,20]. However, none of these equations, whether national or regional, have been validated for different stand structures, for instance low-density stands, such as boreal open woodlands (OWs) in eastern Canada. Furthermore, the national equations do not provide equations applicable for the roots compartment, which represents both an important fraction of a tree’s total biomass and a large C pool.
The natural forest dynamics that led to the creation of OWs are well documented [21,22,23,24,25,26]. Over 50 years, beginning in the mid-1950s, about 9% of the closed-crown forest in Quebec transformed into OWs; this forest type now accounts for approximatively 7% (1.6 million ha) of the closed-crown boreal forest in the province [27,28]. Boreal OWs have been described as alternative stable states of spruce-feathermoss forests [26], i.e., they tend to maintain their open structure over time [29].
Afforestation of OWs can be viable with proper site preparation [30,31,32]. Soil scarification can, for instance, create seedbeds that are receptive to black spruce and favorable to the growth of natural seedlings [33,34,35]. Biomass gains through afforestation could be quite important over the long term, even under low-plantation-yield scenarios [28], and biomass accumulation can be improved through appropriate management practices [6]. The theoretical potential of C sequestration in the planted OWs of eastern Canada has been estimated at between 57 to 97 t C·ha−1 over 70 years [6,28]; this estimate varies according to the applied silvicultural approach and the choice of planted species.
Although these estimates of C sequestration clearly illustrate that the afforestation of OWs has the potential to create net C sinks, they are not necessarily suitable at the stand level for afforestation projects because these estimates are based on generic biomass and yield equations, not yet validated for OWs. To date, no studies have developed allometric equations for natural or planted trees in OWs, although one can hypothesize that the particular site conditions of OWs—higher light availability, lower soil moisture, and a higher exposure to wind—may alter tree growth, biomass allocation, and canopy structure relative to trees in closed-forest stands.
This study aimed to develop allometric equations for the two dominant tree species of the eastern Canadian boreal forest, black spruce (Picea mariana [Mill.] B.S.P.) and jack pine (Pinus banksiana Lamb.), growing in OWs of Quebec’s spruce-feathermoss and balsam fir–white birch bioclimatic domains. Trees of different sizes from seven boreal OWs were harvested for biomass and allometric measurements to develop a set of equations using either trunk diameter (DBH or diameter at stump height (DSH)) as a single biometric variable or in combination with tree height. The measurement of tree height in the field can be time-consuming and unprecise; it is, therefore, insightful to assess whether this measurement significantly improves biomass estimates in OWs. Given the particular conditions prevailing in OWs, such as higher light availability, lower tree density, and thinner organic horizon relative to closed-crown stands, we hypothesized that the Canadian national equations [12] would not accurately predict the aboveground biomass and particularly its allocation among stem, branches, and needles. Finally, we used the ad hoc equations to estimate the amount of C accumulated in tree biomass in OWs afforested with either black spruce of jack pine nine years after afforestation.

2. Materials and Methods

2.1. Study Sites

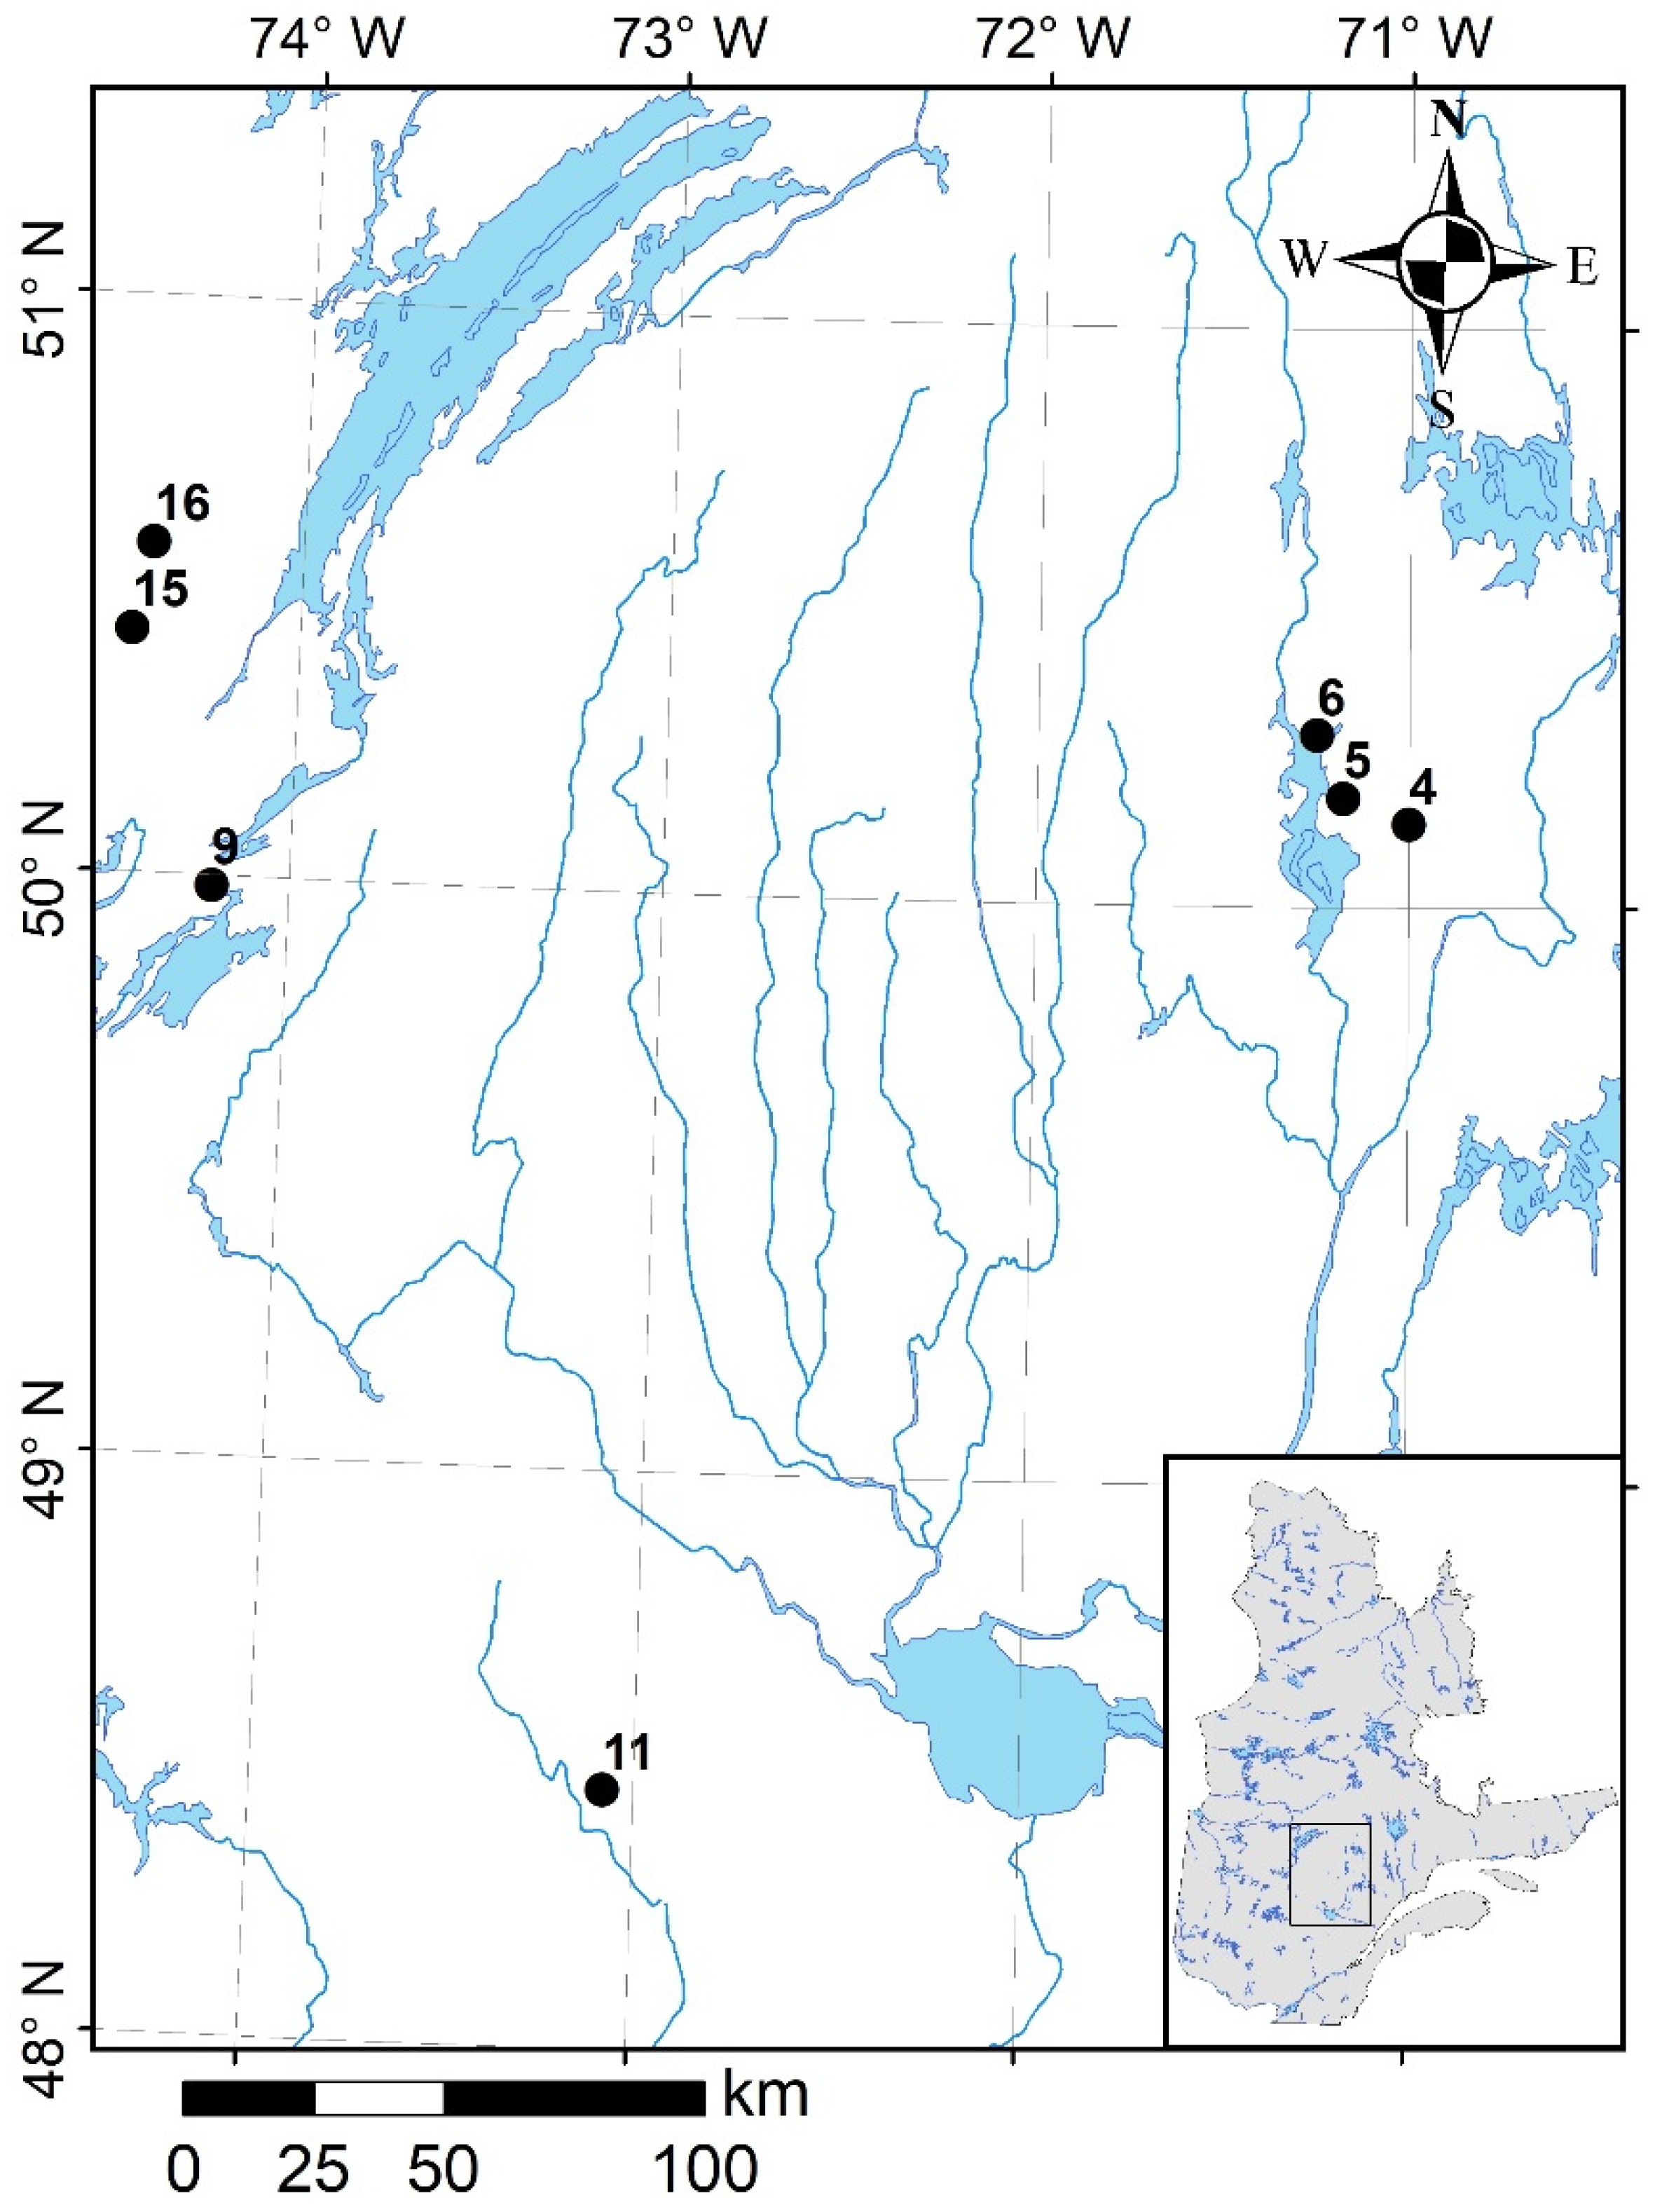
This study used part of an approx. 300 ha pre-existing experimental area, which was established in 1999–2001 to study various aspects of afforestation in boreal OWs of northern Quebec, Canada (for further details of this experimental area, see Hebert et al. [31]). We established seven experimental sites located within the spruce-moss and the balsam fir–white birch bioclimatic domains [36] (Figure 1). These OWs are characterized by a tree crown cover of <40%, a shrub layer dominated by ericaceous species, including Kalmia angustifolia, Rhododendron groenlandicum, and Vaccinium spp., and ground vegetation dominated (ground cover >40%) by lichens of Cladina spp. and Cladonia spp. [31]. Black spruce was the dominant tree species at all sites—representing at least 75% of the basal area—and jack pine was the main companion tree species.
Regional climate is cool continental with a mean daily temperature of 0.2 °C, which varies from −18.8 °C in January to 16.4 °C in July and an annual precipitation of 995.8 mm, of which 312.9 mm (31%) occurs as snowfall (climate normals from 1981 to 2010, Environment Canada, Chapais 2 station, 49°47′ N, 74°51′ W).
Each site was subjected to silvicultural treatments consisting of disk scarification, using a TTS disk trencher (34% of the total stand area was disturbed), followed by afforestation with black spruce (BS) and jack pine (JP) seedlings. The seedlings were grown at the Université du Québec à Chicoutimi in conventional containers of 67 cylindrical cavities, 50 cm3 root plug volume per cavity (IPL Inc., Saint-Damien, QC, Canada). Seedlings were planted at a density of 2500 plants ha−1 in summer 2000 (sites 4–11) and 2001 (sites 15–16) [31]. A description of the seven afforested OWs (sites) is provided in Table 1.

2.2. Tree Sampling

We sampled trees and took measurements in spring 2009 and 2010, nine years after afforestation, from two 400 m2 plots (20 m × 20 m) in each site: one in the portion afforested with black spruce (BS) and the other in the portion afforested with jack pine (JP), for a total of 14 plots. Both natural trees (i.e., trees that were already on the sites before plantation) and planted trees were harvested and measured.
For natural trees, we recorded DBH and H on all trees >1.3 m in H within each plot. We then assigned trees to four classes based on their DBH (four quartiles): dominant, co-dominant, intermediate, and oppressed. The use of quartiles ensured that there was an equal number of trees in each class per plot. We then randomly selected two trees per class for conducting biomass measurements, for a total of 112 trees. We harvested the selected trees and then measured their diameters at 0, 0.3, 0.6, 1, 1.3, 2.0, and 3.0 m height, and continued, if necessary, at meter-long intervals to the tip of the stem. We counted all the branches within each section, and the two opposite branches closer to the center of each section were identified, and brought to the laboratory to determine their dry mass. For trees within the oppressed class, we sampled branches on 0.5 m long sections, rather than 1 m sections, to obtain greater precision because several trees of this class would only have had two sections with branches. We sampled roots for four out of the seven sites (5, 9, 11, and 15) on a randomly selected tree per class and per plot, for a total of 32 trees (4 sites × 2 plots × 4 classes). Each selected tree was cut at the ground level, and the root system was manually and carefully uprooted so that we could harvest all roots with a diameter >5 mm. The root system was then identified and brought to the laboratory for further analyses.
For every planted tree within the 14 plots, we measured H, DSH (15 cm) and DBH (when trees were >1.3 m). We also harvested the root biomass of the four tallest trees within each plot (28 BS and 28 JP trees in total). The trees were carefully uprooted to obtain the entire root system, down to a minimal root diameter of 2 mm. The complete trees were then brought to the laboratory.
Overall, we harvested 117 BS trees (89 natural and 28 planted) and 50 JP trees (22 natural and 28 planted). Only 82% of BS trees (96 out of 117) were taller than 1.3 m, whereas all harvested JP were taller than 1.3 m (Figure S1).
In the laboratory, we placed the harvested stems and branches of both the natural and planted trees in a greenhouse for a few days for pre-drying. We then separated the tree material into three compartments: stems, branches, and needles. The sampled root systems were carefully cleaned to remove all organic matter or mineral soil. Afterwards, all samples were oven-dried at 65 °C until a constant weight was observed (at least for 48 h for stems and branches and up to a week for the roots). Samples were then weighed to the nearest 0.1 mg.
The total branches dry mass was obtained by multiplying the mean dry mass of the two opposite branches of each stem section by the number of branches counted previously. The branches biomass of each section was summed to obtain the total branches mass of each tree. To obtain the total stem dry mass, we determined the volume of the harvested stem sections from the measured length and diameter values and using Equation (1) [37]. A density coefficient of 481 kg m−3 for BS and 469 kg m−3 for JP was applied to obtain the wood dry mass [38].
V = ⅓× π × l × (a2 + ab + b2),
where V is the volume, l is the length of the section, and a and b are the diameters at the top and the bottom of the section, respectively.

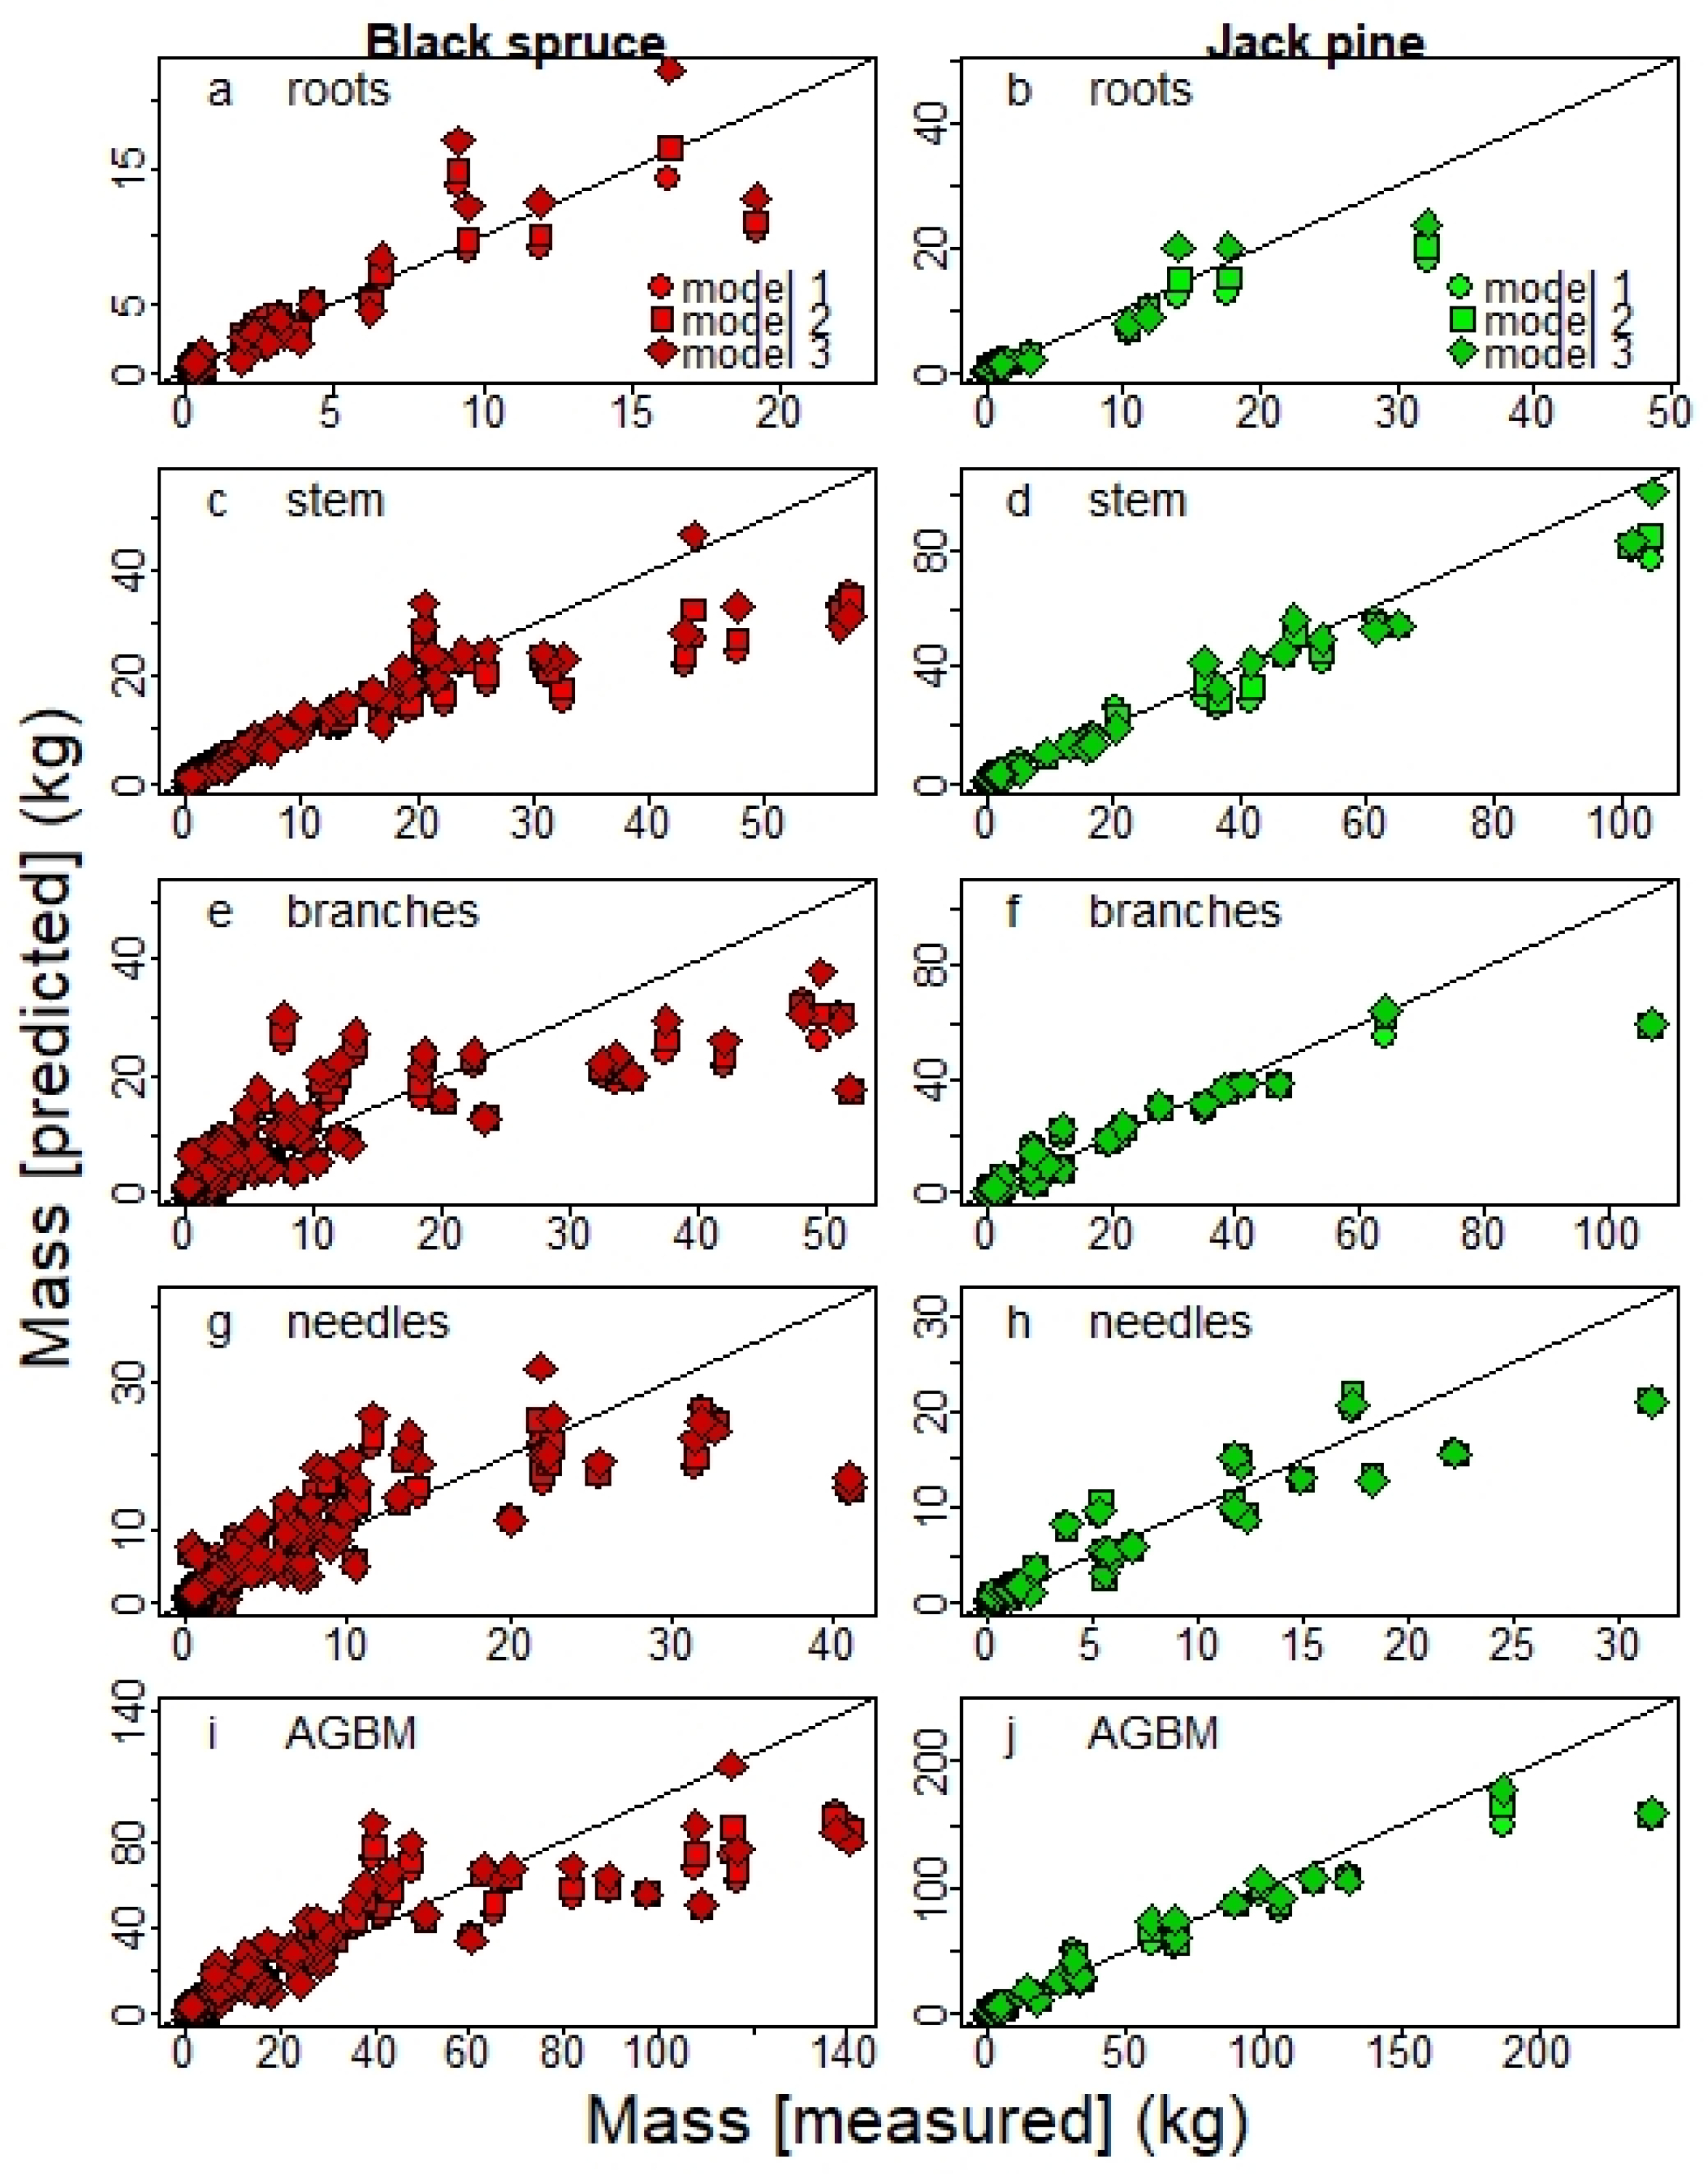
2.3. Fitting Performance of Existing Allometric Equations

Lambert et al. [12] produced DBH-based allometric equations for estimating the biomass of bark, stem wood, branches, and needles of various boreal tree species. We tested these equations on 96 BS and 50 JP trees taller than 1.3 m (i.e., with a DBH). In contrast with Lambert et al. [12], we did not separate the bark from the stem; therefore, the bark and stem wood masses predicted by Lambert et al.’s equations were summed and then compared with our stem biomass values. We computed the mean relative error (MRE) of the models for each tree compartment (stem, branches, needles, and aboveground biomass), as shown in Equation (2):
MRE = 1/(n − 1) ∑i[(Bmpi − BMmi)2/BMmi],
where BMp and BMn are the predicted and measured biomasses of the tree i, respectively.
As no equation for roots was available in Lambert et al. [12], the root:shoot ratios (RSr) of the natural and planted trees from the present study were compared to RSr ratios found in the literature. The RSr was calculated for each tree by dividing AGBM by the root biomass.

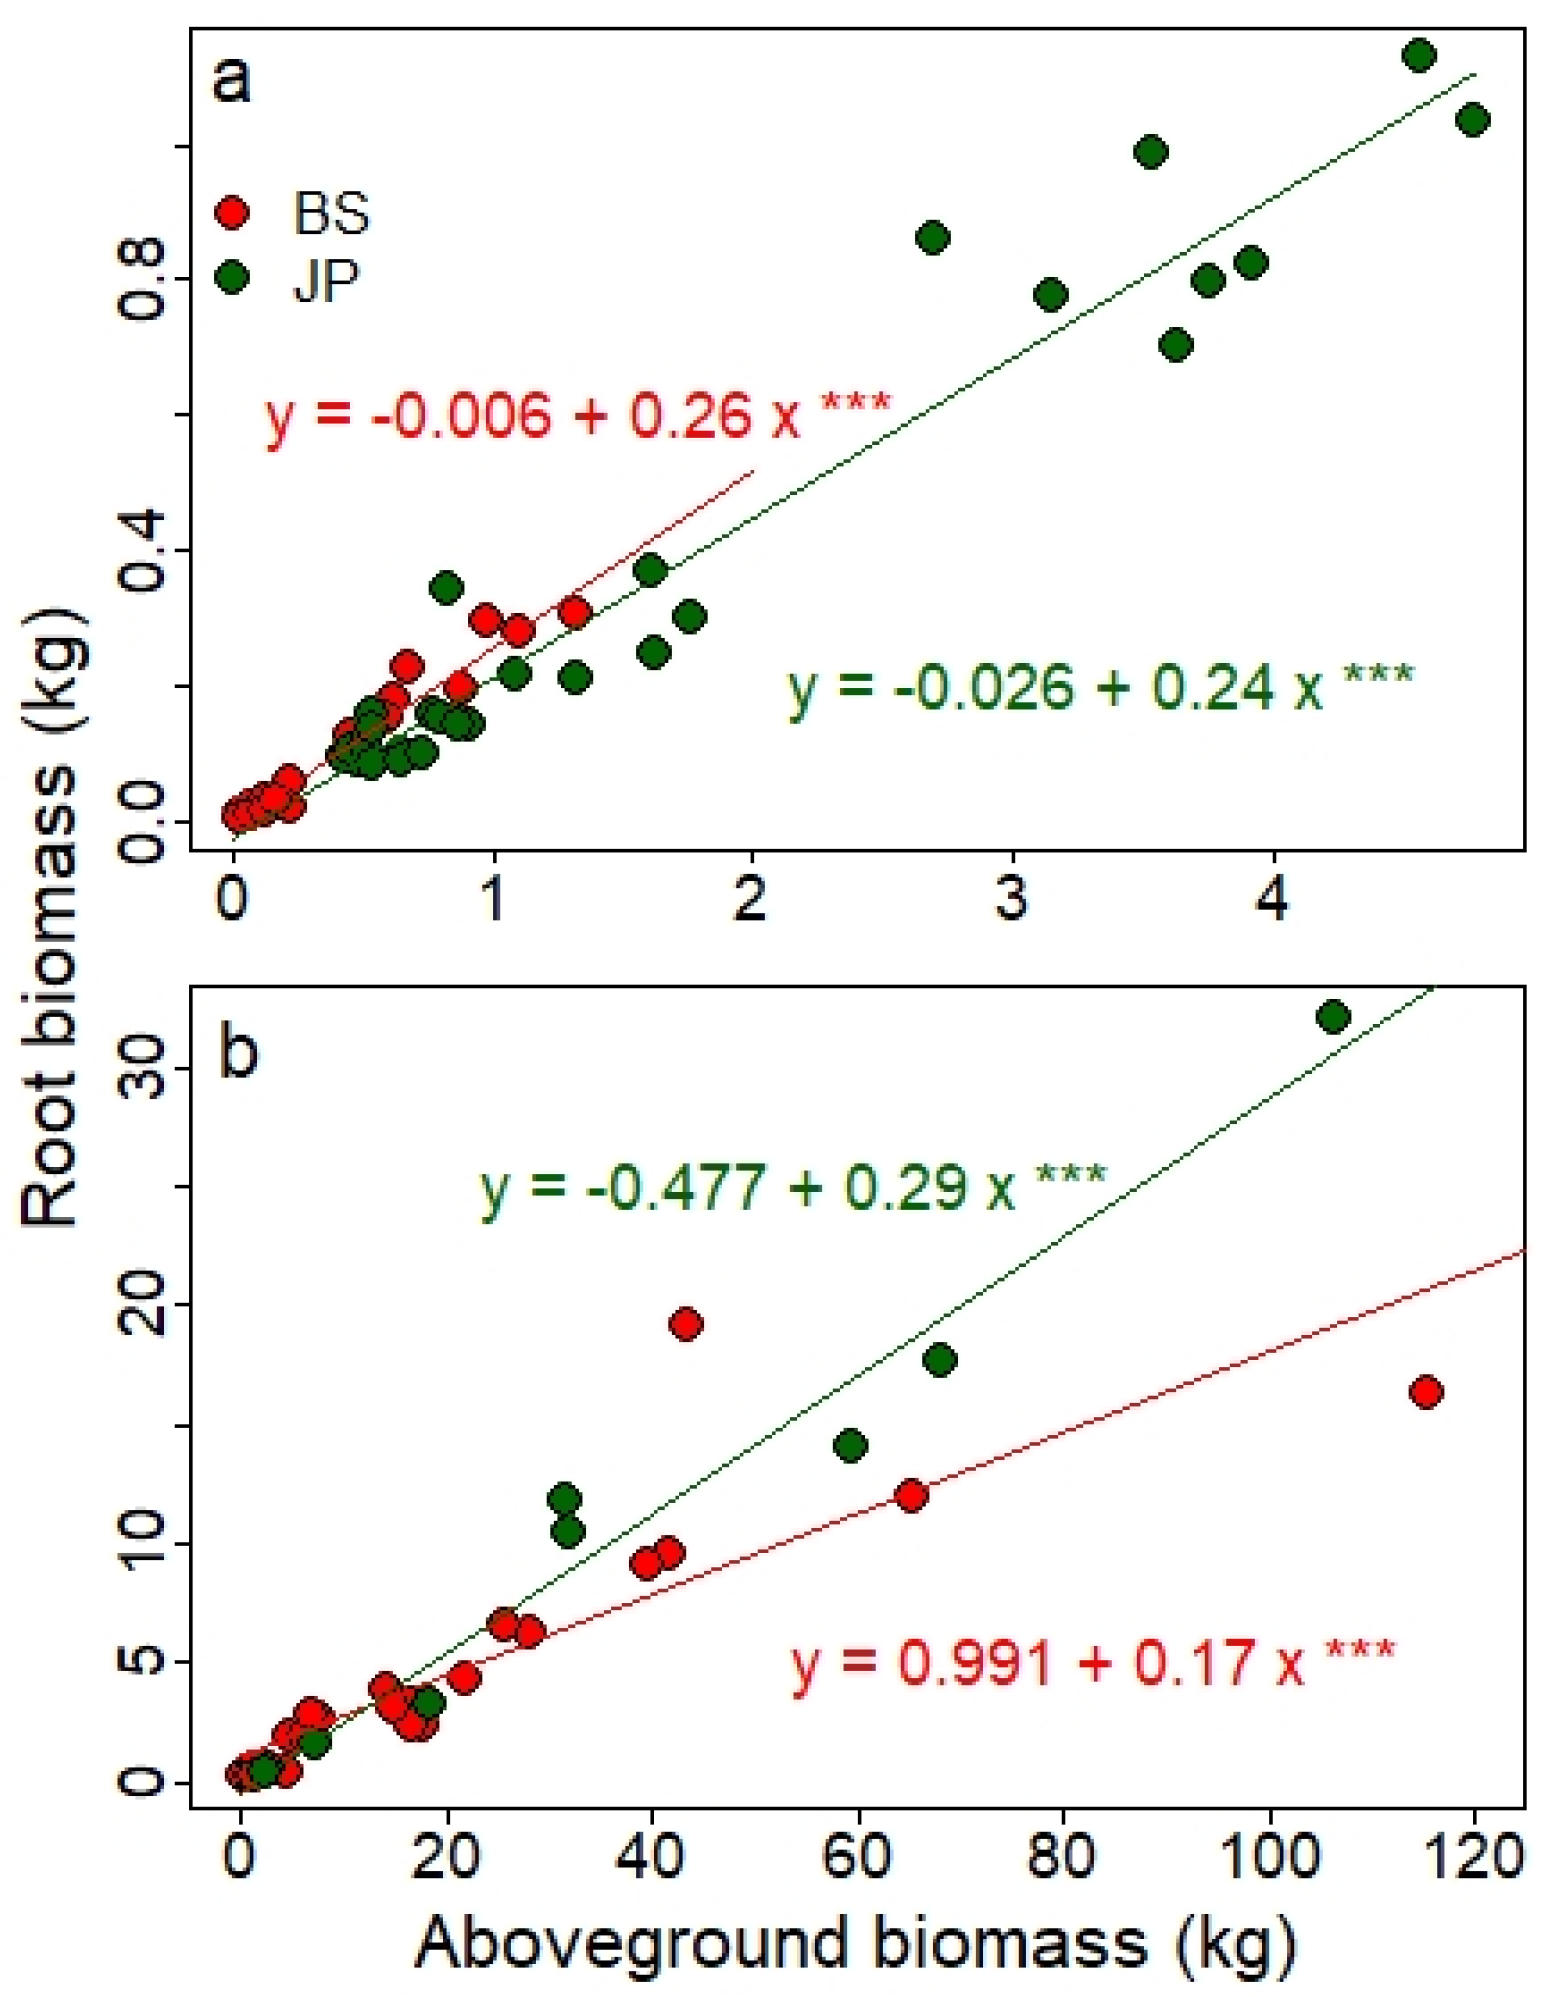
2.4. Development of Allometric Equations

Xiao et al. [10] have shown that using a linear regression on log-transformed data gives better parameter estimation than a non-linear regression fitted on the original data set when the error is multiplicative (log-normal distribution). In a first step, we followed the methodology they developed to assess the error distribution of our data and to conclude on whether the data must be log-transformed or not. When the assumption of log-normal error was better supported by the data (i.e., AICc-norm − AICc-lognorm > 2) a log-transformation of the data was applied to all compartments for both species. The relationship between DBH and the biomass of the different compartments is shown in Figure S2 for both the original and log-transformed data.
For all tree compartments, allometric equations were developed from three power models commonly used in forestry studies. Depending on the output of the error distribution analysis [10], the models were fitted on either the log-transformed or original data.
We first tested a simple power model with a diameter variable (Dv) as a single allometric variable (model 1):
BMi = β1 × Dvβ2 + Ɛ
The corresponding model with log-normal error on the logarithmic scale was thus:
Log(BMi) = Log(β1) × β2Dv + Ɛ
We also tested two power models with both Dv and height (H) as biometric variables. A model with two parameters (β1 and β2) (model 2):
BMi = β1 × (Dv2H)β2 + Ɛ
The corresponding model with log-normal error on the logarithmic scale was thus:
Log(BMi) = Log(β1) × β2(Dv2H) + Ɛ
The third model had three parameters (β1, β2 and β3) (model 3):
BMi = β1 × Dvβ2 × Hβ3 + Ɛ
The corresponding model with log-normal error on the logarithmic scale was thus:
Log(BMi) = Log(β1) × β2Dv × β3H + Ɛ
where BMi is the biomass of the compartment i, Dv is the stem diameter variable, β1, β2 and β3 the model’s parameters, and Ɛ the error term.
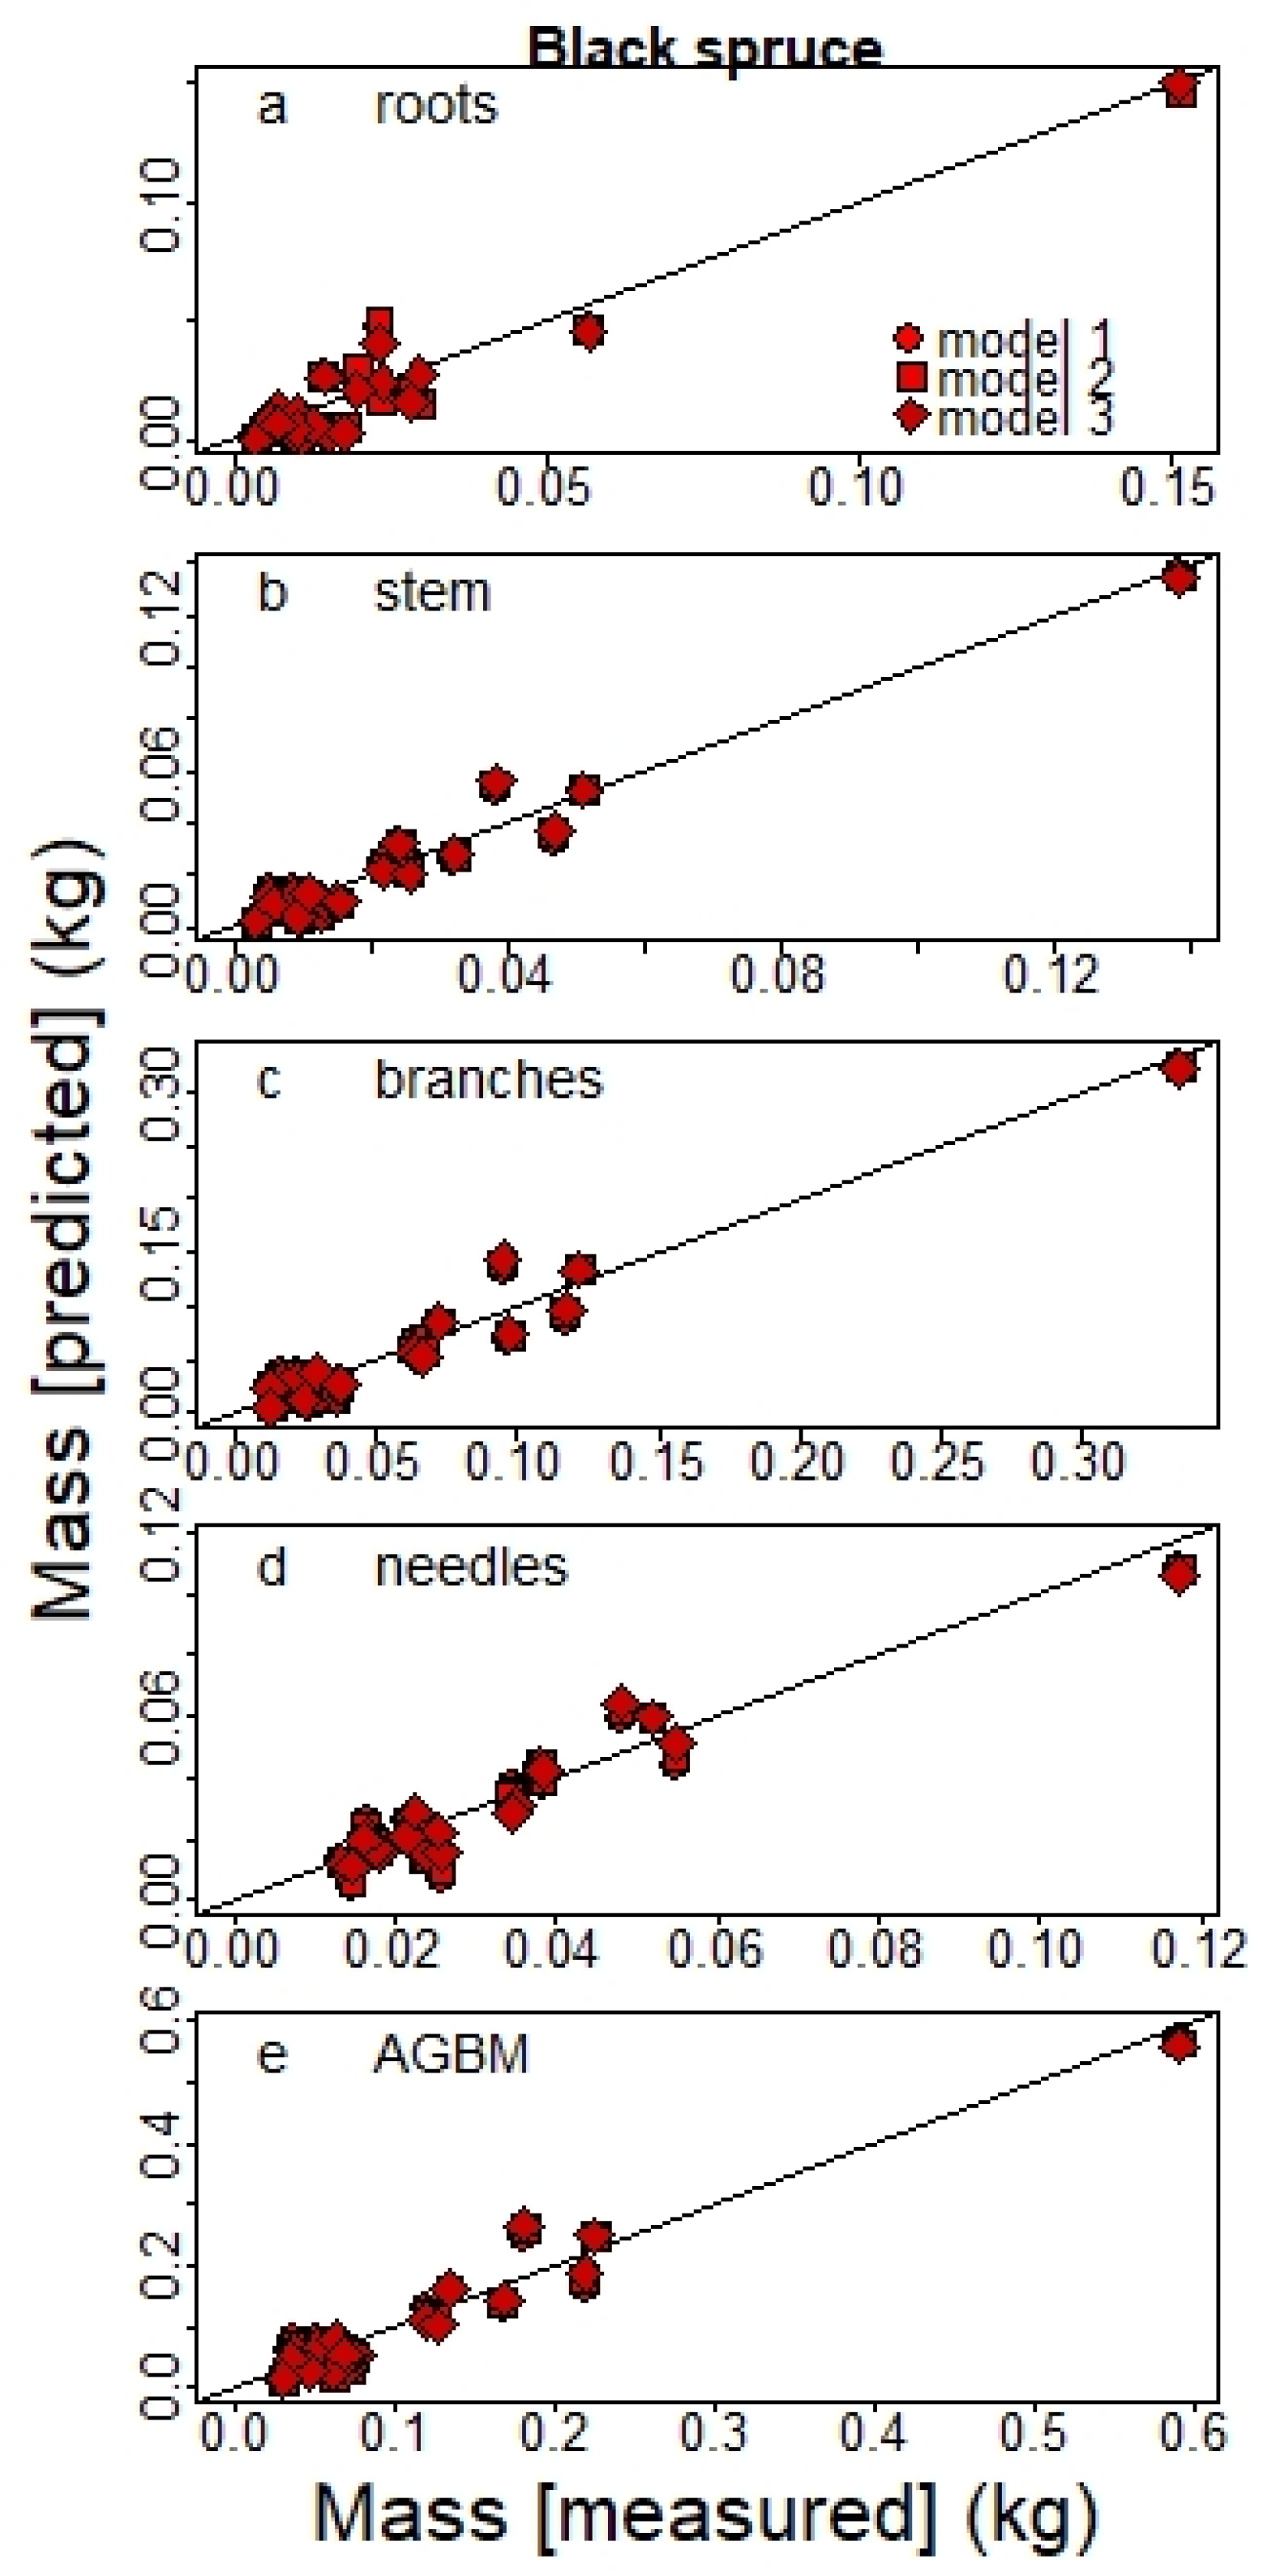
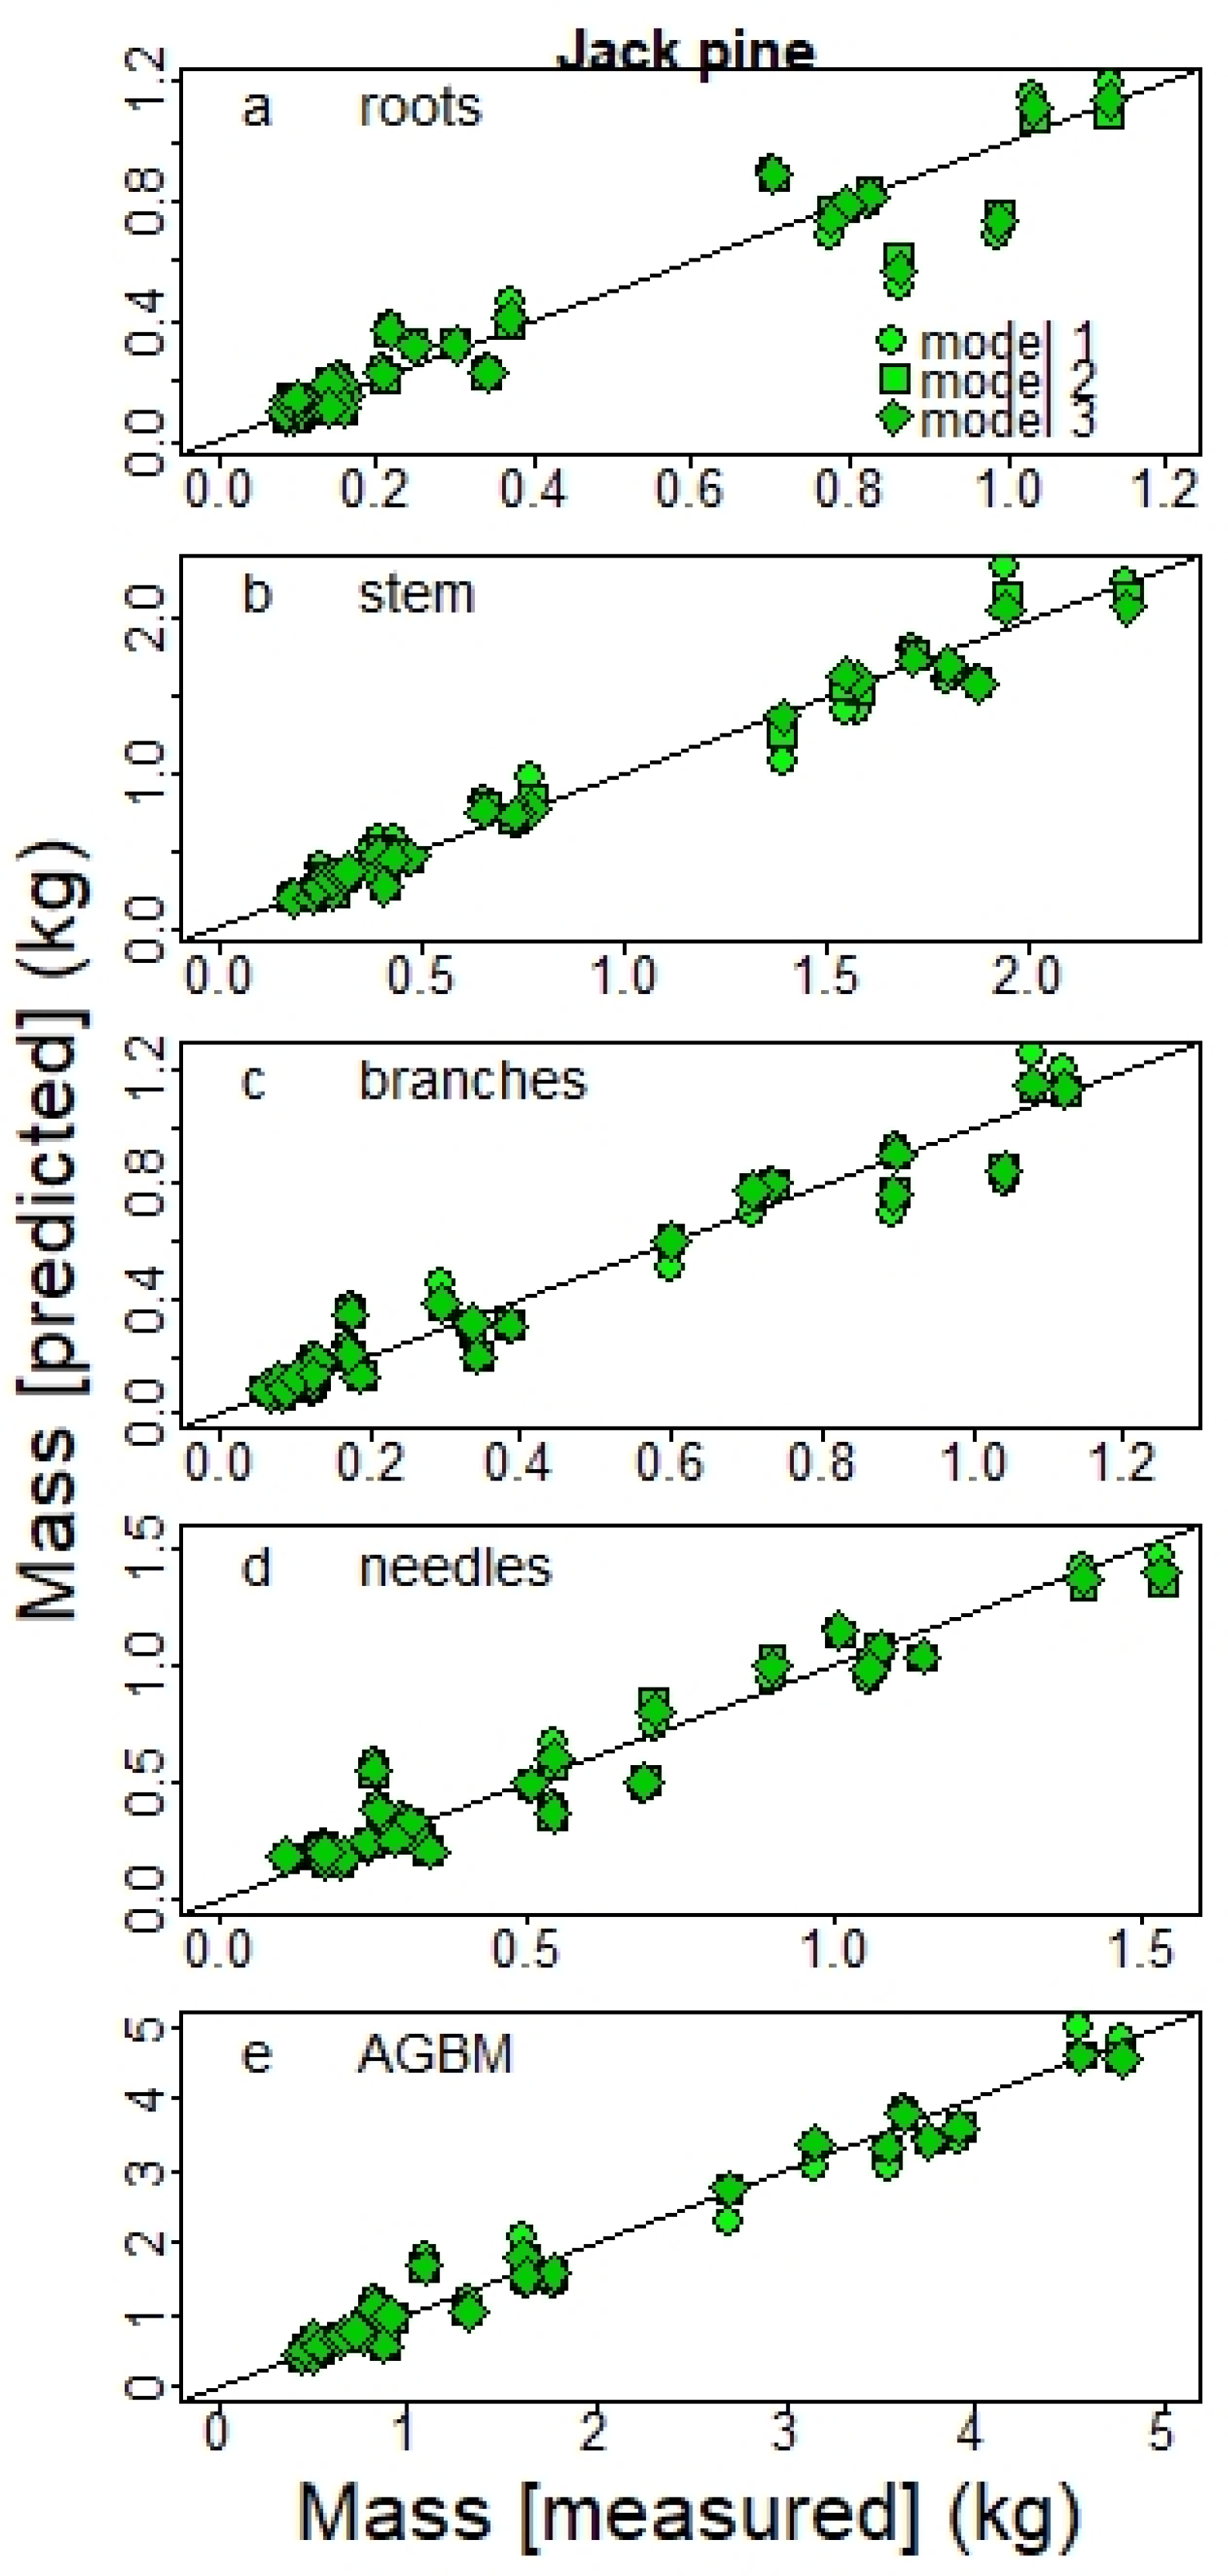
The plantations included trees with height < 1.3 m and therefore with no DBH values. Hence, we developed one set of equations with DSH as a diameter variable (Dv) from the sampled trees for which DSH was available: 21 planted BS with H < 1.3 m and 28 planted JP with H > 1.3 m.
We computed R2 and AICc for each model. It is known that the log-transformation of the data introduces a systematic bias to biomass values predicted from linear models built from log-transformed data. This bias can be corrected by applying a correction factor (CF = exp[RSE2/2]) in the back-transformation to the original arithmetic scale [39,40].

2.5. Carbon Stocks Calculation in Planted Trees, Nine Years after Afforestation

The developed allometric equations were used to estimate the total biomass (including AGBM plus roots) and, hence, C stocks within each 400 m2 plots based on the diameter and height of each planted tree. The total C in each tree was calculated as the sum of the dry mass of each tree compartment (needles, stems, branches, and roots), then multiplied by 0.5 as suggested by the Intergovernmental Panel on Climate Change (IPCC) [41]. We obtained the C stocks in the planted trees by summing the total C in all planted trees in each plot and then multiplying by a factor 25 to obtain C stocks in tons (t) per ha. The density of trees varied widely among plots (Table 1). To estimate the C sequestration potential of OW afforestation with the commonly applied planting density (2000 trees ha−1), C stock values in each plot were normalized with tree density.

3. Results

3.1. Fitting Performance of Existing Allometric Equations

The equations developed by Lambert et al. [12] produced a good fit for stem and aboveground biomass (AGBM) of both the BS and JP trees (Figure S3). The predicted mean AGBM was 9% lower than measured mean AGBM for BS (14.8 kg and 16.3 kg, respectively) and 18% lower for JP (20.0 kg and 24.3 kg, respectively) (Figure 2). This is mainly due to a large underestimation of branches biomass, for which the predicted contribution to the AGBM was about half of the actual contribution in both species (2.47 kg predicted and 4.36 kg measured for BS, 3.4 kg predicted and 7.62 measured for JP, Figure 2). The contribution of needles and stem to the AGBM was nevertheless accurately predicted, although slightly underestimated for needles and slightly overestimated for stem.

3.2. Species-Specific Allometric Equations

3.2.1. Black Spruce and Jack Pine Trees with H > 1.3 m

The application of the procedure developed by Xiao et al. [10] indicated that the assumption of log-normal error was better supported by our data for all compartments in both species. Hence, data were log-transformed prior to fitting a linear regression. Model 3—combining DBH and H with three parameters (β1, β2 and β3)—yielded the lowest AICc and highest R2 for all BS compartments (Table 2; Figure 3). Model 3 also yielded the best results for JP’s roots and stem biomasses but model 2 had equally low or lower AICc for branches, needles and aboveground biomasses (Table 3; Figure 3).

3.2.2. Black Spruce Trees with H < 1.3 m

The Xiao et al. [10] procedure indicated that the assumption of additive normal error was better supported for BS trees with H < 1.3 m. Therefore, data were not transformed, and non-linear regression were fitted on the original data set. Model 2 had the best fitting metrics for all compartments except for root biomass which was better fitted by model 1 (Table 4; Figure 4).

3.2.3. Planted Jack Pine Trees

Following the procedure developed by Xiao et al. [10], data were log-transformed for all compartments prior to fitting a linear regression. Model 2 had better or similar fitting metrics than the two other models for all compartments (Table 5; Figure 5).

3.2.4. Equations Parameters

The best models were selected according to the highest R2 and the lowest AICc. Equations for each compartment, tree species, and type are shown in Table 6. Models parameters and their standard errors are presented in Table S1.

3.3. Shoot Root Ratio

There was a relatively strong linear relationship between shoot (AGBM) and root biomasses in both planted and natural trees (Figure 6). The root:shoot ratio (RSr) was similar for both species (0.20 ± 0.05 and 0.21 ± 0.06 for BS and JP, respectively), although higher in natural than in planted trees (0.24 ± 0.08 and 0.26 ± 0.06 for BS and JP, respectively; Table 7).

3.4. C Stocks in Planted Trees

The allometric equations built in this study were used to determine the total C stocks in all planted trees on the sites. For both species, all the models gave practically the same biomass estimates (Figure 7). The total C stocks in OWs afforested with JP were on average more than five times higher than in those afforested with BS (0.14 vs. 0.80 t C·ha−1 for BS and JP, respectively). There was a large variability among sites partly due to a large variation in tree density (Table 1). However, even when C stocks values were normalized with tree density the variation among sites remained high (large error bars) due to differences in growth rates, which were significantly higher at sites 9 and 11 for both species (Table 1).

4. Discussion

Multiple allometric equations exist in the literature, but their use outside of the geographical limits or ecological attributes for which they were built can lead to inaccurate biomass estimates [14]. Although national equations are useful for large-scale applications, locally derived equations normally produce more precise and site-specific estimates [16]. Unless an equation was developed exclusively for a specific species and study region of interest, it is very difficult to determine which of several potentially applicable equations to choose [14]. As with any other climate change mitigation projects requiring reliable accounting for the C market or regulating obligations [41], the afforestation of boreal OWs requires a precise estimatation of biomass accumulation over time to quantify the actual size of this new C sink. The accuracy of national equations for this particular habitat [25,26] remains uncertain because trees growing in OWs experience very different environmental conditions than trees in closed-canopy forests [30,32]. These particular conditions can affect not only total biomass production but also the partitioning of AGBM among the foliage, branches, and stem [15,42]. Allometric equations made specifically for eastern Canadian boreal OWs offer much potential as a non-destructive, time-saving tool for estimating biomass given the total land area of OWs [6,28]. To our knowledge, this is the first study to explore the allometry of trees in OWs and provide a set of allometric equations for estimating biomass.

4.1. Comparison with Existing Equations

Data in the present study show that the biomass predicted by the equations of Lambert et al. [12] slightly underestimated total AGBM of trees in the studied OWs mainly due to a large underestimation of branches biomass. Those differences in AGBM partitioning among the various compartments likely relate to the specific morphological features of trees growing in OWs [29,43]. Differences in crown structure and allocation exist between open-grown and understory trees owing to light availability [44]. The underestimation of branches biomass by Lambert et al.’s equations suggest that trees growing in OWs may favor axillary rather than apical growth likely because of a higher light intensity. The trees within OWs may also have a higher branching rate likely due to a greater spacing between trees, as promiscuity among trees is known to reduce axillary budbreak and branch size [45].
This discrepancy may also result from methodological differences. In this study, we did not collect all branches of the studied trees, only two per 1 m section, from which we extrapolated to obtain the total biomass of the branches. In contrast, the branch and foliage biomasses of Quebec trees used in the Lambert et al. equations were not measured directly and were separated through a regression model based on data from other provinces. These methodological differences could produce a bias in the final biomass estimate of these compartments.
The wood density coefficient used to determine the biomass of natural tree is also a factor to account for. We did not measure wood density for each tree but instead used an average coefficient for each species obtained from many individuals spread over Quebec territory [38]. The use of an average factor regardless of the characteristics of the trees was justified by the lack of relationship between wood properties and tree-level attributes in any species, especially between wood density and DBH [38]. Another study carried out on several BS stands of all age ranges and site qualities across Ontario has shown wood density does not significantly vary across stands of various age and site quality [46]. However, some studies have shown that latitude [47,48,49,50] and DBH annual increment [51,52] have an influence on wood density. Further research on wood density of OW trees would permit clarification of this.

4.2. Equations Selection

Although complex allometric models involving more than two morphologic variables can be used to estimate tree biomass [50], simple power models involving trunk diameter alone or in combination with tree H are the most commonly used, and these models have been applied to wide range of forest ecosystems and species worldwide [12,53,54]. Here we tested whether the inclusion of tree H improved estimates of tree biomass. Although equations using both diameter and H (model 2 and 3) generally produced a better fit (Table 2), equations based on diameter only (model 1) also offered good estimates, yielding R2 values often lower by < 0.02. Adding the H variable to the model also had a small impact on C stock estimates at the stand level, although model 1 tended to slightly overestimate JP C sequestration (Figure 7). This result agrees with other studies that held diameter as the most important variable for estimating biomass, even when used alone, because H measurements only marginally improve estimates in most cases [13,16,42,55,56].
Given that tree H measurements are time-consuming and less accurate, particularly for tall trees and in closed-canopy forests, our results suggest that the use of diameter as a single allometric variable (model 1) is appropriate, especially in a context of large-scale inventories, as adding H to the model only slightly improves the accuracy of the total estimated biomass. However, height can be included in the inventories when it can be easily and accurately measured, such as for smaller trees, especially when under 1.3 m tall.

4.3. Root:Shoot Ratio (RSr)

Accurate estimates of root biomass are necessary when the purpose of afforestation is to deliver C emission offsets; this is especially the case in low-productivity boreal stands where root biomass represents a particularly large fraction of total tree biomass [57]. No equations were available for this compartment in the national set of equations [12]; therefore, we required site- and species-specific root allometric equations to properly assess the C stocks within OWs. The RSr, or the belowground to aboveground biomass ratio, represents a standard method for estimating root biomass from the more easily measured shoot biomass [57]. The ratio obtained in this study (0.20–0.26) was lower than the value of 0.39 reported for low-productivity boreal forests (<75 tons ha−1) and that proposed in the IPCC Guidelines for National Greenhouse Gas Inventories [58]. Mokany et al. [57] found that in forests with an AGBM > 75 tons ha−1, the ratio was 0.23, a value closer to the one obtained in the present study and to the value of 0.22 used in the budget model of the Canadian Forest Sector [59]. A recent study also found RSr in the hemiboreal forest zone to vary between 0.20 and 0.25 for pine and between 0.21 and 0.30 for spruce [55].
Our lower RSr values, relative to those reported for low-productivity boreal stands, may result from an underestimation of root biomass because only roots with a diameter > 5 mm were excavated for natural trees. The RSr value for planted trees was however even lower than that for natural trees although we excavated roots to a minimum diameter of 2 mm as recommended by the IPCC [58]. Fine roots (<2 mm) are generally excluded from belowground biomass because they often cannot be distinguished empirically from soil organic matter and litter; consequently, they are accounted for within the organic soil pool for greenhouse gas inventories.
Average RSr values must, however, be interpreted with caution because of the marked intersite variability (Table 7), especially for natural BS trees, for which our RSr estimates ranged from 0.08 to 0.44. Such a large variability has been reported in low-productivity (AGBM < 75 tons·ha−1) boreal stands studied by Mokany et al. [57], who observed RSr values of 0.22 to 0.96. Coniferous trees with DBH values < 10–15 cm generally have a lower RSr [55]. Of the 32 natural trees analyzed for RSr, only 10% had a DBH > 15 cm, and 68% had a DBH < 10 cm, possibly explaining why the planted trees had a lower RSr in our study, and why planted trees had a lower RSr than natural trees. Even if root biomass was underestimated in this study, our obtained RSr values are very similar to previous studies, and the estimates are conservative, which is expected for reliable C balance accounting. Additionally, the fine-root biomass can be assessed via the organic and mineral soil compartments in the perspective of establishing a complete C balance for the OWs.

4.4. Estimates of Total Biomass

Based on the allometric equations developed in this study, the total estimated biomass—and hence C accumulation in tree biomass—was approximately five times higher in JP than in BS plantations nine years after afforestation (Figure 7). Given the growth rates observed in this study for BS, the theoretical short-term C balance projected in Gaboury et al. [28] may not be reached. Their growth simulation was based on a site quality index (SI) of 6 (the larger the SI the higher the forest productivity), which is higher than the SI of the present study’s sites determined using the H of the dominant trees [60]. It is worth mentioning, however, that SI value may be underestimated owing to the young age of the plantation, as BS grows slower in the first years than many of the trees and shrubs with which it is associated [61]. The estimated SI for these stands should be reassessed in the future to clarify this point.
The difference in growth rate between the two species may largely result from differences in root distribution. The BS root system develops mostly in the humus layer or at the humus–mineral interface [61,62] whereas JP develops a root system that can go deeper into the mineral soil [63], which allows this species to reach N sources that are less available to BS [64]. This indicates that JP is more suited to grow on OWs where the organic soil is thin or nearly absent, at least during the juvenile growth period of planted trees.
The large variability in total C accumulation in tree biomass between sites resulted from the combination of a wide range in planted tree density (from 275–2350 stems·ha−1) and a large range in tree H for both species. However, the large variability remained even when tree density was normalized (from 0.06–2.4 t·C ha−1 for JP and 0.008–0.66 t·C ha−1 for BS) (Figure 7). Tree height was much higher at both sites located in the Chibougamau region (sites 9 and 11), which resulted in much higher biomass values than at the other sites. Growth rates has been shown to differ between OWs [65] partly due to differences in humus depth, whereas the adjacent closed-crown stands have a more constant humus depth. In contrast, OW mineral soil layers likely contain similar available nutrient pools than in nearby closed-crown forests [66].

5. Conclusions

This study aimed to develop allometric equations for both BS and JP growing in OWs within Quebec’s spruce-feathermoss and balsam fir–white birch bioclimatic domains. Existing allometric equations for the Canadian boreal forest tend to underestimate branches biomass for trees growing in OW stands, likely due to the contrasting aboveground morphology in closed-crown stands vs. OWs. We found that the inclusion of H along with DBH as variables in the model yielded better fits but that using only DBH did not markedly impact the accuracy of biomass predictions. Estimations of total planted trees biomass nine years after afforestation based on the newly developed allometric equations, show large variation among sites owing to intersite differences in both tree density and tree growth. Our results show a much higher growth rate for JP than for BS in OWs. Hence, afforestation of OWs using JP could maximize biomass production and enhance the GHG-offset potential of boreal OWs [6]. If the site index that we observed in JP plantations persists over the coming years, the net sequestration may be 1.8–2 times higher than predicted by previous studies [28].

Supplementary Materials

The following are available online at https://www.mdpi.com/1999-4907/12/1/59/s1, Figure S1: Distribution of sampled trees by height (m); Figure S2: Relationship between DBH and biomass of the different compartments for both the original and log-transformed data, for black spruce (BS) and jack pine (JP); Figure S3. Predicted mass of stems, branches, and needles, as well as aboveground biomass, all calculated using the allometric equations of Lambert et al. (2005), versus the corresponding measured values for sampled black spruce (n = 96) and jack pine (n = 50). All sampled trees were >1.3 m in height. Residual mean square (RMSE) values are shown on the graphs; Table S1: Parameter values and their standard errors (SE) for each selected model

Author Contributions

Conceptualization, D.L. and J.-F.B.; methodology, O.F., P.T., and J.-F.B.; equations methodology, O.F. and C.M.; validation, O.F., P.T., and J.-F.B.; formal analysis, O.F. and C.M; investigation, O.F. and P.T.; writing—original draft preparation, O.F. and C.M.; writing—review and editing, P.T. and J.-F.B.; visualization, O.F. and C.M.; supervision, D.L. and J.-F.B.; project administration, J.-F.B.; funding acquisition, D.L. and J.-F.B. All authors have read and agreed to the published version of the manuscript.

Funding

This research was funded by FRQNT and NSERC grants to D. Lord and J.-F. Boucher and UQAC’s Carbone Boreal research infrastructure.

Institutional Review Board Statement

Not applicable.

Informed Consent Statement

Not applicable.

Data Availability Statement

The data presented in this study are available on request from the corresponding author.

Acknowledgments

We would like to thank Isabelle Delisle, Marianne Gagnon-Duchesne, Maud Touchette, Esteban Gonzalez, Alexandre Lefebvre, and Isabelle Côté for their assistance in the field and laboratory.

Conflicts of Interest

The authors declare no conflict of interest.

References

  1. FAO. The State of the World’s Forests 2018—Forest Pathways to Sustainable Development; FAO: Rome, Italy, 2018. [Google Scholar]
  2. Natural Resources Canada. The State of Canada’s Forests Annual Report 2020; Canadian Forest Service, Ed.; Natural Resources Canada: Ottawa, ON, Canada, 2020.
  3. Brandt, J.P.; Flannigan, M.D.; Maynard, D.G.; Thompson, I.D.; Volney, W.J.A. An introduction to Canada’s boreal zone: Ecosystem processes, health, sustainability, and environmental issues. Environ. Rev. 2013, 21, 207–226. [Google Scholar] [CrossRef]
  4. Waring, B.; Neumann, M.; Prentice, I.C.; Adams, M.; Smith, P.; Siegert, M. Forests and Decarbonization—Roles of Natural and Planted Forests. Front. For. Glob. Chang. 2020, 3, 58. [Google Scholar] [CrossRef]
  5. Boudewyn, P.; Song, X.; Magnussen, S.; Gillis, M.D. Model-Based, Volume-to-Biomass Conversion for Forested and Vegetated Land in Canada; Canadian Forest Service: Victoria, BC, Canada, 2007. [Google Scholar]
  6. Boucher, J.F.; Tremblay, P.; Gaboury, S.; Villeneuve, C. Can boreal afforestation help offset incompressible GHG emissions from Canadian industries? Process Saf. Environ. Prot. 2012, 90, 459–466. [Google Scholar] [CrossRef]
  7. Kurz, W.A.; Shaw, C.H.; Boisvenue, C.; Stinson, G.; Metsaranta, J.; Leckie, D.; Dyk, A.; Smyth, C.; Neilson, E.T. Carbon in Canada’s boreal forest—A synthesis. Environ. Rev. 2013, 21, 260–292. [Google Scholar] [CrossRef]
  8. Montagu, K.D.; Düttmer, K.; Barton, C.V.M.; Cowie, A.L. Developing general allometric relationships for regional estimates of carbon sequestration—an example using Eucalyptus pilularis from seven contrasting sites. For. Ecol. Manag. 2005, 204, 115–129. [Google Scholar] [CrossRef]
  9. Chave, J.; Rejou-Mechain, M.; Burquez, A.; Chidumayo, E.; Colgan, M.S.; Delitti, W.B.; Duque, A.; Eid, T.; Fearnside, P.M.; Goodman, R.C.; et al. Improved allometric models to estimate the aboveground biomass of tropical trees. Glob. Chang. Biol. 2014, 20, 3177–3190. [Google Scholar] [CrossRef]
  10. Xiao, X.; White, E.P.; Hooten, M.B.; Durham, S.L. On the use of log-transformation vs. nonlinear regression for analyzing biological power laws. Ecology 2011, 92, 1887–1894. [Google Scholar] [CrossRef] [Green Version]
  11. Evert, F. Systems of Equations for Estimating Ovendry Mass of 18 Canadian Tree Species; Petawawa National Forestry Institute: Chalk River, ON, Canada, 1985.
  12. Lambert, M.C.; Ung, C.H.; Raulier, F. Canadian national tree aboveground biomass equations. Can. J. For. Res. 2005, 35, 1996–2018. [Google Scholar] [CrossRef]
  13. Ung, C.-H.; Bernier, P.; Guo, X.-J. Canadian national biomass equations: New parameter estimates that include British Columbia data. Can. J. For. Res. 2008, 38, 1123–1132. [Google Scholar] [CrossRef]
  14. Jenkins, J.C.; Chojnacky, D.C.; Heath, L.S.; Birdsey, R.A. National-scale biomass estimators for United States tree species. For. Sci. 2003, 49, 12–35. [Google Scholar]
  15. Bond-Lamberty, B.; Wang, C.; Gower, S.T. Aboveground and belowground biomass and sapwood area allometric equations for six boreal tree species of northern Manitoba. Can. J. For. Res. 2002, 32, 1441–1450. [Google Scholar] [CrossRef]
  16. Case, B.S.; Hall, R.J. Assessing prediction errors of generalized tree biomass and volume equations for the boreal forest region of west-central Canada. Can. J. For. Res. 2008, 38, 878–889. [Google Scholar] [CrossRef]
  17. Martin, J.L.; Gower, S.T.; Plaut, J.; Holmes, B. Carbon pools in a boreal mixedwood logging chronosequence. Glob. Chang. Biol. 2005, 11, 1883–1894. [Google Scholar] [CrossRef]
  18. TerMikaelian, M.T.; Korzukhin, M.D. Biomass equations for sixty-five North American tree species. For. Ecol. Manag. 1997, 97, 1–24. [Google Scholar] [CrossRef] [Green Version]
  19. Ouimet, R.; Camire, C.; Brazeau, M.; Moore, J.D. Estimation of coarse root biomass and nutrient content for sugar maple, jack pine, and black spruce using stem diameter at breast height. Can. J. For. Res. 2008, 38, 92–100. [Google Scholar] [CrossRef]
  20. Brassard, B.W.; Chen, H.Y.H.; Bergeron, Y.; Pare, D. Coarse root biomass allometric equations for Abies balsamea, Picea mariana, Pinus banksiana, and Populus tremuloides in the boreal forest of Ontario, Canada. Biomass Bioenergy 2011, 35, 4189–4196. [Google Scholar] [CrossRef]
  21. Gagnon, R.; Morin, H. Les forêts d’épinette noire du Québec: Dynamique, perturbations et biodiversité. Nat. Can. 2001, 125, 26–35. [Google Scholar]
  22. Girard, F.; Payette, S.; Gagnon, R. Origin of the lichen-spruce woodland in the closed-crown forest zone of eastern Canada. Glob. Ecol. Biogeogr. 2009, 18, 291–303. [Google Scholar] [CrossRef]
  23. Le Goff, H.; Sirois, L. Black spruce and jack pine dynamics simulated under varying fire cycles in the northern boreal forest of Quebec, Canada. Can. J. For. Res. 2004, 34, 2399–2409. [Google Scholar] [CrossRef]
  24. Payette, S.; Bhiry, N.; Delwaide, A.; Simard, M. Origin of the lichen woodland at its southern range limit in eastern Canada: The catastrophic impact of insect defoliators and fire on the spruce-moss forest. Can. J. For. Res. 2000, 30, 288–305. [Google Scholar] [CrossRef]
  25. Payette, S.; Delwaide, A. Shift of conifer boreal forest to lichen-heath parkland caused by successive stand disturbances. Ecosystems 2003, 6, 540–550. [Google Scholar] [CrossRef]
  26. Jasinski, J.P.P.; Payette, S. The creation of alternative stable states in the southern boreal forest, Quebec, Canada. Ecol. Monogr. 2005, 75, 561–583. [Google Scholar] [CrossRef]
  27. Girard, F.; Payette, S.; Gagnon, R. Rapid expansion of lichen woodlands within the closed-crown boreal forest zone over the last 50 years caused by stand disturbances in eastern Canada. J. Biogeogr. 2008, 35, 529–537. [Google Scholar] [CrossRef]
  28. Gaboury, S.; Boucher, J.F.; Villeneuve, C.; Lord, D.; Gagnon, R. Estimating the net carbon balance of boreal open woodland afforestation: A case-study in Quebec’s closed-crown boreal forest. For. Ecol. Manag. 2009, 257, 483–494. [Google Scholar] [CrossRef]
  29. Payette, S. Fire as a Controlling Process in the North American Boreal Forest. Dans: A Systems Analysis of the Global Boreal Forest; Cambridge University Press: Cambridge, UK, 1992; pp. 144–169. [Google Scholar]
  30. Hébert, F.; Boucher, J.F.; Bernier, P.Y.; Lord, D. Growth response and water relations of 3-year-old planted black spruce and jack pine seedlings in site prepared lichen woodlands. For. Ecol. Manag. 2006, 223, 226–236. [Google Scholar] [CrossRef] [Green Version]
  31. Hebert, F.; Boucher, J.F.; Walsh, D.; Tremblay, P.; Cote, D.; Lord, D. Black spruce growth and survival in boreal open woodlands 10 years following mechanical site preparation and planting. Forestry 2014, 87, 277–286. [Google Scholar] [CrossRef] [Green Version]
  32. Tremblay, P.; Boucher, J.-F.; Tremblay, M.; Lord, D. Afforestation of boreal open woodlands: Early performance and ecophysiology of planted black spruce seedlings. Forests 2013, 4, 433–454. [Google Scholar] [CrossRef]
  33. Prévost, M. Effects of scarification on seedbed coverage and natural regeneration after a group seed-tree cutting in a black spruce (Picea mariana) stand. For. Ecol. Manag. 1997, 94, 219–231. [Google Scholar] [CrossRef]
  34. Prévost, M.; Dumais, D. Croissance et statut nutritif de marcottes, de semis naturels et de plants d’épinette noire à la suite du scarifiage: Résultats de 10 ans. Can. J. For. Res. 2003, 33, 2097–2107. [Google Scholar] [CrossRef]
  35. Madec, C.; Walsh, D.; Lord, D.; Tremblay, P.; Boucher, J.-F.; Bouchard, S. Afforestation of black spruce lichen woodlands by natural seeding. North. J. Appl. For. 2012, 29, 191–196. [Google Scholar] [CrossRef]
  36. Saucier, J.-P.; Robitaille, A.; Grondin, P. Cadre bioclimatique du Québec. Man. For. 2009, 2, 186–205. [Google Scholar]
  37. Carmean, W.H. Site Index Curves for Upland Oaks in the Central States. For. Sci. 1972, 18, 109–120. [Google Scholar]
  38. Giroud, G.; Bégin, J.; Defo, M.; Ung, C.-H. Regional variation in wood density and modulus of elasticity of Quebec’s main boreal tree species. For. Ecol. Manag. 2017, 400, 289–299. [Google Scholar] [CrossRef]
  39. Baskerville, G.L. Use of logarithmic regression in the estimation of plant biomass. Can. J. For. Res. 1972, 2, 49–53. [Google Scholar] [CrossRef]
  40. Parresol, B.R. Assessing tree and stand biomass: A review with examples and critical comparisons. For. Sci. 1999, 45, 573–593. [Google Scholar]
  41. IPCC. Good Practice Guidance for Land Use, Land-Use Change and Forestry; Gytarsky, M., Penmam, J., Hiraishi, T., Krug, T., Kruger, D., Pipatti, R., Buendia, L., Miwa, K., Ngara, T., Tanabe, K., Eds.; The Intergovernmental Panel on Climate Change: Geneva, Switzerland; Cambridge University Press: Cambridge, UK, 2003. [Google Scholar]
  42. Li, Y.D.; Liu, Q.; Meng, S.; Zhou, G. Allometric biomass equations of Larix sibirica in the Altay Mountains, Northwest China. J. Arid Land 2019, 11, 608–622. [Google Scholar] [CrossRef] [Green Version]
  43. Riverin, S.; Gagnon, R. Dynamics of the regeneration of a lichen-spruce woodland in a black spruce feather-moss forest of the northern section of Saguenay-Lac-Saint-Jean. Can. J. For. Res. 1996, 26, 1504–1509. [Google Scholar] [CrossRef]
  44. O’Connell, B.M.; Kelty, M.J. Crown architecture of understory and open-grown white pine (Pinus strobus L.) saplings. Tree Physiol. 1994, 14, 89–102. [Google Scholar] [CrossRef]
  45. Jones, M.; Harper, J.L. The influence of neighbors on the growth of trees. II The fate of buds on long and short shoots in Betula pendula. Proc. R. Soc. Ser. B-Biol. Sci. 1987, 232, 19–33. [Google Scholar] [CrossRef]
  46. Chen, W.J.; Chen, J.M.; Price, D.T.; Cihlar, J. Effects of stand age on net primary productivity of boreal black spruce forests in Ontario, Canada. Can. J. For. Res. 2002, 32, 833–842. [Google Scholar] [CrossRef]
  47. Rossi, S.; Cairo, E.; Krause, C.; Deslauriers, A. Growth and basic wood properties of black spruce along an alti-latitudinal gradient in Quebec, Canada. Ann. For. Sci. 2015, 72, 77–87. [Google Scholar] [CrossRef]
  48. Zhang, S.-B.; Slik, J.W.F.; Zhang, J.-L.; Cao, K.-F. Spatial patterns of wood traits in China are controlled by phylogeny and the environment. Glob. Ecol. Biogeogr. 2011, 20, 241–250. [Google Scholar] [CrossRef]
  49. St-Germain, J.L.; Krause, C. Latitudinal variation in tree-ring and wood cell characteristics of Picea mariana across the continuous boreal forest in Quebec. Can. J. For. Res. 2008, 38, 1397–1405. [Google Scholar] [CrossRef]
  50. Chave, J.; Muller-Landau, H.C.; Baker, T.R.; Easdale, T.A.; Ter Steege, H.; Webb, C.O. Regional and phylogenetic variation of wood density across 2456 neotropical tree species. Ecol. Appl. 2006, 16, 2356–2367. [Google Scholar] [CrossRef] [Green Version]
  51. Hebert, F.; Krause, C.; Plourde, P.Y.; Achim, A.; Pregent, G.; Menetrier, J. Effect of Tree Spacing on Tree Level Volume Growth, Morphology, and Wood Properties in a 25-Year-Old Pinus banksiana Plantation in the Boreal Forest of Quebec. Forests 2016, 7, 276. [Google Scholar] [CrossRef] [Green Version]
  52. Pretzsch, H.; Biber, P.; Schütze, G.; Kemmerer, J.; Uhl, E. Wood density reduced while wood volume growth accelerated in Central European forests since 1870. For. Ecol. Manag. 2018, 429, 589–616. [Google Scholar] [CrossRef]
  53. Paul, K.I.; Roxburgh, S.H.; England, J.R.; Ritson, P.; Hobbs, T.; Brooksbank, K.; Raison, R.J.; Larmour, J.S.; Murphy, S.; Norris, J.; et al. Development and testing of allometric equations for estimating above-ground biomass of mixed-species environmental plantings. For. Ecol. Manag. 2013, 310, 483–494. [Google Scholar] [CrossRef]
  54. He, A.; McDermid, G.J.; Rahman, M.M.; Strack, M.; Saraswati, S.; Xu, B. Developing Allometric Equations for Estimating Shrub Biomass in a Boreal Fen. Forests 2018, 9, 569. [Google Scholar] [CrossRef] [Green Version]
  55. Liepins, J.; Lazdins, A.; Liepins, K. Equations for estimating above- and belowground biomass of Norway spruce, Scots pine, birch spp. and European aspen in Latvia. Scand. J. For. Res. 2018, 33, 58–70. [Google Scholar] [CrossRef]
  56. Brantley, S.T.; Schulte, M.L.; Bolstad, P.V.; Miniat, C.F. Equations for Estimating Biomass, Foliage Area, and Sapwood of Small Trees in the Southern Appalachians. For. Sci. 2016, 62, 414–421. [Google Scholar] [CrossRef]
  57. Mokany, K.; Raison, R.J.; Prokushkin, A.S. Critical analysis of root: Shoot ratios in terrestrial biomes. Glob. Chang. Biol. 2006, 12, 84–96. [Google Scholar] [CrossRef]
  58. IPCC. Guidelines for National Greenhouse Gas Inventories, Prepared by the National Greenhouse Gas Inventories Programme; Eggleston, H.S., Buendia, L., Miwa, K., Ngara, T., Tanabe, K., Eds.; IPCC: Geneva, Switzerland, 2006. [Google Scholar]
  59. Li, Z.; Kurz, W.A.; Apps, M.J.; Beukema, S.J. Belowground biomass dynamics in the Carbon Budget Model of the Canadian Forest Sector: Recent improvements and implications for the estimation of NPP and NEP. Can. J. For. Res. 2003, 33, 126–136. [Google Scholar] [CrossRef]
  60. Prégent, G.; Bertrand, V.; Charette, L. Tables Préliminaires de Rendement Pour les Plantations D’épinette Noire au Québec; Gouvernement du Québec, Ministère des Ressources Naturelles: Quebec City, QC, Canada, 1996.
  61. Viereck, L.A.; Johnston, W.F. Picea mariana (Mill.) BSP black spruce. In Silvics of North America. Vol. 1, Conifers. Agriculture Handbook 654; Burns, R.M., Honkala, B., Eds.; Forest Service, United States Department of Agriculture: Washington, DC, USA, 1990; Volume 1, pp. 227–237. [Google Scholar]
  62. Des Rochers, A.; Gagnon, R. Is ring count at ground level a good estimation of black spruce age? Can. J. For. Res. 1997, 27, 1703. [Google Scholar] [CrossRef]
  63. Rudolph, T.D.; Laidly, P.R. Pinus banksiana Lamb. Jack Pine. In Silvics of North America. Vol. 1, Conifers. Agriculture Handbook 654; Burns, R.M., Honkala, B., Eds.; Forest Service, United States Department of Agriculture: Washington, DC, USA, 1990. [Google Scholar]
  64. Houle, D.; Moore, J.D.; Ouimet, R.; Marty, C. Tree species partition N uptake by soil depth in boreal forests. Ecology 2014, 95, 1127–1133. [Google Scholar] [CrossRef] [PubMed] [Green Version]
  65. Dufour, B.; Boucher, J.F.; Tremblay, P.; Mailly, D.; Lord, D. Black-spruce-lichen woodlands growth and carbon drawdown potentials as revealed by mature stands. Boreal Environ. Res. 2016, 21, 71–86. [Google Scholar]
  66. Ouimet, R.; Boucher, J.F.; Tremblay, P.; Lord, D. Comparing soil profiles of adjacent forest stands with contrasting tree densities: Lichen woodlands vs. black spruce-feathermoss stands in the continuous boreal forest. Can. J. Soil Sci. 2018, 98, 458–468. [Google Scholar] [CrossRef]
Figure 1. Location of the seven study sites in the province of Quebec, Canada.
Forests 12 00059 g001
Figure 2. Average biomass allocation to stems, branches, and needles for black spruce (n = 96) and jack pine (n = 50) trees (height >1.3 m) sampled in open woodlands of Quebec (measured) vs. predicted allocation by using the allometric equations developed by Lambert et al. (2005).
Forests 12 00059 g002
Figure 3. Roots (a,b), stem (c,d), branches (e,f), needles (g,h) and aboveground biomasses (i,j) (AGBM) predicted by the three models vs. measured values for black spruce (n = 96) and jack pine (n = 50) trees (height > 1.3 m) sampled in boreal open woodlands of Quebec.
Forests 12 00059 g003
Figure 4. Roots (a), stem (b), branches (c), needles (d) and aboveground biomasses (e) (AGBM) predicted by the three models vs. measured values for black spruce (n = 21) trees (height < 1.3 m) sampled in boreal open woodlands of Quebec.
Forests 12 00059 g004
Figure 5. Roots (a), stem (b), branches (c), needles (d) and aboveground biomasses (e) (AGBM) predicted by the three models vs. measured values for planted Jack pine (n = 21) trees sampled in boreal open woodlands of Quebec.
Forests 12 00059 g005
Figure 6. Relationships between shoot mass and root mass of black spruce (red circles) and jack pine (green circles) for (a) planted and (b) natural trees. *** indicates p < 0.001.
Forests 12 00059 g006
Figure 7. Estimates of carbon stocks (t C·ha−1) for each tree compartment (stems, needles, branches, roots), aboveground biomass (AGBM), and total tree biomass in OWs planted with black spruce (BS) and jack pine (JP) at a density of 2000 Table 1. Each value is the mean ± SD of seven sites (Figure 1).
Forests 12 00059 g007
Table 1. Characteristics of the sampled afforested open woodlands (OW), planted with black spruce (BS) and jack pine (JP) trees. For natural (i.e., not planted) trees, only with DBH over 9 cm were included. All values represent mean (± SE).
SitesPlantation Density (Stems ha−1)Planted Tree Mean Height (m)Natural Tree Density (Stems ha−1)Dominant Tree Mean Height (m)Dominant Tree Age (Years)
BSJPBSJP
49254750.41 ± 0.121.18 ± 0.561138.78 ± 0.8754
52758500.54 ± 0.141.69 ± 0.6713810.56 ± 1.4167
66257000.51 ± 0.121.31 ± 0.542008.94 ± 1.8359
9235019250.99 ± 0.402.85 ± 0.6505.92 ± 0.4732
11217521250.74 ± 0.292.3 ± 0.982758.32 ± 0.9558
15150016500.41 ± 0.141.37 ± 0.4950010.81 ± 0.3060
16187520000.58 ± 0.181.54 ± 0.4711311.2 ± 2.2062
Table 2. Comparison of fitting performances (R2 and AICc) of the three models for needles, branches, stem, roots and aboveground biomass (AGBM) in black spruce (n = 96) trees with height > 1.3 m. R2 and AICc values of the best model are shown in bold for each compartment.
Model 1Model 2Model 3
R2AICcR2AICcR2AICc
roots0.88580.89520.9150
stem0.941200.96840.9740
branches0.792220.812160.81215
needles0.742260.752210.76219
AGBM0.861740.881610.89152
Table 3. Comparison of fitting performances (R2 and AICc) of the three models for needles, branches, stem, roots and aboveground biomass (AGBM) in Jack pine (n = 50) trees with height > 1.3 m. R2 and AICc values of the best model are shown in bold for each compartment.
Model 1Model 2Model 3
R2AICcR2AICcR2AICc
roots0.92540.93480.9446
stem0.97470.98320.9825
branches0.95760.96740.9676
needles0.94550.94550.9457
AGBM0.96490.97410.9742
Table 4. Comparison of fitting performances (R2 and AICc) of the three models for needles, branches, stem, roots and aboveground biomass (AGBM) in black spruce (n = 21) trees with height < 1.3 m. R2 and AICc values of the best model are shown in bold for each compartment.
Model 1Model 2Model 3
R2AICcR2AICcR2AICc
roots0.91−1300.90−1270.92−129
stem0.95−1430.95−1450.95−142
branches0.94−1030.94−1050.94−102
needles0.87−1350.90−1400.91−140
AGBM0.93−780.94−810.94−78
Table 5. Comparison of fitting performances (R2 and AICc) of the three models for needles, branches, stem, roots and aboveground biomass (AGBM) in planted Jack pine (n = 28) trees. R2 and AICc values of the best model are shown in bold for each compartment.
Model 1Model 2Model 3
R2AICcR2AICcR2AICc
roots0.928.60.937.50.939.5
stem0.94−6.80.97−24.50.97−24.5
branches0.9212.90.938.70.9311.4
needles0.8811.70.8810.70.8813.1
AGBM0.95−8.70.96−18.40.96−15.7
Table 6. Selected equations for each tree compartment for black spruce and Jack pine trees with H > 1.3 m (n = 96 and 50, respectively), black spruce trees with H < 1.3 m (n = 21) and planted Jack pine trees (n = 28).
Black Spruce (H > 1.3 m)Jack Pine (H > 1.3 m)Black Spruce (H < 1.3 m)Jack Pine (Planted)
roots0.135 × DBH0.38 × H1.55 × 1.130.018 × DBH0.81 × H1.99 × 1.090.006 × DHS4.230.006 × (DHS2 × H)0.97 × 1.03
stem0.104 × DBH0.47 × H1.88 × 1.040.045 × DBH0.82 × H1.94 × 1.040.015 × (DHS2 × H)1.280.019 × (DHS2 × H)0.89 × 1.01
branches0.225 × DBH0.63 × H1.23 × 1.300.030 × (DBH2 × H)0.84 × 1.120.042 × (DHS2 × H)1.190.005 × (DHS2 × H)1.03 × 1.03
needles0.278 × DBH0.42 × H1.31 × 1.310.092 × (DBH2 × H)0.60 × 1.080.043 × DHS0.63 × H2.060.020 × (DHS2 × H)0.79 × 1.04
AGBM0.593 × DBH0.46 × H1.52 × 1.150.193 × (DBH2 × H)0.75 × 1.060.085 × (DHS2 × H)1.120.042 × (DHS2 × H)0.88 × 1.01
Table 7. The root:shoot ratio (RSr) of planted (n = 28 for BS and JP) and natural (n = 24 for BS and 8 for JP) trees and their minimum and maximum values. Results presented as mean ± SE.
Planted TreesNatural Trees
SpeciesRSrSEMin.Max.RSrSEMin.Max.
BS0.200.060.090.330.240.080.080.44
JP0.210.060.130.410.260.060.170.37
Publisher’s Note: MDPI stays neutral with regard to jurisdictional claims in published maps and institutional affiliations.

