Article

Using U-Net-Like Deep Convolutional Neural Networks for Precise Tree Recognition in Very High Resolution RGB (Red, Green, Blue) Satellite Images

1
Botanical Garden-Institute of the Far Eastern Branch of the Russian Academy of Science, 690024 Vladivostok, Russia
2
Institute of Botany, Czech Academy of Sciences, 252 43 Průhonice, Czech Republic
*
Author to whom correspondence should be addressed.
Forests 2021, 12(1), 66; https://doi.org/10.3390/f12010066
Submission received: 4 December 2020 / Revised: 2 January 2021 / Accepted: 4 January 2021 / Published: 8 January 2021
(This article belongs to the Special Issue Remote Sensing Applications in Forests Inventory and Management)

Abstract

:
Very high resolution satellite imageries provide an excellent foundation for precise mapping of plant communities and even single plants. We aim to perform individual tree recognition on the basis of very high resolution RGB (red, green, blue) satellite images using deep learning approaches for northern temperate mixed forests in the Primorsky Region of the Russian Far East. We used a pansharpened satellite RGB image by GeoEye-1 with a spatial resolution of 0.46 m/pixel, obtained in late April 2019. We parametrized the standard U-Net convolutional neural network (CNN) and trained it in manually delineated satellite images to solve the satellite image segmentation problem. For comparison purposes, we also applied standard pixel-based classification algorithms, such as random forest, k-nearest neighbor classifier, naive Bayes classifier, and quadratic discrimination. Pattern-specific features based on grey level co-occurrence matrices (GLCM) were computed to improve the recognition ability of standard machine learning methods. The U-Net-like CNN allowed us to obtain precise recognition of Mongolian poplar (Populus suaveolens Fisch. ex Loudon s.l.) and evergreen coniferous trees (Abies holophylla Maxim., Pinus koraiensis Siebold & Zucc.). We were able to distinguish species belonging to either poplar or coniferous groups but were unable to separate species within the same group (i.e. A. holophylla and P. koraiensis were not distinguishable). The accuracy of recognition was estimated by several metrics and exceeded values obtained for standard machine learning approaches. In contrast to pixel-based recognition algorithms, the U-Net-like CNN does not lead to an increase in false-positive decisions when facing green-colored objects that are similar to trees. By means of U-Net-like CNN, we obtained a mean accuracy score of up to 0.96 in our computational experiments. The U-Net-like CNN recognizes tree crowns not as a set of pixels with known RGB intensities but as spatial objects with a specific geometry and pattern. This CNN’s specific feature excludes misclassifications related to objects of similar colors as objects of interest. We highlight that utilization of satellite images obtained within the suitable phenological season is of high importance for successful tree recognition. The suitability of the phenological season is conceptualized as a group of conditions providing highlighting objects of interest over other components of vegetation cover. In our case, the use of satellite images captured in mid-spring allowed us to recognize evergreen fir and pine trees as the first class of objects (“conifers”) and poplars as the second class, which were in a leafless state among other deciduous tree species.

1. Introduction

Fast and precise recognition of tree species in forest stands is a challenging perspective direction for the application of remote sensing methods. Ground-based research yields accurate results, but it is costly and often difficult to carry out. Satellite systems are increasingly used in forest science and provide a better understanding of forests’ spatial structures. In the past decades, satellite and airborne imageries of very high resolution (VHR) (<1 m/pixel) were extensively used for vegetation objects recognition [1].
To date, a large number of free VHR RGB (red, green, blue) satellite images are available. Moreover, VHR images taken from unmanned aerial vehicles (UAVs) of various vegetation types have been collected and used in vegetation studies. These include, but are not limited to, vegetation mapping [2,3,4] or recognition of damaged forest sites [4,5,6,7,8]. VHR space- and airborne images make it possible to recognize individual plants with relatively large linear sizes, e.g., tree crowns [9,10,11,12,13,14,15,16,17]. Recognition accuracy in such studies significantly depends on the test images used for metrics computation. In general, it is possible to achieve accuracy values up to 0.93 [5] and 0.94 [8] in the case of detecting damaged forest areas, and at least 0.84 in the case of species mapping [3].
The rapid development of deep learning (DL) methods, such as convolutional neural networks (CNNs), opens up wide opportunities for using RGB (red, green, blue) imagery in ecology [18,19,20]. Traditional machine learning (ML) methods and object recognition approaches, relying on the colors and brightness of single pixels belonging to the objects of interest (which falls not only in the visible spectrum), are widely used when analyzing multispectral space- and airborne images obtained from different sources of remote sensing data [21,22,23,24]. Exploiting near-red channels provides enough information to separate trees from other ground-based patterns/objects. However, it is not always possible to use multispectral imagery, and in this instance, the deep learning approach becomes efficient because deep neural networks are able to recognize specific patterns in RGB images and learn the context surrounding the object of interest.
Internally, CNNs process images by mapping a pixel and its neighbors into a relatively small set of features. These features are further processed into a class label or a probability-like value, which can be interpreted as a measure for the pixel to belong to the area of interest. The ability to account neighborhood pixel values, and thus correlations between pixels and even groups of pixels (which could be called patterns), is the main advantage of a deep learning approach over pixel-based algorithms. All these methods are able to process an arbitrary number of spectral bands at a time, but CNNs could learn patterns and context [3]. Along with incredible learning capacity, this feature of neural networks significantly enriches image processing methodology and is a major contributor to modern computer vision approaches in general. In addition to the usefulness of CNNs in forest science, several methodological issues still need to be addressed.
Comparison of DL and standard ML methods followed by applying specific feature engineering techniques, such as grey level co-occurrence matrices (GLCM), is not new [25]. There are many applied problems that can be solved by traditional ML algorithms, which have accuracy scores comparable to those obtained by DL approaches [26]. However, there are gaps in research related to the problem of tree species recognition, especially cases connected to employing pansharpened RGB satellite imagery. To fill this gap, we conducted a comparison study of the DL approach and shallow ML methods [27] with an extended set of pattern-specific features obtained by means of a GLCM-approach. We also investigate new possible uses for CNNs and describe a methodology that can be easily extended to other temperate or boreal forests.
In this paper, we aimed to demonstrate how the problem of precise recognition of a group of two coniferous evergreen species (Abies holophylla Maxim., Pinus koraiensis Siebold & Zucc.) and one deciduous broadleaf species (Populus suaveolens Fisch. ex Loudon s.l.) could be handled by means of CNN trained in RGB pansharpened satellite imagery acquired during the spring period before full leaf flushing.

2. Materials and Methods

2.1. Study Site and Objects

The study area is located in the vicinity of Vladivostok (44.17° N 131.99° E), the north temperate mixed forest zone (Figure 1) [28]. Two evergreen coniferous trees, Manchurian fir (Abies holophylla) and Korean pine (Pinus korainesis), are key species forming a tree canopy in the primary forest along with deciduous broadleaf tree species (Betula costata Trautv., Fraxinus mandshurica Rupr., Juglans mandshurica Maxim., Kalopanax septemlobus (Thunb.) Koidz., Phellodendron amurense Rupr., Tilia amurensis Rupr., and Quercus mongolica Fisch. ex Ledeb.). These forests can usually be stratified into three layers. The tree layer normally includes three sublayers, formed by species of different growth forms and life strategies. Their usual height is 25–35 m, but on rich sites, P. koraiensis and A. holophylla can reach 45 m, exceeding the height of all other canopy trees and forming a sparse cover above the canopy. The development of this middle tree layer is determined mainly by the gap structure of the canopy and by site parameters such as soil nutrient and moisture regimes, slope aspect and steepness, etc. [28]. Mongolian poplar (Populus suaveolens s.l.) is a common tree species in the local primary forest. Single poplars and groups of trees usually grow on mountain slope habitats and prefer moist soil areas with groundwater flows but more often form riparian forests across their distribution range [29,30]. Important structural features of this community are (1) that the assimilation organs of different species are located vertically throughout the entire forest profile and (2) that trees of some species form clumps of different sizes, caused by both gap dynamics and competition for light [28].
In the past, this type of forests occupied the southern part of the Primorsky region [31,32]. Due to intensive logging and fires, forests with Abies holophylla and Pinus korainesis remain undamaged in negligible areas only. Frequent fires alter site conditions and lead to the formation of secondary forests dominated by Quercus mongolica and Betula dahurica Pall. with a shrub layer of Lespedeza bicolor Turcz. [33].

2.2. Remote Data

We used pansharpened VHR satellite RGB images obtained from the GeoEye-1 satellite system (https://earth.esa.int/web/eoportal/satellite-missions/g/geoeye-1, accessed on 1 December 2020). These images had a resolution of 0.46 m/pixel and were captured on 28 April 2019 (ID number 1050010015D4FE00). The satellite snapshot covered the vicinity of Vladivostok city (parts of the Muravyov-Amursky Peninsula and Russky Island) and had a land surface area of 243 km2 in total, including a forested area of approximately 175 km2 (Figure 1).
The resolution of satellite imagery does not provide enough information to tell trees of Abies holophylla and Pinus koraiensis apart. Thus, we coupled these two species into one group called “coniferous trees”. Late April 2019, the season in which the snapshot we used was taken, was appropriate for the recognition of these two evergreen species since deciduous trees had not developed leaves, with the exception of Populus suaveolens (Table A1). This allowed us to perform recognition of P. suaveolens. In the second half of April, a few shrub and undergrowth species along with small trees like Prunus padus L. and Sambucus racemosa L. may have green leaves. However, when grown under a forest canopy and therefore covered with the leafless branches of larger trees, they could not be identified by the satellite data we had. The same applies to an undergrowth of coniferous species. In this work, we deliberately limited ourselves to forested areas, because in urbanized areas there could be non-native ornamental evergreen trees and shrubs that started early leaf flushing.

2.3. Image Preparation

Originally, pansharpened satellite images were provided without special atmospheric corrections and encoded in RGB-colorspace. For training purposes, we used five cropped images of different sizes with a resolution of up to 2560 × 2560 pixels (approx. 1 × 1 km on the Earth’s surface). Thus, RGB images had shape (w, h, 3), where w and h are the number of pixels per width and height, respectively, and 3 is the number of image channels.
These images were manually delineated to distinguish pixels belonging to poplars and coniferous tree classes. Results of such delineation were saved as two separate binary (mask) images. Mask images differed only in the number of channels (which was equal to 1). Each segmentation class had its own mask image; in the CNN training step, these images were stacked into the 2-channel image, i.e., the mask used in the training process had the shape (w, h, 2).
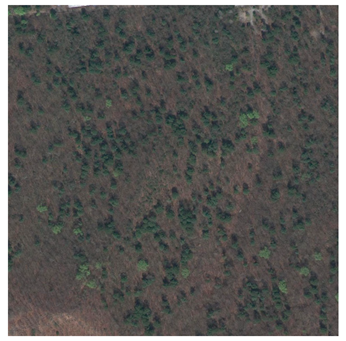
Training data were generated in batches of size (10, 256, 256, 3) for RGB images and (10, 256, 256, 2) for corresponding mask images. The batches consisted of sub-images of 256 × 256 pixels that were randomly cropped out from the original satellite images chosen for the algorithm training (Table A2). Internally, we used a Python generator, which produces a stream of cropped images: in the case of the training stage, these images were allowed to overlap, and in the case of validation and testing stages, images included in the same batch were guaranteed not to overlap. Source satellite snapshots used for training, validation and testing are presented in Table A2.
Each image within the batch was subjected to augmentation. Augmentation is an important part of the training process that deals with the problem of overfitting [34]. The original satellite image was obtained in different atmospheric conditions and has slightly different values of saturation, so we decided to use a specific augmentation technique to expand the number of training images and thereby improve network performance. As an augmentation transformation, we chose random changes to the RGB channels of the original images and random vertical and horizontal flips. Random changes for each RGB channel did not exceed 0.1 by absolute value and were applied simultaneously to all channels, as they are implemented in the utility function “apply_channel_shift” from the Keras package [35]. Random flips provided additional variability to images used for training and reduced overfitting. We also considered using small, random rotations in the augmentation pipeline. However, adding rotations did not improve the network performance and we excluded such transformations from the augmentation. It should be noted that we did not use random shifts in the augmentation procedure at all. Such transformations would be redundant, since sub-images were cropped from a fixed set of satellite images and often intersected with each other. Therefore, overlapped images could be considered as they were spatially shifted.
Using a batch size of 10 and typically performing up to 1500 iterations for training the network, we exploited almost 15,000 different augmented images of 256 × 256 pixels. The number of poplar and conifers patterns used for training were 34 and 401, respectively; for validation, we had 18 poplar and 171 conifers patterns, and for test, we used 8 and 53 patterns for poplars and conifers, respectively.

2.4. CNN Design

To date, a lot of deep neural network architectures have been proposed to handle image segmentation problems [36]. Among them, we chose the U-Net-like deep convolutional network architecture proposed [37]. Based on the results of the search for the best DCNN architecture conducted in previous studies [3,8,15], we started our investigations with the U-Net-like CNN architecture presented in Figure 2. The best one was selected among possible variants of the neural network architecture that were determined by two parameters: dropout ratio and batchnorm. The dropout ratio was selected from (0.1, 0.25, 0.5) and the batchnorm parameter was either “True” or “False”. Finally, based on a grid-search study, we concluded that the best U-Net-like architecture is characterized by a dropout ratio of 0.25 and includes batch normalization layers in their blocks.
In the context of CNN architecture (Figure 2), central blocks are presented by convolutional (Conv2D) and deconvolutional (Deconv2D) operations. Convolution involves the multiplication of a set of weights with the input presented by RGB intensities: a window of specified size, called the kernel, slides over the input image, and multiplication is performed between an array of input data within the window and a two-dimensional array of weights. Finally, values obtained for each sliding window position are stored as two-dimensional output arrays. Therefore, the output two-dimensional arrays have smaller sizes (width and height) than the original image. Deconvolution is the reverse operation: it is applied in almost the same way but increases the sizes of the input arrays. Detailed information about the blocks used for building deep CNNs is given in [38].

2.5. Comparison with Standard ML Methods

To assess the performance of the U-Net-like CNN, we conducted a comparative study with several traditional ML methods. Such methods do not take into account neighboring pixels relative to the pixel being classified at a given moment. Thus, as we might expect, these methods should perform less well than those that take into account correlations between pixels.
In this respect, we considered the following algorithms that have been widely used to solve various supervised learning problems: (1) Naive Bayes classifier, GaussianNB [39]; (2) quadratic discriminant analysis, QDA [40]; (3) k-nearest neighbors classifier, KNN [41]; (4) adaptive boosting classifier, Adaboost [42]; and (5) random forest classifier, RandomForest [43]. We used the default implementation of these algorithms as expressed in the Scikit-learn package [44].
Since tree crowns have a specific pattern, we considered the case of appending grey level co-occurrence matrices (GLCM)-based features [45] to standard RGB ones to take into account pattern-specific features. GLCM features were computed with different sets of angles and distances; standard cumulative properties, such as “dissimilarity”, “correlation”, “homogeneity”, “contrast”, and “energy”, were used [46]. We performed accuracy estimations for standard ML methods applied to an extended set of features obtained via the GLCM approach. We considered the following parameters for GLCM features computation: angles = (0°, 30°, 60°), distances = (3, 5, 7), and different values of the window surrounding the pixel where GLCM features are computed: patch size = (3, 5, 10, 30). Distances and patch size are given in pixels. All possible combinations of angles and distances were investigated for different values of the patch size parameter.
To evaluate the segmentation accuracy, we used three score metrics that were computed on a pixel-wise basis. These are the mean balanced accuracy score, denoted as BA; mean F1 score, denoted as F1 score [44]; and mean intersection over union score, denoted as Mean IoU [47]. The term “mean” for each score metric means that the final value was computed as a weighted average of the score metric values evaluated for each class. There were three classes of pixels: (1) pixels belonging to poplar trees, (2) pixels belonging to coniferous trees (2), and (3) pixels belonging to the background. The latter does not belong to either (1) or (2). Thus, if we denote the score metric function as F ( y t r u e , y p r e d ) , then its “mean” value will be computed as follows:
M e a n F = N 1 N × F ( y t r u e 1 , y p r e d 1 ) + N 2 N × F ( y t r u e 2 , y p r e d 2 ) + N 3 N × F ( y t r u e 3 , y p r e d 3 )
where Ni—the number of pixels belonging to the i-th class respectively; y_truei, y_predi—exact values and predicted values for a pixel to belong to the i-th class; and N—the number of pixels in the image.
Corresponding formulae for the score metrics were defined as follows:
BA:
F ( y t r u e , y p r e d ) = T P + T N T P + T N + F P + F N ,
F1:
F ( y t r u e , y p r e d ) = 2 × P × R P + R , P = T P T P + F P , R = T P T P + F N ,
IoU:
F ( y t r u e , y p r e d ) = T P T P + F P + F N ,
where TP, TN, FP, FN are the numbers of true positive, true negative, false positive and false negative cases computed on ( y t r u e , y p r e d ) , respectively.
The two edge cases are possible for the value of Mean F in Formula (1) if Mean F is equal to 1, which means the prediction is completely correct, and when Mean F is equal to 0, which means the prediction is completely incorrect (not one of the pixels belonging to the image was correctly classified by the algorithm).
It is possible to interpret outputs of most image segmentation algorithms as probabilities of a pixel belonging to the segmented area. This approach provides a common strategy for turning a map of probabilities into a binary mask by specifying a threshold value. If the probability value in the current pixel is greater than the threshold, the pixel is assumed to belong to the area of interest; otherwise, it is not. Thus, the problem of finding the optimal value of the threshold can be formulated for each combination of a particular algorithm and score metric. Such optimal threshold values we will referred to as the best threshold values. In the case of two classes of interest, conifers and poplars, there are two corresponding optimal threshold values for each algorithm and score metric.

3. Results

The U-Net-like CNN has proven efficacy in recognizing coniferous and poplar trees. It shows higher accuracy metrics than traditional pixel-based supervised learning algorithms (Table 1). Even though pixel-based algorithms (e.g., KNN) have shown satisfactory results, they are influenced by false positive decisions. Nevertheless, the KNN algorithm was able to the handle poplar recognition, although pixels belonging to the peripheral parts of tree crowns were incorrectly classified as if they belonged to the coniferous tree class. The use of the U-Net-like CNN does not lead to such artifacts (Figure 3).
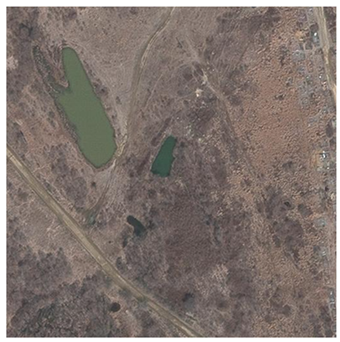
Results of the algorithm performance assessment shown in Table 1 are given for the test data (Table A1, test images: test1, test2). An interesting case is illustrated in Figure 4. The image includes the water surfaces of two ponds with the same RGB composition as the coniferous and poplars crowns. In this case, the U-Net-like CNN does not lead to a reduction in performance due to an increase in false positive decisions, as pixel-based algorithms do.
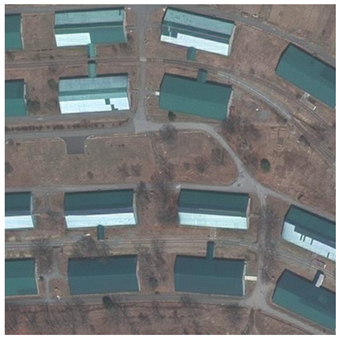
It is worth noting that a significant difference between score metric values obtained for pixel-based and deep-learning approaches is observed when test data include the image with two ponds or other objects with patterns similar in color to the tree crowns. Such cases allow U-Net-like CNN to demonstrate pattern-specific sensitivity, which pixel-based methods do not have. To train the CNN for a specific pattern, it is important to show network patterns similar to the objects/areas of interest but not belonging to them. This allows the network to catch the specificity of the pattern of interest, and this is why we included the image with green roofs in the training data (Table A2, train3).
If we compared U-Net-like CNN and pixel-based methods in relatively simple images where poplar and coniferous trees could be easily recognized by color, we would obtain comparable score metrics for shallow ML and deep learning approaches. Therefore, the main advantage of U-Net-like CNN over shallow ML pixel-based methods is the ability to reduce the number of false-positive cases that can occur from objects having a similar color composition to the objects of interest. Figure 4 demonstrates this phenomenon well: U-Net-like CNN does not highlight areas that were highlighted in error by other approaches.
The results of binary prediction in the training and validation satellite image areas are shown in Figure 5. It should be noted that groups of trees with overlapping crowns are not properly recognized as separate objects. Since the latter is due to the specificity of the problem statement, we considered only image segmentation problems and did not distinguish objects on corresponding masks. In general, Figure 5 demonstrates that trained CNN yielded good results on both train and test datasets and is therefore well-fitted.
The best results of ML methods with feature engineering are presented in Table 2. The values presented in Table 2 correspond to the best GLCM feature set among all possible combinations of features described in Section 2.2. So, if KNN shows that Mean BA = 0.89, it means that it is the best achievable metric value among all the combinations of GLCM features stated above.
Therefore, appending GLCM features to a standard set of RGB intensities can slightly improve final accuracies; however, these improvements are very minor. In comparison with the DL approach, GLCM-based methods still lose to the latter not only in accuracy but also because GLCM requires feature engineering steps to be conducted.

4. Discussion

Our study was initially focused on the use of free-for-all RGB satellite high resolution images only. Optical RGB channels of VHR satellite images carry enough information to solve problems related to the study of plants’ spatial distribution. Gaining access to VHR multispectral images usually requires significant financial payments. Therefore, the availability of a large number of VHR satellite images of the visual spectrum that are freely accessible for non-commercial use becomes another crucial point in conducting studies based on RGB images only.
The use of U-Net-like CNN for tree recognition with VHR satellite imagery has proven its efficacy and significantly surpassed traditional pixel-based recognition techniques. The images taken in the spring have shown that evergreen conifers and deciduous poplars differ from each other and are easily recognizable on contrasting backgrounds and partially leafless canopies. Knowledge of the local terrain and the peculiarities of plant phenology provide a better basis for solving recognition problems similar to the considered one [22]. Parameters such as the beginning of the growing season, flowering and leaf color change before defoliation can be used to solve problems of tree species recognition. In most cases, knowledge of local vegetation can be a crucial point for the accuracy of results and interpretations.
The problem associated with processing satellite imagery for trees recognition is not only a technical one. The development of successful approaches for its solution depends on further information about objects to be recognized. For instance, we have previously documented that delayed leaf flowering in the mountains could confuse windthrow detection algorithms because subalpine forest sites composed of birch trees in the leafless state look similar to windthrow patches [8]. Such sources of false-positive cases could be ruled out by including additional information in the recognition process, such as data obtained during field surveys. We conclude that remote sensing data will also be widely used in environmental sciences, but the technical aspect of these studies should not hide issues associated with interpretations of specific problems. Such botany-specific issues require the attraction of experienced botanists in the study process, which could significantly correct training and validation datasets and outline the limitations of the recognition algorithm.
Using RGB imagery and DCNNs, we showed the successful separation of poplars and conifers. This approach is performant and forthcoming in a variety of applied problems in forest science and management. Wagner et al. [15] estimated disturbance levels in Brazilian Atlantic rainforests from satellite images by recognition of Cecropia hololeuca trees using U-Net. Cecropia trees can be used to accurately date disturbances in secondary forests and its abundance is related to disturbance intensity. A similar approach to estimate the forest cover degradation level is also possible by recognizing and counting species of primary forests. For the forests of our study area, such tree-markers are coniferous species Abies holophylla and Pinus koraiensis. Similar marker species of pioneer and secondary forests that are easily recognizable on very-high resolution satellite images can be found for other forest regions. Altman [48] wrote that the combination of growth-release detection (the abrupt radial growth increase in trees as a reaction to improved light conditions after the disturbed canopy) and high-resolution data from remote sensing has large potential in the calibration of methods of growth-release detection. Such knowledge will bring new and improve existing information to the understanding of forest structure, ecology, and dynamics.
Brodrick et al. [19] pointed out that CNNs demonstrate high efficacy in the recognition of the biophysical components of satellite imagery of a high resolution: “CNN accuracy is similar to human-level classification accuracy, but is consistent and fast, enabling rapid application over very large areas and/or through time.” Kattenborn et al. [3] considered U-Net for recognition species in UAV-based high-resolution RGB imagery and obtained accuracy exceeding 0.84 for Pinus radiata and 0.87 for Ulex europaeus in computational experiments. Wagner et al. [15] showed promising recognition accuracy of 0.80 for Cecropia hololeuca. In our computational experiments, we achieved much greater accuracy scores. This difference in accuracies was caused by the specificity of the problem: we had green and light-green tree crowns and a relatively simple background on our satellite images. The main sources of false positive decisions were roofs and ponds. Our study is in accordance with other research and confirms that properly trained DCNN models work at the same level of accuracy as expert-based techniques do. Nevertheless, it is worth noting that obtained score metric values significantly depend on test images. Improperly chosen test images can lead to very promising results that, in turn, tend to decrease if images include patterns similar to those that the objects of interest have.
Braga et al. [16] considered recognition of tree crowns using deep learning as an instance segmentation problem. The instance segmentation problem allows the coordinates of all recognized objects on the image to be obtained. It differs from the semantic segmentation considered in our study. However, in the case of non-overlapped tree crowns, semantic segmentation can easily be expanded to instance segmentation by finding all separated islands based on pixels connectivity.
The proposed U-Net-like CNN model is essentially one of the many DCNN models that prove their efficacy in image segmentation. It could be useful for object/area segmentation in various fields of environmental science. However, the problem of extending the model to other regions and different segmentation tasks requires building a set of training images covering most of the peculiarities that have occurred in the region being studied.
The growing number of studies focusing on the use of CNN for the recognition of vegetation, object-plant communities and individual plants suggests that CNN will likely become one of the most effective methods of vegetation recognition. In this respect, it seems very important consider to idea concerning the creation of digital databases with air- and spaceborne images of different plant species or entire plant communities (e.g., forest types) obtained by different remote sensing methods [4]. These databases may include CNN architectures and their weights. It is expected that using ready-made neural networks (i.e., exploiting transfer learning methodology) to separate various objects and solve image segmentation problems will be much easier than training the model from scratch. For the general purpose of image segmentation, such databases, including pre-built neural network architectures, already exist. These are usually provided as parts of deep-learning frameworks e.g., PyTorch [49].

5. Conclusions

In this study, we have demonstrated an example of the use of the DL algorithm, relying on the proposed U-Net-like CNN architecture for the recognition of particular tree species in high-resolution RGB satellite images. We showed that traditional pixel-based ML approaches are influenced by false-positive decisions when objects captured in satellite images have the same color composition as tree crowns. Appending GLCM-based features to standard RGB data requires an additional feature engineering study to be conducted and does not lead to significant improvements in accuracy. Nevertheless, the U-Net-like CNN, which can learn from patterns, is free of such flaws. The proposed methodology, based on the use of the U-Net-like CNN architecture and satellite imagery captured in a specific vegetation season, is therefore (1) an effective approach for tree crown recognition in pansharpened VHR satellite images; (2) outperforms pixel-based and GLCM-based ML approaches; and (3) may still be affected by false-positive errors, especially in the case of objects that have similar patterns to the objects of recognition.

Author Contributions

Conceptualization, K.A.K.; methodology, K.A.K. and D.E.K.; software, D.E.K.; formal analysis, D.E.K.; investigation, K.A.K., D.E.K., J.A., J.D. and A.S.V.; resources, K.A.K. and D.E.K.; data curation, K.A.K. and D.E.K.; writing—original draft preparation, K.A.K. and D.E.K.; writing—review and editing, J.A., J.D., A.S.V. and P.V.K.; visualization, K.A.K., D.E.K. and J.A.; project administration, P.V.K. All authors have read and agreed to the published version of the manuscript.

Funding

This research received no external funding.

Informed Consent Statement

Not applicable.

Data Availability Statement

The data presented in this study are available on request from the corresponding author.

Conflicts of Interest

The authors declare no conflict of interest.

Appendix A

Table A1. Common dates of emergence of leaves (full leaf) on main deciduous tree species*.
SpeciesDate 1
Betula costata Trautv.18 May
Fraxinus mandshurica Rupr.21 May
Juglans mandshurica Maxim.17 May
Kalopanax septemlobus (Thunb.) Koidz.20 May
Phellodendron amurense Rupr.26 May
Populus suaveolens Fisch. ex Loudon5 May
Tilia amurensis Rupr.16 May
Quercus mongolica Fisch. ex Ledeb.14 May
1 According to monograph: Tsymek, A.A. Hardwoods of the Far East, ways of their use and reproduction. Khabarovskoe knizhnoe izdatelstvo: Khabarovsk, USSR, 1956. (Russian). It should be noted, that climate change lead to more early leafing compared to mid-20th century.

Appendix B

Table A2. Images used for the U-Net-like CNN train, test and validation.
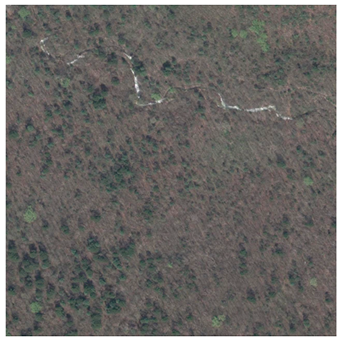
Image Name; Image Size (Pixels); Main ObjectsImage Preview
train 1;
1280 × 1280;
conifers, poplars, and deciduous leafless trees
Forests 12 00066 i001
train 2;
1280 × 1280;
water surface, bare ground, conifers, poplars, and deciduous leafless trees
Forests 12 00066 i002
train 3;
512 × 512;
roofs, roads, bare ground, conifers and deciduous leafless trees
Forests 12 00066 i003
test1;
1280 × 1280;
conifers, poplars, and deciduous trees
Forests 12 00066 i004
test2;
512 × 512;
ponds, deciduous leafless trees, bare ground
Forests 12 00066 i005
validation;
1280 × 1280;
conifers, poplars, and deciduous leafless trees
Forests 12 00066 i006

References

  1. Ma, L.; Liu, Y.; Zhang, X.; Ye, Y.; Yin, G.; Johnson, B.A. Deep learning in remote sensing applications: A meta-analysis and review. ISPRS J. Photogramm. 2019, 152, 166–177. [Google Scholar] [CrossRef]
  2. Komárek, J.; Klouček, T.; Prošek, J. The potential of unmanned aerial systems: A tool towards precision classification of hard to-distinguish vegetation types? Int. J. Appl. Earth Obs. 2018, 71, 9–19. [Google Scholar] [CrossRef]
  3. Kattenborn, T.; Eichel, J.; Fassnacht, F.E. Convolutional neural networks enable efficient, accurate and fine-grained segmentation of plant species and communities from high-resolution UAV imagery. Sci. Rep. 2019, 9, 17656. [Google Scholar] [CrossRef] [PubMed]
  4. Kattenborn, T.; Eichel, J.; Wiser, S.; Burrows, L.; Fassnacht, F.E.; Schmidtlein, S. Convolutional neural networks accurately predict cover fractions of plant species and communities in unmanned aerial vehicle imagery. Remote Sens. Ecol. Conserv. 2020, 5, 472–486. [Google Scholar] [CrossRef] [Green Version]
  5. Hamdi, Z.M.; Brandmeier, M.; Straub, C. Forest damage assessment using deep learning on high resolution remote sensing data. Remote Sens. 2019, 11, 1976. [Google Scholar] [CrossRef] [Green Version]
  6. Safonova, A.; Tabik, S.; Alcaraz-Segura, D.; Rubtsov, A.; Maglinets, Y.; Herrera, F. Detection of fir trees (Abies sibirica) damaged by the bark beetle in unmanned aerial vehicle images with deep learning. Remote Sens. 2019, 11, 643. [Google Scholar] [CrossRef] [Green Version]
  7. Sylvian, J.-D.; Drolet, G.; Brown, N. Mapping dead forest cover using a deep convolutional neural network and digital aerial photography. ISPRS J. Photogramm. 2019, 156, 14–26. [Google Scholar] [CrossRef]
  8. Kislov, D.E.; Korznikov, K.A. Automatic windthrow detection using very-high-resolution satellite imagery and deep learning. Remote Sens. 2020, 12, 1145. [Google Scholar] [CrossRef] [Green Version]
  9. Li, W.; Fu, H.; Yu, L.; Cracknell, A. Deep learning based oil palm tree detection and counting for high-resolution remote sensing images. Remote Sens. 2017, 9, 22. [Google Scholar] [CrossRef] [Green Version]
  10. Csillik, O.; Cherbini, J.; Johnson, R.; Lyons, A.; Kelly, M. Identification of citrus trees from unmanned aerial vehicle imagery using convolutional neural networks. Drones 2018, 2, 39. [Google Scholar] [CrossRef] [Green Version]
  11. Morales, G.; Kemper, G.; Sevillano, G.; Arteaga, D.; Ortega, I.; Telles, J. Automatic segmentation of Mauritia flexuosa in unmanned aerial vehicle (UAV) imagery using deep learning. Forests 2018, 9, 736. [Google Scholar] [CrossRef] [Green Version]
  12. Fricker, G.A.; Ventura, J.D.; Wolf, J.A.; North, M.P.; Davis, F.W.; Franklin, J. A convolutional neural network classifier identifies tree species in mixed-conifer forest from hyperspectral imagery. Remote Sens. 2019, 11, 2326. [Google Scholar] [CrossRef] [Green Version]
  13. Kattenborn, T.; Lopatin, J.; Förster, M.; Braun, A.C.; Fassnacht, F.E. UAV data as alternative to field sampling to map woody invasive species based on combined Sentinel-1 and Sentinel-2 data. Remote Sens. Environ. 2019, 227, 61–73. [Google Scholar] [CrossRef]
  14. Santos, A.A.; Marcato Junior, J.; Araújo, M.S.; Di Martini, D.R.; Tetila, E.C.; Siqueira, H.L.; Aoki, C.; Eltner, A.; Matsubara, E.T.; Pistori, H.; et al. Assessment of CNN-based methods for individual tree detection on images captured by RGB cameras attached to UAVs. Sensors 2019, 19, 3595. [Google Scholar] [CrossRef] [PubMed] [Green Version]
  15. Wagner, F.H.; Sanchez, A.; Tarabalka, Y.; Lotte, R.G.; Ferreira, M.P.; Aidar, M.P.M.; Phillips, O.L.; Aragao, L.E.O.C. Using the U-Net convolutional network to map forest types and disturbance in the Atlantic rainforest with very high resolution images. Remote Sens. Ecol. Conserv. 2019, 5, 360–375. [Google Scholar] [CrossRef] [Green Version]
  16. Braga, J.R.G.; Peripato, V.; Dalagnol, R.; Ferreira, M.P.; Tarabalka, Y.; Aragão, L.E.O.C.; de Campos Velho, H.F.; Shiguemori, E.H.; Wagner, F.H. Tree Crown Delineation Algorithm Based on a Convolutional Neural Network. Remote Sens. 2020, 12, 1288. [Google Scholar] [CrossRef] [Green Version]
  17. Ferreira, M.P.; de Almeida, D.R.A.; de Almeida Papa, D.; Minervino, J.B.S.; Veras, H.F.P.; Formighieri, A.; Santos, C.A.N.; Ferreira, M.A.D.; Figueiredo, E.O.; Ferreira, E.J.L. Individual tree detection and species classification of Amazonian palms using UAV images and deep learning. For. Ecol. Manag. 2020, 475, 118397. [Google Scholar] [CrossRef]
  18. Wäldchen, J.; Mäder, P. Machine learning for image based species identification. Methods Ecol. Evol. 2018, 9, 2216–2225. [Google Scholar] [CrossRef]
  19. Brodrick, P.G.; Davies, A.B.; Asner, G.P. Uncovering ecological patterns with convolutional neural networks. Trends Ecol. Evol. 2019, 34, 734–745. [Google Scholar] [CrossRef]
  20. Christin, S.; Hervet, E.; Lecomte, N. Applications for deep learning in ecology. Methods Ecol. Evol. 2019, 10, 1632–1644. [Google Scholar] [CrossRef]
  21. Yu, Q.; Gong, P.; Clinton, N.; Bigin, G.; Kelly, M.; Schirokauer, D. Object-based detailed vegetation classification with airborne high spatial resolution remote sensing imagery. Photogramm. Eng. Remote Sens. 2006, 7, 799–811. [Google Scholar] [CrossRef] [Green Version]
  22. Hill, R.A.; Wilson, A.K.; Hinsley, S.A. Mapping tree species in temperate deciduous woodland using time-series multi-spectral data. Appl. Veg. Sci. 2010, 13, 86–99. [Google Scholar] [CrossRef]
  23. He, Y.; Yang, J.; Caspersen, J.; Jones, T. An operational workflow of deciduous-dominated forest species classification: Crown delineation, gap elimination, and object-based classification. Remote Sens. 2019, 11, 2078. [Google Scholar] [CrossRef] [Green Version]
  24. Räsänen, A.; Juutinen, S.; Tuittila, E.; Aurela, M.; Virtanen, T. Comparing ultra-high spatial resolution remote-sensing methods in mapping peatland vegetation. J. Veg. Sci. 2019, 30, 1016–1026. [Google Scholar] [CrossRef]
  25. Alhindi, T.J.; Kalra, S.; Ng, K.H.; Afrin, A.; Tizhoosh, H.R. Comparing LBP, HOG and deep features for classification of histopathology images. arXiv 2018, arXiv:1805.05837v1. [Google Scholar]
  26. Lee, S.Y.; Tama, B.A.; Moon, S.J.; Lee, S. Steel surface defect diagnostics using deep convolutional neural network and class activation map. Appl. Sci. 2019, 9, 5449. [Google Scholar] [CrossRef] [Green Version]
  27. Sucheta, C.; Lovekesh, V.; De Filippo De Grazia, M.; Maurizio, C.; Shandar, A.; Marco, Z.A. Comparison of shallow and deep learning methods for predicting cognitive performance of stroke patients from MRI lesion images. Front. Neuroinform. 2019, 13, 53. [Google Scholar] [CrossRef] [Green Version]
  28. Krestov, P.V. Forest Vegetation of Easternmost Russia (Russian Far East). In Forest Vegetation of Northeast Asia; Kolbek, J., Srutek, M., Box, E.E.O., Eds.; Springer: Dordrecht, The Netherlands; pp. 93–180. [CrossRef]
  29. Miyawaki, A. Vegetation of Japan; Shibundo: Tokyo, Japan, 1988; Volume 9, (Japanese, with German and English synopsis). [Google Scholar]
  30. Korznikov, K.A.; Popova, K.B. Floodplain tall-herb forests on Sakhalin Island (class Salicetea sachalinensis Ohba 1973) (Russian). Rastitel’nost’ Rossii 2018, 33, 66–91. [Google Scholar] [CrossRef]
  31. Kolesnikov, B.P. Korean Cedar Forests of the Far East; Izdatelstvo Akademii Nauk SSSR: Moscow, Leningrad, Russia, 1956. (In Rsussian) [Google Scholar]
  32. Vasil’ev, N.G.; Kolesnikov, B.P. Blackfir-Broadleaved Forests of the South Primorye; Izdatelstvo Akademii Nauk SSSR: Moscow, Leningrad, Russia, 1962. (In Russian) [Google Scholar]
  33. Krestov, P.V.; Song, J.-S.; Nakamura, Y.; Verkholat, V.P. A phytosociological survey of the deciduous temperate forests of mainland Northeast Asia. Phytocoenologia 2006, 36, 77–150. [Google Scholar] [CrossRef]
  34. Shorten, C.; Khoshgoftaar, T.J. A survey on image data augmentation for deep learning. J. Big Data 2019, 6, 60. [Google Scholar] [CrossRef]
  35. Chollet, F.; Rahman, F.; Lee, T.; de Marmiesse, G.; Zabluda, O.; Pumperla, M.; Santana, E.; McColgan, T.; Shelgrove, X.; Branchaud-Charron, F.; et al. Keras. 2015. Available online: https://github.com/fchollet/keras. (accessed on 1 December 2020).
  36. Minaee, S.; Boykov, Y.; Porikli, F.; Plaza, A.; Kehtarnavaz, N.; Terzopoulos, D. Image segmentation using deep learning: A survey. arXiv 2020, arXiv:2001.05566. [Google Scholar]
  37. Ronneberger, O.; Fischer, P.; Brox, T. U-Net: Convolutional networks for biomedical image segmentation. In Medical Image Computing and Computer-Assisted Intervention—MICCAI 2015; Lecture Notes in Computer Science; Springer: Cham, Switzerland, 2015; Volume 9351. [Google Scholar] [CrossRef] [Green Version]
  38. Aggarwal, C.C. Neural Networks and Deep Learning; Springer International Publishing: Berlin/Heidelberg, Germany, 2018; 497p. [Google Scholar] [CrossRef]
  39. Hand, D.J.; Yu, K. Idiot’s Bayes—Not so stupid after all? Int. Stat. Rev. 2001, 69, 385–398. [Google Scholar] [CrossRef]
  40. Tharvat, A. Linear vs. quadratic discriminant analysis classifier: A tutorial. Int. J. Pattern Recognit. 2016, 3, 145–180. [Google Scholar] [CrossRef]
  41. Altman, N.S. An introduction to kernel and nearest-neighbor nonparametric regression. Am. Stat. 1992, 46, 175–185. [Google Scholar] [CrossRef] [Green Version]
  42. Freund, Y.; Schapire, R.E. A decision-theoretic generalization of on-line learning and an application to boosting. J. Comput. Syst. Sci. 1997, 55, 119–139. [Google Scholar] [CrossRef] [Green Version]
  43. Breiman, L. Random Forests. Mach. Learn. 2001, 45, 5–32. [Google Scholar] [CrossRef] [Green Version]
  44. Pedregosa, F.; Varoquaux, G.; Gramfort, A.; Michel, V.; Thirion, B.; Grisel, O.; Blondel, M.; Prettenhofer, P.; Weiss, R.; Dubourg, V.; et al. Scikit-learn: Machine learning in Python. J. Mach. Learn. Res. 2011, 12, 2825–2830. Available online: http://www.jmlr.org/papers/v12/pedregosa11a.html (accessed on 1 December 2002).
  45. Haralick, R.M.; Shanmugam, K. Textural features for image classification. IEEE Trans. Syst. Man Cybern. 1973, 6, 610–621. [Google Scholar] [CrossRef] [Green Version]
  46. van der Walt, S.; Schönberger, J.L.; Nunez-Iglesias, J.; Boulogne, F.; Warner, J.D.; Yager, N.; Gouillart, E.; Yu, T. Scikit-image: Image processing in Python. PeerJ 2014, 2, e453. [Google Scholar] [CrossRef]
  47. Rezatofighi, H.; Tsoi, N.; Gwak, J.Y.; Sadeghian, A.; Reid, I.; Savarese, S. Generalized intersection over union: A metric and a loss for bounding box regression. arXiv 2019, arXiv:1902.09630. [Google Scholar]
  48. Altman, J. Tree-ring-based disturbance reconstruction in interdisciplinary research: Current state and future directions. Dendrochronologia 2020, 62, 125733. [Google Scholar] [CrossRef]
  49. Paszke, A.; Gross, S.; Massa, F.; Lerer, A.; Bradbury, J.; Chanan, G.; Killeen, T.; Lin, Z.; Gimelshein, N.; Antiga, L.; et al. PyTorch: An imperative style, high-performance deep learning library. arXiv 2019, arXiv:1912.01703v1. [Google Scholar]
Figure 1. The study area, urbanized territories highlighted in black and the area of interest indicated by a red polygon.
Forests 12 00066 g001
Figure 2. The U-Net-like convolutional neural network (CNN) architecture.
Forests 12 00066 g002
Figure 3. Comparison of pixel-based and U-Net-like CNN algorithm recognition results for 256 × 256-pixel images. The red color patches in the left images (Image and mask group) indicate masks for poplars, and the blue color patches indicate masks for coniferous trees. Segmentation algorithms: CNN—U-Net-like CNN; AdaBoost—adaptive boosting classifier; GaussianNB—naive Bayes classifier; RandomForest—random forest classifier; KNN—k-nearest neighbors classifier; QDA—quadratic discriminant analysis.
Forests 12 00066 g003
Figure 4. Comparison of pixel-based and U-Net-like CNN algorithm recognition results. Segmentation algorithms: CNN—U-Net-like CNN; AdaBoost—adaptive boosting classifier; GaussianNB—naive Bayes classifier; RandomForest—random forest classifier; KNN—k-nearest neighbors classifier; QDA—quadratic discriminant analysis.
Forests 12 00066 g004
Figure 5. Results of applying the U-Net-like CNN recognition algorithm: (a)—Train image; (b)—Test image. Light green patches in the left images belong to poplars, and dark green patches belong to coniferous trees.
Forests 12 00066 g005
Table 1. Comparison of traditional machine learning (ML) methods and the U-Net-like convolutional neural network (CNN).
ClassifierMean BA 1Best Threshold ValuesMean F1 2Best Threshold ValuesMean IoU 3Best Threshold Values
ConifersPoplarsConifersPoplarsConifersPoplars
U-Net-like CNN0.960.610.610.970.760.810.940.760.81
AdaBoost0.690.310.360.840.410.360.790.410.36
GaussianNB0.750.010.610.850.060.860.800.600.91
KNN (k = 3)0.880.010.010.930.360.360.880.360.36
RandomForest0.870.010.210.900.160.610.840.210.36
QDA0.870.010.060.910.760.210.860.760.26
1 BA—balanced accuracy; 2 F1—F1 score; 3 IoU—intersection over union (Jaccard similarity); CNN—U-Net-like CNN; —adaptive boosting classifier; GaussianNB—naive Bayes classifier; RandomForest—random forest classifier; KNN—k-nearest neighbors classifier; QDA—quadratic discriminant analysis.
Table 2. Comparison of ML methods with grey level co-occurrence matrices (GLCM) feature engineering.
ClassifierMean BA 1Best Threshold ValuesMean F1 2Best Threshold ValuesMean IoU 3Best Threshold Values
ConifersPoplarsConifersPoplarsConifersPoplars
AdaBoost0.690.400.360.840.410.360.790.410.36
GaussianNB0.750.960.950.850.960.960.800.950.96
KNN (k = 3)0.890.710.710.930.710.710.880.360.36
RandomForest0.870.160.410.900.160.410.840.160.41
QDA0.950.960.960.960.960.960.930.960.96
1 BA—balanced accuracy; 2 F1—F1 score; 3 IoU—intersection over union (Jaccard similarity); CNN—U-Net-like CNN; AdaBoost—adaptive boosting classifier; GaussianNB—naive Bayes classifier; RandomForest—random forest classifier; KNN—k-nearest neighbors classifier; QDA—quadratic discriminant analysis.
Publisher’s Note: MDPI stays neutral with regard to jurisdictional claims in published maps and institutional affiliations.