1. Introduction
Site index models are primarily developed using tree age and height for shade-intolerant species in even-aged stands. Potential growth suppression can limit shade-tolerant species as candidates for traditional site index research per standard protocols. Central Appalachian red spruce (
Picea rubens) is one such species which frequently experiences suppression periods, as it transitions through canopy classes [
1] and is often found growing in uneven-aged stands for which few site index models have been developed [
2]. An extensive review of traditional site index curves for eastern United States tree species [
3] includes just a single study of red spruce site index [
4].
Recognition of the inherent limitation of the traditional approach of using free growing dominant and codominant trees to model site index has led to alternate, non-traditional methods. Meyer [
5] proposed a two-parameter height equation (Meyer 2P) that could use either age and height pairs (A, H) or DBH and height pairs (DBH, H) for uneven-aged stands. McLintock and Bickford [
6] used (DBH, H) pairs and the Meyer 2P model to generate site index curves for red spruce stands in northern Maine. Nicholas and Zedaker [
2] applied both the Meyer 2P and the Chapman–Richards function [
7,
8] to estimate red spruce site index using (DBH, H) in the southern Appalachian Mountains of Virginia and Tennessee. One novel method of accounting for suppression in red spruce was developed by Seymour and Fajvan [
9]. This method involves using free-growth age of the tree instead of the true age of the tree by replacing time periods during lengths of suppression on tree cores with free-growth age of the same length following the suppressed period. Both age correction to account for suppression and the use of DBH instead of age are therefore different methods to address the shade tolerance of red spruce when predicting height and site index.
The extent of the limited red spruce site index research has focused on red spruce at the northern and southern portions of its range [
2,
6,
9,
10,
11,
12] with the exception of a
Picea spp. group model for the Northeastern United States [
13]. No site index models are currently available for central Appalachian red spruce. This is unfortunate, as red spruce is a species of high restoration interest in the central Appalachian region. A model used to estimate red spruce height and site index values for central Appalachian red spruce could be a valuable tool for estimating red spruce growth and could allow land managers to make land suitability decisions when identifying possible locations for red spruce restoration activities such as plantings.
Models have been created to predict and quantify site quality using metrics other than height at a base age. Forest site quality index (FSQI) has been used in the Appalachian Mountains to quantify site quality [
14]. FSQI is a land ranking system that ranks forest lands in terms of productivity by assessing geographic features that impact soil moisture, such as aspect, slope, and landscape position [
14,
15]. Other models have been created that use climate specific variables and geographic FSQI-related variables to predict a site index for other spruce species in northern latitudes [
16]. Jiang et al. [
17] developed models to predict site index for conifers in the eastern United States (including red spruce) using climate variables. Using combinations of geographic and climatic variables on a site level may be an effective method of predicting central Appalachian red spruce site index.
Much of the forest land in the central Appalachians that was once dominated by red spruce is now dominated by associated hardwood species, such as red maple (
Acer rubrum) and yellow birch (
Betula alleghaniensis) [
18,
19,
20]. There have been no studies published that predict the site index of red spruce using site index values of associated species. Steele and Cooper [
21] developed linear models to predict site index values of western timber species using the site index values of associated species. Older studies conducted in the eastern United States developed models that use site index of common timber species to predict the site index of associated commercial timber species [
22,
23,
24]. Carmean [
25] created linear models to predict site index values between 12 common timber species in the mid-western United States. Developing models that can estimate red spruce site index using associated hardwood species could be an effective method of assessing the suitability of forested land for potential red spruce management activities.
The first objective of this research is to develop regionally accurate site index curves for red spruce. This will be accomplished by examining traditional data sources for site index such as (A, H) pairs, less commonly used data such as (DBH, H) pairs, and testing the efficacy of a more novel measure for red spruce, the suppression-corrected age (AC). The second objective of this research is to develop models to predict red spruce site index at sites where dominant or codominant red spruce are absent from the overstory. This will be accomplished by using the site index values of common hardwood associates of red spruce combined with easily obtainable climatic and geographic data. Models to predict red spruce site index where the species is currently absent would be an important tool in pinpointing optimal locations for future red spruce restoration activities.
2. Materials and Methods
2.1. Field Sampling Methods
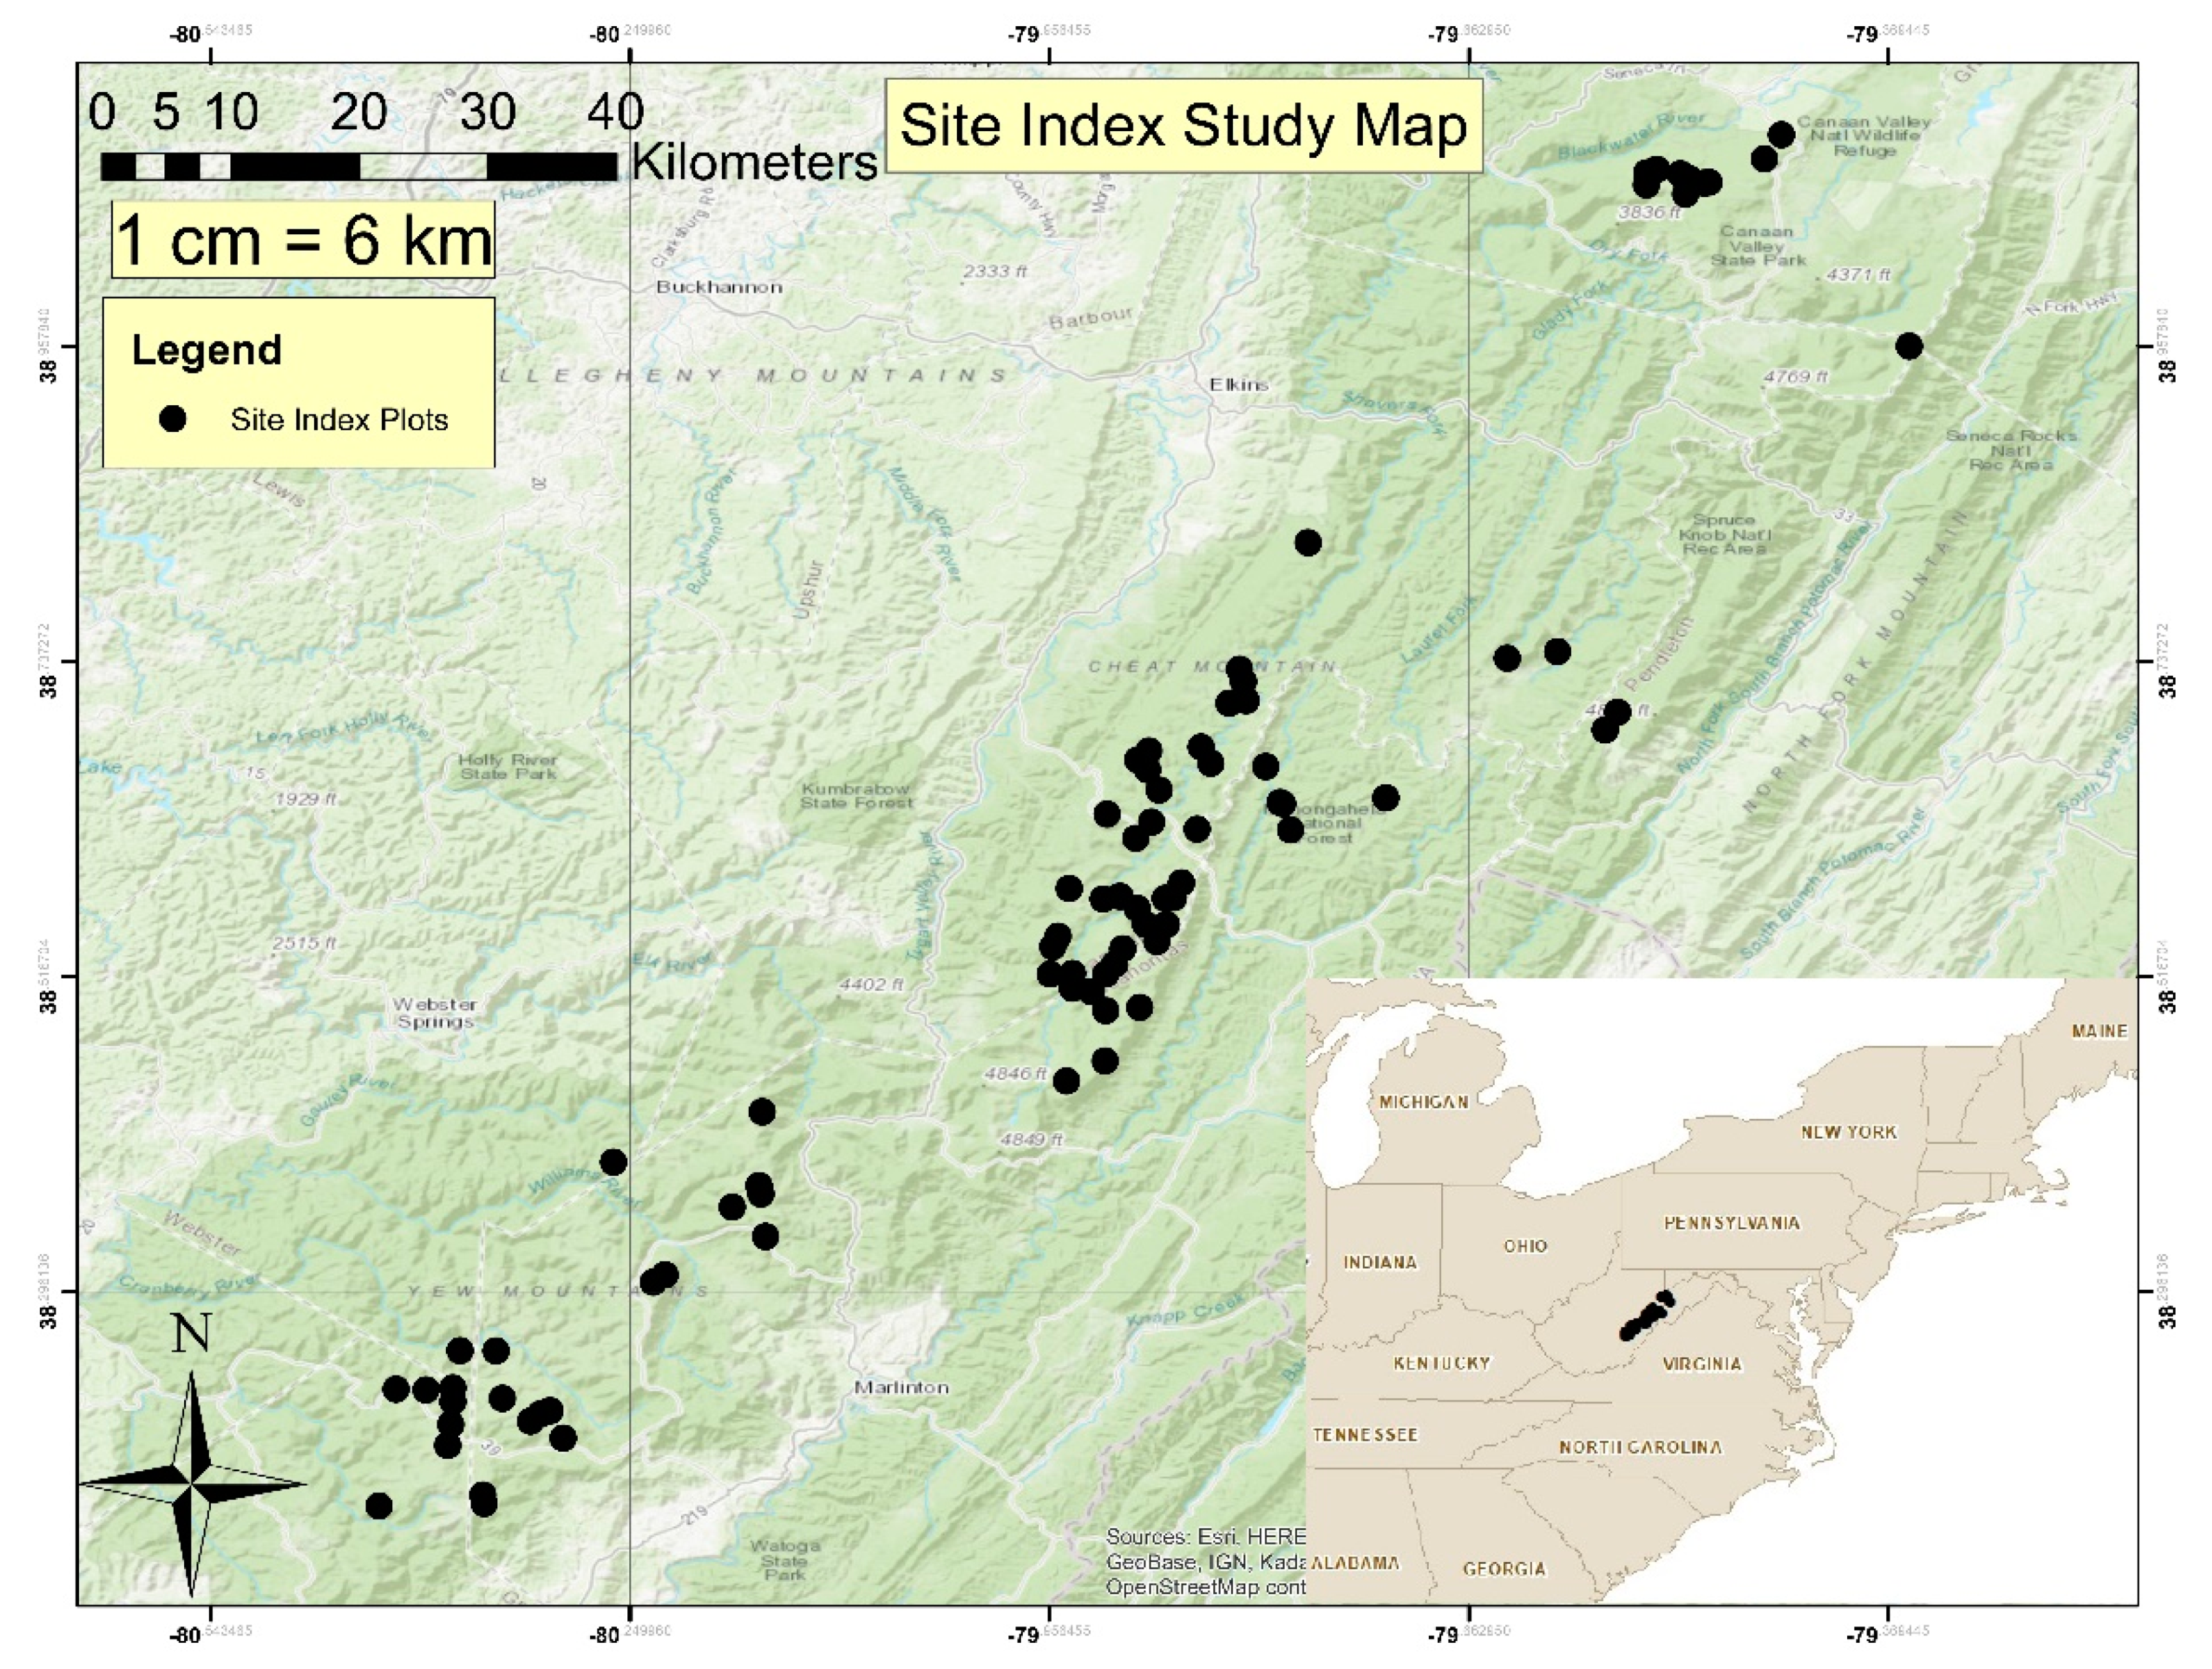
Field sampling occurred on the Monongahela National Forest (MNF) in the state of West Virginia. Random sampling locations were determined by using the random sample tool within the data management ArcToolbox in ArcGIS (ESRI, Redlands, CA) [
26]. Random points were placed on portions of the MNF that contained at least 10% estimated red spruce canopy cover using the red spruce landcover dataset obtained from the state of West Virginia’s GIS clearinghouse website [
27]. A total of 150 random sample points were identified with a goal to sample 100 plots. A total of 83 plots were ultimately sampled (
Figure 1) due to restrictions associated with identified sample points such as potential endangered species habitat, location on private property, and locations difficult to safely access.
Garmin Oregon 650 GPS units (Garmin, Olathe, KS) were used to navigate to the randomly selected sample points. Once at the random sample point, a temporary plot marker was installed, and sampling occurred. Sampling was conducted using a circular plot with a 10 m radius (0.02337 hectare area) that had a random azimuth generated to begin sampling. From plot center, a 10 m tape was extended along the azimuth. Sampling was then conducted from the random azimuth in a clockwise rotation until all samples were collected. The first red spruce tree that was encountered in this clockwise sweep that was larger than 10.16 cm diameter at breast height (DBH) (1.37 m from ground) was determined to be the primary red spruce. The primary red spruce was the spruce tree that was to be destructively sampled for future stem analysis. Once the primary spruce was selected, sampling continued clockwise until the next red spruce was encountered in the sample sweep; if this tree was in the codominant or dominant canopy class, it was the one used in this study for anamorphic site index curves, otherwise, the sample sweep continued until a dominant/co-dominant red spruce was identified. In addition, the first black cherry (Prunus serotina Ehrh.), American beech (Fagus grandifolia Ehrh.), yellow birch, and red maple occurring in the dominant or codominant canopy class were sampled for site index conversion modeling. If one of the trees selected for sampling had visible signs of poor health, defects, or crown damage, the tree was not sampled, and the next suitable tree of that species was selected. Two increment cores were extracted at breast height on the secondary red spruce and for each sampled hardwood tree. Increment cores were taken perpendicular to slope on opposite sides of the tree to avoid sampling reaction wood. Total height (H), crown height, bark thickness, crown class, and diameter at breast height (DBH) were recorded for each tree. Heights were measured using a Haglof Vertex Laser Geo (Haglof, Järfälla, Sweden).
2.2. Laboratory Methods
Extracted increment cores were stored in large paper straws and labeled according to the plot number and tree sample number. Cores were then oven dried in a laboratory oven. Once dry, increment cores were mounted to wooden core mounts and pressed. Once mounted, cores were then sanded using an electric palm sander. All cores were sanded to a minimum grit level of 400. Red spruce cores that showed growth suppression and all hardwood species cores were sanded further to a grit level of 800.
Sanded increment cores were then visually crossdated using a dissecting microscope [
28]. Starting, ending, decadal, and narrow, rings were marked for each sample core. Each core was dated by ensuring narrow marker rings were the same age on both cores extracted from the tree. Starting and ending years of each core were noted to determine true age (A) of the sample core. Suppression periods within the red spruce increment cores were identified and were processed according to the suppression correction methods developed by Seymour and Fajvan [
9]. Periods of growth suppression were measured with a micrometer to a precision of 0.01 mm. Age of suppression was noted, and the distance associated with the suppressed period was marked on the cores along the free-growth period following the suppression. The number of free-growth annual increments counted along this distance on the core was noted. A suppression-corrected age (A
C) was then determined for the increment core by replacing the suppression period age with the following free-growth age. A total of 40 of the 83 sampled trees required suppression-corrected ages, as they experienced at least one suppression period at breast height. Average ring width measurement was noted for each suppression period. Average 10-year ring width measurements were noted for periods preceding and following suppression periods.
Once cores were visually dated, they were then scanned with a high-resolution scanner at a resolution of 2400 dots per inch. Scanned images of each core were then processed in CooRecorder (Version 9.0) (Cybis, Saltsjöbaden, Sweden) by measuring and dating each annual growth ring. The pith estimation tool was used in CooRecorder to estimate rings to the pith on samples that did not reach the pith. CooRecorder’s pith estimation value was used for future predicted age values for all cores that did not contain the pith of the tree.
2.3. Height Modeling
Both the two-parameter Meyer [
5] (Meyer 2P) and the three-parameter [
7,
8] (C-R 3P) height models were considered for modeling height. The Meyer 2P model is as follows:
where
H is the height (m),
A is the age (true or suppression-corrected) at DBH, and
θ1 and
θ2 are parameters. A Meyer 2P height model may be fit by replacing age with DBH. The three-parameter Chapman–Richards function is as follows:
with
H and
A as in [
1] and
θ1…
θ3 are parameters. Note that the Meyer 2P model is a reduced form of the C-R 3P model with
θ3 = 1. Models were fit with the Gauss–Newton method using nonlinear regression in SAS (SAS Version 9.4) (SAS Institute, Cary, NC). Best models were selected using the Akaike information criterion corrected (AICc), calculation of the predicted error sum of squares (PRESS) statistic, and bias (mean of the residuals).
Six model forms were chosen for evaluation: a C-R 3P model and a Meyer 2P using (AC, H) pairs, a C-R 3P model and a Meyer 2P using (DBH, H) pairs, and a C-R 3P model and a Meyer 2P model using (A, H) pairs. This allows comparison of the C-R 3P model versus the Meyer 2P for the three different independent variable pairs as well examination of the best paring of independent variables.
Reference guide curves were generated for a range of site index values aligning with the estimated site indices of the study plots. Individual reference curves use the estimates for
θ2 and
θ3 from the six models, the reference curve site index as the height, and a base age of 50 in order to solve for the necessary value of
θ1 for the reference curve per the anamorphic guide curve estimation described in Clutter et al. [
29]. Estimates of individual plot site index can then be made using a known height age pair,
θ2 (and
θ3 where applicable), and the base age. Substituting DBH or A
C for A generates the reference curves and plot estimates of site index for (DBH, H) and (A, H) models, respectively.
2.4. Site Index Conversion Models
Multiple linear regression was used to develop conversion equations to predict red spruce site index from associated species site index values, climate, and geographic variables. Red maple and yellow birch were the most commonly associated species at the sample plots, and site index was determined using the site index curves in Carmean, Hahn, and Jacobs [
3]. Twenty-three climatic variables (30-year mean values from 1981 to 2010) considered for modeling were obtained from Oregon State University’s PRISM website (prism.oregonstate.edu, 02/20/2020) [
30]. Geographic variables were determined using data collected during field sampling, such as slope, latitude and longitude coordinates, elevation, and aspect (
Table 1).
Table 1 shows a list of the climatic and geographic variables considered for linear site index modeling.
Models were generated using all subsets multiple linear regression, but given the size of the data set (n = 83), models were limited to eight or fewer independent variables. The all subsets procedure was conducted in four pools of variables. All pools of variables included all the geographic and climate variables. One pool had no species site index (C + G), one pool forced yellow birch site index (YB + C + G), one pool forced red maple (RM + C + G), and the last forced both red maple and yellow birch (YB + RM + C + G). Best models having all significant predictors were selected in each group and ranked by AICc, R2adj, and PRESS. Conversion equations were also generated for red maple alone (RM), yellow birch alone (YM), and red maple and yellow birch together (RM + YB).
4. Discussion
The Meyer [
4] red spruce site index curve, developed from sites in Vermont, New Hampshire, and Maine, is still in use as refit by Carmean, Hahn, and Jacobs [
3]. However, when site index values were estimated for the (A, H) pairs of trees in this study from the refit equation, several erroneously large values occurred in the youngest trees aged less than 35 years. It is noted in the McNab and Keyser [
31] publication that disagreements between the refitted equation tend to be distorted most at the largest and smallest values. Both the guide curves for age (C-R 3P and Meyer 2P) are generated using a wider age range than Meyer [
4], from 23–304 years for actual age and from 23–158 for suppression-corrected age. In addition, studies have shown that northern red spruce are not as affected by climate as central and southern red spruce [
32,
33,
34,
35,
36]. Data used to develop the Carmean, Hahn, and Jacobs [
3] site index model was collected in the 1920s [
4]. Red spruce sampled in the Meyer [
4] study had different growing conditions and had probably not experienced growth limitations from acid rain [
35,
37]. Because of the different growing conditions that the red spruce in the Meyer [
4] study experienced, the Carmean, Hahn, and Jacobs [
3] red spruce site index is potentially not representative of the central Appalachian red spruce site index. Given this study’s wider range of measured tree ages, data local to the central Appalachians, and the inclusion of the solved parameter values for the height equations, it is suggestive that these new curves are an improvement to the Meyer [
4] site index curves.
While it is unstated as to the number of parameters in their Chapman–Richard function (three is typical), Nicholas and Zedaker [
2] were unable to fit the function to their (DBH, H) pairs for southern Appalachian red spruce due to convergence issues in the nonlinear modeling. This same problem was encountered here. This study sampled trees with a minimum DBH criteria of 10.16 cm, lower than their 25 cm limit. The DBH range of trees sampled here was 11.4–71.4 cm. Both parameter estimates for this study,
θ;
1 = 29.41 and
θ2 = −0.022, were of the same order of magnitude and sign as the Nicholas and Zedaker [
2] parameters, which were 49.81 and −0.012, respectively. The θ
2 parameter is part of the exponent of the base e term, where it is the coefficient for DBH. As DBH increases, the base e term decreases and the height increases. The smaller the value for θ
2, the faster height increases. Since −0.022 < −0.012, the curves that have been generated for central Appalachian spruce are steeper than the curves generated for southern Appalachian red spruce in relation to DBH. Of further note is that the Meyer 2P (DBH, H) guide curves in this study had better fit statistics than any of the curves generated for (A, H) and (A
C, H). As DBH is a more readily measurable parameter, these new Meyer 2P (DBH, H) curves may prove to be a valuable addition to site productivity work in the future.
Examination of the several site index conversion models reveals that a simple conversion model containing a single tree species performed better than the best C + G model. Given the opportunity, adding a site index tree to the data collection is therefore preferable when an estimate of red spruce site index is of interest as opposed to relying on climate and geographic predictors. Alternatively, it is useful to add climate and geographic data to improve the site index conversion prediction. Yellow birch site index is a better predictor than red maple site index, with or without C + G predictors. In this study, yellow birch could be found on 57 plots and red maple could be found on 58 plots, so the likelihood of finding yellow birch was nearly the same as red maple, and roughly 90% of the time one or the other was present. Most publications only develop models using one associated species as the predictor, which can be more readily implemented [
21,
25].
Linear models that use associated species, climatic, and geographic variables are critical for estimating site index in the central Appalachians, as much of red spruce’s home range is now predominantly in forest cover other than red spruce [
38,
39]. In locations where red spruce is absent, these linear models could be useful for estimating site productivity in terms of height growth for red spruce. Being able to quantify locations with predicted site index values for red spruce would be a major advantage in selecting lands for future restoration activities in order to ensure management activities occur on the sites most likely to optimize both ecological and economic (return on investment) outcomes [
40].


