Article

Resource Partitioning of Scots Pine (Pinus sylvestris L.) by Pine Shoot Beetles in Stands under Stress Conditions

by
Andrzej Borkowski
Department of Environmental Biology, Institute of Biology, Jan Kochanowski University, Uniwersytecka 7 Str., 25-406 Kielce, Poland
Forests 2021, 12(10), 1336; https://doi.org/10.3390/f12101336
Submission received: 4 August 2021 / Revised: 21 September 2021 / Accepted: 28 September 2021 / Published: 29 September 2021
(This article belongs to the Section Forest Health)

Abstract

:
The pine shoot beetles Tomicus piniperda L. and T. minor Hartwig are sympatric species that occur on Scots pine in two habitats. Feeding by the beetles in tree crowns causes significant losses in tree growth and disturbs the crown’s proper development. A review of the subject literature showed that there had been no previous studies of interspecific competition in stands with different degrees of crown damage. The aim of this work was to assess the resource partitioning of stems by the two species in stands with damaged and undamaged crowns. Data were collected in the years 1992–2008 in stands containing Scots pine located at different distances from timber yards. A total of 259 natural traps were laid, and measurements of height and diameter at breast height were made for 900 pines. The surface area of each stem was divided into 20 equal sections by making a division lengthwise (into units) and laterally (into an upper and lower part). In total, 90,501 egg galleries of pine shoot beetles were counted on 9560 stem sections. Feeding by pine shoot beetles in the crowns of pines reduces site productivity and the nutritional suitability of stems. The results of niche segregation indicate pine shoot beetles exhibited spatial specialization in the use of resources. prefers the thicker part of the stem, and T. minor the thinner part. The population of T. piniperda on the trap logs was described using a multiple linear regression model with three explanatory variables. As a result of regression modelling, from the set of variables representing characteristics of habitats, trees and trap logs and the parameters of infestation, the following explanatory variables were selected: range of colonisation of a trap log (rc), site quality class (sqc), and crown undamaged (cu). The explanatory variables included in the MLRM model explain to a significant degree (p < 0.05) the niche breadth of T. piniperda on trap logs. In all validated plots, the mean real and model values for the niche of T. piniperda on the trap logs are similar (p > 0.5), confirming the high accuracy of the developed model.

1. Introduction

Species of the beetle subfamily Scolytinae exploit host resources (cambium, phloem, wood) as breeding and food material. In modern biology, resource partitioning is an important concept in research on interspecific competition. Mechanisms at geographical and principal host level have enabled the minimisation of direct competition between conifer bark beetles for phloem tissue. Species with similar life histories and host range differ at geographical level (in terms of their range of occurrence) and at host level, being monophagous, oligophagous, or (rarely) polyphagous [1]. Apart from the principal mechanisms, other mechanisms also operate on a smaller scale. In bark beetles there is differentiation at tree level (spatial specialisation in colonising trees), at a behavioural level (species have different flying dates), and at a physiological level (they colonise trees that have been weakened to different degrees) [2,3,4,5].
A unique life trait is displayed by bark beetles of the genus Tomicus (Latreille, 1802). These occur in at least two habitats. Larvae develop in the phloem and adults feed in the crowns of healthy and vigorous pines. In Europe, on Scots pine (Pinus sylvestris L.), two sympatric species occur: Tomicus piniperda L. and T. minor Hartwig. In stands containing the pine P. sylvestris, populations of pine shoot beetles may consist of individuals of endogenous or exogenous origin. The first are individuals from the local population which overwinter at the base of the trunks or in the litter. The second are individuals that migrate from places where pine wood is stored in bark, such as timber yards. In a study using marked T. piniperda beetles [6] it was found that most of the population flew less than 100 metres (56%–68%), nearly all flew less than 400 metres (95.3%), and the remainder flew up to 2000 metres away. Feeding on shoots by these beetles causes significant losses in tree growth [7,8,9]. The large size of populations of pine shoot beetles in pine stands means that these species can be used as bioindicator organisms—for example, in research related to climate changes. A Swedish study [10] showed that the start of flying by T. piniperda took place approximately three weeks earlier than it did in the 1970s, and retraction of T. minor from the southern part of Sweden was also observed.
The analysis of community dynamics depends in part on measurement of how organisms utilise their habitat. One way to do this is to measure the niche parameters of a population and to compare the niche of one population with that of another. Since food is one of the most important dimensions of the niche, the analysis of bark beetles’ diets is closely related to the problem of niche specifications. Although there is much current research of this type [11], there are few such studies concerning bark beetles. Biotic interactions involving the subfamily Scolytinae have been described on spruce [2] and on several pine species [12,13,14,15]. These investigations are highly time-consuming and labour-intensive, requiring the careful removal of bark from the stems and simultaneous counting of egg galleries. Data of this kind may be useful in climate-related research, for example. The niche parameter may be used as a measure to evaluate the possible consequences of climatic factors for organismal fitness.
The purpose of this study was: (1) to verify the hypotheses that feeding by pine shoot beetles in tree crowns has a negative impact on (a) site productivity and (b) the nutritional suitability of stems; (2) to propose a statistically based method enabling measurement of the niche breadth of T. piniperda on P. sylvestris trap logs. The method includes both tree-scale and stand-scale analyses. The first of these enables measurement of the niche breadth on trap logs, while the second enables estimation of the mean niche breadth within a stand.
A literature survey indicates that the above research hypotheses have not previously been tested, and no precise method has been developed for measuring the niche breadth of T. piniperda on trap logs [16].

2. Material and Methods
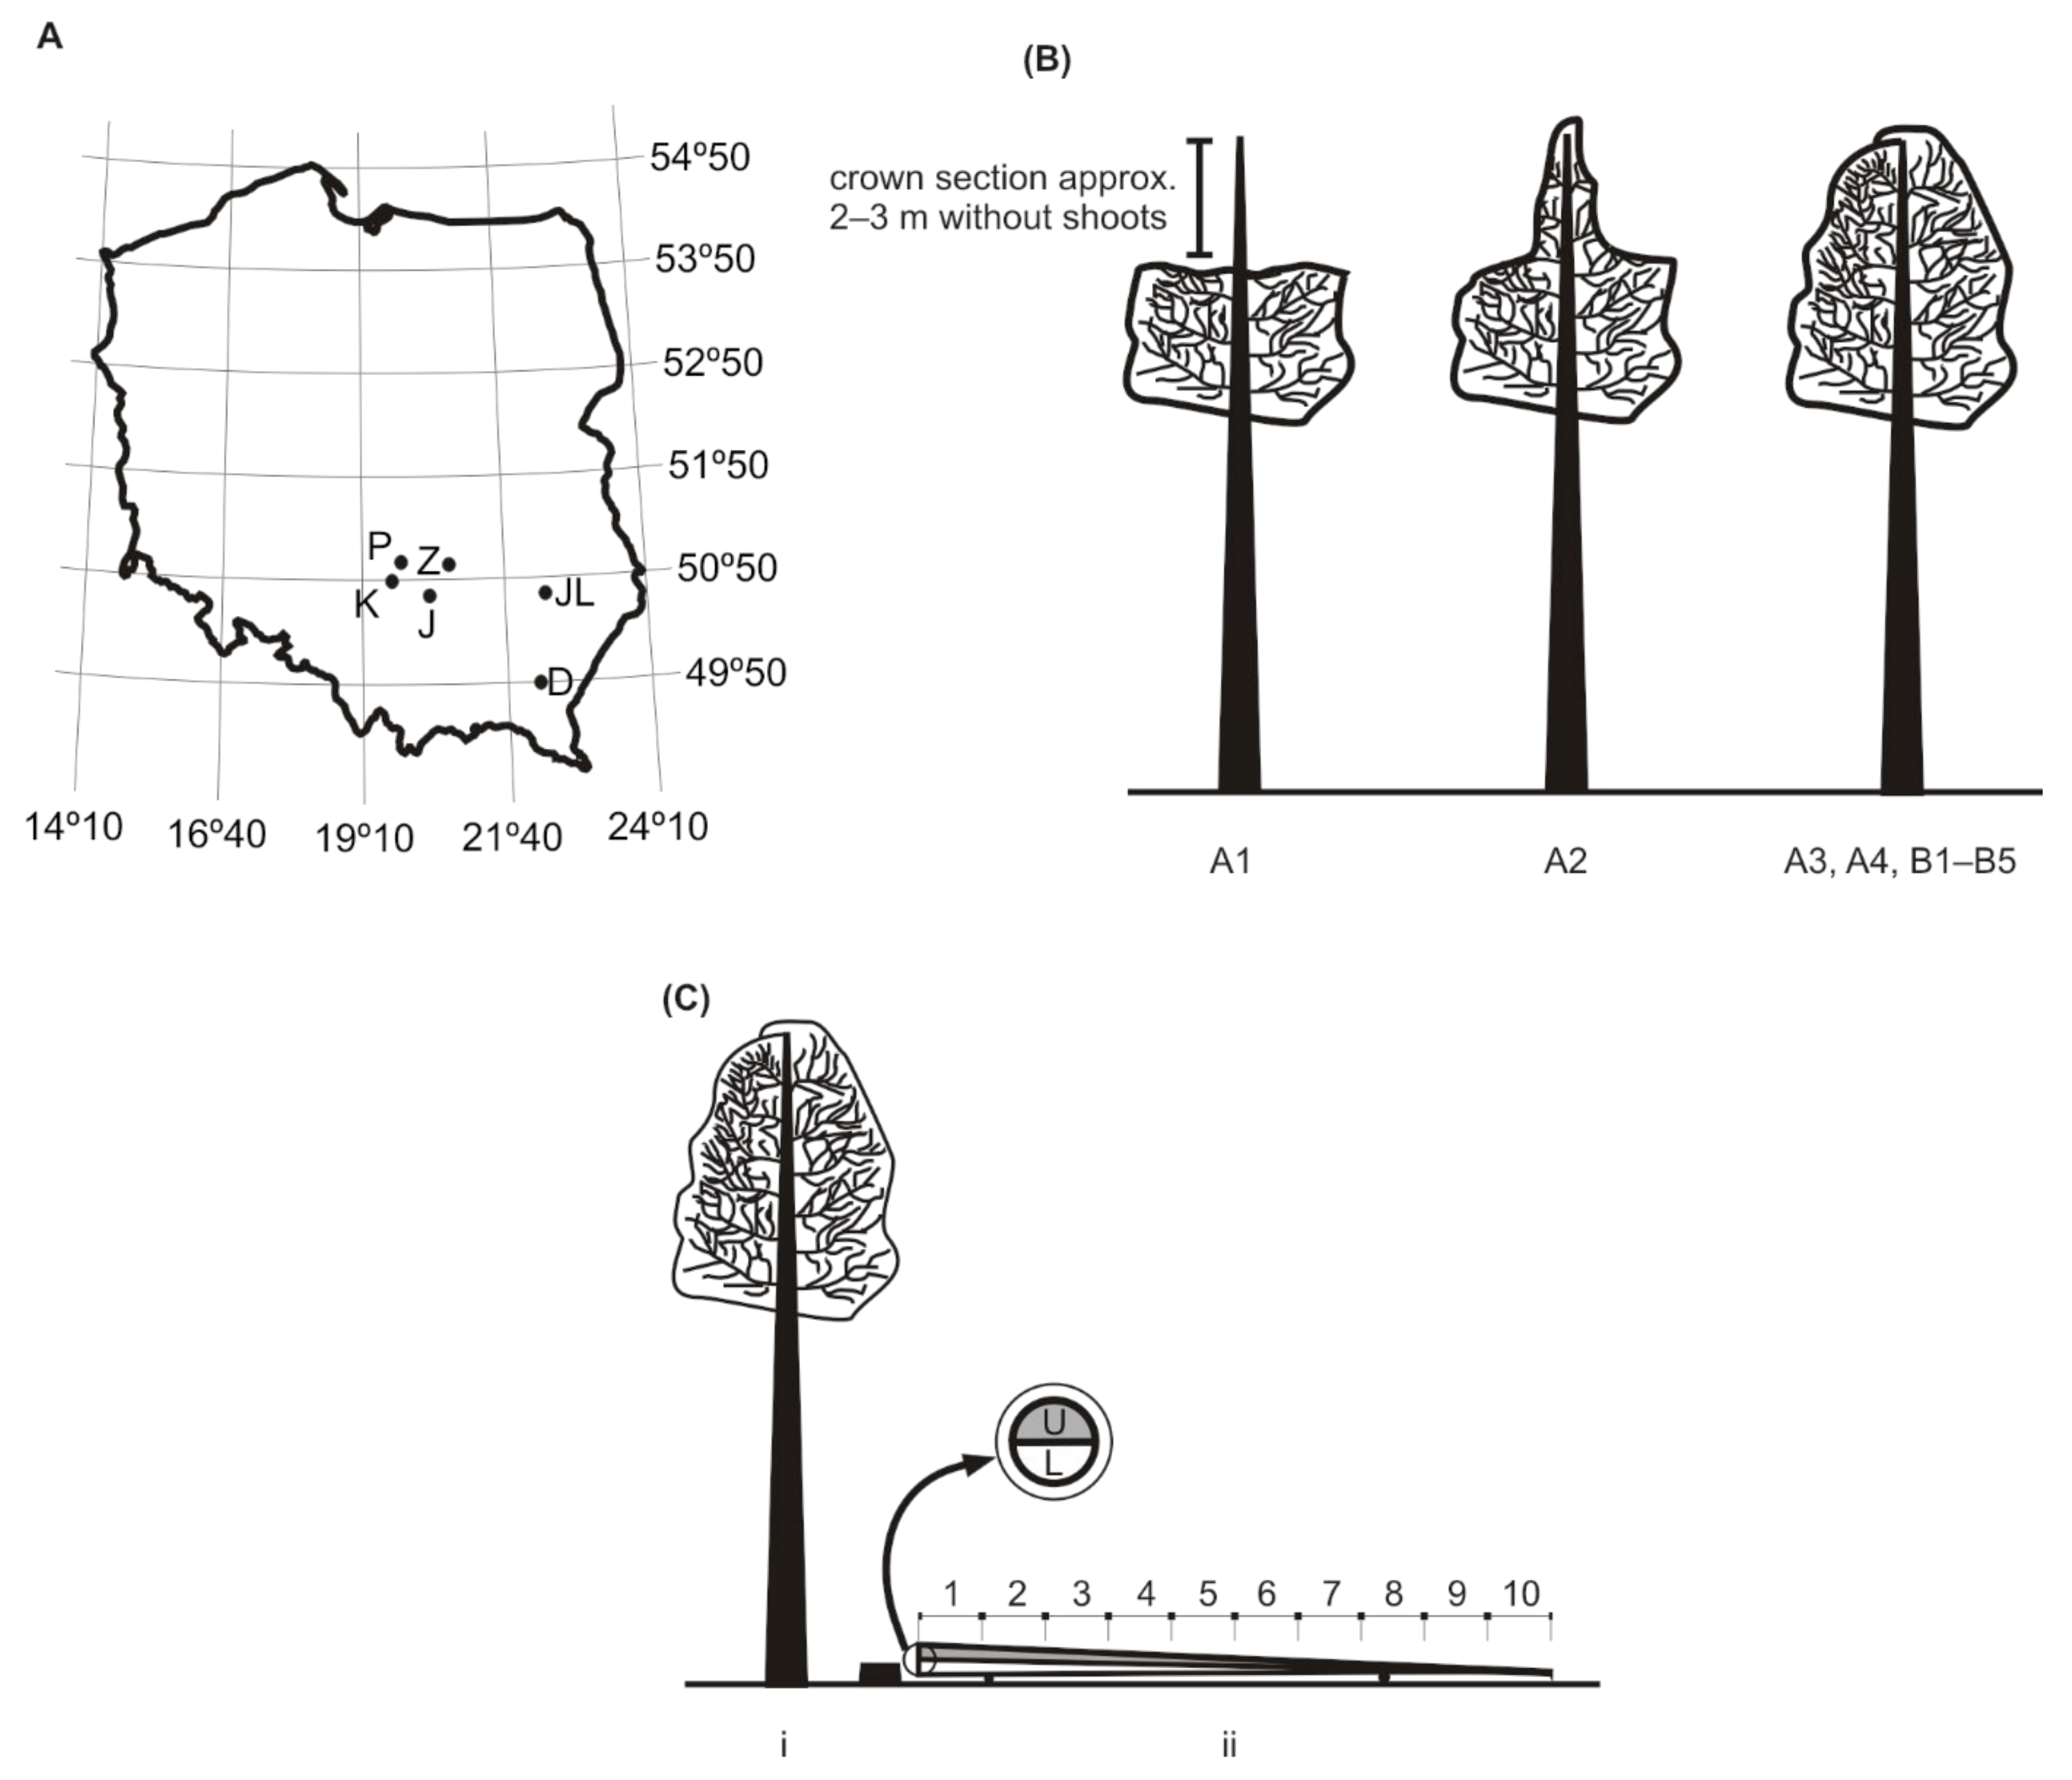
2.1. Study Site

In research carried out in 1992–2008 in southern Poland (Figure 1A), stands were selected at distances of up to 400 m (group A) and over 2000 m (group B) from a timber yard. By adopting these criteria, it is possible to assess the effect of feeding by beetles in pine crowns on the nutritional suitability of stems in stands subject to possible high (group A) and low (group B) population densities of T. piniperda. Stands in group A were located close to a timber yard in Zagnańsk (Z) that had been functioning since 1916 [9]. Until 1996, the yard processed daily approximately 30–100 m3 of pine wood in bark. After the yard was privatised in 1996, timber began to be processed on a current basis, and the bark was removed. Heavy feeding by pine shoot beetles migrating from the timber yard in the crowns of healthy pines caused significant losses in tree growth, as well as deformation of the crowns [9,17]. In the stands in group A, the trees within a given zone were damaged to a similar degree. The extent of crown damage was used as a criterion to define zones within group A (Figure 1B):
i.
stand A1: crowns stunted, no shoots on a top section of ca. 2–3 m; stand located up to 100 m from the timber yard;
ii.
stand A2: crown in the shape of a cone in the phase of regeneration (reconstructed leader shoot); stand located 100–300 m from the timber yard;
iii.
stand A3: crown properly developed; stand located over 300 m from the timber yard.
Stands with crowns that were damaged (stands A1, A2) and undamaged (A3, A4, B1–5) by pine shoot beetles will be further referred to as damaged and undamaged stands. Stands in group B were located in the Forest Districts of Dynów (D), Janów Lubelski (JL), Jędrzejów (J), Koniecpol, (K) and Przedbórz (P) (Figure 1A). Labels and characteristics of stands and trap logs are listed in Table 1.

2.2. Entomological Analysis

During the study period, in January, a random selection was made of pines that were physiologically healthy and free of technical defects (259 trees in total). The trees were felled, the tops and branches were removed, and they were then placed on supports. The trees prepared in this way will be further referred to as trap logs. These are natural traps used in the monitoring of bark beetles [18]. Each trap log was divided into 10 equal units, and the following were measured: (1) the diameter in bark at the midpoint of each unit; (2) the stem diameter in bark at the thicker and thinner ends of the trap log; and (3) the length of the trap log. In May, after removal of the bark, the perimeter of each trap log was divided into two equal parts, upper and lower (Figure 1C). As a result of the division of a stem lengthwise (into units) and laterally (into an upper and lower part), 20 sections (j) were obtained. It was assumed that a uniform distribution of sampling points would provide a highly representative characterisation of the effect of environmental variables on the nutritional suitability of stems. Some studies have shown that T. minor prefers the underside of fallen logs or trees [19]. Egg galleries of pine shoot beetles (Figure 2 and Figure 3) were counted separately for each section.
The total infestation density of each trap log was calculated by (1) summing the counts of egg galleries from all sections, and (2) computing the stem surface area. The stem form of a coniferous tree can be expressed by Kunze’s equation (Equation (1)) [20]:
r = b l c
where r is the stem radius, l is the length of the stem from the tip of the trap log, and b and c are coefficients. The stem surface area s of the tree can be computed with the following formula (Equation (2)):
s = 2 π 0 h r 1 + d r d l 2 d l
where h is the length of the trap log.
Differences in the density of infestation of the trap logs by pine shoot beetles were tested using the Kruskal–Wallis test [21].

2.3. Pine Stand Quality

As a measure of potential site productivity, pine quality classes were used [22]. Quality classes were determined based on the weighted mean height and age of the stand. Simultaneously with the laying of trap logs, the heights and diameters at breast height were measured for 100 randomly selected pines in Kraft class II (900 trees in total). The weighted mean height of pines in the stand was determined on the basis of a height curve. The relationship between height and diameter at breast height was smoothed using Näslund’s function [23] (Equation (3)):
h = d b h a + b · d b h 2 + 1.3
where h is the height of the tree (m), dbh is the diameter at breast height (cm), and a, b are equation parameters. Following smoothing of the height curve (performed by a computer by the least squares method) for particular stands, the smoothed height hadj was determined for a diameter subclass. The weighted mean height of a stand (Hl) was calculated from Lorey’s formula (Equation (4)):
H l = i = 0 n n · g · h s i = 0 n n · g
where n is the number of trees in the diameter subclass, g is the basal area for the subclass centre, and hs is the smoothed height. Pine quality classes were determined on the basis of tables of yield and growth for stands in Poland [22]. Pine quality classes are denoted in Poland by the Roman numerals Ia, I, II, III, IV, and V, where classes Ia and V correspond to the highest and lowest site productivity, respectively.

2.4. Evaluation of Biotic Interactions

The niche breadth ( B ^ ) was calculated using the measure given by Levins [24] (Equation (5)):
B i ^ = 1 / j n p i j 2
where pij is the proportion of species i found in the jth section, j is the trap log section, and n is the number of sections recorded.
To obtain a standardised niche breadth ( B ^ A ), expressed on a scale from 0.0 to 1.0, the measure given by Hurlbert [25] was used (Equation (6)):
B ^ A = B ^ 1 n 1
Standardisation enables the comparison of niche breadths computed from different numbers of resource states. A niche breadth of 1.0 means that species i colonises the sections of the trap logs uniformly. Differences in niche breadth for pine shoot beetles were tested using the Kruskal–Wallis test and a paired t test [21].
To evaluate the overlap of niches of pine shoot beetles, Morisita’s index of similarity was used [26]. According to Smith and Zaret [27] this is the best measure of overlap, because it has nearly zero bias at all sample sizes and also when there are a large number of resources. The formula is given in Equation (7):
C ^ = 2 j = 1 n p T p j · p T m j j = 1 n p T p j n T p j N T p j + j = 1 n p T m j n T m j N T m j
where C ^ is Morisita’s index of niche overlap between T. piniperda (Tp) and T. minor (Tm), pTpj and pTmj are the proportions of T. piniperda and T. minor found in the jth section, nTpj and nTmj are the numbers of individuals of T. piniperda and T. minor found in the jth section, and NTp and NTm are the total numbers of individuals of T. piniperda and T. minor on the trap log:
j = 1 n n T p j = N T p ,   j = 1 n n T m j = N T m
Differences between the niche overlaps of pine shoot beetles were checked using the t test for independent samples [21].
The hypothesis of the niche segregation of pine shoot beetles on one set of resource states was quantified using the estimate of the proportional similarity coefficient [28] based on the following Equation (9):
C = 1 0.5 j = 1 n p T p j p T m j
Following Hutchinson [29], pine shoot beetles were assumed to be segregated if the proportional similarity coefficient was less than 0.7. The difference between the theoretical and empirical values of the proportional similarity coefficient was evaluated using the one-sample t test [21].
These analyses were analysed using the STATISTICA statistical software package v 13.3 (StatSoft Inc., Tulsa, OK, USA, [30]).

2.5. T. piniperda Niche Model

To construct a model for the niche of T. piniperda, a method was applied whereby the empirical data were split into two sets [31,32,33]: the first to be used for parameterisation of the model, and the second for its validation. The division of trap logs was made separately for each stand, using a random number generator. In total, 128 trap logs were selected for use for parameterisation, and 131 for validation. At the stage of parameterisation of the model, the explanatory variables represented:
1.
habitat characteristics—site quality classes (Ia, I, II, III, IV and V), forest site type;
2.
tree characteristics—degree of damage to crown (crown damaged or undamaged);
3.
trap log characteristics—diameter in bark at the thicker end, length, stem surface area;
4.
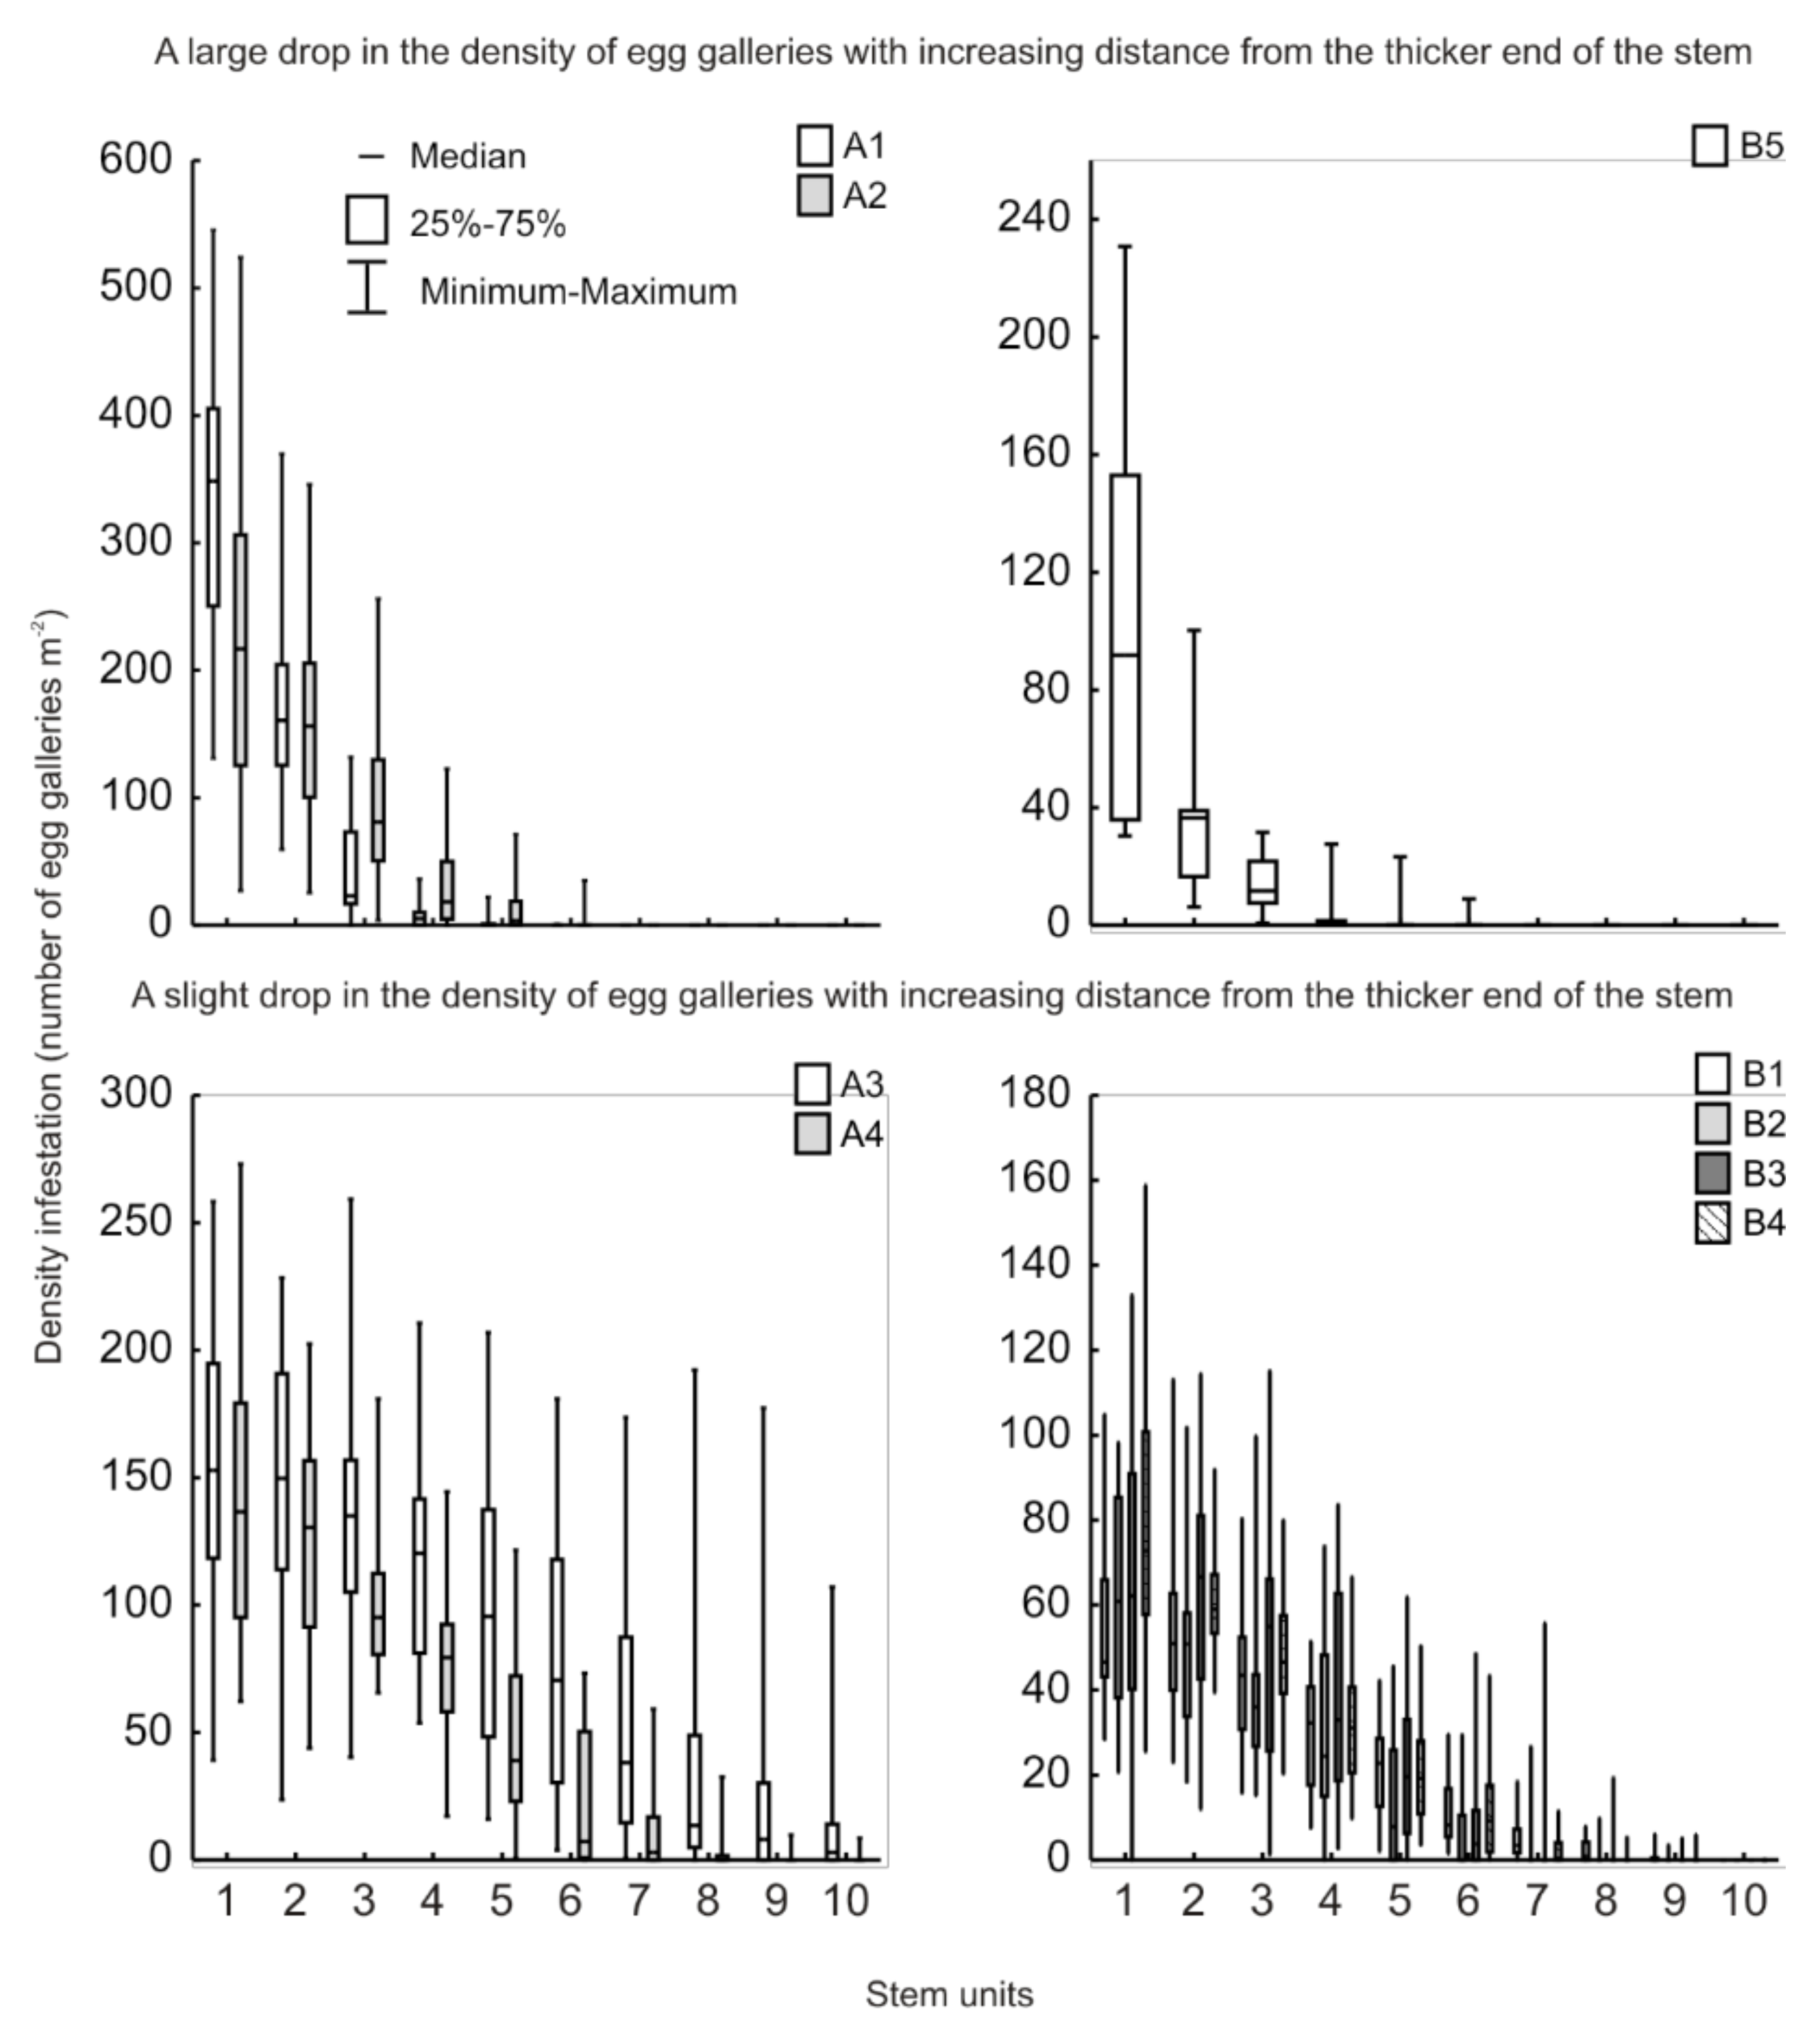
parameters of trap log colonisation—total colonisation density, range of colonisation of stems (1, 2, …, 10 correspond respectively to 10%, 20%, …, 100% of the length of the stem).
For description of the niche breadth of T. piniperda on trap logs, the following multiple linear regression model (MLRM) was used (Equation (10)):
B ^ a = b 0 + b 1 · r c + b 2 · p c + b 3 · s q c + ε  
where B ^ a is the niche breadth of T. piniperda on a trap log, rc is the range of colonisation of the trap log, pc is the degree of damage to the pine crown, sqc is the site quality class, b0, b1, b2, b3, b4 are parameters of the model, and ε is the error term. Habitat and tree characteristics were included in the model as dummy variables (1—the given instance has the characteristic, 0—the instance does not have the characteristic. Next, for each dummy variable, one auxiliary variable was eliminated from the model. The removed variables constitute a reference system for determination of the equation parameters. The parameters of such a model measure the effect of the variables included in the model in relation to the effect of the eliminated variable. In the selection of the auxiliary variables for the reference system, it was assumed that the T. piniperda niche breadth increases with an increase in (1) the range of occurrence of egg galleries on a trap log and (2) site productivity, and that it is greater on pines with undamaged crowns.
Prior to constructing a model that evaluated the niche of T. piniperda on the trap logs, the applicability of MLRM was tested by evaluating the linear relationships between the explanatory and explained variables. Next, the multicollinearity of the explanatory variables was analysed. For the detection of multicollinearity between explanatory variables, the variance inflation factor (VIF) [34] was used (Equation (11)):
V I F = 1 1 R 2
where R2 is the regression coefficient of determination of an explanatory variable on all other explanatory variables.
In the next step, the homoscedasticity distribution of regression residuals was analysed using White’s test [35] (Equation (12)):
W = nR2
where n is the number of observations and R2 is the coefficient of determination of the auxiliary regression expressed by the equation.
e 2 = b 0 + b 1 X 1 + b 2 X 2 + b 3 X 1 2 + b 4 X 2 2 + b 5 X 1 × X 2
The critical value of the test is χ2 = χ2α,p, where α is the level of significance and p is the number of variables in the auxiliary regression.
The critical area is given by the inequality (Equation (14)):
nR2 > χ2 p−1, α
Finally, the Shapiro–Wilk test was used to check whether the residuals were normally distributed.
The fit of the regression functions was evaluated using the adjusted coefficient of determination R a d j 2 (Equation (15)) and the root mean square error RMSE (Equation (16)) [36]:
R a d j 2 = 1 1 R 2 n 1 n k 1
where n is the number of observations and k is the number of explanatory variables;
R M S E = i = 1 n Y i Y ^ i 2 n k 1
where Yi is the actual observation of the explained variable, Y i ^ is the predicted value of the observation.
The accuracy of the method was assessed separately for each stand. The niche breadth ( B ^ ) of T. piniperda was computed for individual trap logs: (1) based on the number of egg galleries counted in particular sections of the trap log ( B ^ o ) and (2) using the developed method ( B ^ p ). For all trap logs in a stand, the sampled mean of the niche breadth of T. piniperda on the entire stem, B ¯ , is an unbiased estimator for B ^ [37] (Equations (17) and (18)):
B ¯ = 1 n i = 1 n B ^ i
s 2 = 1 n 1 i = 1 n B ^ i B ¯ 2
where B ¯ and s2 are the average and variance, respectively, of the B ^ -values in a sample, and n is the sample size (the total number of P. sylvestris trap logs in the sample).
Differences between the observed mean niche breadth B ¯ o and the predicted value B ¯ p were tested by means of the dependent samples t test [21].

3. Results

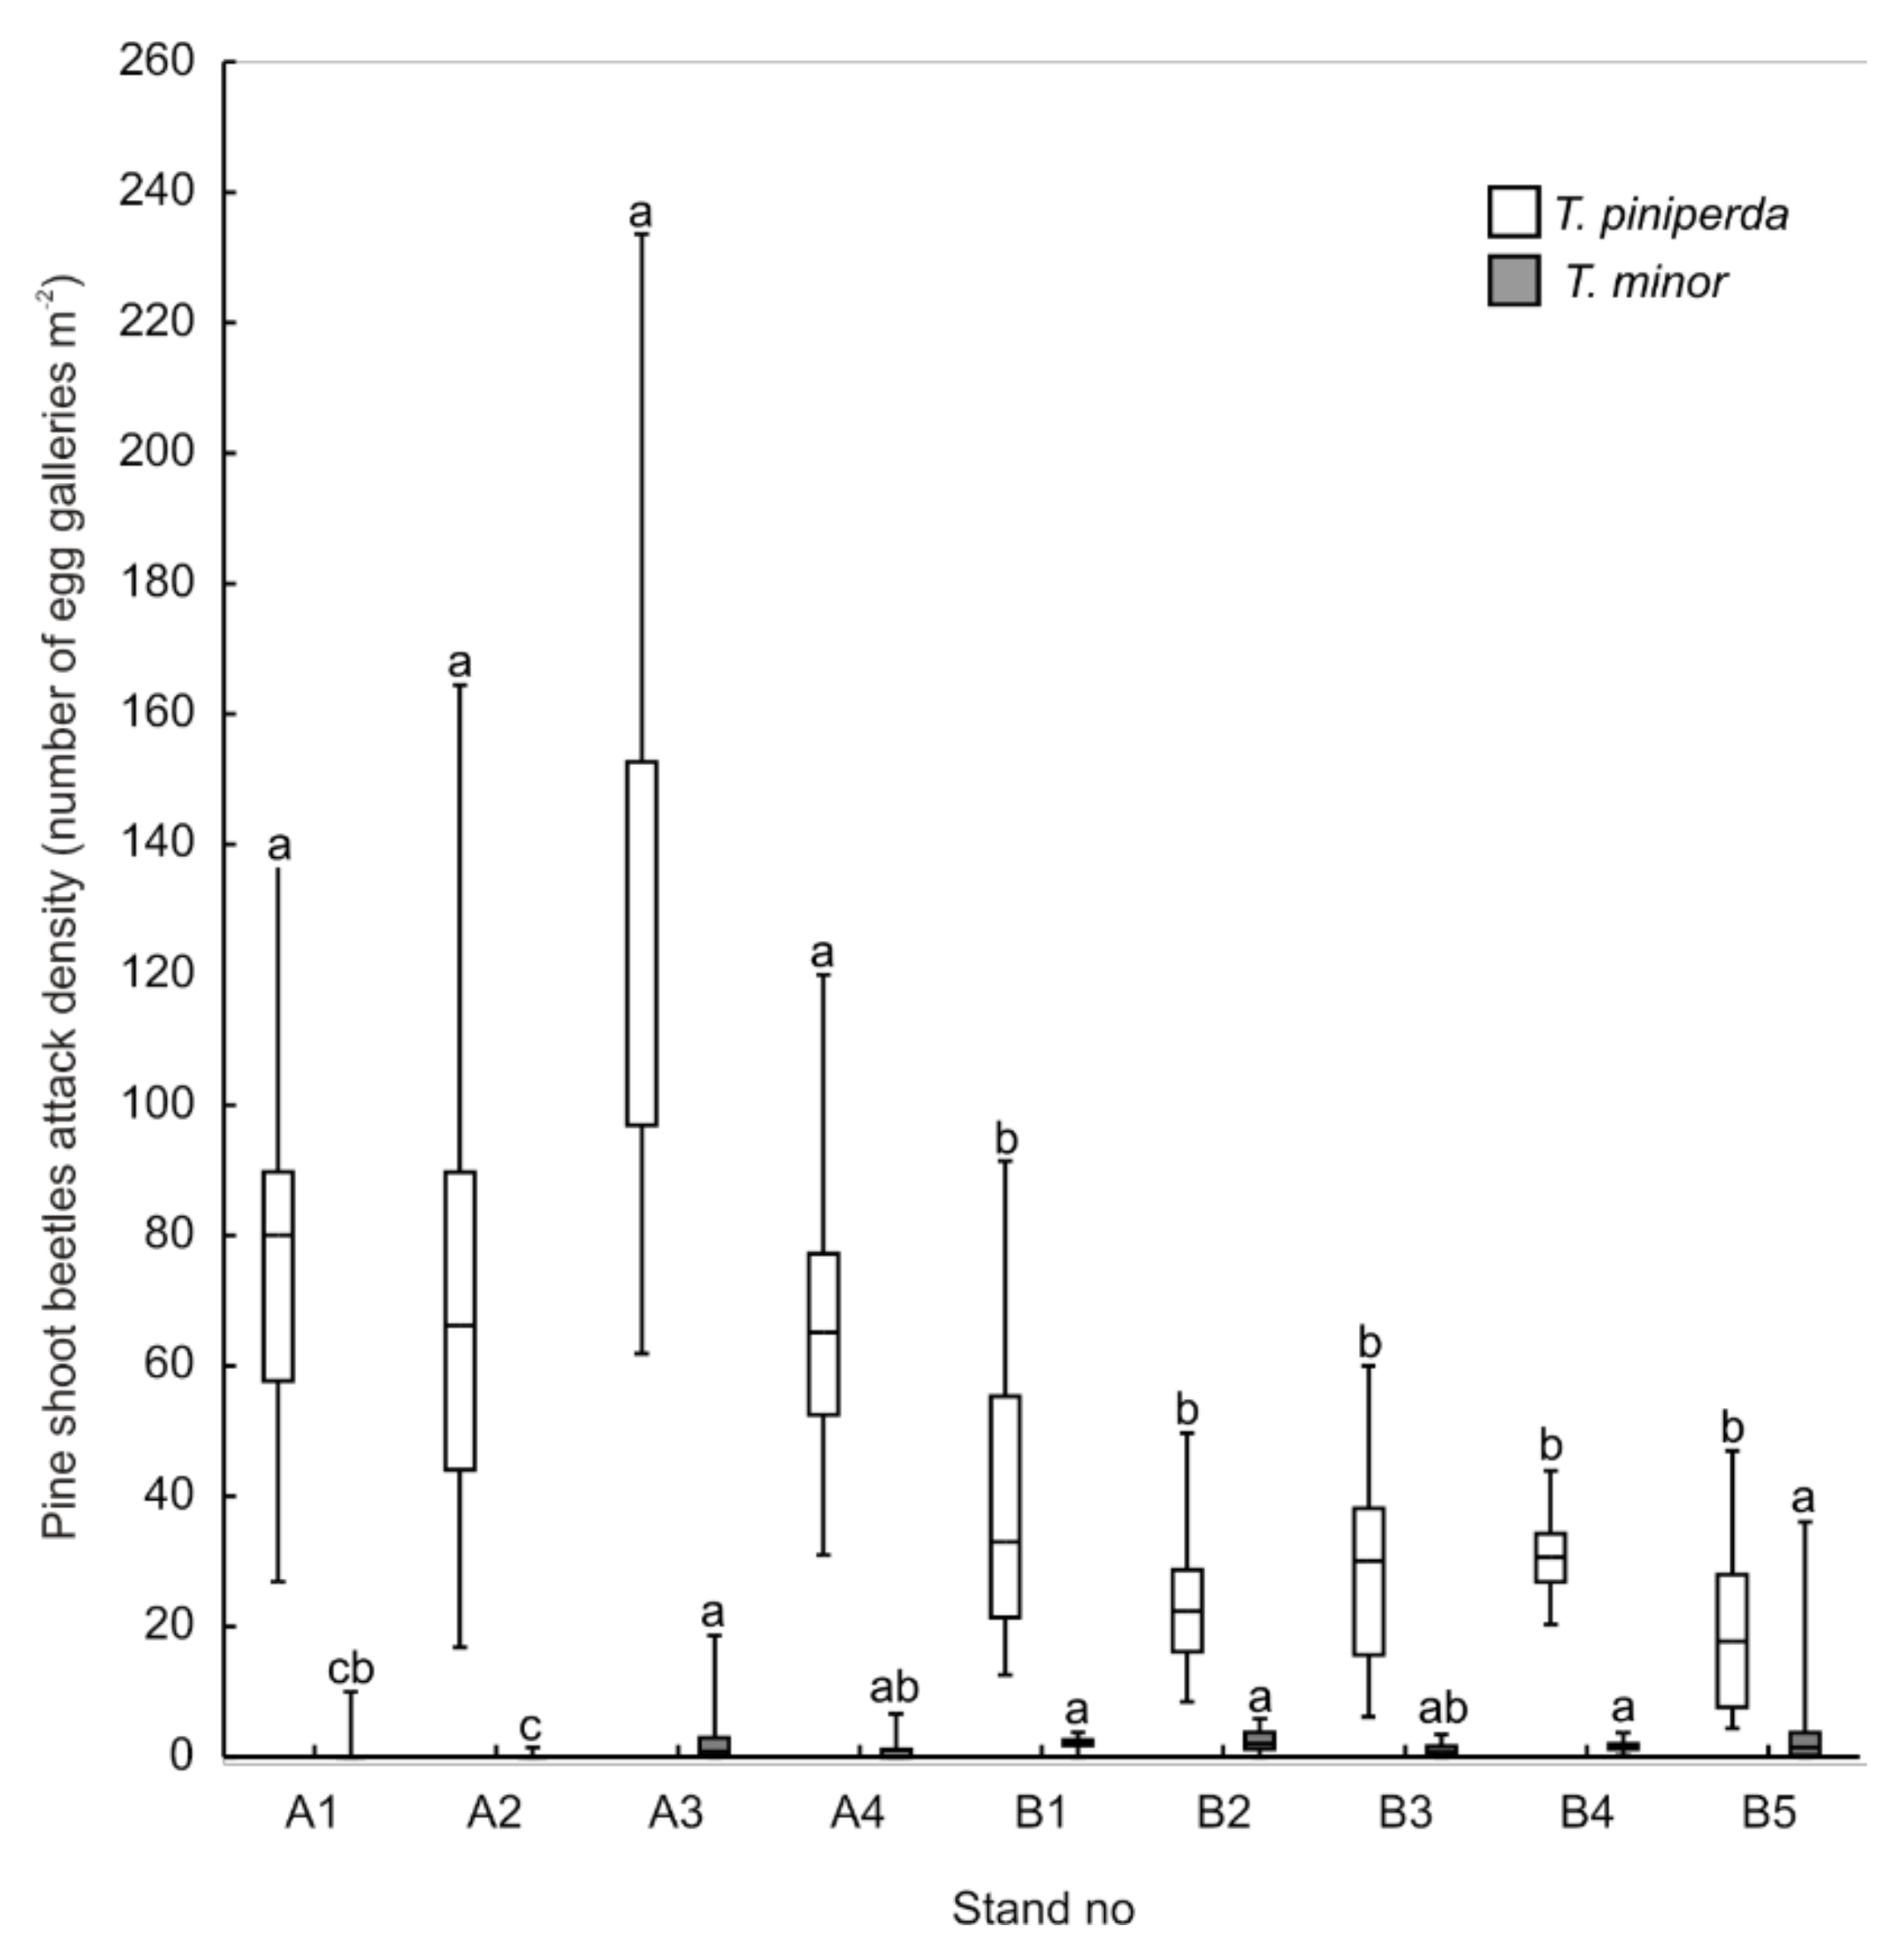
3.1. Colonisation of Trap Logs by Pine Shoot Beetles

Entomological analyses were performed for a total of 9560 trap log sections, on which 90,501 egg galleries of pine shoot beetles were counted. The proportion of other species of bark beetles was less than 0.1%. Tomicus piniperda was the dominant species (n = 88, 272 egg galleries, approximately 98% of the total) and was found on all of the trap logs. Tomicus minor was found on 149 trap logs (85%) in undamaged stands and on 11 trap logs (13%) in damaged stands. Colonisation of trap logs by T. piniperda was higher in group A stands than in group B stands (Kruskal–Wallis test: H (8, n = 259) = 159.9, p < 0.001; Figure 4. No such difference was identified for T. minor. In general, colonisation of trap logs by T. minor in damaged stands was lower than in undamaged stands (Kruskal–Wallis test: H (8, n = 259) = 131.9, p < 0.001; Figure 4. Only in stand A1 was there no difference from the level of colonisation in stands A4 and B3.
Tomicus piniperda was found most frequently in thicker parts of the stem. There is a slight drop (stands A3, A4, B1–B4) or a large drop (stands A1, A2, B5) in the density of egg galleries with increasing distance from the thicker end of the stem (Figure 5).
Tomicus minor was found most frequently in thinner parts of the stem; the density of egg galleries falls off more or less regularly with increasing distance from the unit with maximum colonisation. In conditions of low density of infestation of trap logs and low pine stand quality (stand B4), T. minor colonised the thicker part of stems exclusively (Figure 6).
The results show that natural traps are an effective method of reducing pine shoot beetle populations, while a timber yard is a significant source of reproduction of T. piniperda.

3.2. Pine Stand Quality

In the stands in group A, pine stand quality increases together with the distance of the stand from a timber yard. The pine quality classes for stands A1, A2, A3, and A4 are respectively V, III, II, and Ia. In the group B stands the quality class is III, except for stand B5 (class IV).
The results show that in stands in the vicinity of a timber yard, substantial growth losses can be expected, which may be considered to represent degradation in the site quality for the production of pine.

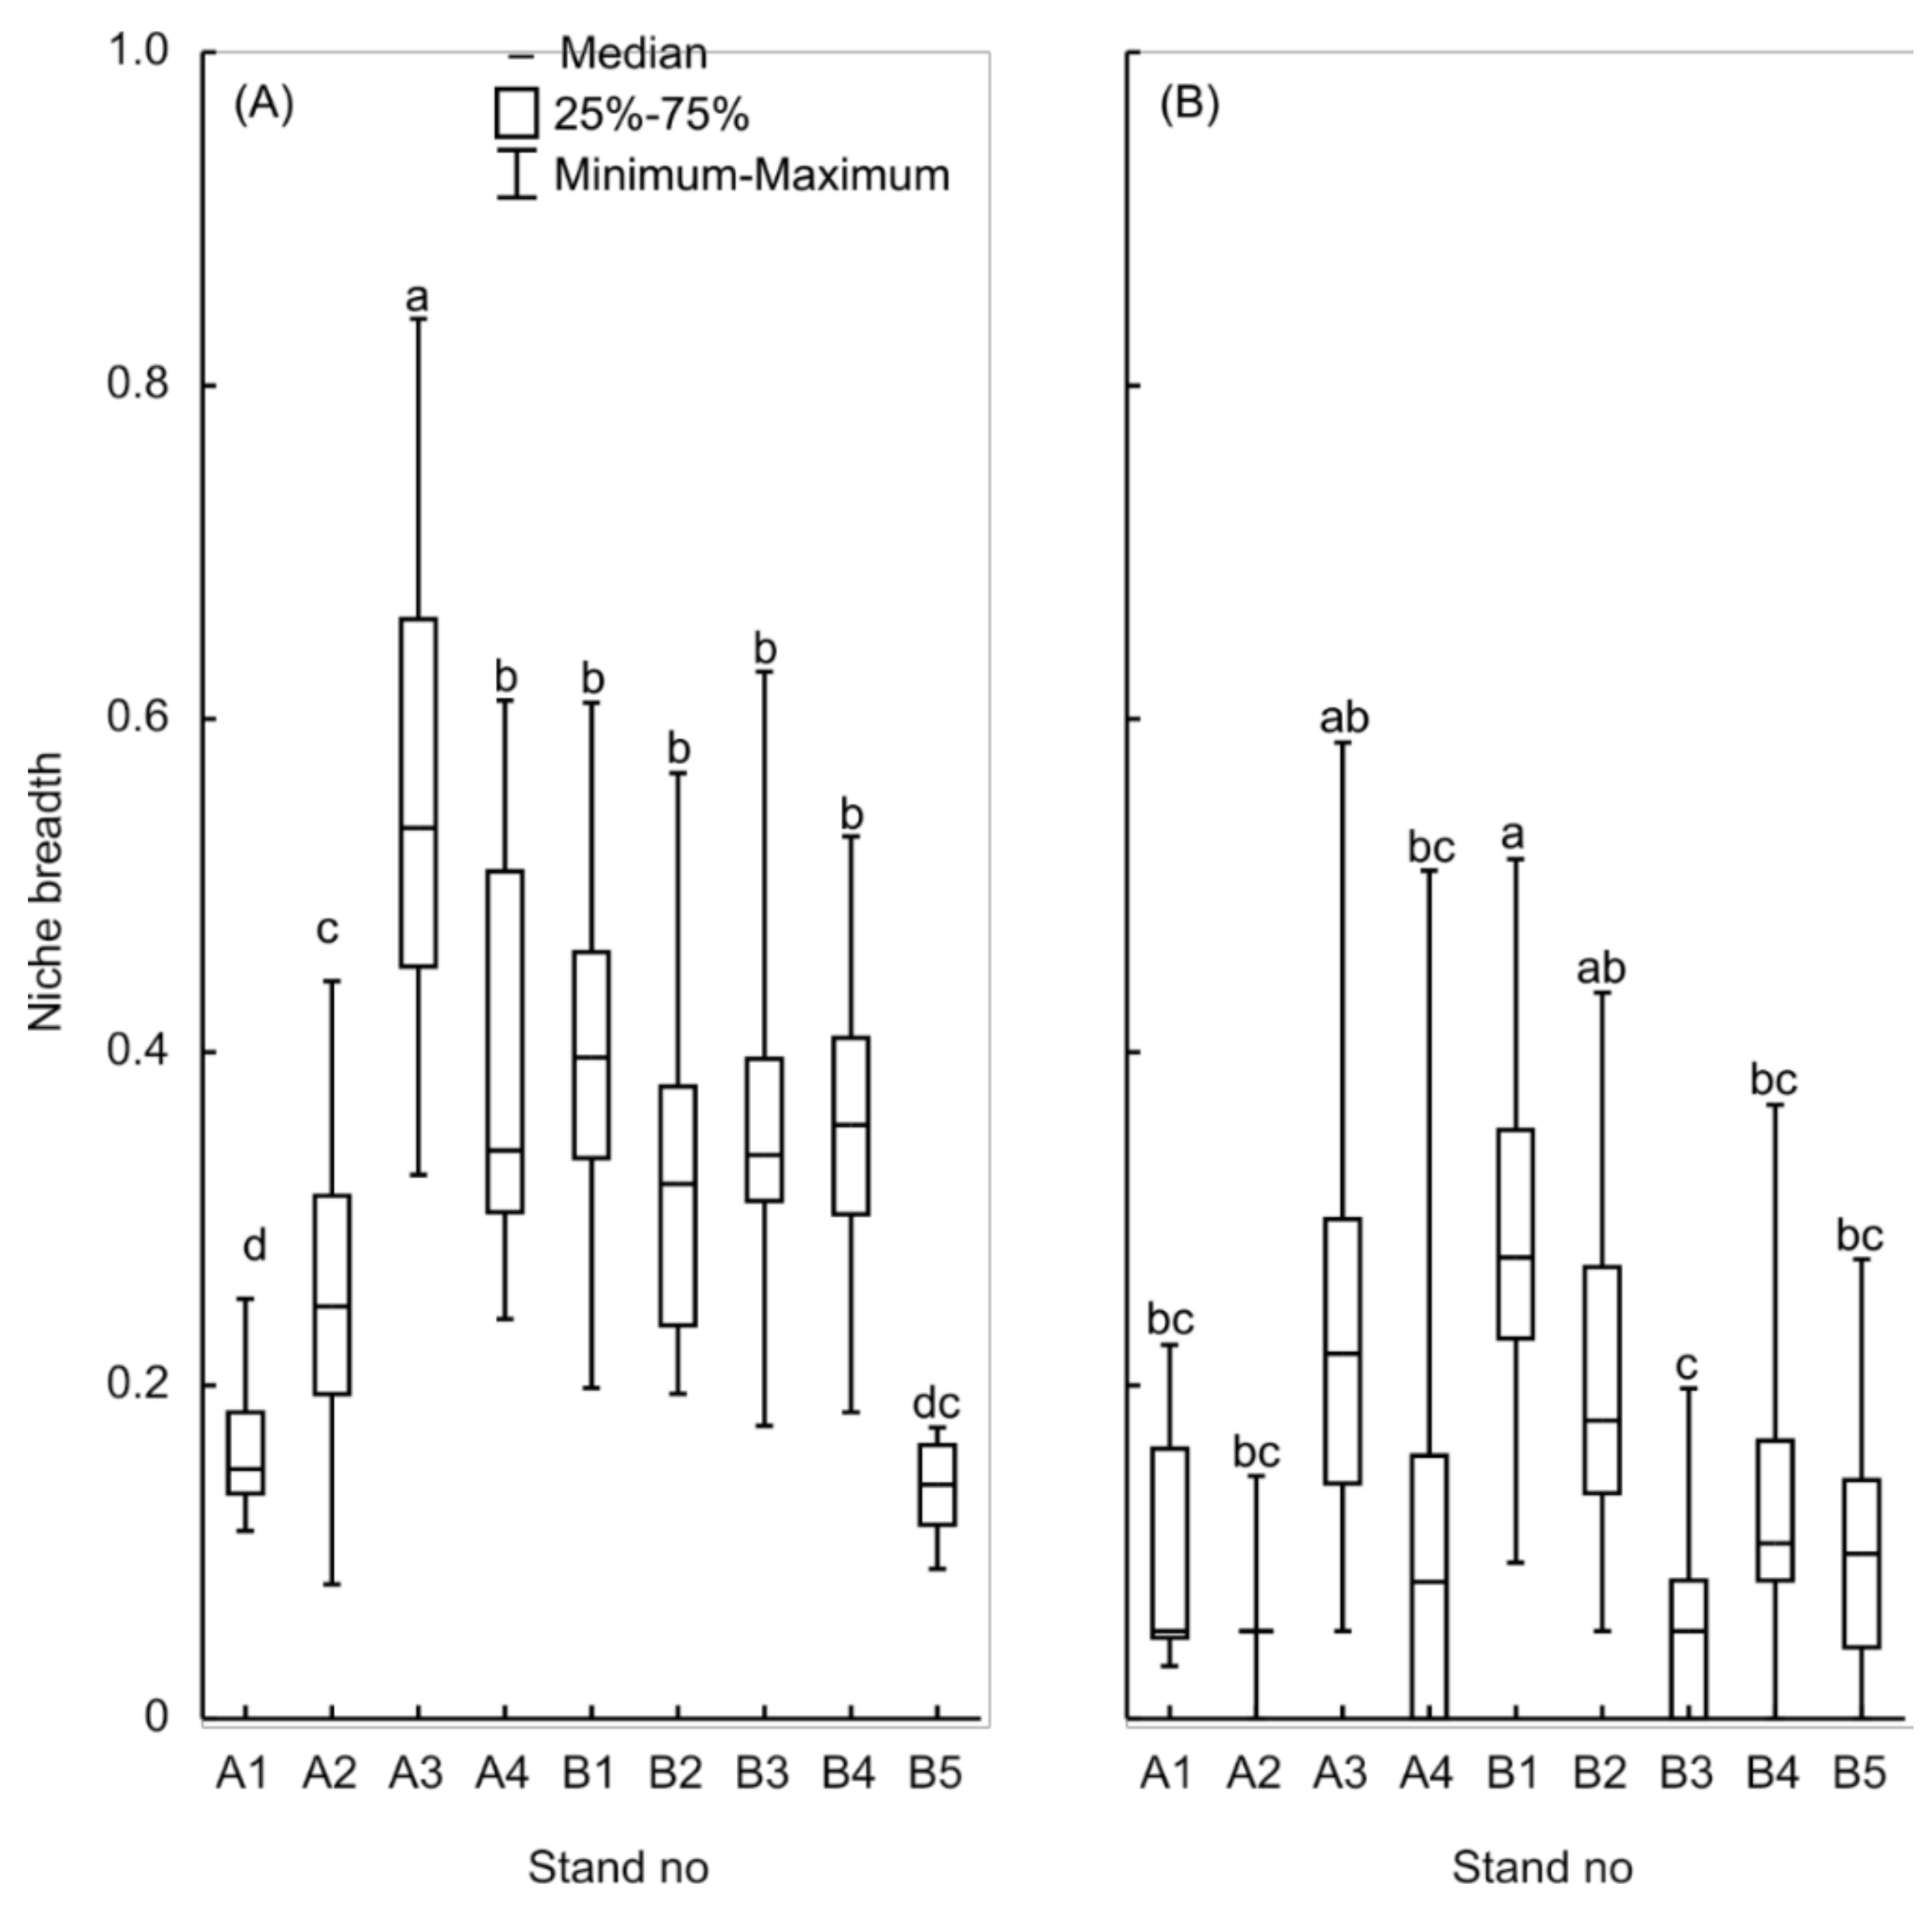
3.3. Biotic Interactions in Populations of Pine Shoot Beetles

Generally, the niche breadth (the range in which the resources of the trap log are exploited by larvae and adults) of T. piniperda grows with increasing pine stand quality (Kruskal–Wallis test: H (8, n = 259) = 154.6, p < 0.001; Figure 7A). The niche breadth is greatest in stand A3 and smallest in stands A1 and B5. The niche breadth in stand A2 is greater than in A1, but smaller than in A3, A4, B1, B3, and B4. In the case of T. minor, the niche breadth is greater in stand B1 than in A1, A2, A4, B3, B4, and B5, and the niche breadth in stand A3 is greater than in B3 (Kruskal–Wallis test: H (8, n = 161) = 78.6281, p < 0.001; Figure 7B).
In most of the stands the niche breadth for T. piniperda is greater than that for T. minor (t test, p < 0.05; Table 2). In stands A1 and B5 the two species have similar niche breadths.
The coexistence of pine shoot beetles was strongest in stands A3 and B5, and weakest in stands A1 and A2 (Kruskal–Wallis test: H (8, n = 161) = 87.1, p < 0.001; Figure 8). The indices of niche overlap in stands A4 and B1 were higher than in B4.
Niche segregation of pine shoot beetles was found in all stands. Values of the proportional similarity coefficient were smaller than the theoretical value of 0.7 (t-test, p < 0.05; Table 3).
The results point to the spatial specialisation of pine shoot beetles and the high competitive effectiveness of T. piniperda in obtaining reproduction sites.

3.4. Tomicus Piniperda Niche Model

As a result of regression modelling, from the set of variables representing characteristics of habitats, trees and trap logs and the parameters of infestation, the following explanatory variables were selected: range of colonisation of a trap log (rc), site quality class (sqc), and crown undamaged (cu). The explanatory variables included in the MLRM model explain to a significant degree (p < 0.05) the niche breadth of T. piniperda on trap logs (Equation (19)):
B ^ a = 0.0604 + 0.0486 · r c + 0.0697 · s q c I I I + 0.0796 · s q c I I I + 0.0468 · c u + ε
Statistical parameters of the model are given in Table 4. The proportion of variance explained within the model is greater than 80% ( R a d j 2 = 0.8132 ) . The high value of the coefficient of determination means that the MLRM well describes the observed variation in the T. piniperda niche breadth. The mean relative error of estimation is 17.9%. The greatest influence on the niche breadth comes from the range of colonisation of trap logs by T. piniperda. This, as an independent explanatory variable in the model, explains approximately 75% of the variation in the niche parameter. Among the site quality classes used in the model, the fourth and second classes were insignificant (p > 0.05). No significant relationship was found between the niche breadth and features of trap logs (diameter in bark at the thicker end, length, stem surface area) or the T. piniperda population density. These features did not increase the explained variance, described by the adjusted coefficient of determination, and were not significant in the MLRM.
The results show that, in order to describe the niche of T. piniperda, the regression equation should include the range of colonisation of a trap log, the site quality class, and the degree of crown damage.

3.5. Evaluation of Accuracy of the Method

The accuracy of the method was verified in nine stands, using a sample consisting of 131 trap logs selected at the stage of model validation (see the Material and Methods section). On each trap log the T. piniperda niche breadth B ^ o was calculated, and then the mean niche breadth B ¯ o was estimated for the stand. The accuracy of the method was assessed by comparing the observed indicator of niche breadth on the trap logs, B ^ o , with the predicted value B ^ p computed using the model. In the stands, the observed niche breadth value B ¯ o and the predicted value B ¯ p did not differ significantly (t test, p > 0.05; Table 5).
The results show that, the developed method for evaluating the niche breadth of T. piniperda is effective.

4. Discussion

4.1. Pine Stand Quality

The correlation of the spatial distribution of pine quality classes with crown damage in the stands in group A indicates that losses in tree height growth in damaged stands are caused by feeding in the crowns by beetles migrating from the timber yard. The observed pattern of dispersion of the population is confirmed by studies using marked beetles [6]—see the Material and Methods section. Studies confirm that losses in tree height growth occur when the leader shoot is damaged, but there are different findings as to the time needed for its reconstruction, which may be from 2 to 9 years [8,38] (Figure 9).
In stand A1 all of the leader shoots were damaged, and consequently the pine stand quality, which is determined on the basis of the weighted mean height, was the lowest. Stand A2 had a lower quality class than stands A3 and A4, although the leader shoots were not damaged. Previous research in the stands of group A [17] indicated that the leader shoots may have been damaged in a period of heavy feeding by pine shoot beetles between 1940 and 1980. A study by Nilsson [39] showed that secondary outbreaks in a stand resemble the effect of wave propagation. In subsequent years the number of damaged shoots in the edge part of the stand was found to decrease, while at a greater distance the number increased. According to Långström and Hellqvist [7] the change in the spatial distribution of damaged shoots year by year probably reflects changes in the distribution of the population of pine shoot beetles in the stand. This may be caused by the absence of shoots of suitable thickness in particular parts of the stand. It may thus be assumed that, in the absence of shoots of adequate quality in stand A1, the beetles migrated further, causing damage to leader shoots in stand A2. The reconstruction of leader shoots in stand A2 was made possible by changes in the way wood was stored at the timber yard. A reduction in the quantity of wood stored, and the successive removal of bark, led to a fall in the population of pine shoot beetles. This is indicated by the similar values of 10-year mean periodic radial increment at breast height in the years 1984–2003 in the stands of group A [17].

4.2. Nutritional Suitability of Stems

The niche parameter for T. piniperda increases in value with increasing site productivity (Figure 5A). This relationship shows that the nutritional suitability of stems is greater in the case of trees with higher dendrometric parameters. Similar relationships have been shown for the same species on P. sylvestris and P. radiata in northern Spain [13]. Comparison of the niche parameters of T. piniperda in stands of quality class III shows that the niche breadth in stand A2 is smaller than expected. This indicates that feeding by beetles in the crowns has a greater negative effect on the nutritional suitability of stems than on site productivity. Two colonisation indicators point to the low nutritional suitability of stems in damaged stands: colonisation of trap logs in the thicker part of the stem by T. piniperda, and the frequency of T. minor. In the first case, T. piniperda colonises trap logs in conditions of strong competitive pressure. The position of the median indicates that the infestation density of 75% of trap logs in the thickest part exceeds the level of 130 egg galleries per m2, above which intraspecific competition occurs [19]. In the second case, in the damaged stands T. minor colonised only 13% of trap logs, while in the undamaged stands this rose to 85%. It should be noted that the pines in stands A1 and A2 were subject to intense stress during their whole period of growth due to feeding by beetles in the crowns [9,17]. The continuous damage to shoots may have had an impact on the physiological condition of the trees, and consequently lowered the nutritional suitability of the stems. Research has shown that simultaneous damage to shoots and needles has a greater weakening effect on photosynthesis than the loss of needles alone [40]. Damage to leader shoots causes disturbances in the regulation of growth by the phytohormone IAA.
The reason for the strong coexistence of pine shoot beetles in stand B5 in conditions of low quality (class IV) is the exclusive colonisation of the thicker part of stems by T. minor in conditions of low population density (Figure 4). Generally, T. minor prefers the thinner part of the stem [41], as is confirmed by the results of the present study (Figure 4). Only in southern China, on standing trees of the species P. yuannensis, is T. minor reported to prefer the base of the trunk [42]. Spatial specialisation in the colonisation of stems by bark beetles is determined mainly by bark thickness [2], but it does not necessarily occur [43]. Some studies indicate that species present on the thicker part of the stem may also colonise the thinner part [13], but not exclusively.
In all study areas, niche segregation of the two pine shoot beetle species was observed (Table 3). Generally, T. piniperda colonised the thicker part and T. minor the thinner part of the stem, in accordance with the pattern of colonisation of Scots pine [19]. Earlier swarming means that T. piniperda is the first and dominant species colonising the stems. This is reflected by the greater niche breadth of T. piniperda in most of the stands (Table 2). The significant impact of the swarming date on niche breadth has been reported in studies of pine bark beetles [13] and of other groups of insects, such as aphids attacking tree shoots [44]. An additional factor favouring niche segregation may be food specialisation in the case of T. minor. This is a phloeomycetophagous species, of which the old larvae and young adults feed on conidia and mycelium of O. tingens [45]. The colonisation strategy of T. minor may be determined by environmental factors that affect the development of fungi. These may be generally more favourable in the thinner part of the stem or on stems of smaller diameter.

4.3. Model Evaluation and Validation

The validation of the model did not indicate differences between the observed and predicted values of the mean niche breadth of T. piniperda on trap logs. The universality of the method is a consequence of its effectiveness in varied conditions. The trap logs were placed in stands that differed in terms of: (1) T. piniperda population density; (2) site productivity; (3) forest site type; and (4) degree of damage to pine crowns. In the context of climate change, the fact that the research was carried out over many years means that the method can be expected to offer greater resistance to the effect of environmental factors over a long period. The significant effect of climate variation on, for example, the start of flying of pine shoot beetles has been confirmed, among others, by research carried out in Sweden [10,46].
The method enables evaluation of the niche breadth of T. piniperda on pine stems. Combined with survey sampling, it enables evaluation of the niche breadth within a stand [47]. The method includes the following stages:
1.
Sample selection—determination of the number and distribution of P. sylvestris stems;
2.
Estimation of niche breadth on the P. sylvestris stems selected in stage 1;
3.
Estimation of the mean and confidence intervals for the T. piniperda niche breadth in a stand.
The second of these stages is based on the results of the present work, and includes the following steps (see the Material and Methods section):
1.
determination of the range of occurrence of galleries on stems;
2.
evaluation of pine stand quality;
3.
evaluation of the degree of damage to pine crowns.
The method has been developed for P. sylvestris trap logs, and may be used for P. sylvestris windfalls. In recent years, breeding material of this type has been widespread in the majority of stands. Fallen pines, deprived of their defence mechanisms, are colonised during the first or second growing season [18,19]. In the case of large-area wind damage to stands, the selection of a representative sample for a studied population may be assisted by remote sensing [18] and aerial photography [48].

5. Conclusions

The niche segregation of pine shoot beetles found in all stands points to the significant role of spatial specialisation as a mechanism reducing the strong competition between the two species of beetles for phloem resources. Tomicus piniperda prefers the thicker part of the stem, and T. minor the thinner part. In conditions of low nutritional suitability of stems and low population density, T. minor may colonise the thicker part of stems exclusively.
Feeding by pine shoot beetles in the crowns of pines reduces site productivity and the nutritional suitability of stems. In damaged stands, the niches of pine shoot beetles are narrow and strongly segregated, and the frequency of T. minor is very low. The nutritional suitability of stems for T. piniperda increases as the pine quality class improves. T. piniperda is a species of high competitive strength and effectiveness. In conditions of high nutritional suitability of stems, it wins the competition with T. minor for sites for feeding and reproduction.
Data on the niches of pine shoot beetles may be valuable in climate-related research. It is expected that warming of the climate will cause the weakening of tree stands, and in consequence a significant increase in breeding material for bark beetles. In a theoretical context, the niche parameter may be used as a measure in evaluating the possible consequences of changes in biotic and abiotic factors for organismal fitness. In a practical dimension, data of this type may provide an initial basis for the construction of models enabling evaluation of the size of bark beetle populations.

Funding

This study was funded by The Ministry of Science and Higher Education in Poland (grant number SUPB.RN 21.233).

Institutional Review Board Statement

Not applicable.

Informed Consent Statement

Not applicable.

Data Availability Statement

The data presented in this study are available on request from the corresponding author.

Acknowledgments

The author would like to thank the workers of Forest District in Dynów, Janów Lubelski, Jędrzejów, Koniecpol, Przedbórz and Zagnańsk for guidance and assistance in carrying out this research.

Conflicts of Interest

The authors declare no conflict of interest.

References

  1. Wood, S.L. The bark and ambrosia beetles of North and Central America (Coleoptera: Scolytidae), a taxonomic monograph. Great Basin Nat. Mem. 1982, 6, 1–1359. [Google Scholar]
  2. Grünwald, M. Ecological segregation of bark beetles (Coleoptera, Scolytidae) of spruce. Zeitschr. Angew. Entomol. 1986, 101, 176–187. [Google Scholar] [CrossRef]
  3. Rankin, L.J.; Borden, J.H. Competitive interactions between the mountain pine beetle and the pine engraver in lodgepole pine. Can. J. For. Res. 1991, 21, 1029–1036. [Google Scholar] [CrossRef]
  4. Flechtmann, C.A.H.; Dalusky, M.J.; Berisford, C.W. Bark and ambrosia beetle (Coleoptera: Scolytidae) responses to volatiles from aging loblolly pine billets. Environ. Entomol. 1999, 28, 638–648. [Google Scholar] [CrossRef]
  5. Saint-Germain, M.; Drapeau, P.; Buddle, C.M. Landing patterns of phloem- and wood-feeding Coleoptera on Black spruce of different physiological and decay states. Environ. Entomol. 2009, 38, 797–802. [Google Scholar] [CrossRef] [PubMed]
  6. Barak, A.V.; McGrevy, D.; Tokaya, G. Dispersal and re-capture of marked, overwintering Tomicus piniperda (L.) (Coleoptera: Scolytidae) from Scotch pine bolts. Great Lakes Entomol. 2000, 33, 69–80. [Google Scholar]
  7. Långström, B.; Hellqvist, C. Spatial distribution of crown damage and growth losses caused by recurrent attacks of pine shoot beetles in pine stands surrounding a pulp mill in southern Sweden. J. Appl. Entomol. 1990, 110, 261–269. [Google Scholar] [CrossRef]
  8. Långström, B.; Hellqvist, C. Shoot damage and growth losses following three years of Tomicus-attacks in Scots pine stand close to a timber storage site. Silva Fenn. 1991, 25, 133–145. [Google Scholar] [CrossRef]
  9. Borkowski, A. Threats to pine stands by the pine shoot beetles Tomicus piniperda (L.) and T. minor (Hart.) around a sawmill in southern Poland. J. Appl. Entomol. 2001, 125, 489–492. [Google Scholar] [CrossRef]
  10. Öhrn, P. Seasonal Flight Patterns of the Spruce Bark Beetle (Ips typographus) in Sweden. Phenology, Voltininsm and Development. Licentiate Thesis, Swedish University of Agricultural Sciences, Uppsala, Sweden, 2012; pp. 1–42. [Google Scholar]
  11. Carscadden, K.A.; Emery, N.C.; Arnillas, C.A.; Cadotte, M.W.; Afkhami, M.E.; Gravel, D.; Livingstone, S.W.; Wiens, J.J. Niche breadth: Causes and consequences for ecology, evolution, and conservation. Quart. Rev. Biol. 2020, 3, 179–214. [Google Scholar] [CrossRef]
  12. Paine, T.D.; Birch, M.C.; Švihra, P. Niche Breadth and resource partitioning by four sympatric species of bark beetles (Coleoptera: Scolytidae). Oecologia 1981, 48, 1–6. [Google Scholar] [CrossRef] [PubMed]
  13. Amezaga, I.; Rodríguez, M.A. Resource partitioning of four sympatric bark beetles depending on swarming dates and tree species. For. Ecol. Manag. 1998, 109, 127–135. [Google Scholar] [CrossRef]
  14. Borkowski, A.; Skrzecz, I. Ecological segregation of bark beetles (Col., Curculionidae, Scolytinae) in Scots pine. Ecol. Res. 2016, 31, 135–144. [Google Scholar] [CrossRef] [Green Version]
  15. Liu, Y.J.; Gao, B.T.; Ren, L.L.; Zong, S.X.; Ze, S.Z.; Luo, Y.Q. Niche-based relationship between sympatric bark living insect pests and tree vigor decline of Pinus yunnanensis. J. Appl. Entomol. 2019, 143, 1161–1171. [Google Scholar] [CrossRef]
  16. Lieutier, F.; Långström, B.; Faccoli, M. The Genus Tomicus. In Bark Beetles: Biology and Ecology of Native and Invasive Species; Vega, F.E., Hofstetter, R.W., Eds.; Elsevier Academic Press: Amsterdam, The Netherlands, 2015; pp. 371–426. [Google Scholar]
  17. Borkowski, A. A spatial distribution of losses in growth of trees caused by feeding of pine shoot beetles Tomicus piniperda and T. minor (Col., Scolytidae) in Scots pine stands growing within the range of influence of a timber yard in southern Poland. J. For. Sci. 2006, 52, 130–135. [Google Scholar] [CrossRef] [Green Version]
  18. Grégoire, J.C.; Evans, H.F. Damage and control of BAWBILT organisms an overview. In Bark and Wood Boring Insects in Living Trees in Europe, a Synthesis; Lieutier, F., Day, K.R., Battisti, A., Grégoire, J.C., Evans, H.F., Eds.; Springer: Dordrecht, The Netherlands, 2004; pp. 19–37. [Google Scholar] [CrossRef]
  19. Långström, B.; Hellqvist, C.; Ehnström, B. Distribution and production of Tomicus piniperda in pine wood stacks. Sver. Skogs. Tidskr. 1984, 82, 23–35. [Google Scholar]
  20. Inoue, A. A model for the relationship between form-factors for stem volume and those for stem surface area in coniferous species. J. For. Res. 2006, 11, 289–294. [Google Scholar] [CrossRef]
  21. Sokal, R.R.; Rohlf, F.J. Biometry: The Principles and Practice of Statistics in Biological Research, 4th ed.; W. H. Freeman and Co.: New York, NY, USA, 2012; pp. 1–887. [Google Scholar]
  22. Szymkiewicz, B. Tablice Zasobności i Przyrostu Drzewostanów; PWRiL: Warszawa, Poland, 2019; pp. 1–179. [Google Scholar]
  23. Näslund, M. Antalet prowtråd och hójdkurwans noggrannhet. Medd. Stat. Skogs. 1929, 25, 1–170. [Google Scholar]
  24. Levins, R. Evolution in Changing Environments: Some Theoretical Explorations; Princeton University Press: Princeton, NJ, USA, 1968; pp. 1–120. [Google Scholar]
  25. Hurlbert, S.H. The measurement of niche overlap and some relatives. Ecology 1978, 59, 67–77. [Google Scholar] [CrossRef]
  26. Morisita, M. Measuring of interspecific association and similarity between communities. Mem. Faculty Sci. Kyushu Univ. Ser. E 1959, 3, 65–80. [Google Scholar]
  27. Smith, E.P.; Zaret, T.M. Bias in estimating niche overlap. Ecology 1982, 63, 1248–1253. [Google Scholar] [CrossRef]
  28. Feinsinger, P.E.; Spears, E.; Poole, R.W. A Simple measure of niche breadth. Ecology 1981, 62, 27–32. [Google Scholar] [CrossRef]
  29. Hutchinson, G.E. Homage to Santa Rosalia, or why are there so many kinds of Animals? Am. Nat. 1959, 93, 145–159. [Google Scholar] [CrossRef] [Green Version]
  30. StatSoft Inc. Statistica for Windows; StatSoft Inc.: Tulsa, OK, USA, 2020. [Google Scholar]
  31. Adlard, P.G. Myth and reality in growth estimation. For. Ecol. Manag. 1995, 71, 171–176. [Google Scholar] [CrossRef]
  32. Soares, P.; Tome, M.; Skovsgaard, J.P.; Vanclay, J.V. Evaluating a growth model for forest management using continuous forest inventory data. For. Ecol. Manag. 1995, 71, 251–265. [Google Scholar] [CrossRef]
  33. Kozak, A.; Kozak, R. Does cross validation provide additional information in the evaluation of regression models? Can. J. For. Res. 2003, 33, 976–987. [Google Scholar] [CrossRef]
  34. O’brien, R.M. A Caution regarding rules of thumb for variance inflation factors. Qual. Quant. 2007, 41, 673–690. [Google Scholar] [CrossRef]
  35. White, H.A. Heteroskedasticity-Consistent Covariance Matrix Estimator and a Direct Test for Heteroskedasticity. Econometrica 1980, 48, 17–838. [Google Scholar] [CrossRef]
  36. Temesgen, H.; Gadow, K. Generalized height–diameter models—an application for major tree species in complex stands of interior British Columbia. Eur. J. For. Res. 2004, 123, 45–51. [Google Scholar] [CrossRef]
  37. Thompson, S.K. Sampling; Wiley: New York, NY, USA, 2012; pp. 1–472. [Google Scholar] [CrossRef]
  38. Piene, H. Spruce budworm defoliation and growth loss in young balsam fir recovery of growth in spaced stands. Can. J. For. Res. 1989, 19, 1616–1624. [Google Scholar] [CrossRef]
  39. Nilsson, S. Increment losses caused by Blastophagus piniperda on Scots pine. R. Coll. For. Dept. Operat. Effic. Res. Notes 1974, 78, 1–64. [Google Scholar]
  40. Ericsson, A.; Hellqvist, C.; Långström, B.; Larsson, S.; Tenow, O. Effects on growth of simulated and induced shoot pruning by Tomicus piniperda as related to Carbohydrate and nitrogen dynamics in Scots pine. J. Appl. Ecol. 1985, 22, 105–124. [Google Scholar] [CrossRef]
  41. Bakke, A. Ecological studies on bark beetles (Coleoptera Scolytidae) associated with Scots pine (Pinus sylvestris) in Norway with particular reference to the influence of temperature. Medd. Nor. Skog. 1968, 21, 443–602. [Google Scholar]
  42. Hui, Y.; Xue-Song, D. Impacts of Tomicus minor on distribution and reproduction of Tomicus piniperda (Col., Scolytidae) on the trunk of the living Pinus yannanensis trees. J. Appl. Entomol. 2001, 123, 329–333. [Google Scholar] [CrossRef]
  43. Raffa, K.F.; Grégoire, J.C.; Lindgren, B.S. Natural history and ecology of bark beetles. In Bark Beetles: Biology and Ecology of Native and Invasive Species; Vega, F.E., Hofstetter, R.W., Eds.; Elsevier Academic Press: Amsterdam, The Netherlands, 2015; pp. 1–40. [Google Scholar] [CrossRef]
  44. Inbar, M.; Wool, D. Phloem-feeding specialists sharing a host tree: Resource partitioning minimises interference competition among galling aphid species. Oikos 1995, 73, 109–119. [Google Scholar] [CrossRef] [Green Version]
  45. Francke-Grosmann, H. Über die Ambrosiazucht der beiden Kieferborkenkäfer Myelophilus minor Htg. und Ips acuminatus Gyll. Medd. Stat. Skogs. 1952, 41, 1–52. [Google Scholar]
  46. Lekander, B.; Bejer-Petersen, B.; Kangas, E.; Bakke, A. The distribution of bark beetles in the Nordic countries. Acta Entomol. Fenn. 1977, 32, 1–36. [Google Scholar]
  47. Cochran, W.G. Sampling Techniques; Wiley: New York, NY, USA, 1977; pp. 1–600. [Google Scholar]
  48. Heurich, M.; Beudert, B.; Rall, H.; Křenová, Z. National parks as model regions for interdisciplinary long-term ecological research: The Bavarian Forest and Šumava National Parks underway to transboundary ecosystem research. In Long-Term Ecological Research; Müller, F., Baessler, C., Schubert, H., Klotz, S., Eds.; Springer: Dordrecht, The Netherlands, 2010; pp. 327–344. [Google Scholar] [CrossRef]
Figure 1. (A) Study region. Grid of the SINUS system for Poland; D, J, JL, K, P, Z symbols of the forest district—see materials and methods; (B) Damage to crowns in stands; (C) Healthy pine (i) used as a trap log (ii); letters U and L indicate the upper and lower section of the trap log, respectively. Numbers 1, 2, …, 10 indicate stem units.
Forests 12 01336 g001
Figure 2. Tomicus piniperda galleries engraving the sapwood.
Forests 12 01336 g002
Figure 3. Tomicus minor gallery with bark showing exit holes.
Forests 12 01336 g003
Figure 4. Mean infestation density by pine shoot beetles of trap logs. a, b, c the value of density infestation marked with different letters indicate statistically significant differences in the stands (Kruskal-Wallis test, p < 0.05).
Forests 12 01336 g004
Figure 5. Colonization patterns of the trap logs units by T. piniperda.
Forests 12 01336 g005
Figure 6. Colonization patterns of the trap logs units by T. minor.
Forests 12 01336 g006
Figure 7. Niche breadth for pine shoot beetles colonizing trap logs (A) Tomicus piniperda (B) Tomicus minor: a, b, c, d the value of niche breadth (median) marked with different letters indicate statistically significant differences in the stands (Kruskal-Wallis test, p < 0.05).
Forests 12 01336 g007
Figure 8. Niche overlaps of the pine shoot beetles colonizing trap logs: a, b, c, the value of niche overlaps (median) marked with different letters indicate statistically significant differences in the stands (Kruskal-Wallis test, p < 0.05).
Forests 12 01336 g008
Figure 9. A photograph of stand A1 taken in 2021, 13 years after the liquidation of the timber yard.
Forests 12 01336 g009
Table 1. Locality and stand data.
Stand No aDistance from the Timber Yard (m)Forest DistrictPine Quality Classes bYear of Cutting TreesNumber of Trap LogsStem Dimensions (Mean ± Standard Deviation)
Length (m)Diameter Outsider Bark at
Thicker End (cm)Thinner End (cm)
A1<100ZagnańskV2006278.2 ± 0.920.6 ± 2.16.5 ± 0.6
A2100–300III1998, 20025614.4 ± 2.724.2 ± 5.18.1 ± 1.9
A3>300Ia1996, 20033013.9 ± 2.627.9 ± 4.87.5 ± 0.9
A4>300II20081612.2 ± 1.623.2 ± 4.57.4 ± 1.5
B1>2000PrzedbórzIII1992, 19934012.2 ± 1.515.4 ± 1.87.0 ± 0.7
B2JędrzejówIII1998, 19992512.7 ± 2.519.8 ± 3.47.5 ± 1.6
B3DynówIII1996, 19972516.5 ± 1.618.3 ± 3.19.7 ± 3.3
B4KoniecpolIII2000, 20013010.0 ± 1.721.9 ± 2.910.3 ± 1.7
B5JanówLubelskiIV20051012.3 ± 1.816.5 ± 2.59.0 ± 1.4
a See the “Materials and methods” section. b See the “Materials and methods” section.
Table 2. Mean niche breadth B ^ A (±1 S.E.) for pine shoot beetles inhabiting the same trap logs.
Stand NoT. PiniperdaT. Minortd.f.p
B ^ A
S.E.
B ^ A
S.E.
A10.15 a0.020.10 a0.041.118040.1687
A20.26 a0.020.06 b0.029.025140.0008
A30.58 a0.030.25 b0.039.695517<0.001
A40.54 a0.050.11 b0.046.258410<0.001
B10.39 a0.010.29 b0.025.911238<0.001
B20.33 a0.020.21 b0.024.0550220.0005
B30.35 a0.020.06 b0.0112.002620<0.001
B40.35 a0.010.13 b0.0113.138628<0.001
B50.14 a0.010.11 a0.030.860380.4146
a, b means marked with different letters indicate statistically significant differences among the pine shoot beetles in the stands (paired t test, p < 0.05).
Table 3. Coefficient of proportional similarity for pine shoot beetles in different stem sections.
Stand NoProportional SimilaritySegregationt Test (p)
A10.00+<0.001
A20.00+<0.001
A30.32+<0.001
A40.12+<0.001
B10.12+<0.001
B20.08+<0.001
B30.03+<0.001
B40.02+<0.001
B50.52+0.0479
Segregation was assumed to occur (+) when the coefficient of proportional similarity was lower than 0.7 (one-sample t test, p < 0.05).
Table 4. Parameters and basic statistics of Equation (19).
Name of VariableValue of ParameterT-Statistics ValueProbability LevelVifR2adjRMSEANOVA
F-ValueP-Level
Intercept−0.0604−2.7350.0074
rc0.048610.939<0.0012.21
sqcIII0.06974.205<0.0012.21
sqcI–II0.07963.0760.00263.82
cu0.04683.6280.00041.320.81320.056117.45< 0.001
Rc—range of colonisation of a trap log; sqcIII and sqcI–II—site quality class III and I–II; cu—crown undamaged; Vif—Variance inflation factor; R2adj—adjusted R-squared. RMSE—root mean square error.
Table 5. Results of comparison of the observed B ¯ o and prdicted B ¯ p mean of the niche breadth T. piniperda on trap logs: t test, p < 0.05.
Sample
Plot No a
Mean ± SDtd.f.Probability
Level
RealModel
A10.15 ± 0.040.14 ± 0.031.000130.3356
A20.25 ± 0.090.23 ± 0.042.000280.0553
A30.61 ± 0.160.54 ± 0.022.0463150.0587
A40.38 ± 0.130.38 ± 0.080.013280.9898
B10.40 ± 0.080.40 ± 0.060.0939200.9261
B20.33 ± 0.100.31 ± 0.060.7383130.4745
B30.34 ± 0.110.34 ± 0.06−0.1211140.9054
B40.34 ± 0.090.37 ± 0.04−0.9398160.3836
B50.13 ± 0.030.15 ± 0.03−1.107340.3305
a For plot codes, refer to the Materials and Methods section.
Publisher’s Note: MDPI stays neutral with regard to jurisdictional claims in published maps and institutional affiliations.

