Article

Variability in Carbon Stocks across a Chronosequence of Masson Pine Plantations and the Trade-Off between Plant and Soil Systems

1
College of Forestry, Guizhou University, Guiyang 550025, China
2
Institute of Soil Erosion and Ecological Restoration, Guizhou University, Guiyang 550025, China
*
Author to whom correspondence should be addressed.
Forests 2021, 12(10), 1342; https://doi.org/10.3390/f12101342
Submission received: 24 June 2021 / Revised: 21 September 2021 / Accepted: 28 September 2021 / Published: 30 September 2021
(This article belongs to the Special Issue Forest Soil Carbon and Climate Changes)

Abstract

:
Plantations sequester atmospheric carbon dioxide and positively respond to climate change, but the carbon (C) sequestration capacity and the trade-off between plant and soil systems in plantations may vary significantly across a chronosequence. Masson pine (Pinus massoniana Lamb.) plantations were selected to investigate the variability of C stocks in 7-, 14-, and 30-year-old stands. The total ecosystem C stock increased with stand age from 14.82 to 19.21 Mg C. Carbon stocks increased with stand age in the plant system but decreased in the soil system, with the ratio of plant-to-soil C stocks increasing from 0.06 in the 7-year-old plantation to 0.70 in the 30-year-old plantation. Carbon stocks in the first 20 cm of the soil accounted for 44.60%, 43.01%, and 30.18% of the total ecosystem carbon stock in 7-, 14-, and 30-year-old plantations, respectively. The variation trends for the proportions of C stock in soil decreased with soil depth as a result of tree and root growth regardless of stand age. Most C was stored in the stems, which contributed 1.36%, 6.85%, and 29.57% of total ecosystem C stock across the chronosequence. Results of structural equation model indicated that the effect of plant system C stock on ecosystem C stock was far larger than soil system C stock, and saturated hydraulic conductivity (ks) and fractal dimension (D) could be the primary parameters affecting ecosystem C stocks according to redundancy analysis (Variance explained by the variables selected). In summary, the plant system increased biomass C stocks by regulating soil properties to meet their growth requirements, the growth of plants in turn changed the soil organic carbon (SOC) stock, then both regulated ecosystem carbon sequestration in Masson pine plantations.

1. Introduction

The effect of global warming on ecosystem functioning caused by carbon dioxide (CO2) has drawn broad attention in recent decades [1]. Limiting the increase in global mean temperatures relies on reducing CO2 emissions and the removal of CO2 from the atmosphere using land carbon (C) sinks [2]. A study on forest C sequestration from 1990 to 2007 found that the cumulative C sink of regrowing forests was equivalent to 60% of cumulative fossil emissions during the same period [3]. Assessment of climate change mitigation pathways identified reforestation as the single most important option with the potential to sequester and store approximately 50% of the total mitigation potential of 23.8 PgCO2e yr−1 by 2030 [4].
Plantations cover an area of 131 million ha, which accounts for 3% of the global forest area [5], and they may contribute to climate change mitigation while reducing timber demand from natural forests [6]. Most forest C is contained in living biomass and soil organic matter, which account for approximately 89% of total ecosystem C stocks, and the remainder is found in dead wood and litter [5]. Forest age is an essential factor in determining the accuracy of historical and future C uptake quantifications [7]. With increasing stand age, plantations vary in vegetation composition and community structure, which may influence the ecosystem C pool [8] by shifting stand densities, litter quality and quantity, and soil nutrients [9]. Previous studies have reported a significant increase in biomass C with plantation age, but no drastic variation, increase, or decrease is found in the soil organic carbon (SOC) stocks [10,11,12]. The SOC density in topsoil continued to increase and accounted for 71.0%, 36.9%, 71.4%, and 76.8% of the C density in the plant-soil ecosystem across a 3-, 10-, 25-, and 35-year chronosequence in H. ammodendron plantations [12]. Therefore, SOC stocks are the major uncertainty in the C storage of plantations.
Huang et.al. estimated that the C storage of aboveground biomass was highest after 30–40 years, SOC storage at 0–10 cm and 20–50 cm depths were highest after 60 years and 30–40 years, respectively, and the total carbon storage was higher at 30 years and then decreased with increasing age [13]. Some studies have reported that tree biomass C accounts for more than 55% of the total ecosystem C stocks regardless of stand age [14], others concluded that aboveground biomass contained 61–97 Mg C ha−1, approximately 24–39% of the total C stocks [15], and ecosystem C dynamics tended to balance between 27 and 39 years [16]. Soils are the largest natural C reservoir within terrestrial ecosystems. Thus, soils are decisive for climate regulation and affect other soil functions [17]. Soil properties explain the largest proportion of organic C at local and small scales, and the balance of C between plant and soil systems will drive powerful C-climate feedback over the coming century [18]. Therefore, there were significant differences in the distribution pattern of the C stock and the C balance between the plant and soil systems at different stand ages.
China has the largest area of planted forests in the world [19], which greatly contribute to the “Global Green”. Masson pine (Pinus massoniana Lamb.), with rapid growth and strong adaptability, are extensively used for afforestation as pioneer coniferous tree species [20]. Large-scale planting would result in different age classes of plantations, and considerable changes in C fluxes in this biome will likely occur as a result of changes in stand age. Quantifying the variability and allocation patterns of C stocks in plantations provide data support for better predictions of C on large scales [21]. Carbon stock estimates of forest ecosystems were reported previously [12,13,14]. However, the magnitude and direction of the changes in C stocks in the soil, litter and biomass across chronosequences of Masson pine plantations and the trade-off between plant and soil systems require further investigation.
Therefore, we studied the C sequestration capacity and the trade-off between plant and soil systems across a 7-, 14-, and 30-year chronosequence of Masson pine plantations and evaluated the possible mechanisms driving the different C allocation characteristics between the two systems. These plantations had similar structural, soil, and climate characteristics, and the only difference was stand age [22]. The present study (1) determined the variability and allocation of C stocks in Masson pine plantations, (2) investigated the trade-off between plant and soil systems, and (3) explored potential drivers behind differences in C allocation and retention.

2. Materials and Methods

2.1. Study Area

This study was performed across a 7-, 14-, and 30-year secondary forest chronosequence located in Dushan County in Guizhou Province within state-owned forest farms that covered an area greater than 18860 km2 and extending at least 50 km from north to south. This area lies between 107°27′ E and 107°30′ E longitude and 25°41′ N and 25°41′ N latitude with a range in altitude from approximately 830 m to 1479 m. The historical mean annual precipitation is approximately 1346 mm, and the mean annual temperature is 15 °C.
The soil in the region is classified as yellow soil. The forest farm is comprised of a mosaic of secondary forests and artificial forests of different ages. Masson pine (Pinus massoniana Lamb.) dominates the vegetation in these plantations. The soil properties, geological characteristics, understory vegetation, and other basic information of the sites are shown in Table 1.

2.2. Experimental Design

Under similar site conditions, we established three 30 m × 30 m standard quadrats in each of the 7-, 14-, and 30-year-old secondary plantations. The elevation and coordinates of each study site were determined, and a vegetation survey was performed. We recorded the species present and counted the number of all target species, and three sample trees were systematically selected within each quadrat (3 trees × 3 quadrats × 3 plantations). Tree biomass estimation was derived from destructive sampling of sample trees. Each tree was subdivided into different components, including stems, branches, foliage, and roots. For the calculation of shrub and herb biomass, the understory vegetation biomass was collected in squares of 2 m × 2 m and 1 m × 1 m using a hand mower. Five microplots (1 m × 1 m) were used to collect the litter.
Three points were randomly selected in each Masson pine plantation quadrat for soil sampling. We used a fixed depth for SOC determination, and soil samples were collected from four depths (0–20, 20–40, 40–60 and 60–80 cm) after removal of the plant residues. We collected a total of five random samples from each plot following the S-shaped sampling method and placed the samples in an aluminum specimen box to ensure that the main structure was maintained during transport to the laboratory.

2.3. Analyses and Calculations

Samples of litter and plant components were dried at 80 °C until a constant mass was reached then ground and passed through a 0.25-mm stainless steel sieve for chemical analyses. The stem, branch, foliage, and root samples were oven-dried to determine the dry biomass. Soil samples were broken into blocks with a diameter of approximately 10 mm according to the natural structure, and litter, stones, and roots were removed. Air-dried soil samples were used to determine the soil aggregation characteristics and other chemical analyses. The wet-sieving method was used to determine the composition of water-stable aggregates in Masson pine plantations of different ages. Aggregated soils were successively passed through a column of sieves with diameters of 5, 3, 2, 1, 0.5 and 0.25 mm to quantify the losses of sediment of different sizes.
The basic properties of litter, plant, and soil samples were determined. Soil bulk density (SBD) was measured using the ring knife method [23]. The constant-head method [24] was used to measure the saturated hydraulic conductivity (Ks). The soil aggregate stability was characterized by the mean weight diameter (MWD), geometric mean diameter (GMD), fractal dimension (D), and proportion of >0.25 mm water-stable aggregates (WSA > 0.25 mm). The stability parameters of aggregates were calculated using the following formulae [25]:
MWD = i = 1 n x i × w i
GMD = exp [ i = 1 n ( w i × ln x i ) i = 1 n w i ]
R 0.25 = M t > 0.25 M t × 100 %
M ( r < x i ) M t = ( x i d max ) 3 D
where xi is the mean diameter (mm) of the soil aggregate size fractions, wi is the proportion of all soil in the ith size fraction (%), Mt > 0.25 is the mass of aggregates larger than 0.25 mm (g), Mt is the total mass of aggregates (g), M(r < xi) is the mass of aggregates smaller than xi (g), and dmax is the maximum diameter of the soil aggregate size fractions (mm).
Soil samples were passed through a 2-mm sieve for the determination of soil C. The concentrations of SOC in soil, litter, and plant components were determined using a wet oxidation process with dichromate, according to the method of Walkley and Black (1934) [26]. We calculated the C density and stocks in the biomass (stem, branch, foliage, root, shrubs and herbs) and litter by multiplying the C concentration of each component by the respective dry biomass value.
We defined ecosystem C stock as the sum of the C contained in the following pools: aboveground biomass, litter, roots, and soil C. We calculated the plant system and plant system C stocks by summing the individual stocks of plant components and soil C in each soil layer. Ecosystem-level soil, litter, and plant component C stocks were calculated from the sampling quadrats (0.09 ha). The organic C density (kg·m−2) in a soil layer was calculated as follows [27]:
SOCD i = i = 1 n C i × D i × T i × ( 1 G i ) × 10 2
SOCS j = SOCD i × S
where SOCDi is the SOC density in the i layer of soil (kg·m−2), Ci is the SOC content in the i layer of soil (g·kg−1), and Di, Ti and Gi are the soil bulk density (g·cm−3), soil thickness (cm) and the volume percentage gravel larger than 2 mm in soil, respectively. 10−2 is the unit conversion factor. SOCSj is the SOC storage of stand type j (Mg), and S is the soil acreage of the calculation grid.

2.4. Statistical Analysis

All statistical analyses were performed using CANOCO 5.0 (Microcomputer Power, Ithaca, NY, USA), Statistical Product, and Service Solutions 22.0 (SPSS) and SPSS Amos. Normal distribution was determined using the Shapiro–Wilk test. Data were transformed when the assumptions of the parametric analysis were not met. One-way analysis of variance (ANOVA) was used to analyze the statistically significant differences and variance between the treatments. We performed a stepwise multiple linear regression to detect the relative effects of soil properties on SOC stocks. Redundancy analysis (RDA) was performed to determine the significant discriminating variables of the C stocks, and we used the structural equation model (SEM) to identify the structural relationships between the identified factors.

3. Results

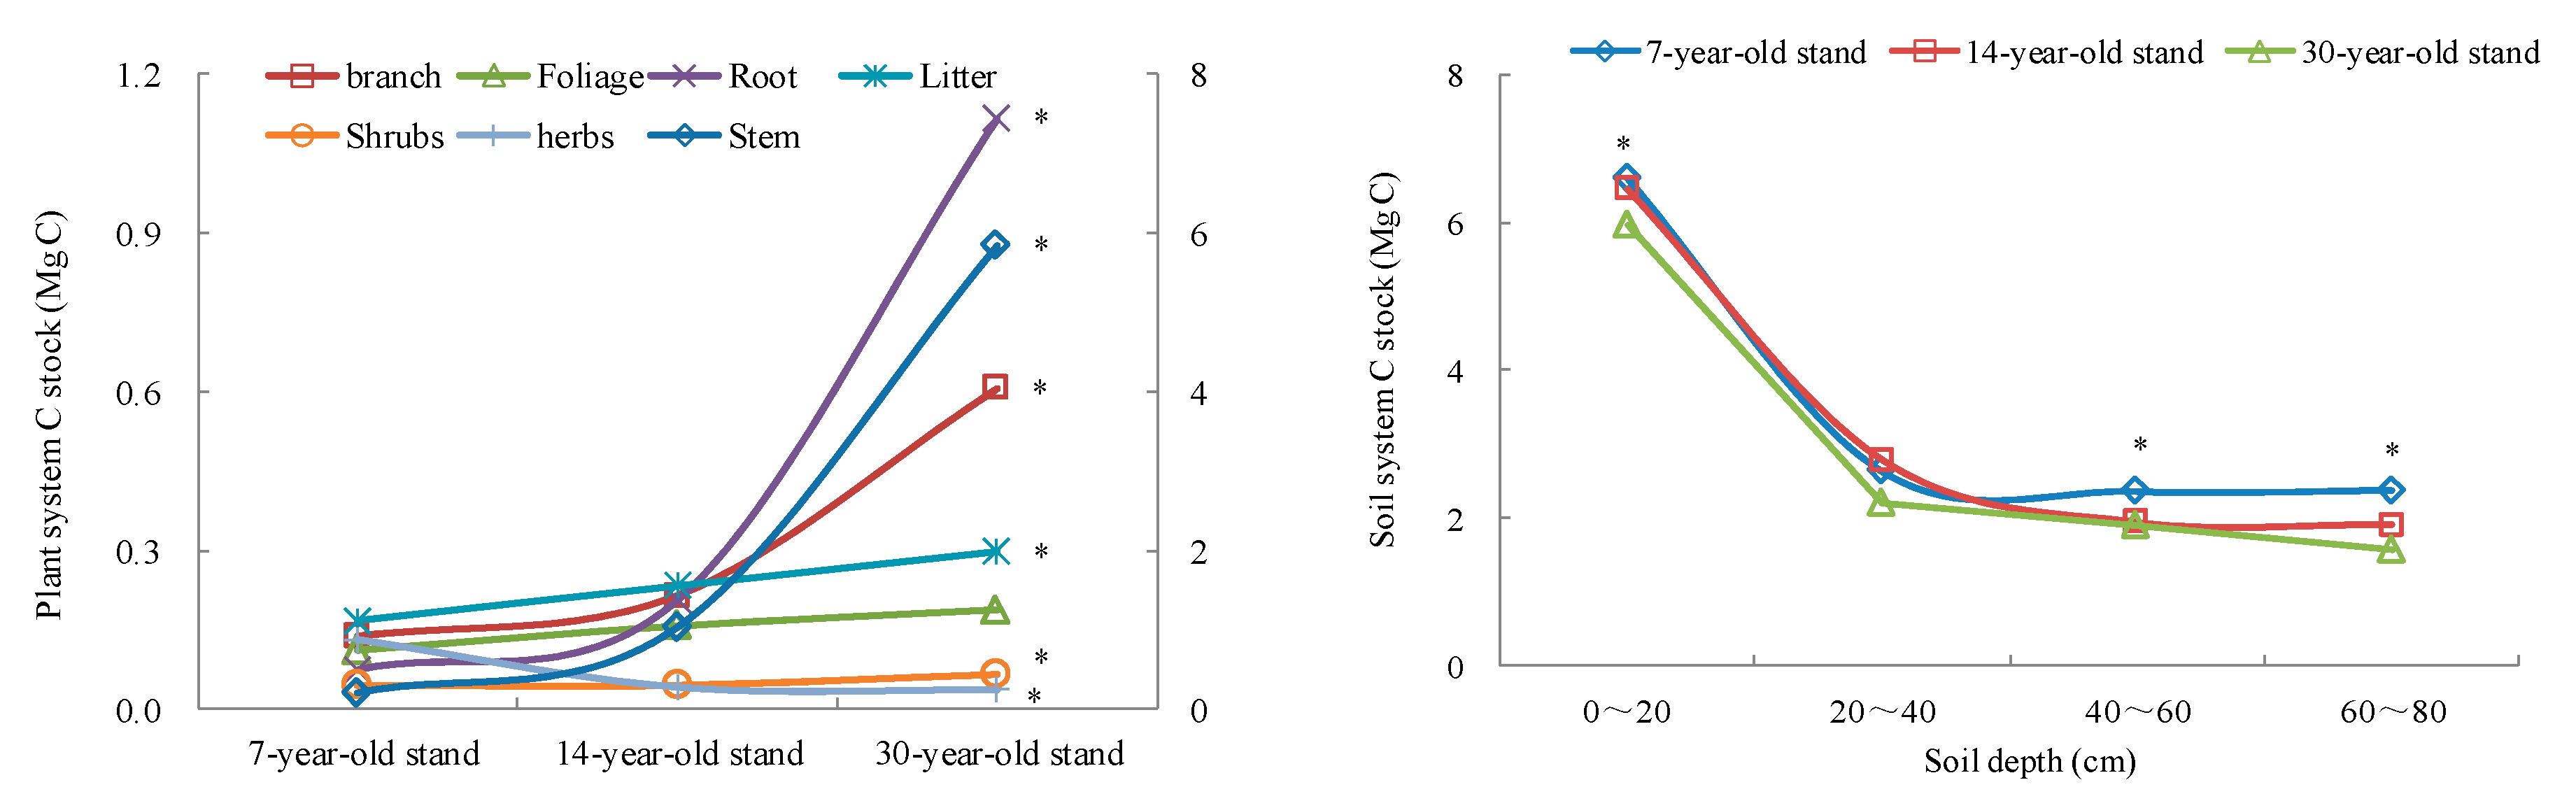
3.1. Carbon Stocks and Allocation Characteristics

The C stored in the plant and soil systems had a wide dynamic range, which reflected the variation across the plantation chronosequence and the variability within each plantation (Figure 1 and Figure 2). Figure 1 shows that the C stocks increased in stems, branches, foliage, roots, litter, and shrubs, but decreased in herbs, with stand age. The greatest C stock was observed in stems across the chronosequence. Litter and branches were also important components of plant system C stocks in the 7- and 14-year-old plantations. The C stock of roots in the 30-year-old plantation was lower than the stems but higher than the other vegetation components.
Within each stand, the 0–20 cm soil layer contained the highest SOC stock, and the C stock decreased gradually with increasing soil depth (Figure 1). For the different soil layers, SOC stocks decreased with stand age, except in the 20–40 cm soil layer. The total ecosystem C stock and plant system C stock increased significantly, but the soil system C stock decreased with forest stand age (Figure 2).

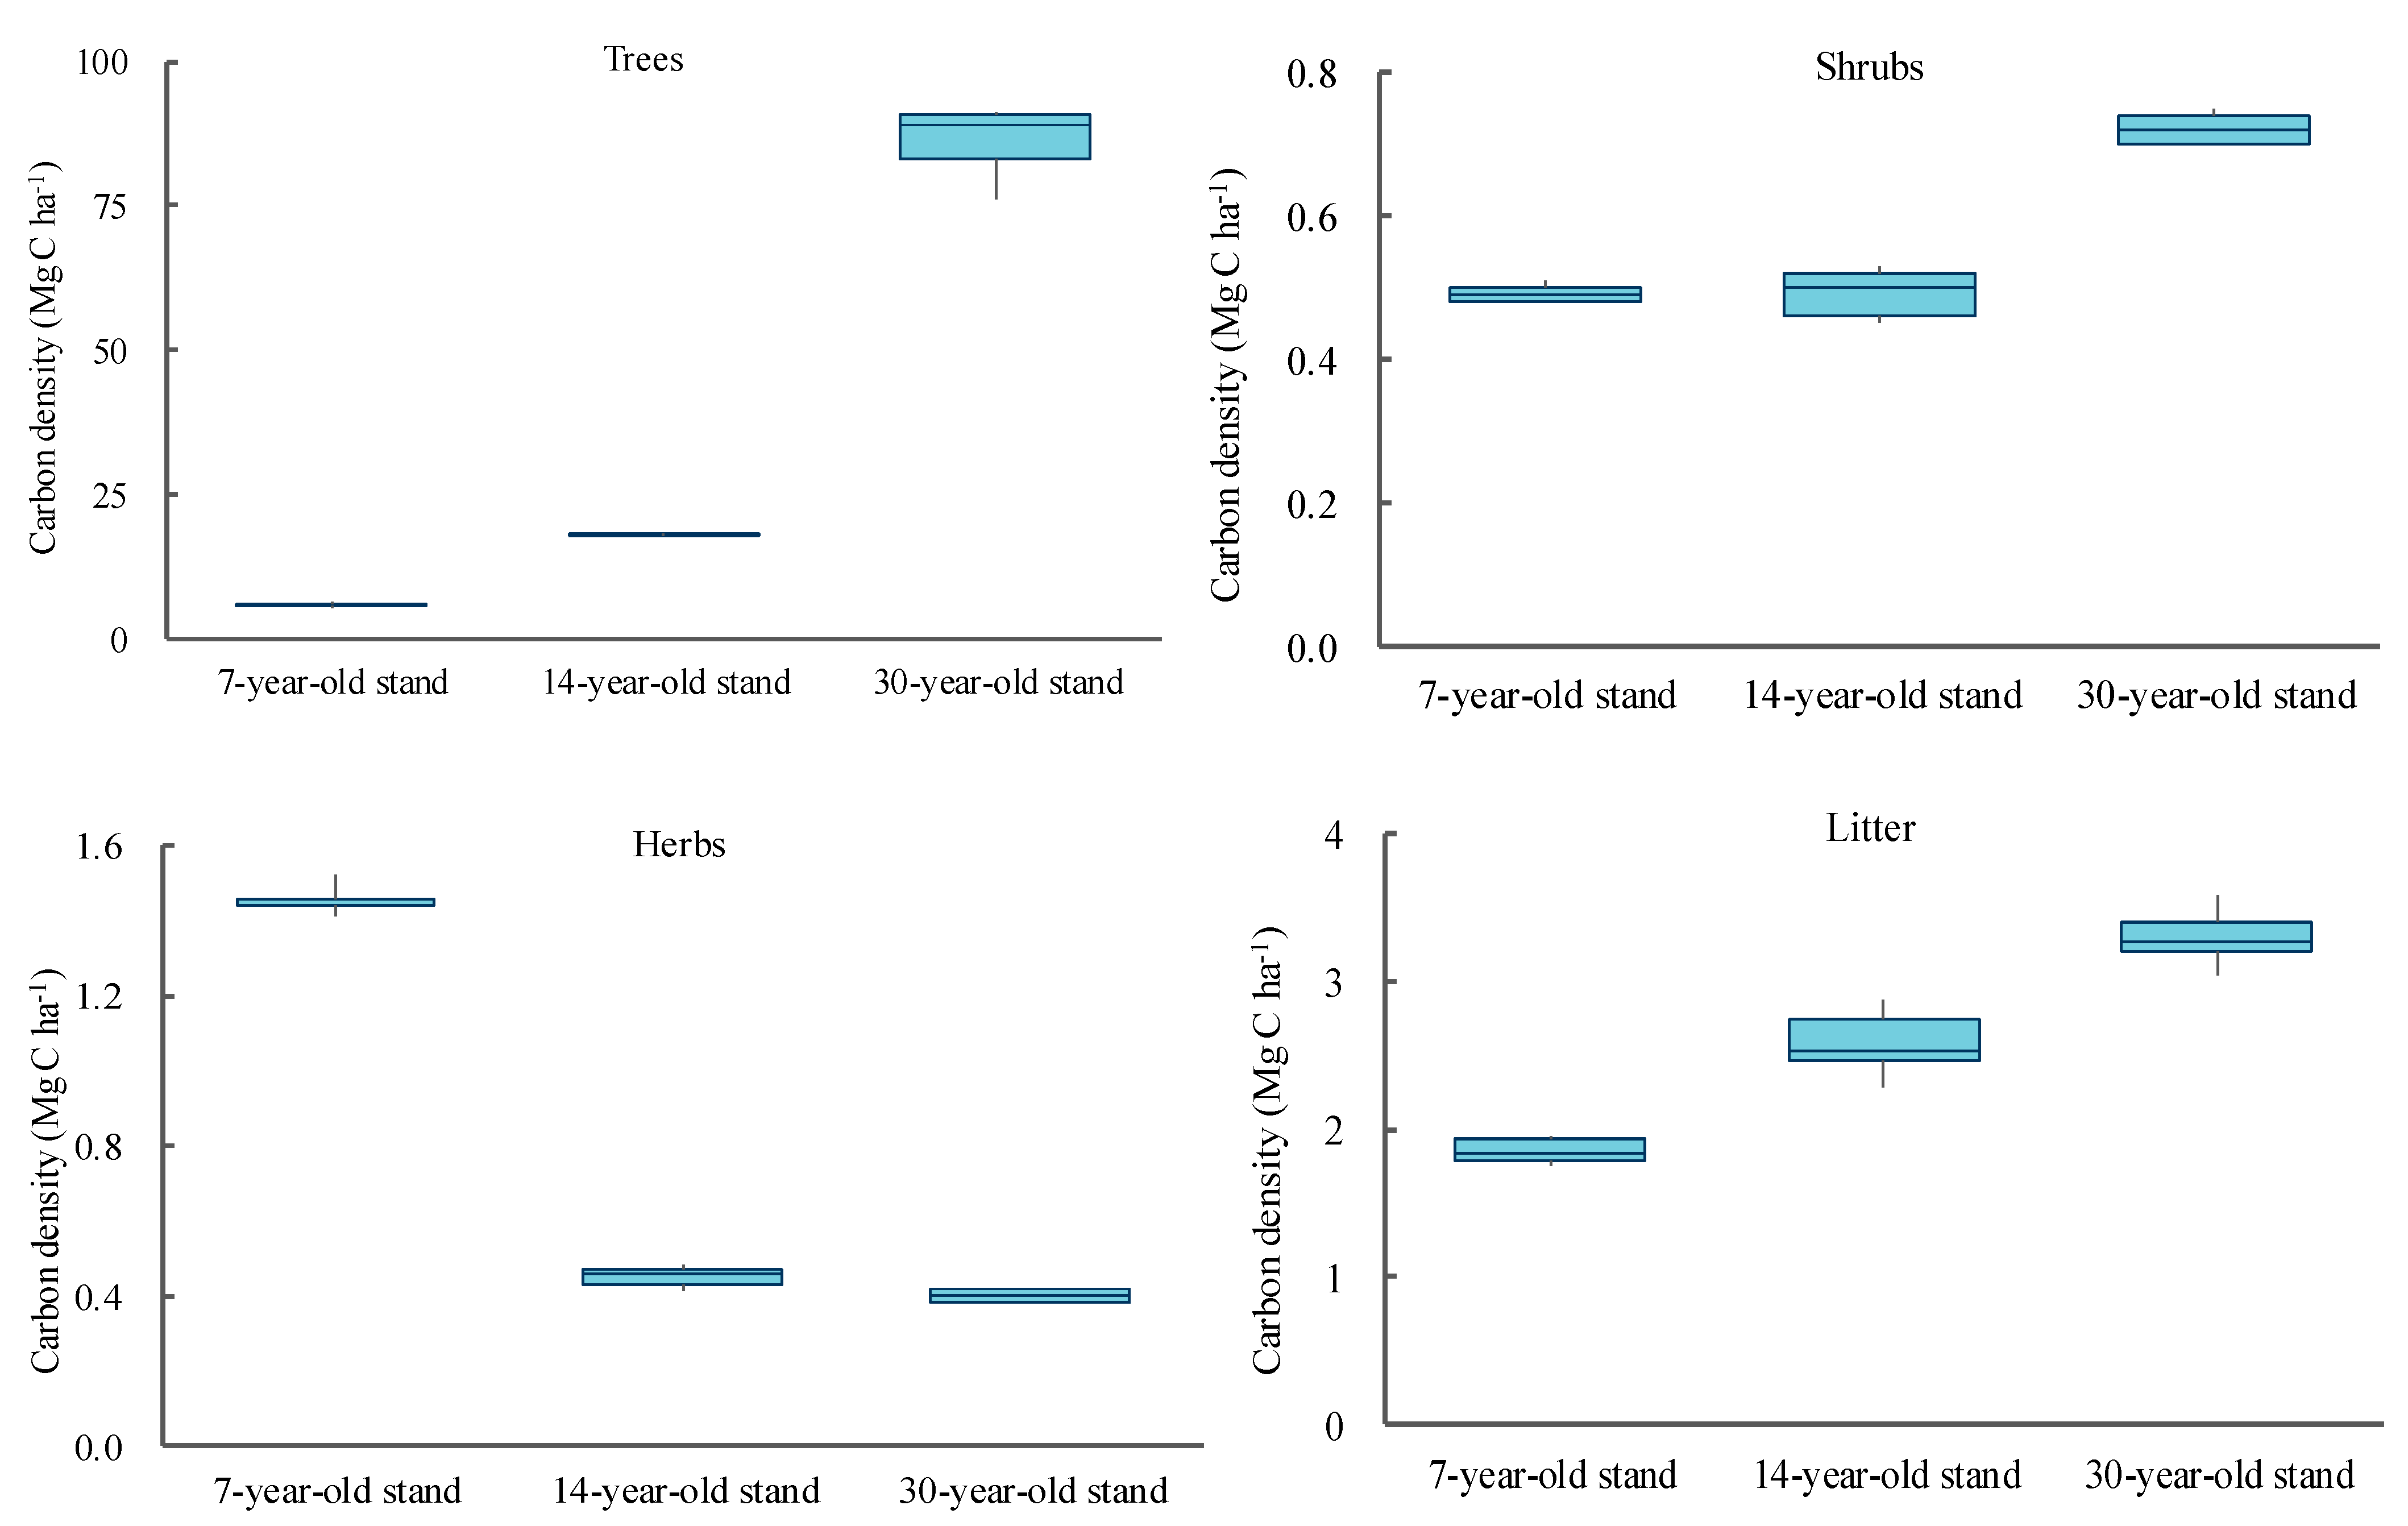
3.2. The Variation of C Density across a Chronosequence

Carbon densities of stems, branches, foliage, roots, shrubs, and litter also increased significantly with stand age and reached the maximum value in the 30-year-old plantation, but the C density in herbs decreased (Figure 3 and Figure 4). The C density of trees was significantly higher than litter, herbs and shrubs regardless of forest stand age (Figure 4), and the greatest C density in the tree components was observed in stems, with values of 2.24, 11.43 and 64.88 Mg C ha−1 across the chronosequence. The lowest C density was observed in the tree roots of 7-year-old plantations, and the lowest values of 1.74 and 2.08 Mg C ha−1 were observed in the foliage of the 14- and 30-year-old plantations, respectively (Figure 3). C densities in the 14- and 30-year-old plantations were ranked as trees > litter > shrubs > herbs, and 7-year-old plantations had the smallest C densities of shrubs (Figure 4).
The Masson pine plantation stand age had a significant effect on SOC density. The densities of SOC in the 0–20 cm, 40–60 cm, and 60–80 cm layers decreased with stand age. The 14-year-old plantation had the highest SOC density in the 20–40 cm soil layer, with a value of 3.09 kg/m2, and the 30-year-old plantation had a value of 2.44 kg/m2, which was the lowest in this soil layer (Figure 5). The SOC density of the 0–20 cm soil layer was the highest, and it decreased gradually with increasing soil depth regardless of forest stand age.

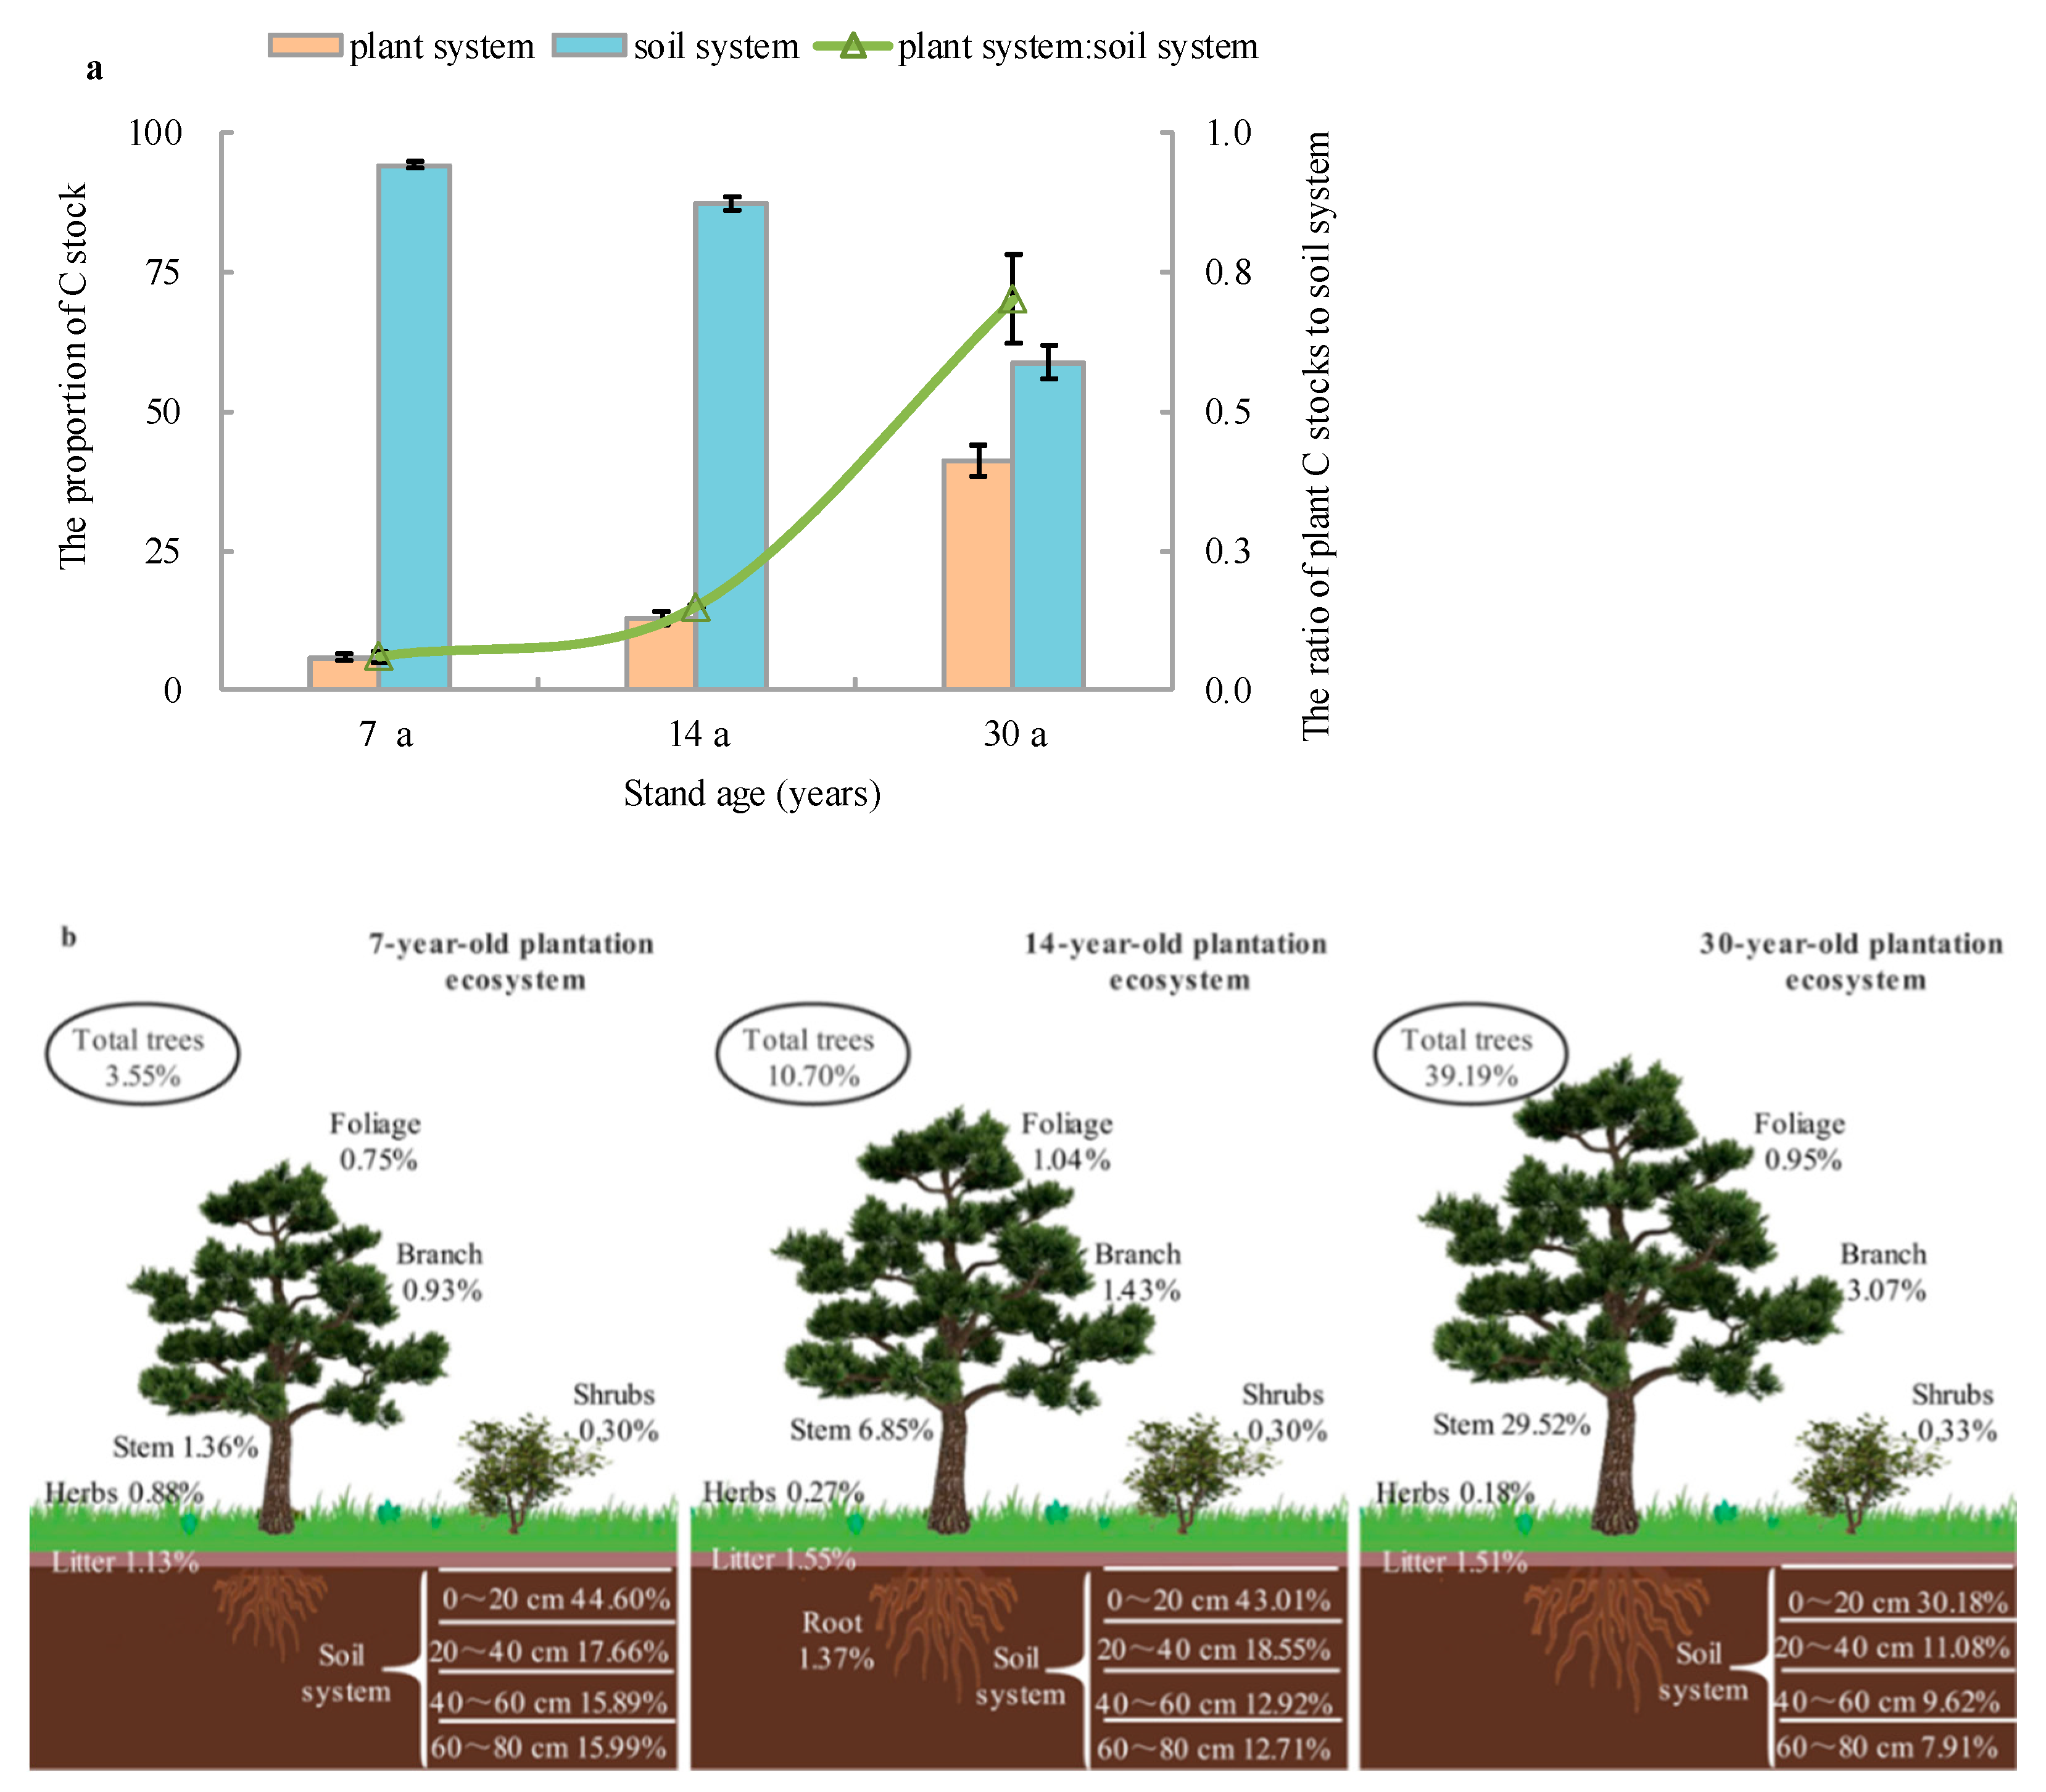
3.3. Allocation Proportion of Ecosystem C Stocks

The 7-, 14-, and 30-year-old plant systems accounted for 5.86%, 12.81% and 41.21%, respectively, of the total ecosystem C stock (Figure 6a). Trees contributed the largest proportion of the plant system C stock in each stand, and shrubs and herbs played a much smaller overall role (Figure 6b). Compared to the plant system, the soil system contained a higher proportion of C stock regardless of forest stand age, especially in the 7-year-old plantation, which had a larger proportion of plant system C stock to ecosystem carbon stock (94.14%) (Figure 6a). The 0–20 cm soil layer contributed the highest proportion of the ecosystem C stock compared to the other soil layers in each plantation (30.18–44.60%) (Figure 6b). The ratio of the plant system C stock to the soil system increased from 0.06 in the 7-year-old plantation to 0.70 in the 30-year-old plantation (Figure 6a).

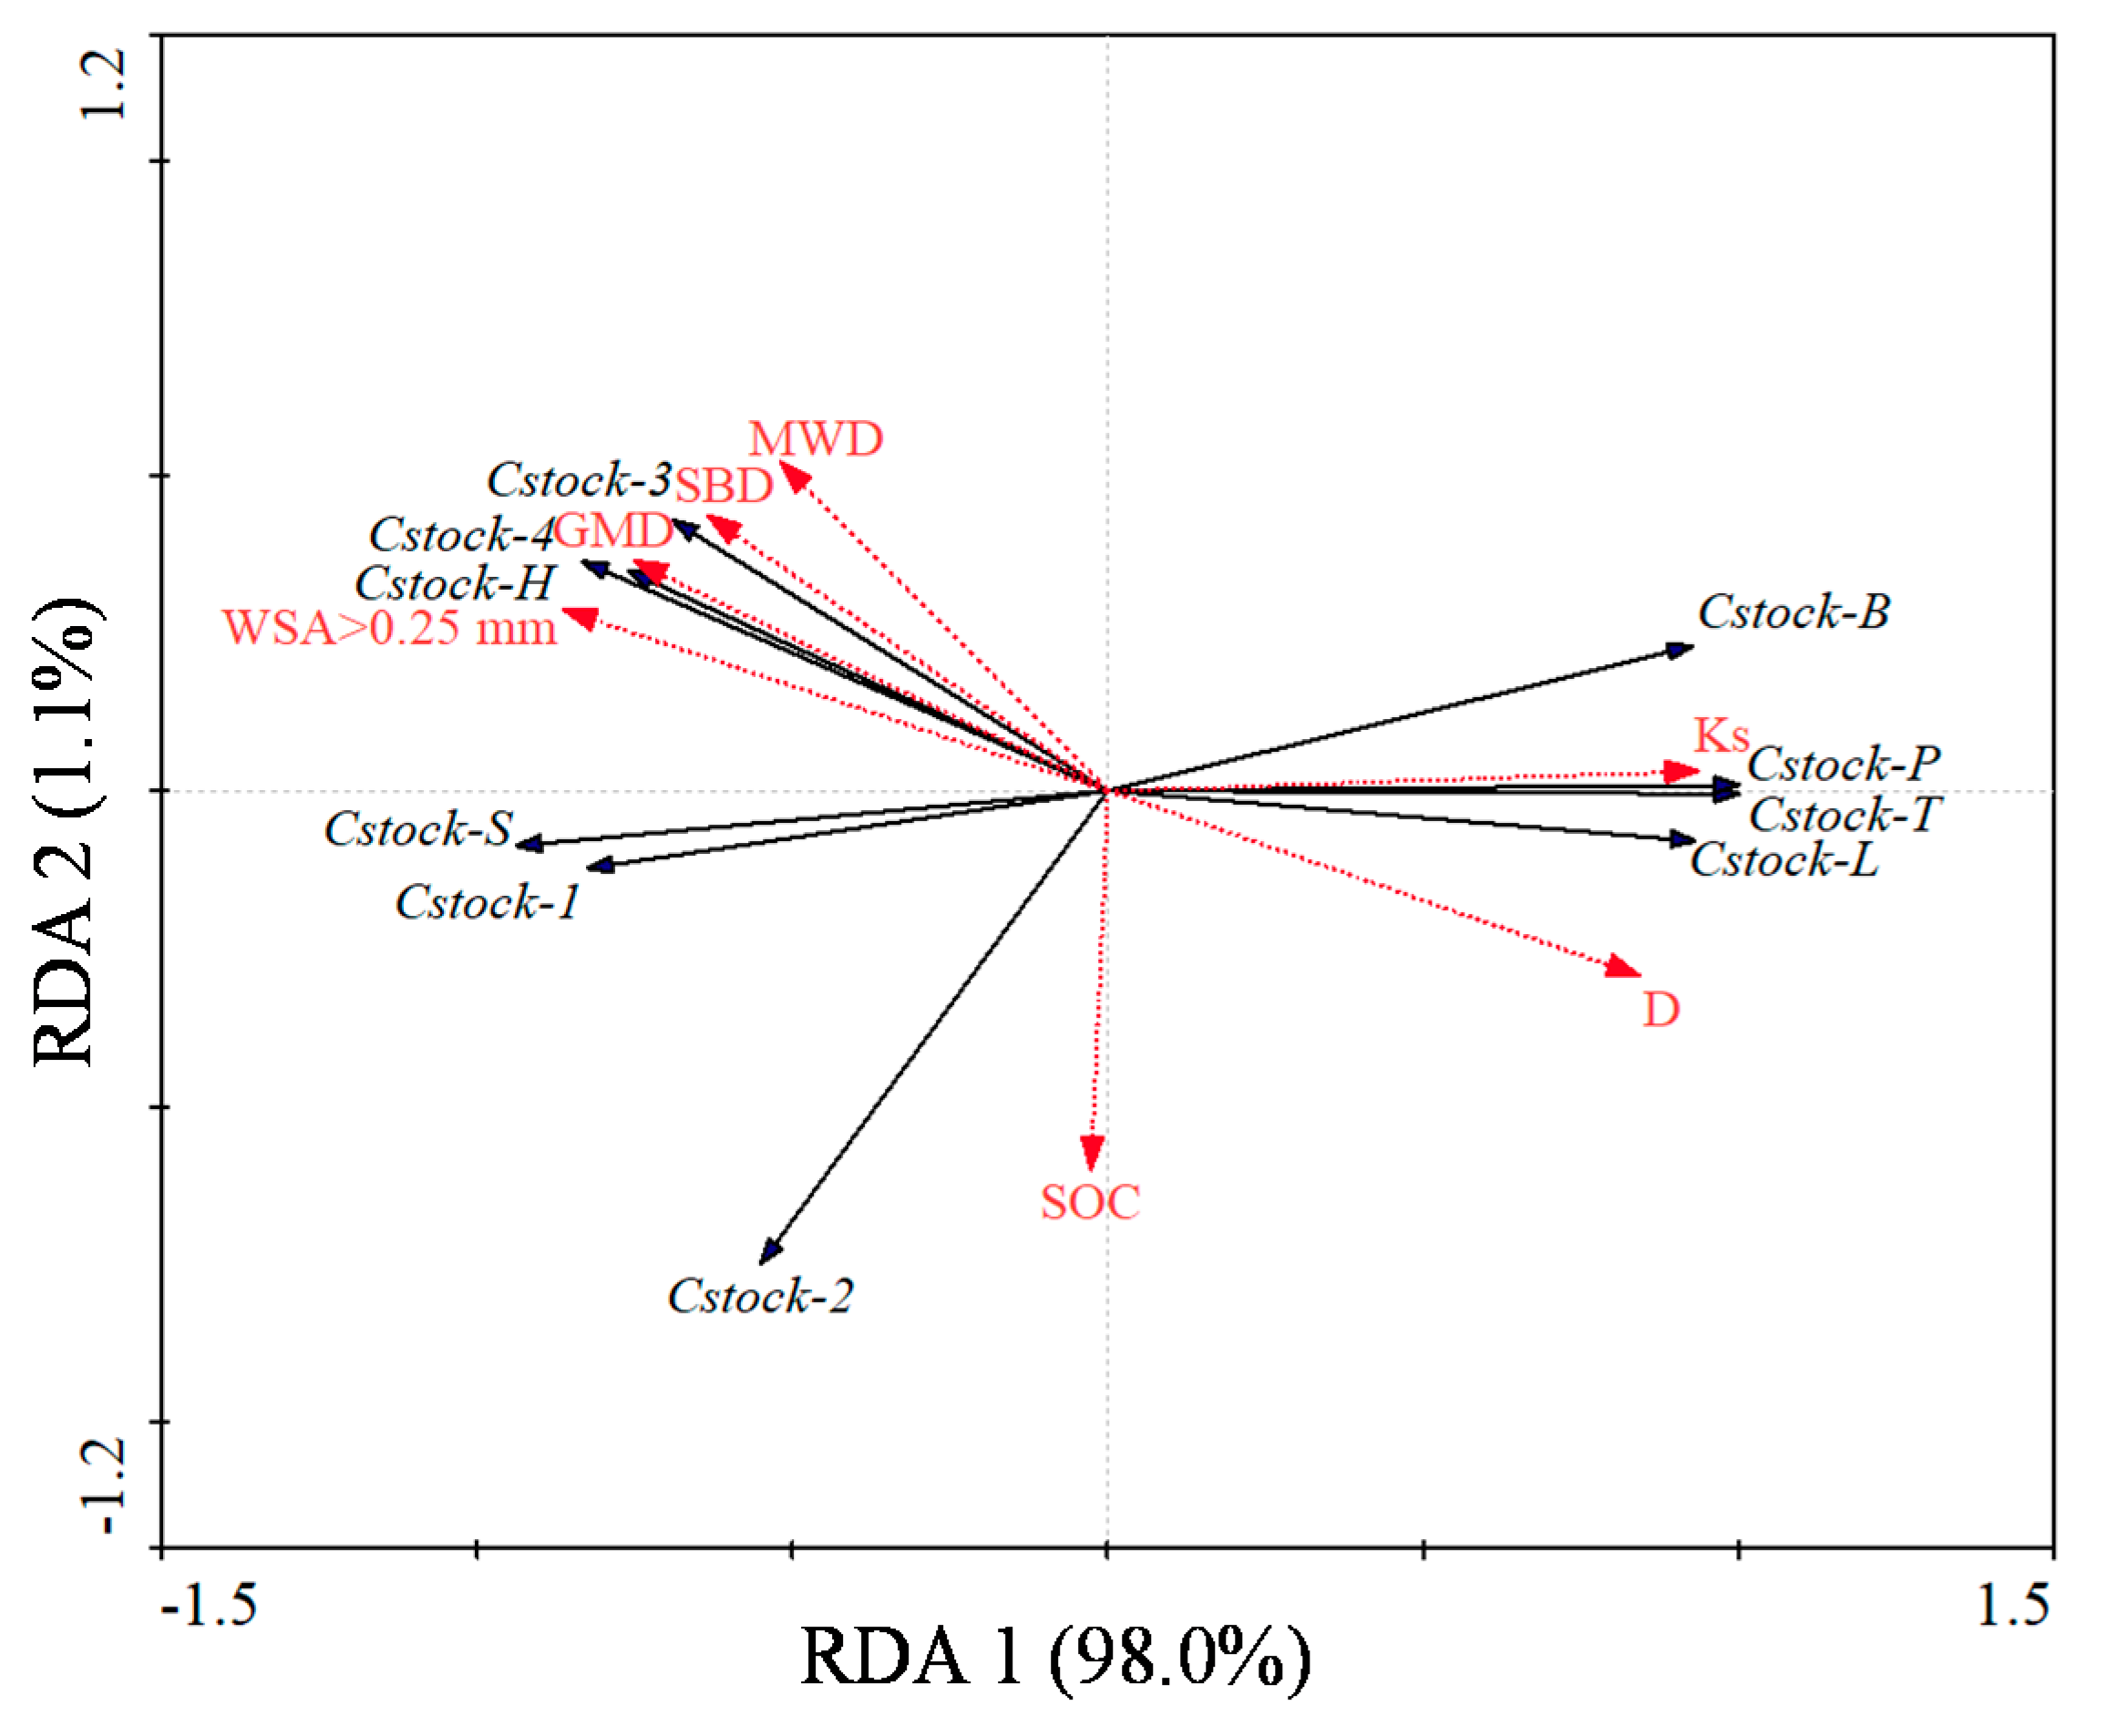
3.4. The Contribution of Soil Properties to C Stocks

In the RDA ordination plot, axes 1 and 2 explained 98.0% and 1.1% of the total variance, respectively. The soil system C stock negatively correlated with the plant system C stock, and saturated hydraulic conductivity and fractal dimension negatively correlated with the soil system C stock (Figure 7). For the different soil layers, soil bulk density showed a positive correlation with the SOC stock in the 0–20 cm soil layer, and 80.2% of the variation in the SOC stock was explained by soil bulk density. WSA > 0.25 mm contributed 72.3% of the SOC stock variation at 40~60 cm, and geometric mean diameter explained 68.4% of the SOC stock variation at 60~80 cm. Positive correlations were observed between geometric mean diameter, WSA > 0.25 mm and the SOC stock (Table 2 and Figure 7). Mean weight diameter was also an important property for the C stock, and 64.4% of the SOC stock variation was explained by mean weight diameter and soil bulk density together in the 20–40 cm soil layer (Table 2). Therefore, the stability of aggregates is very important for organic C sequestration.
The goodness of fit indices for the structural model shown in Figure 8 indicated that the model had a good fit to the data. Per the structural equation model outcome, the ecosystem biomass had a direct impact on the plant system C stock. The effect of stand age on ecosystem biomass was close in magnitude to the plant system C stock. However, the effect of stand age on plant system C stock was negative. The effect of the plant system C stock on the ecosystem C stock was far larger than the plant system C stock (Figure 8).

4. Discussion

4.1. Carbon Partitioning in the Plant-Soil System

The spatial distribution of the C stock in the Masson pine ecosystem was largely related to the forest stand age. The total ecosystem C stock and plant system C stock increased significantly, but the soil system C stocks decreased with stand age. The soil system always contained a higher proportion of C stock than the plant system. Fan et al. showed that aboveground live tree biomass consistently had a larger C pool than mineral soil, which is not consistent with our results [28]. Our results showed the importance of soil in C sequestration. The total ecosystem C stock increased strikingly due to the increased storage of C in the biomass [15,29]. Plant nutrient acquisition is often a suggested reason for the reduction in plant system C stocks, and plants increase their biomass by mining the soil for nutrients, which decreases SOC storage [30].
The plant and soil systems accounted for 5.86% and 94.14%, respectively, of the total ecosystem C stock in the 7-year-old plantation, and the ratio of plant system C stocks to the soil system increased with stand age. Carbon stocks in plant and soil systems became increasingly similar when most of the Masson pines were 30 years old. Carbon dynamics tended to be balanced during the transitional period (27 to 39 years), followed by a decline in the later stage of ecosystem development [16]. Some authors reported increased biomass C from a 7- to 29-year stand and a decrease in a 33-year stand [31]. Plant systems played an important role in our study region, and the effect of the plant system C stock on the ecosystem C stock was far larger than the soil system C stock. Vegetation stores a relatively small proportion of the C pool in boreal forests [3]. Wellock et al. [32] suggested a significant decline in the C density of the surface soil following afforestation from grassland to a 27-year-old forest, but the soils switched from a C source to a C sink in a 47-year-old forest. Yang et al. [33] also reported that forest ecosystems triggered negative feedback to climate warming. Therefore, it is essential to study the balance of C between plant systems and soil systems in more detail.
Among the plant systems, trees accounted for the largest proportion of the C stock, followed by litter then shrubs and herbs. Carbon sink strength differed between forest types primarily because of the differences in organic matter stabilization [34]. The quantity of litter gradually increases during the growing process, and it is an important C pool [35]. Leaf litter plays a more important role in SOC than fine roots [36]. There was a decreasing trend with age in the biomass C storage of the herbaceous vegetation, likely because canopy closure reduced light penetration and air circulation, which restricted vegetation growth. Therefore, herbaceous vegetation was an essential part of the plant system C stock in the 7-year-old plantation. For the different plant components, the C stock of roots was more important in 30-year-old plantations.

4.2. Correlation between Plant and Soil Systems

Ecosystem C stocks showed high variation within different plantations, which may be due to various reasons. The average tree biomass C density in the 30-year-old plantation was 86.10 Mg C ha−1 in our study, which is higher than the national average biomass C density of all forests (41.0 Mg C/ha) [37]. Carbon is the major limiting nutrient for plants, and it constitutes the major proportion of the dry matter of plants [38]. Vegetation components fix CO2 via photosynthesis into stable organic compounds [39]. The total biomass of the plant system increased significantly with time, which resulted in the accumulation of organic C, particularly the biomass of Masson pine, which accounted for the largest proportion. A reduction in SOC occurred with increasing stand age, which may be due to vegetation growth. There are several reasons for this occurrence. The first reason is the nutrient requirements of Masson pine. Plants acquire limiting resources from soils via C investment belowground in root growth, exudates and other ways, and the priming effect decreases SOC by accelerating the decomposition of organic matter [30]. Plant C inputs, including plant residues and root exudates, accelerate the decomposition of soil organic matter via the priming effect [40]. The growth and death of plant roots improve soil texture and enhance moisture retention and fertility [41]. Root exudates strongly regulate the number of soil organisms and biological activity in the rhizosphere by changing the chemical environment of the soil [42]. Therefore, older plantations experience higher decomposition of SOC with the growth of plant roots.
Vegetation is the main source of SOC [43], and plantations may alter understory vegetation and soil properties [44] Therefore, changes in species composition and biomass may affect soil C. The distribution of SOC in the soil profile is generally influenced by the vertical distribution of the plant root system [45]. The 7-year-old plantation had no obvious differences in the SOC stocks of the 20–40 cm, 40–60 cm, and 60–80 cm layers, likely because most of the fine roots were distributed near the soil surface [46], which made little difference in the proportion of the C stock. The decreased variation in the SOC content with soil depth indicated that the influence of plant roots on SOC decreased with increasing soil depth [47]. The biomass and length of roots increased with stand age, which may explain why the C stocks in the 30-year-old plantation were higher than the 7-year-old plantation in each soil layer.
For C stock sequestration, litter biomass and quality are the main drivers of the potential for soil to sequester C [48], and the 0–20 cm soil layer contained the highest value of the soil stock in all plantations. The rhizosphere priming effect may accelerate or inhibit the decomposition of SOC [49]. There is a relative balance between plant and soil system, and promoting the decomposition of organic C and vegetation replenish the C in the soil. Herb biomass accounted for a relatively larger proportion of the plant system biomass in the 7-year-old stand between the three plantations. Because of their high decomposition and transformation rate, herbs were more important in the 7-year-old plantation than the 14- and 30-year-old plantations in regulating the supply of organic C.
The increased canopy closure in the mature forest resulted in a dramatic change in understory microclimatic conditions and resource availability, which may limit understory vegetation growth and affect biomass C accumulation [16]. A favorable environment is provided for the growth of soil organisms. An increase in the number of soil organisms and biological activity also triggers and accelerates the decomposition of SOC [50], which may lead to an increase in C release from soils.

4.3. Controls of C Stocks in Plant-Soil Systems

Stand age and community structure significantly affected biomass and favorably affected the C stock in the plant system. The ecosystem C stock generally increased with stand age in the present study. The main explanation for this trend is the contribution of plant biomass, especially the large increase in biomass stocks of trees. With forest stand age, the increased canopy closure resulted in a dramatic change in understory microclimatic conditions, including light penetration, temperature, and air circulation, which regulated the C sequestration processes in plantation ecosystems by affecting plant growth, litter decomposition and soil biological activity [16,31].
Significant differences in the C stocks of Masson pine plantation ecosystems occurred in the present study for many reasons, except vegetation, which was primarily associated with soil properties. Soil bulk density characterizes the compaction of soil and its water permeability, and it is an important index used to assess SOC [51]. Saturated water conductivity is closely related to SOC, and the distribution of soil aggregates is of great significance for soil C sequestration [52]. Therefore, we quantified the contributions of soil properties to ecosystem C stocks and found that saturated hydraulic conductivity and fractal dimension may be the primary parameters affecting ecosystem C stocks according to the redundancy analysis.
The vertical distribution of SOC density may be altered by soil bulk density [53]. The results of statistical analysis demonstrated that soil bulk density was an important controlling factor affecting the SOC stock in the 0–20 cm soil layer, and a positive correlation between these factors was observed regardless of stand age. A total of 64.4% of the variation in the SOC stock in the 20–40 cm soil layer was also explained by soil bulk density and MWD, and there were significant positive correlations between the SOC stock and MWD. Many researchers investigated and agreed with the importance of the MWD for SOC [54,55]. Soil bulk density was significantly higher in the 7-year-old stand than the other stands, which resulted in the highest SOC stock in this stand. Saturated hydraulic conductivity is a critical soil property affecting water flow and solute transport [56], and the higher Ks in the surface soil may cause the loss of dissolved organic C, which is why the SOC stock had a negative correlation with Ks in the different soil layers.
Physical protection of SOC by aggregates is an important mechanism for C stabilization [57]. In the 40–60 cm and 60–80 cm soil layers, fractal dimension negatively correlated with the SOC stock, but positive correlations were observed between MWD, GMD and WSA > 0.25 mm and the SOC stock from the results of redundancy analysis. Strengthening the structural stability of soil aggregates may be beneficial to promote organic C storage. WSA > 0.25 mm accounted for 72.3% of the SOC stock variation at 40~60 cm, and GMD explained 68.4% of the variability in the SOC stock at soil depths of 60~80 cm. Forest stand age in our study may have increased the proportion of <0.25 mm. Therefore, stand age may have affected SOC stocks by regulating the composition of water-stable aggregates. In general, the C stock was affected to a great extent by these soil properties.

5. Conclusions

Carbon sequestration increased along the chronosequence as a consequence of tree growth. Although the largest increment with stand age was found in the plant system, the soil system contained the largest amount of C in the ecosystem. However, soil C stocks decreased with stand age, and the variation trend of the SOC stocks decreased with depth in the three stands. The mechanisms underlying the effects of the plant and soil systems on SOC stocks in each layer were different. The plant system accelerated or inhibited C sequestration by increasing litter inputs, the rhizosphere effect, and nutrient acquisition. Soil properties, including saturated hydraulic conductivity, soil bulk density, and soil aggregate stability, were identified as important controlling variables that regulated ecosystem C stocks via a trade-off between plant and soil system C stocks. The plant-to-soil ecosystem C ratio cannot remain constant, and the plant system C stock will decrease when plantations begin to decline. Therefore, stand age was the controlling factor of ecosystem C stock accumulation, and vegetation increased their biomass by mining the soil for nutrients. Therefore, the increase in vegetation was not accompanied by an increase in the soil C stock. This finding may have relevant consequences for estimates of the potential of C sequestration of forests, and the continuous monitoring of the changes in C dynamics with stand age should be investigated in more detail in future studies.

Author Contributions

Conceptualization, Q.D.; Data curation, J.H.; Investigation, F.X.; Methodology, F.X.; Software, Y.Y.; Writing—original draft, J.H.; Writing—review & editing, Q.D. and X.P. All authors have read and agreed to the published version of the manuscript.

Funding

This research was funded by China Postdoctoral Science Foundation (2020M673296), the High-level Innovative Talents in Guizhou Province of Guizhou Province (Qian Ke He Platform Talents (2018)5641), the Science and Technology Projects of Guizhou Province (Qian Ke He Platform Talents (2017)5788), the first-class discipline Construction Project of Guizhou Province (GNYL (2017)007), and the Cultivation project of Guizhou University (Cultivation (2019) No.10 of Guizhou University).

Data Availability Statement

The data presented in this study are available on request from the corresponding author.

Conflicts of Interest

All authors declare that they have no conflict of interest related to this work. The authors declare that they have no commercial or associative interest that represent a conflict of interest in connection with the work submitted.

References

  1. Kumar, A.; Nayak, A.K.; Das, B.S.; Panigrahi, N.; Dasgupta, P.; Mohanty, S.; Kumar, U.; Panneerselvam, P.; Pathak, H. Effects of water deficit stress on agronomic and physiological responses of rice and greenhouse gas emission from rice soil under elevated atmospheric CO2. Sci. Total Environ. 2019, 650, 2032–2050. [Google Scholar] [CrossRef]
  2. Wang, J.; Feng, L.; Palmer, P.I.; Liu, Y.; Fang, S.X.; Bösch, H.; O’Dell, C.W.; Tang, X.P.; Yang, D.X.; Liu, L.X.; et al. Large Chinese land carbon sink estimated from atmospheric carbon dioxide data. Nature 2020, 586, 720–723. [Google Scholar] [CrossRef]
  3. Pan, Y.D.; Birdsey, R.A.; Fang, J.Y.; Houghton, R.; Kauppi, P.E.; Kurz, W.A.; Phillips, O.L.; Shvidenko, A.; Lewis, S.L.; Canadell, J.G.; et al. A Large and Persistent Carbon Sink in the World’s Forests. Science 2011, 333, 988–993. [Google Scholar] [CrossRef] [Green Version]
  4. Griscom, B.W.; Adams, J.; Ellis, P.W.; Houghton, R.A.; Fargione, J. Natural climate solutions. Proc. Natl. Acad. Sci. USA 2017, 114, 11645–11650. [Google Scholar] [CrossRef] [Green Version]
  5. FAO. Global Forest Resources Assessment. Key Findings 2020. Available online: www.fao.org/forest-resources-assessment (accessed on 29 September 2021).
  6. Brown, H.C.A.; Berninger, F.A.; Larjavaara, M.; Appiah, M. Above-ground carbon stocks and timber value of old timber plantations, secondary and primary forests in southern Ghana. For. Ecol. Manag. 2020, 472, 118236. [Google Scholar] [CrossRef]
  7. Yu, Z.; Zhao, H.R.; Liu, S.R.; Zhou, G.Y.; Fang, J.Y.; Yu, G.R.; Tang, X.L.; Wang, W.T.; Yan, J.H.; Wang, G.X.; et al. Mapping forest type and age in China’s plantations. Sci. Total Environ. 2020, 744, 140790. [Google Scholar] [CrossRef]
  8. Kiew, F.; Hirata, R.; Hirano, T.; Xhuan, W.G.; Aries, E.B.; Kemudang, K.; Wenceslaus, J.; San, L.K.; Melling, L. Carbon dioxide balance of an oil palm plantation established on tropical peat. Agric. For. Meteorol. 2020, 295, 108189. [Google Scholar] [CrossRef]
  9. Na, M.; Sun, X.Y.; Zhang, Y.D.; Sun, Z.H.; Rousk, J. Higher stand densities can promote soil carbon storage after conversion of temperate mixed natural forests to larch plantations. Eur. J. For. Res. 2021, 140, 373–386. [Google Scholar] [CrossRef]
  10. Tamang, M.; Chettri, R.; Vineeta; Shukla, G.; Bhat, J.A.; Kumar, A.; Kumar, M.; Suryawanshi, A.; CabralPinto, M.; Chakravarty, S. Stand Structure, Biomass and Carbon Storage in Gmelina arborea Plantation at Agricultural Landscape in Foothills of Eastern Himalayas. Land 2021, 10, 387. [Google Scholar] [CrossRef]
  11. Gaurav, M.; Avishek, S.; Krishna, G.; Jyoti, N.A.; Rattan, L.; Rosa, F. Changes in soil carbon stocks under plantation systems and natural forests in Northeast India. Ecol. Model. 2021, 446, 109500. [Google Scholar] [CrossRef]
  12. Ma, Q.L.; Wang, X.Y.; Chen, F.; Wei, L.Y.; Zhang, D.; Jin, H.J. Carbon Sequestration of Sand-fixing Plantation of Haloxylon ammodendron in Shiyang River Basin: Storage, Rate and Potential. Glob. Ecol. Conserv. 2021, 28, e01607. [Google Scholar] [CrossRef]
  13. Huang, Z.; Cui, Z.; Liu, Y.; Wu, G.L. Carbon accumulation by Pinus sylvestris forest plantations after different periods of afforestation in a semiarid sandy ecosystem. Land Degrad. Dev. 2021, 32, 2094–2104. [Google Scholar] [CrossRef]
  14. Cao, J.X.; Pan, H.; Chen, Z.; Shang, H. Dynamics in Stoichiometric Traits and Carbon, Nitrogen, and Phosphorus Pools across Three Different-Aged Picea asperata Mast. Plantations on the Eastern Tibet Plateau. Forests 2020, 11, 1346. [Google Scholar] [CrossRef]
  15. Jones, I.L.; DeWalt, S.J.; Lopez, O.R.; Bunnefeld, L.; Pattison, Z.; Dent, D.H. Above- and belowground carbon stocks are decoupled in secondary tropical forests and are positively related to forest age and soil nutrients respectively. Sci. Total Environ. 2019, 697, 133987. [Google Scholar] [CrossRef] [PubMed]
  16. Justine, M.F.; Yang, W.; Wu, F.; Khan, M.N. Dynamics of biomass and carbon sequestration across a chronosequence of masson pine plantations. J. Geophys. Res. Biogeosciences 2017, 122, 578–591. [Google Scholar] [CrossRef]
  17. Wiesmeier, M.; Urbanski, L.; Hobley, E.; Lang, B.; Lützow, M.v.; Marin-Spiotta, E.; Wesemael, B.v.; Rabot, E.; Ließ, M.; Garcia-Franco, N.; et al. Soil organic carbon storage as a key function of soils—A review of drivers and indicators at various scales. Geoderma 2019, 333, 149–162. [Google Scholar] [CrossRef]
  18. Waring, B.G.; Sulman, B.N.; Reed, S.; Smith, A.P.; Averill, C.; Creamer, C.A.; Cusack, D.F.; Hall, S.J.; Jastrow, J.D.; Jilling, A.; et al. From pools to flow: The PROMISE framework for new insights on soil carbon cycling in a changing world. Glob. Chang. Biol. 2020, 26, 6631–6643. [Google Scholar] [CrossRef] [PubMed]
  19. Mao, P.L.; Guo, L.M.; Gao, Y.X.; Qi, L.; Cao, B.H. Effects of Seed Size and Sand Burial on Germination and Early Growth of Seedlings for Coastal Pinus thunbergii Parl. in the Northern Shandong Peninsula, China. Forests 2019, 10, 281. [Google Scholar] [CrossRef] [Green Version]
  20. Zhang, X.; Zhao, Z.Y.; Chen, T.; Zhao, T.Y.; Song, L.H.; Mei, L. Fertilization and clear-cutting effect on greenhouse gases emission of pinewood nematode damaged Masson pine plantation. Ecosyst. Health Sustain. 2021, 7, 1868271. [Google Scholar] [CrossRef]
  21. Ge, J.L.; Xu, W.T.; Liu, Q.; Tang, Z.Y.; Xie, Z.Q. Patterns and environmental controls of soil organic carbon density in Chinese shrublands. Geoderma 2020, 363, 114161. [Google Scholar] [CrossRef]
  22. Sever, M.Z.O.; Alberti, G.; Vedove, G.D.; Marjanović, H. Temporal Evolution of Carbon Stocks, Fluxes and Carbon Balance in Pedunculate Oak Chronosequence under Close-To-Nature Forest Management. Forests 2019, 10, 814. [Google Scholar] [CrossRef] [Green Version]
  23. Hossain, M.F.; Chen, W.; Zhang, Y. Bulk density of mineral and organic soils in the Canada’s arctic and sub-arctic. Inf. Process. Agric. 2015, 2, 183–190. [Google Scholar] [CrossRef] [Green Version]
  24. Kool, D.; Tong, B.; Tian, Z.; Heitman, J.L.; Sauer, T.J.; Horton, R. Soil water retention and hydraulic conductivity dynamics following tillage. Soil Tillage Res. 2019, 193, 95–100. [Google Scholar] [CrossRef] [Green Version]
  25. Bai, Y.X.; Zhou, Y.C.; He, H.Z. Effects of rehabilitation through afforestation on soil aggregate stability and aggregate-associated carbon after forest fires in subtropical China. Geoderma 2020, 376, 114548. [Google Scholar] [CrossRef]
  26. Walkley, A.; Black, I.A. An examination of the Degtjareff method for determining soil organic matter, and a proposed modification of the chromic acid titration method. Soil Sci. 1934, 37, 29–38. [Google Scholar] [CrossRef]
  27. Huang, X.F.; Zhou, Y.C.; Zhang, Z.M. Carbon Sequestration Anticipation Response to land use change in a mountainous karst basin in China. J. Environ. Manag. 2018, 228, 40–46. [Google Scholar] [CrossRef]
  28. Fan, H.B.; Liu, W.F.; Wu, J.P.; Li, Y.Y.; Yuan, Y.H.; Liao, Y.C.; Huang, R.Z.; Su, X.Q. Ecosystem carbon pools in mixed stands of hardwood species and masson pine. J. Trop. For. Sci. 2013, 25, 154–165. Available online: https://www.jstor.org/stable/23617029 (accessed on 29 September 2021).
  29. Nagler, M.; Fontana, V.; Lair, G.J.; Radtke, A.; Tasser, E.; Zerbe, S.; Tappeiner, U. Different management of larch grasslands in the European Alps shows low impact on above- and belowground carbon stocks. Agric. Ecosyst. Environ. 2015, 213, 186–193. [Google Scholar] [CrossRef]
  30. Terrer, C.; Phillips, R.P.; Hungate, B.A.; Rosende, J.; Ridge, J.P.; Craig, M.E.; Groenigen, K.J.v.; Keenan, T.F.; Sulman, B.N.; Stocker, B.D.; et al. A trade-off between plant and soil carbon storage under elevated CO2. Nature 2021, 591, 599–603. [Google Scholar] [CrossRef]
  31. Ming, A.G.; Jia, H.Y.; Zhao, J.L.; Tao, Y.; Li, Y.F. Above- and below-ground carbon stocks in an indigenous tree (Mytilaria laosensis) plantation chronosequence in subtropical China. PLoS ONE 2014, 9, e109730. [Google Scholar] [CrossRef]
  32. Wellock, M.L.; Rashad, R.; Laperle, C.M.; Matthias, P.; Gerard, K. Changes in ecosystem carbon stocks in a grassland ash (Fraxinus excelsior) afforestation chronosequence in Ireland. J. Plant. Ecol. 2014, 7, 429–438. [Google Scholar] [CrossRef] [Green Version]
  33. Yang, Y.H.; Li, P.; Ding, J.; Zhao, X.; Ma, W.H.; Ji, C.J.; Fang, J.Y. Increased topsoil carbon stock across China’s forests. Glob. Chang. Biol. 2014, 20, 2687–2696. [Google Scholar] [CrossRef]
  34. Ziche, D.; Grüneberg, E.; Hilbrig, L.; Höhle, J.; Kompa, T.; Liski, J.; Repo, A.; Wellbrock, N. Comparing soil inventory with modelling: Carbon balance in central European forest soils varies among forest types. Sci. Total Environ. 2019, 647, 1573–1585. [Google Scholar] [CrossRef]
  35. Makita, N.; Fujii, S. Tree species effects on microbial respiration from decomposing leaf and fine root litter. Soil Biol. Biochem. 2015, 88, 39–47. [Google Scholar] [CrossRef]
  36. Cao, J.B.; He, X.X.; Chen, Y.Q.; Chen, Y.P.; Zhang, Y.J.; Yu, S.Q.; Zhou, L.X.; Liu, Z.F.; Zhang, C.L.; Fu, S.L. Leaf litter contributes more to soil organic carbon than fine roots in two 10-year-old subtropical plantations. Sci. Total Environ. 2020, 704, 135341. [Google Scholar] [CrossRef]
  37. Fang, J.Y.; Guo, Z.D.; Piao, S.L.; Chen, A.P. Estimation of carbon sink in China land from 1981 to 2000. Sci. China Ser. D Earth Sci. 2007, 37, 804–812. [Google Scholar]
  38. Wei, Y.M.; Liao, Z.W.; Mao, X.Y. Organic Carbon: A New Concept for Development of Modern Fertilizers and Plant Nutrition Theory. Asian Agric. Res. 2020, 12, 50–53. [Google Scholar] [CrossRef]
  39. Henry, R.J.; Furtado, A.; Rangan, P. Pathways of Photosynthesis in Non-Leaf Tissues. Biology 2020, 9, 438. [Google Scholar] [CrossRef]
  40. Shahbaz, M.; Kumar, A.; Kuzyakov, Y.; Börjesson, G.; Blagodatskaya, E. Interactive priming effect of labile carbon and crop residues on SOM depends on residue decomposition stage: Three-source partitioning to evaluate mechanisms. Soil Biol. Biochem. 2018, 126, 179–190. [Google Scholar] [CrossRef]
  41. Vannoppen, W.; Vanmaercke, M.; De Baets, S.; Poesen, J. A review of the mechanical effects of plant roots on concentrated flow erosion rates. Earth Sci. Rev. 2015, 150, 666–678. [Google Scholar] [CrossRef] [Green Version]
  42. Yan, Y.J.; Dai, Q.H.; Hu, G.; Jiao, Q.; Fu, W.B. Effects of vegetation type on the microbial characteristics of the fissure soil-plant systems in karst rocky desertification regions of SW China. Sci. Total Environ. 2020, 712, 136543. [Google Scholar] [CrossRef]
  43. Feudis, M.D.; Car De Lli, V.; Massaccesi, L.; Hofmann, D.; Berns, A.; Bol, R.; Cocco, S.; Corti, G.; Agnelli, A. Altitude affects the quality of the water-extractable organic matter (WEOM) from rhizosphere and bulk soil in European beech forests. Geoderma 2017, 302, 6–13. [Google Scholar] [CrossRef]
  44. Wang, H.X.; Wu, C.Y.; Chen, D.S.; Liu, H.Y.; Sun, X.M.; Zhang, S.G. Changes in soil carbon and nutrients and related extracellular enzymes in successive rotations of Japanese larch plantations. Catena 2021, 204, 105386. [Google Scholar] [CrossRef]
  45. Li, M.M.; Zhang, X.C.; Pang, G.W.; Han, F.P. The estimation of soil organic carbon distribution and storage in a small catchment area of the Loess Plateau. Catena 2013, 101, 11–16. [Google Scholar] [CrossRef]
  46. Gao, X.; Ding, G.J.; Zhai, S.S.; Chen, M.F.; Du, H.D. Spatial distribution of root biomass of Pinus massoniana plantations under different planting densities. J. Cent. South. Univ. For. Technol. 2014, 34, 71–75. [Google Scholar]
  47. Li, M.; Han, X.Z.; Du, S.L.; Li, L.J. Profile stock of soil organic carbon and distribution in croplands of Northeast China. Catena 2019, 174, 285–292. [Google Scholar] [CrossRef]
  48. Martínez, G.L.B.; Korthals, G.W.; Brussaard, L.; Mainardi, G.; De, D.G.B. Litter quality drives nitrogen release, and agricultural management (organic vs. conventional) drives carbon loss during litter decomposition in agro-ecosystems. Soil Biol. Biochem. 2021, 153, 108115. [Google Scholar] [CrossRef]
  49. Bader, N.E.; Cheng, W. Rhizosphere priming effect of Populus fremontii obscures the temperature sensitivity of soil organic carbon respiration. Soil Biol. Biochem. 2006, 39, 600–606. [Google Scholar] [CrossRef]
  50. Feng, W.T.; Liang, J.Y.; Hale, L.E.; Jung, C.G.; Chen, J.; Zhou, J.Z.; Xu, M.G.; Yuan, M.T.; Wu, L.Y.; Bracho, R.; et al. Enhanced decomposition of stable soil organic carbon and microbial catabolic potentials by long-term field warming. Glob. Chang. Biol. 2017, 23, 4765–4776. [Google Scholar] [CrossRef]
  51. Howard, P.; Loveland, P.J.; Bradley, R.I.; Dry, F.T.; Howard, D.C. The carbon content of soil and its geographical distribution in Great Britain. Soil Use Manag. 1995, 11, 9–15. [Google Scholar] [CrossRef]
  52. An, S.; Mentler, A.; Mayer, H.; Blum, W.E.H. Soil aggregation, aggregate stability, organic carbon and nitrogen in different soil aggregate fractions under forest and shrub vegetation on the Loess Plateau, China. Catena 2010, 81, 226–233. [Google Scholar] [CrossRef]
  53. Akpa, S.I.C.; Odeh, I.O.A.; Bishop, T.F.A.; Hartemink, A.E.; Amapu, I.Y. Total soil organic carbon and carbon sequestration potential in Nigeria. Geoderma 2016, 271, 202–215. [Google Scholar] [CrossRef]
  54. Alidoust, E.; Afyuni, M.; Hajabbasi, M.A.; Mosaddeghi, M.R. Soil carbon sequestration potential as affected by soil physical and climatic factors under different land uses in a semiarid region. Catena 2018, 171, 62–71. [Google Scholar] [CrossRef]
  55. Kabir, E.B.; Bashari, H.; Mosaddeghi, M.; Bassiri, M. Soil aggregate stability and organic matter as affected by land-use change in central Iran. Arch. Agron. Soil Sci. 2017, 63, 1823–1837. [Google Scholar] [CrossRef]
  56. Zhao, P.P.; Shao, M.G.; Wang, T.J. Spatial Distributions of Soil Surface-Layer Saturated Hydraulic Conductivity and Controlling Factors on Dam Farmlands. Water Resour. Manag. 2010, 24, 2247–2266. [Google Scholar] [CrossRef]
  57. Ye, G.P.; Lin, Y.X.; Kuzyakov, Y.; Liu, D.Y.; Luo, J.F.; Lindsey, S.; Wang, W.J.; Fan, J.B.; Ding, W.X. Manure over crop residues increases soil organic matter but decreases microbial necromass relative contribution in upland Ultisols: Results of a 27-year field experiment. Soil Biol. Biochem. 2019, 134, 15–24. [Google Scholar] [CrossRef]
Figure 1. Variability of carbon stocks across a chronosequence of Masson pine plantations. Significance level: *, p < 0.05.
Forests 12 01342 g001
Figure 2. Carbon stocks in the plant and soil systems of Masson pine plantations. The different lowercase letters indicate significant differences at different stand ages (p < 0.05).
Forests 12 01342 g002
Figure 3. Carbon densities in various components of trees across a chronosequence of Masson pine plantations.
Forests 12 01342 g003
Figure 4. The variation in carbon density in different plant types and litter across a chronosequence of Masson pine plantations.
Forests 12 01342 g004
Figure 5. Variability in SOC density across a chronosequence of Masson pine plantations.
Forests 12 01342 g005
Figure 6. The proportions of C stock in Masson pine plantation ecosystems. (a) The proportions of C stock in systems; (b) The proportions of C stock in different components.
Forests 12 01342 g006
Figure 7. The sorting of correlations between carbon stocks and soil properties. Cstock-1, Cstock-2, Cstock-3, and Cstock-4 represent carbon stocks in the 0–20 cm, 20–40 cm, 40–60 cm, and 60–80 cm soil layers, respectively; Cstock-S, plant system carbon stock; Cstock-P, plant system carbon stock; Cstock-T, carbon stock of trees; Cstock-L, carbon stock of litter; Cstock-B, carbon stock of shrubs; Cstock-H, carbon stock of herbs.
Forests 12 01342 g007
Figure 8. Structural equation model of the relationship between C stocks, stand age, and plant biomass. Numbers on arrows are standardized path coefficients; arrow width is proportional to the standardized coefficient; continuous and dashed arrows indicate positive and negative relationships, respectively. Chi-squared = 2.782, df = 4, P = 0.595, GFI = 0.895, RMR = 0.124, RMSEA = 0.000, NFI = 0.987, RFI = 0.968.
Forests 12 01342 g008
Table 1. Basic information of sampling plots in Masson pine plantations.
Stand Age (a)Slope DirectionSlope (°)Elevation (m)Soil TypeBulk Density (g/cm−3)Carbon (g/kg)Nitrogen (g/kg)Phosphorus (g/kg)Canopy DensityAverage Diameter at Breast High (cm)Average Tree Height (m)Tree Density (Individual/hm2)Main Species
7NW 35°281072–1076yellow soil1.2820.460.930.170.53.252.781187Dicranopteris linearis, Imperata cylindrica (L.) Beauv., Miscanthus floridulus (Lab.) Warb. ex Schum. et Laut., Nandina domestica
14NE 13°351063–1066yellow soil1.1223.191.540.240.711.0310.671103
30NE 45°301067–1068yellow soil1.0822.801.000.160.925.1015.43403
Table 2. Stepwise multivariate regression analysis of the SOC stocks at different depths.
Soil Depth
(cm)
TermNonstandard
Coefficient
Standard
Coefficient
Adjusted
R2
p Value
0–20 (Constant)3.608 0.8020.001
SBD2.5140.909
20–40 (Constant)4.216 0.6440.019
MWD1.0871.039
SBD−2.203−0.653
40–60 (Constant)0.827 0.7230.002
WSA > 0.25 mm0.8200.870
60–80(Constant)0.533 0.6840.004
GMD4.6320.851
Publisher’s Note: MDPI stays neutral with regard to jurisdictional claims in published maps and institutional affiliations.

