Article

Stochastic Economic Analysis of Investment Projects in Forest Restoration Involving Containerized Tree Seedlings in Brazil

by
Danilo Simões
1,
Jean Fernando Silva Gil
2,
Richardson Barbosa Gomes da Silva
2,*,
Rafaele Almeida Munis
2 and
Magali Ribeiro da Silva
2
1
Campus of Itapeva, São Paulo State University (UNESP), Itapeva 18409-010, SP, Brazil
2
School of Agriculture, São Paulo State University (UNESP), Botucatu 18610-034, SP, Brazil
*
Author to whom correspondence should be addressed.
Forests 2021, 12(10), 1381; https://doi.org/10.3390/f12101381
Submission received: 19 September 2021 / Revised: 7 October 2021 / Accepted: 8 October 2021 / Published: 10 October 2021
(This article belongs to the Section Forest Economics, Policy, and Social Science)

Abstract

:
Background: Experts in ecological restoration have discussed the cost reduction to make forest restoration financially feasible. This is very important in developing countries, such as Brazil, and for smallholder farmers; however, economic studies do not usually consider the uncertainties in their analysis. Therefore, this study aimed to analyze, under conditions of uncertainty, how tropical tree seedlings produced in polyethylene bags, polyethylene tubes, and biodegradable containers (Ellepot®) interfere with the costs of implementation and post-planting maintenance investment projects in a deforested tropical seasonal forest area in southern Brazil. Methods: We evaluated total costs, production costs, and equivalent annual uniform costs, and the probability distributions and estimated ranges of stochastic values were adjusted through Monte Carlo method simulation. Furthermore, the seedling survival rate was recorded over 12 months post-planting. Results: The costs with tree seedling acquisition and direct labor were the components that most impacted total costs in the three investment projects. The forest restoration investment project with tree seedlings produced in polyethylene bags was economically unfeasible in relation to other projects. Conclusions: The best economic alternative was observed in the investment project with tree seedlings produced in Ellepot®, which showed a survival rate >80% after one year and the lowest total cost, production cost, and equivalent uniform annual cost.

1. Introduction

Natural ecosystems provide humanity with several direct and indirect benefits. However, deforestation, followed by inappropriate use of the soil, can cause changes in the global temperature and, consequently, problems in the public health, social, and economic security of countries [1,2,3,4].
In Brazil, 88.27% of the original Atlantic Forest has been lost, and only 11.73% of the original vegetation (16,377,472 ha) remains [5]. Furthermore, the Brazilian Atlantic Forest biome is a hotspot for the conservation of global biodiversity [6]. In 2015, at the 21st Conference of the Parties (COP 21), Brazil assumed the agreement to restore an area of 12 million hectares by 2030 [7]. It is estimated that this long-term project could cost from USD 8.9 billion to USD 15.9 billion [8], requiring the implementation of techniques and tools to mitigate these costs.
In forest restoration, applying measures that mitigate costs is fundamental for the acceptance and financing of projects [9]. Thereby, reducing costs, establishing executable goals, and inferring about future scenarios can be potential tools in the analysis of investment in forest restoration.
Forest restoration through the planting of containerized tropical tree seedlings is the common technique used in Brazil [10,11]. For forest restoration in Brazil, most seedlings are produced in polyethylene bags and polyethylene tubes. Comparatively, the use of biodegradable containers is less; however, it has increased in recent years. In addition to container type, the acquisition of seedlings for restoration areas is based mainly on seedling quality [12,13], production availability of tree nurseries, or the lowest cost [14].
Thus, experts in ecological restoration have discussed the cost reduction to make forest restoration financially feasible [8,14,15,16,17,18,19]. Restoration implementation costs indicated that plantations established on croplands and pasturelands cost USD 2500 ha−1 and USD 3750 ha−1 [16]. According to [8], inputs for active restoration comprised >50% of the total restoration costs, suggesting an opportunity to develop cost-saving innovations. The lack of rigorous analyses of the major components and drivers of restoration costs limit the development of alternatives to reduce costs and the selection of the most cost-effective methods to achieve restoration goals.
Furthermore, studies aimed at estimating and reducing forest restoration project costs [16] do not usually consider the uncertainties in their analysis. There are uncertainties about the costs of forest restoration projects, and this has important implications for how we adapt decision-making approaches. Uncertainty refers to situations in which the probabilities are unknown. However, to make analyses easier, the situation is transformed from uncertainty to risk by assuming some distributions for the uncertain factors. This allows the researcher to calculate the probabilities of different outcomes of decision alternatives [20]. A central challenge for the coming years is to develop environmental policies and initiatives that use restoration planning to maximize return-on-investment in forest regeneration across multiple socioeconomic and ecological objectives while minimizing competition with food production, consequently helping countries worldwide to achieve the ambitious targets of global forest restoration [18]. Therefore, this study aimed to analyze how tree seedlings produced in different containers interfere with the costs of implementation and post-planting maintenance investment projects in forest restoration under conditions of uncertainty.

2. Materials and Methods

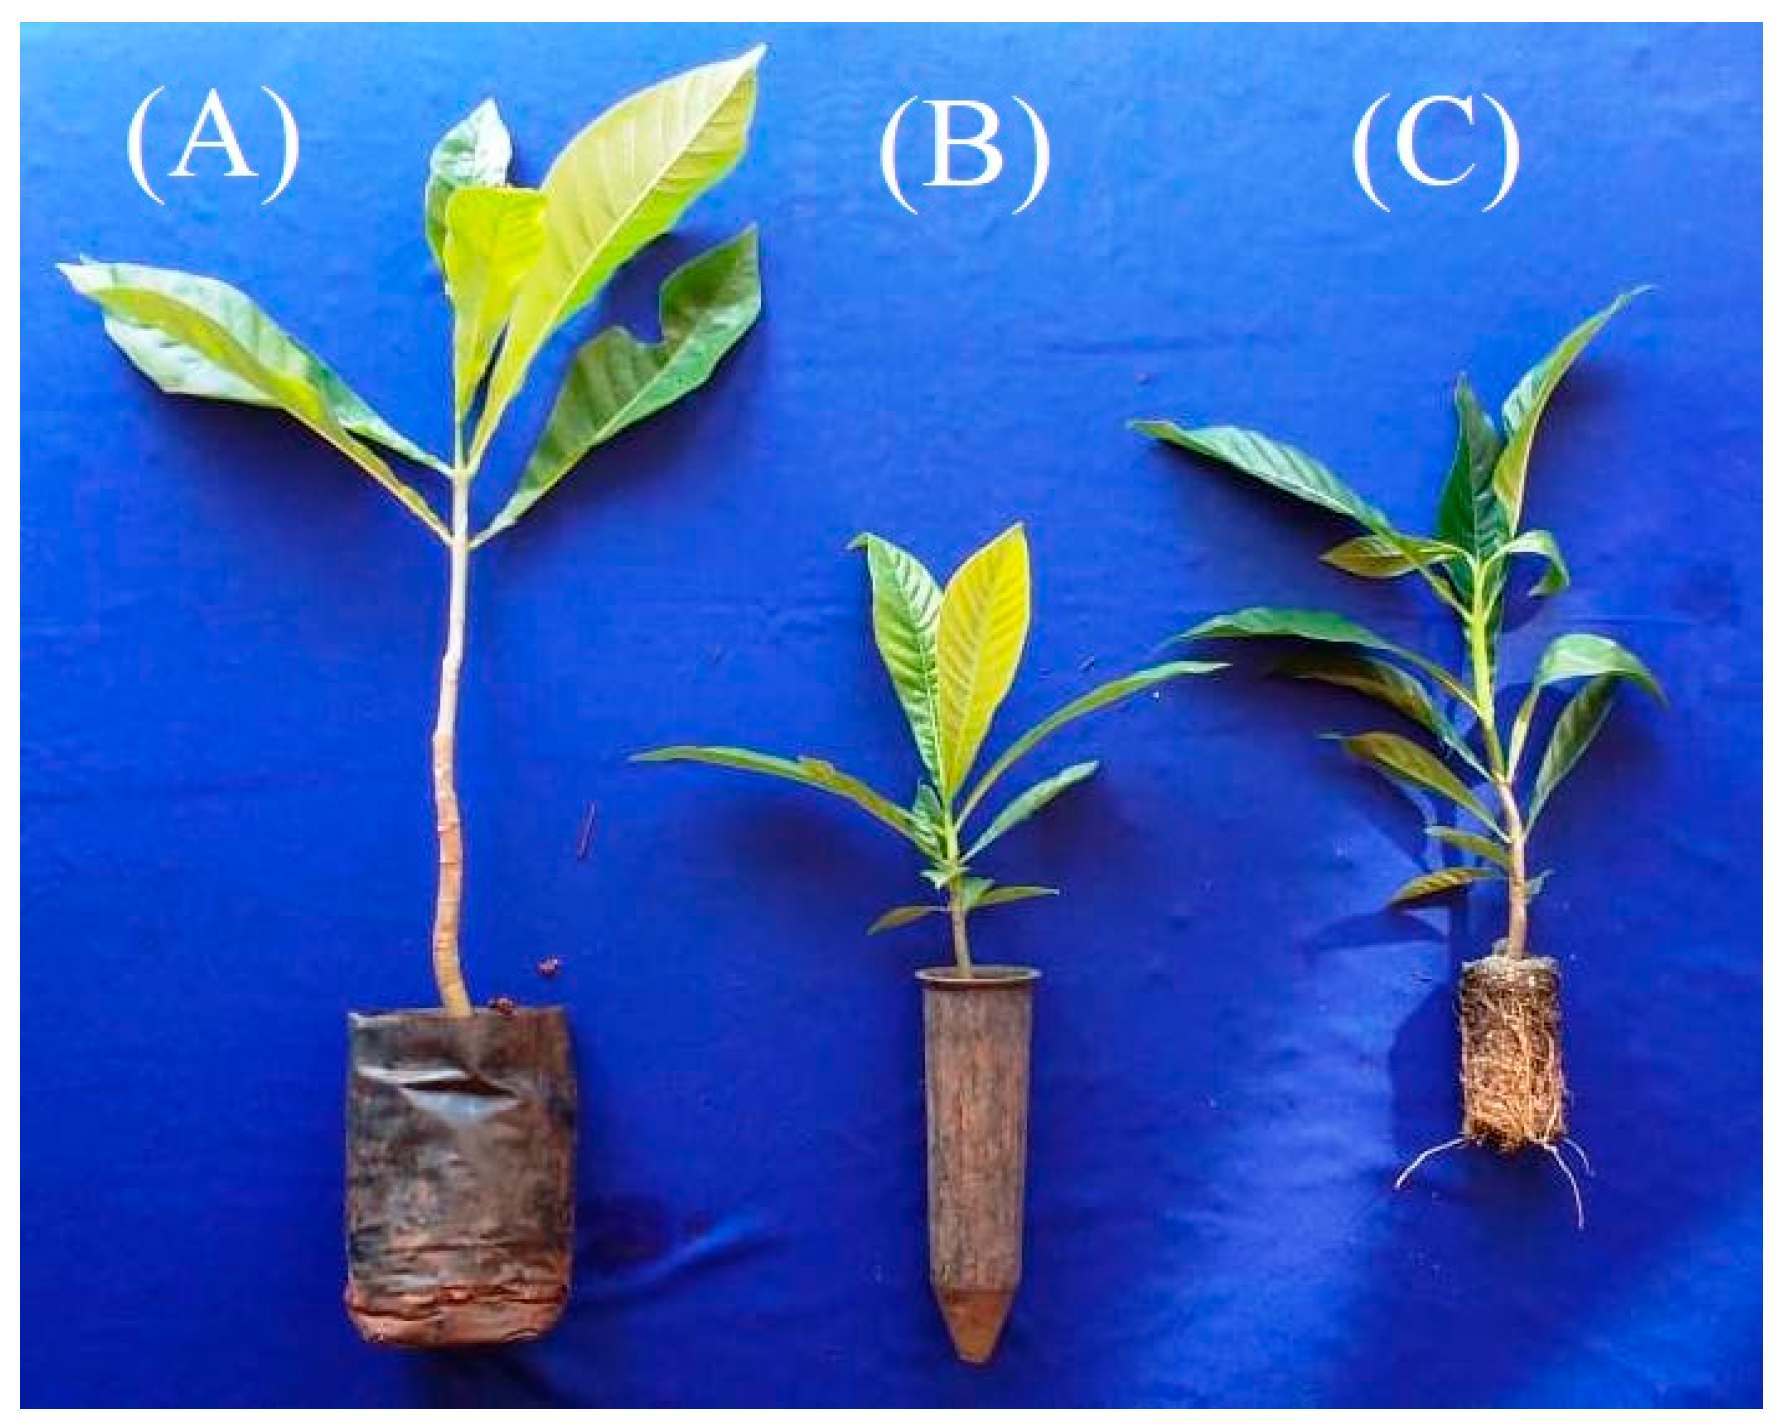
2.1. Site Description and Experimental Details

The study was conducted on an abandoned pasture area of 1176 m2 located in the Midwest region of São Paulo State, Brazil (23°05′ S 48°34′ W) (Figure 1). The dominant species in the area, before the experiment was settled, were invasive exotic grasses, mainly of the genus Brachiaria spp. The original phytophysiognomy cover in this region is classified as seasonal semi-deciduous tropical forest, within the Atlantic Forest domain.
The climate of the region is Cfa (hot climate with rains in the summer and drought in the winter, and the average temperature in the hottest month is above 22 °C), according to the Köppen classification. In addition, the average annual rainfall is 1350 mm [21]. The local topography is flat, with a slope inferior to 3%. The soil is an Oxisol of low fertility with sandy texture.
The restoration technique used was active forest restoration through the planting of tropical tree seedlings species (Table 1) at 3 × 2 m spacing. These seedlings were produced in three types of containers (polyethylene bags, polyethylene tubes, and Ellepot® degradable containers) (Figure 2).
We carried out the following silvicultural operations at the planting: semi-mechanized weed mowing, manual control of leaf-cutting ants with ant traps (Mirex-S® active ingredient sulfluramid), seedling crowning with a manual hoe (within an approximate radius of 50 cm around the seedling), digging holes with a manual digger (40 cm diameter × 70 cm deep), planting of seedlings, starter fertilization and liming in each planting hole (100 g of termophosphate Yoorin®, 50 g of dolomitic limestone, and 50 g of chicken manure fertilizer), and irrigation with hydro-absorbent polymer (each planting hole received 2.0 L of solution). In post-planting maintenance, two side dressing fertilizations in each seedling (450 g of NPK 20-0-20), seven semi-mechanized weed mowings, and seedling crowning were implemented.

2.2. Economic Analysis of Forest Restoration Investment Projects

The economic parameters of this work are based on empirical data, and the inputs were obtained from forestry suppliers. In this study, forest restoration projects were characterized as forest investment projects, which differed according to container type used to produce tropical tree seedlings, which are associated with the following unit purchase prices: USD 0.79 (polyethylene bags), USD 0.28 (polyethylene tubes), and USD 0.21 (Ellepot® degradable containers).
For total costs (Equation (1)), we added the direct and indirect costs according to [22]. Direct costs included costs involving the purchase of seedlings and forest inputs, fuel for brush cutters, maintenance of machinery and equipment, direct labor, and social charges (56.51%). Regarding indirect costs, indirect labor, administrative costs, remuneration of production factors, and economic depreciation of simple and composite machines were considered. Further details regarding direct and indirect costs in our study are provided in the Supplementary Materials (Tables S1–S3),
TC = DC + IC  
in which TC is the total cost (USD ha−1), DC is the direct cost (USD ha−1), and IC is the indirect cost (USD ha−1).
For production costs, we considered the ratio between cost per effective work hour and the effective productivity of operations, both for implementation of seedlings and for post-planting maintenance, according to Equation (2), proposed by [23]. Further details regarding the productivity of operations in our study are provided in the Supplementary Materials (Tables S4–S6).
PC = CEWH P
in which PC is the production cost (USD ha−1), CEWH is the cost per effective work hour (USD h−1), and P is effective productivity (man-hour ha−1).
We projected the expected cash flows (Equation (3)) for a three-year time horizon; therefore, we considered the acquisition of permanent material and all the investments required until the establishment of seedlings. These flows were considered unconventional [24] and mutually exclusive [25]. Further details regarding capital expenditure in our study are provided in the Supplementary Materials (Tables S1–S3),
CF = ( DC + IC ) ( DP + AC ) + DP CAPEX  
in which CF is cash flow, DC are the direct costs for the period, IC are the indirect costs for the period, DP is the economic depreciation of fixed assets, AC are the administrative costs, and CAPEX is the capital expenditure.

2.3. Opportunity Cost Rate Estimate

According to [26], we estimated the opportunity cost rate of investment projects using the Weighted Average Cost of Capital (WACC) (Equation (4)). The participation of third-party capital was considered to finance investment projects in forest restoration,
i = Ek e E + D + Dk d × ( 1 T ) E + D  
in which i is the weighted average cost of capital, E is the cost of equity of investment project, k e is the opportunity cost rate for using equity, D is the third-party capital cost of investment project, k d is the rate of third-party capital opportunity cost, and T is the firm’s corporate tax rate (according to the tax legislation in force in Brazil, we adopted 34.00%).
According to [27], we estimated the opportunity cost rate for using equity (Equation (5)) based on the Capital Asset Pricing Model—CAPM. Nevertheless, the country’s risk premium was added to the equation in order to strengthen the ability to pay debts [28],
k e = r f + β   ( E m r f ) + S  
in which k e is the expected return on the company’s common equity, r f is the risk-free rate of return, β is the systematic market risk coefficient of the forestry sector, E m is the expected rate of return of the forestry market portfolio, ( E m     r f ) is the market risk premium, and S   is the average risk premium in Brazil.
According to [29], we adopted the rate of return associated with an asset that has no risk based on the geometric mean of historical data of the 10-year Treasury rate (5.24%).
We adopted the systematic market risk coefficient based on the diversifiable risk of companies in the forestry sector (0.47), according to the data provided by [30]. As for the expected rate of return of the market portfolio, we adopted the value available on the S&P Global Timber and Forestry Index [31] over a 10-year period (4.90%).
For country’s risk premium, we adopt the geometric mean of historical data of the Emerging Markets Bond Index Plus—EMBI + BE (9.07%), provided by [32]. We estimated the third-party opportunity cost rate by adding the Spread in Brazil (2.65% provided by [33]), classified according to [34] as Ba2—speculative grade, and the rate of return on a risk-free asset (7.89%). In addition, we adopted 40.00% as a capital structure and 60.00% originated from third parties. We adopted 6.75% as the opportunity cost rate.

2.4. Equivalent Uniform Annual Cost (EUAC)

We estimated EUAC according to Equation (6). The EUAC transforms a series of payments and disbursement over the course of the project in the presented accumulated value.
EUAC   =   P 0 [ ( 1 + i ) n × i ( 1 + i ) n 1 ]
in which EUAC is the equivalent uniform annual cost, P 0 is the total of all payment and disbursement streams, n is the duration of a project, and i is the weighted average cost of capital.

2.5. Stochastic Analysis

The components of production costs traditionally have associated uncertainties; therefore, we assigned probability distributions. Then, we characterized the inputs of mathematical models of the problems in the analysis. As a premise, the Kolmogorov-Smirnov test with a significance level of 1% to verify the normal distribution of data was applied. Then, the Bayesian Schwarz—BIC selection criterion was applied [35,36].
Therefore, we performed the simulation by the Monte Carlo method, using the software @RISK© 2020 [37] for the generation of 100,000 pseudo-random numbers. As such, according to [38], we adopted the Mersenne Twister pseudo-random number generator. We weighted the output parameters TC, PC, and EUAC. Finally, we used Spearman’s linear coefficient ( ρ s ) to determine the monotonic force [39] of values between the input and output parameters. According to [40], this coefficient assumes that zero indicates that there is no measurable correlation between variables, and the closer to one, whether positive or negative, the stronger the non-linear correlation.

2.6. Seedling Survival Rate

For seedling survival rate, we considered the post-planting period from May 2019 to May 2020, and we calculated the proportion of individuals alive after each month according to Equation (7). We compared survival rate for the different treatments using contingency tables and the chi-squared test (χ2) (p < 0.05).
Survival   rate   ( % ) = Number   of   seeldings   alive Number   of   seedlings   planted × 100  

3. Results

3.1. Stochastic Analysis of the Total Cost

The lowest total cost was observed in the investment project with tropical tree seedlings produced in Ellepot®, adjusted by Beta probability distribution model (BIC value = 1,040,374) with an average value of USD 1508.05 ha−1 and a standard deviation of 43, USD 98 ha−1. The highest total cost was obtained with tree seedlings produced in polyethylene bags, with the data adjusted through the Beta probability distribution model (BIC value = 1,199,849), with an average value of USD 2623.05 ha−1 and a standard deviation of USD 98.25 ha−1.
For the three container types, the cost components that most impacted total costs were tree seedlings acquisition, direct labor, forestry inputs, and fuel and lubricating oil (Figure 3).
The costs of tree seedling acquisition and direct labor showed the highest correlation coefficients in the three investment projects. It is important to highlight the very strong correlation coefficient represented by the cost of tree seedlings acquisition produced in polyethylene bags ( ρ s = 0.93). The direct labor costs in the investment projects with tree seedlings produced in Ellepot® and polyethylene tubes showed a positive correlation coefficient of 0.56 and 0.51, respectively, which can be considered moderate. In the investment project with tree seedlings produced in polyethylene bags, the correlation coefficient of direct labor was 0.25, which can be considered weak.

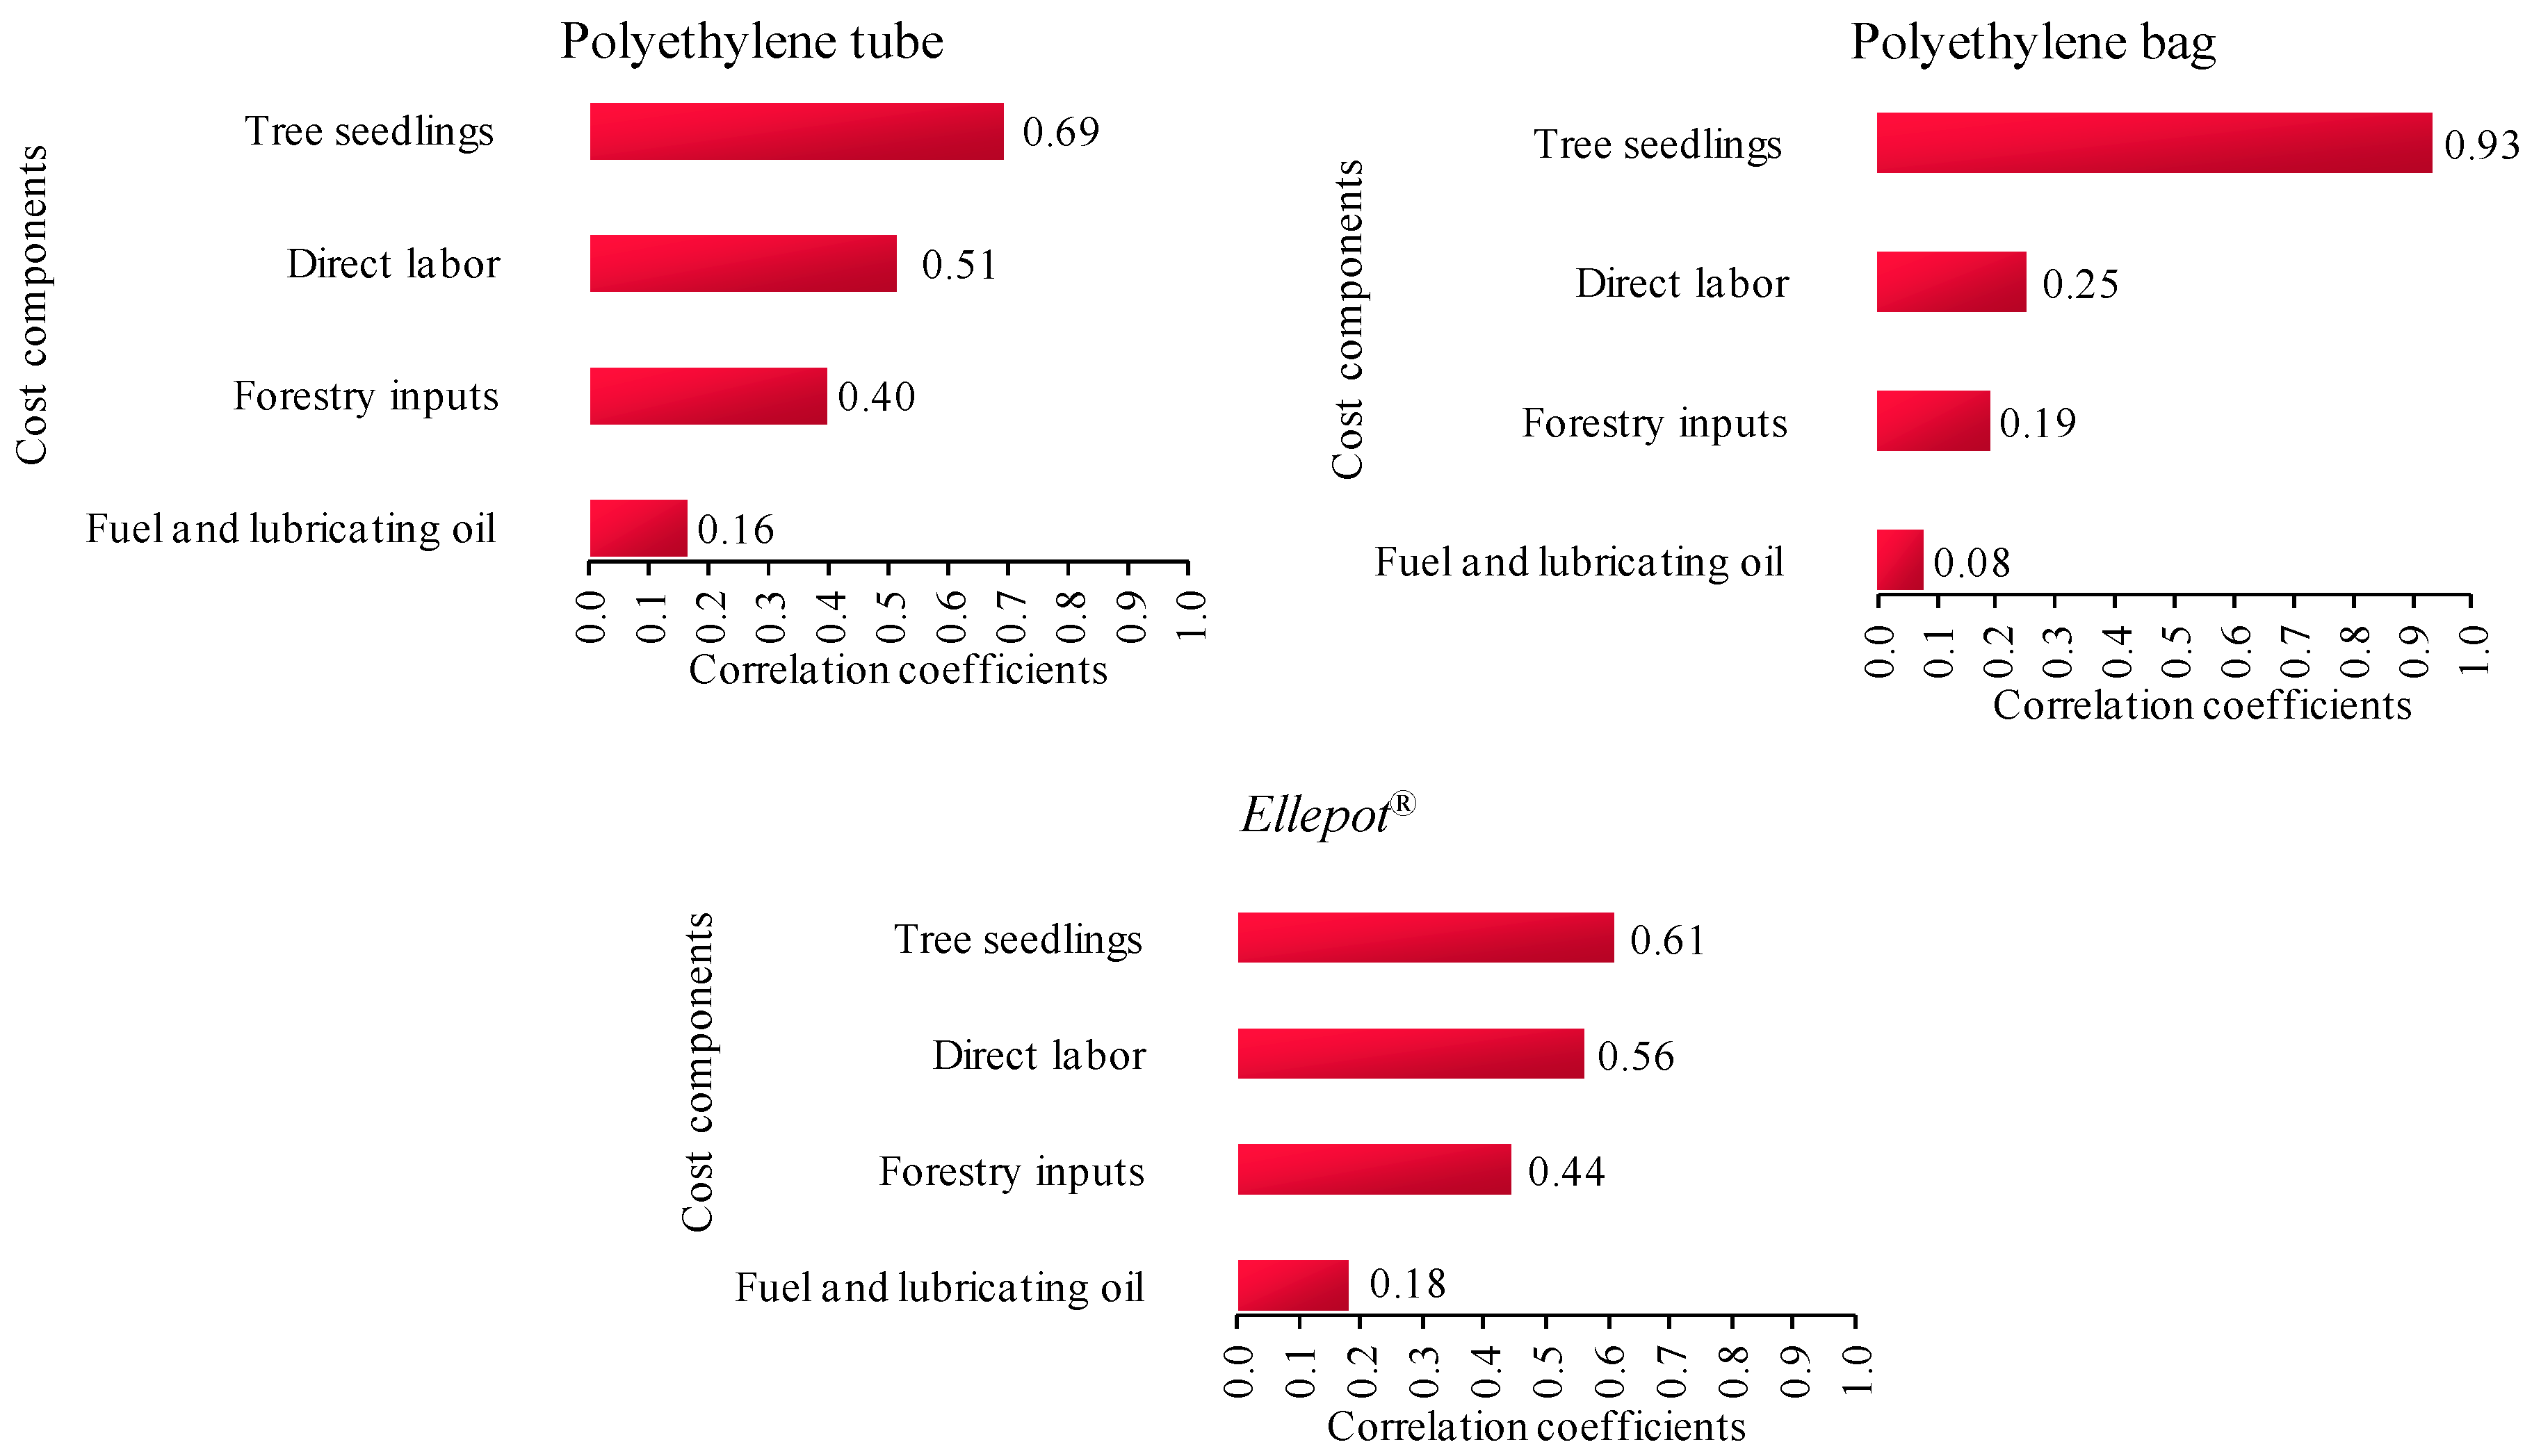
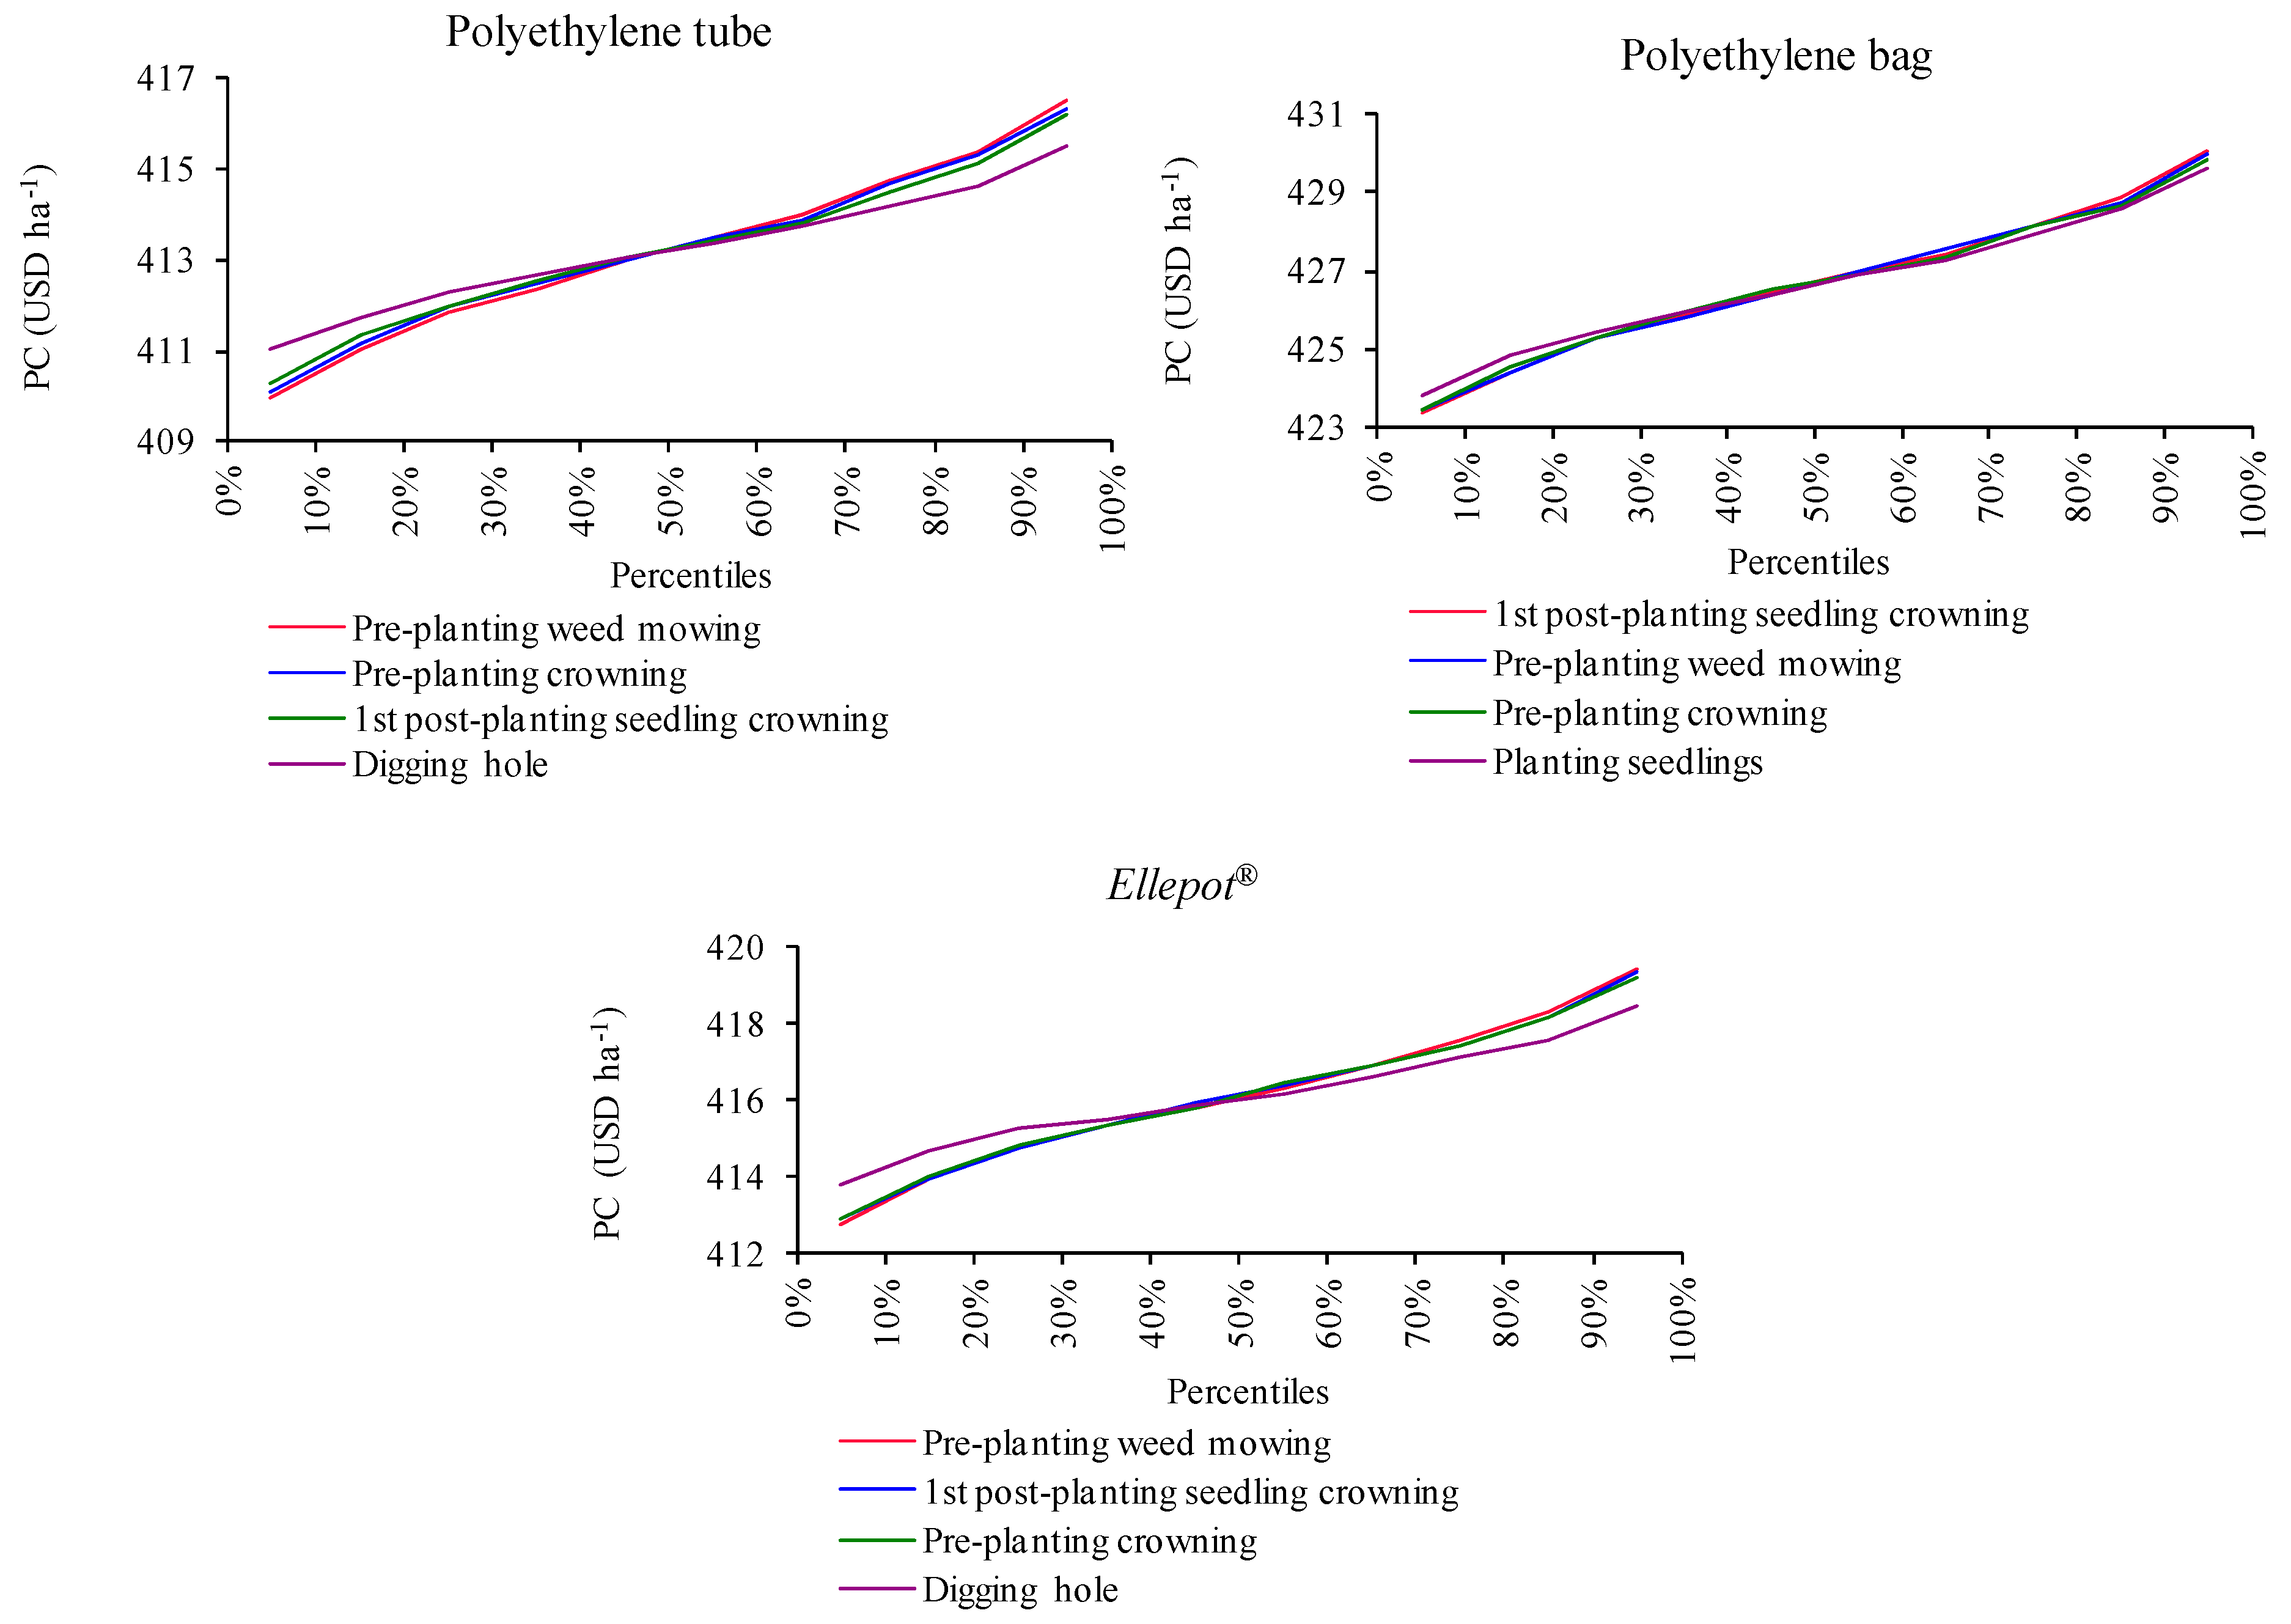
3.2. Stochastic Analysis of Production Costs

The lowest production cost was observed in the project with tree seedlings produced in Ellepot® adjusted through normal probability distribution (BIC value = 631,122), with an average value of USD 416.11 ha−1 and a standard deviation of USD 5.68 ha−1. The highest production cost was observed in the investment project with tree seedlings produced in polyethylene bags adjusted through normal probability distribution (BIC value = 637,173), with an average value of USD 426.67 ha−1 and a standard deviation of USD 5.58 ha−1. Furthermore, the weed mowing and seedling crowning operations contributed the most to the increased production cost of investment projects (Figure 4).

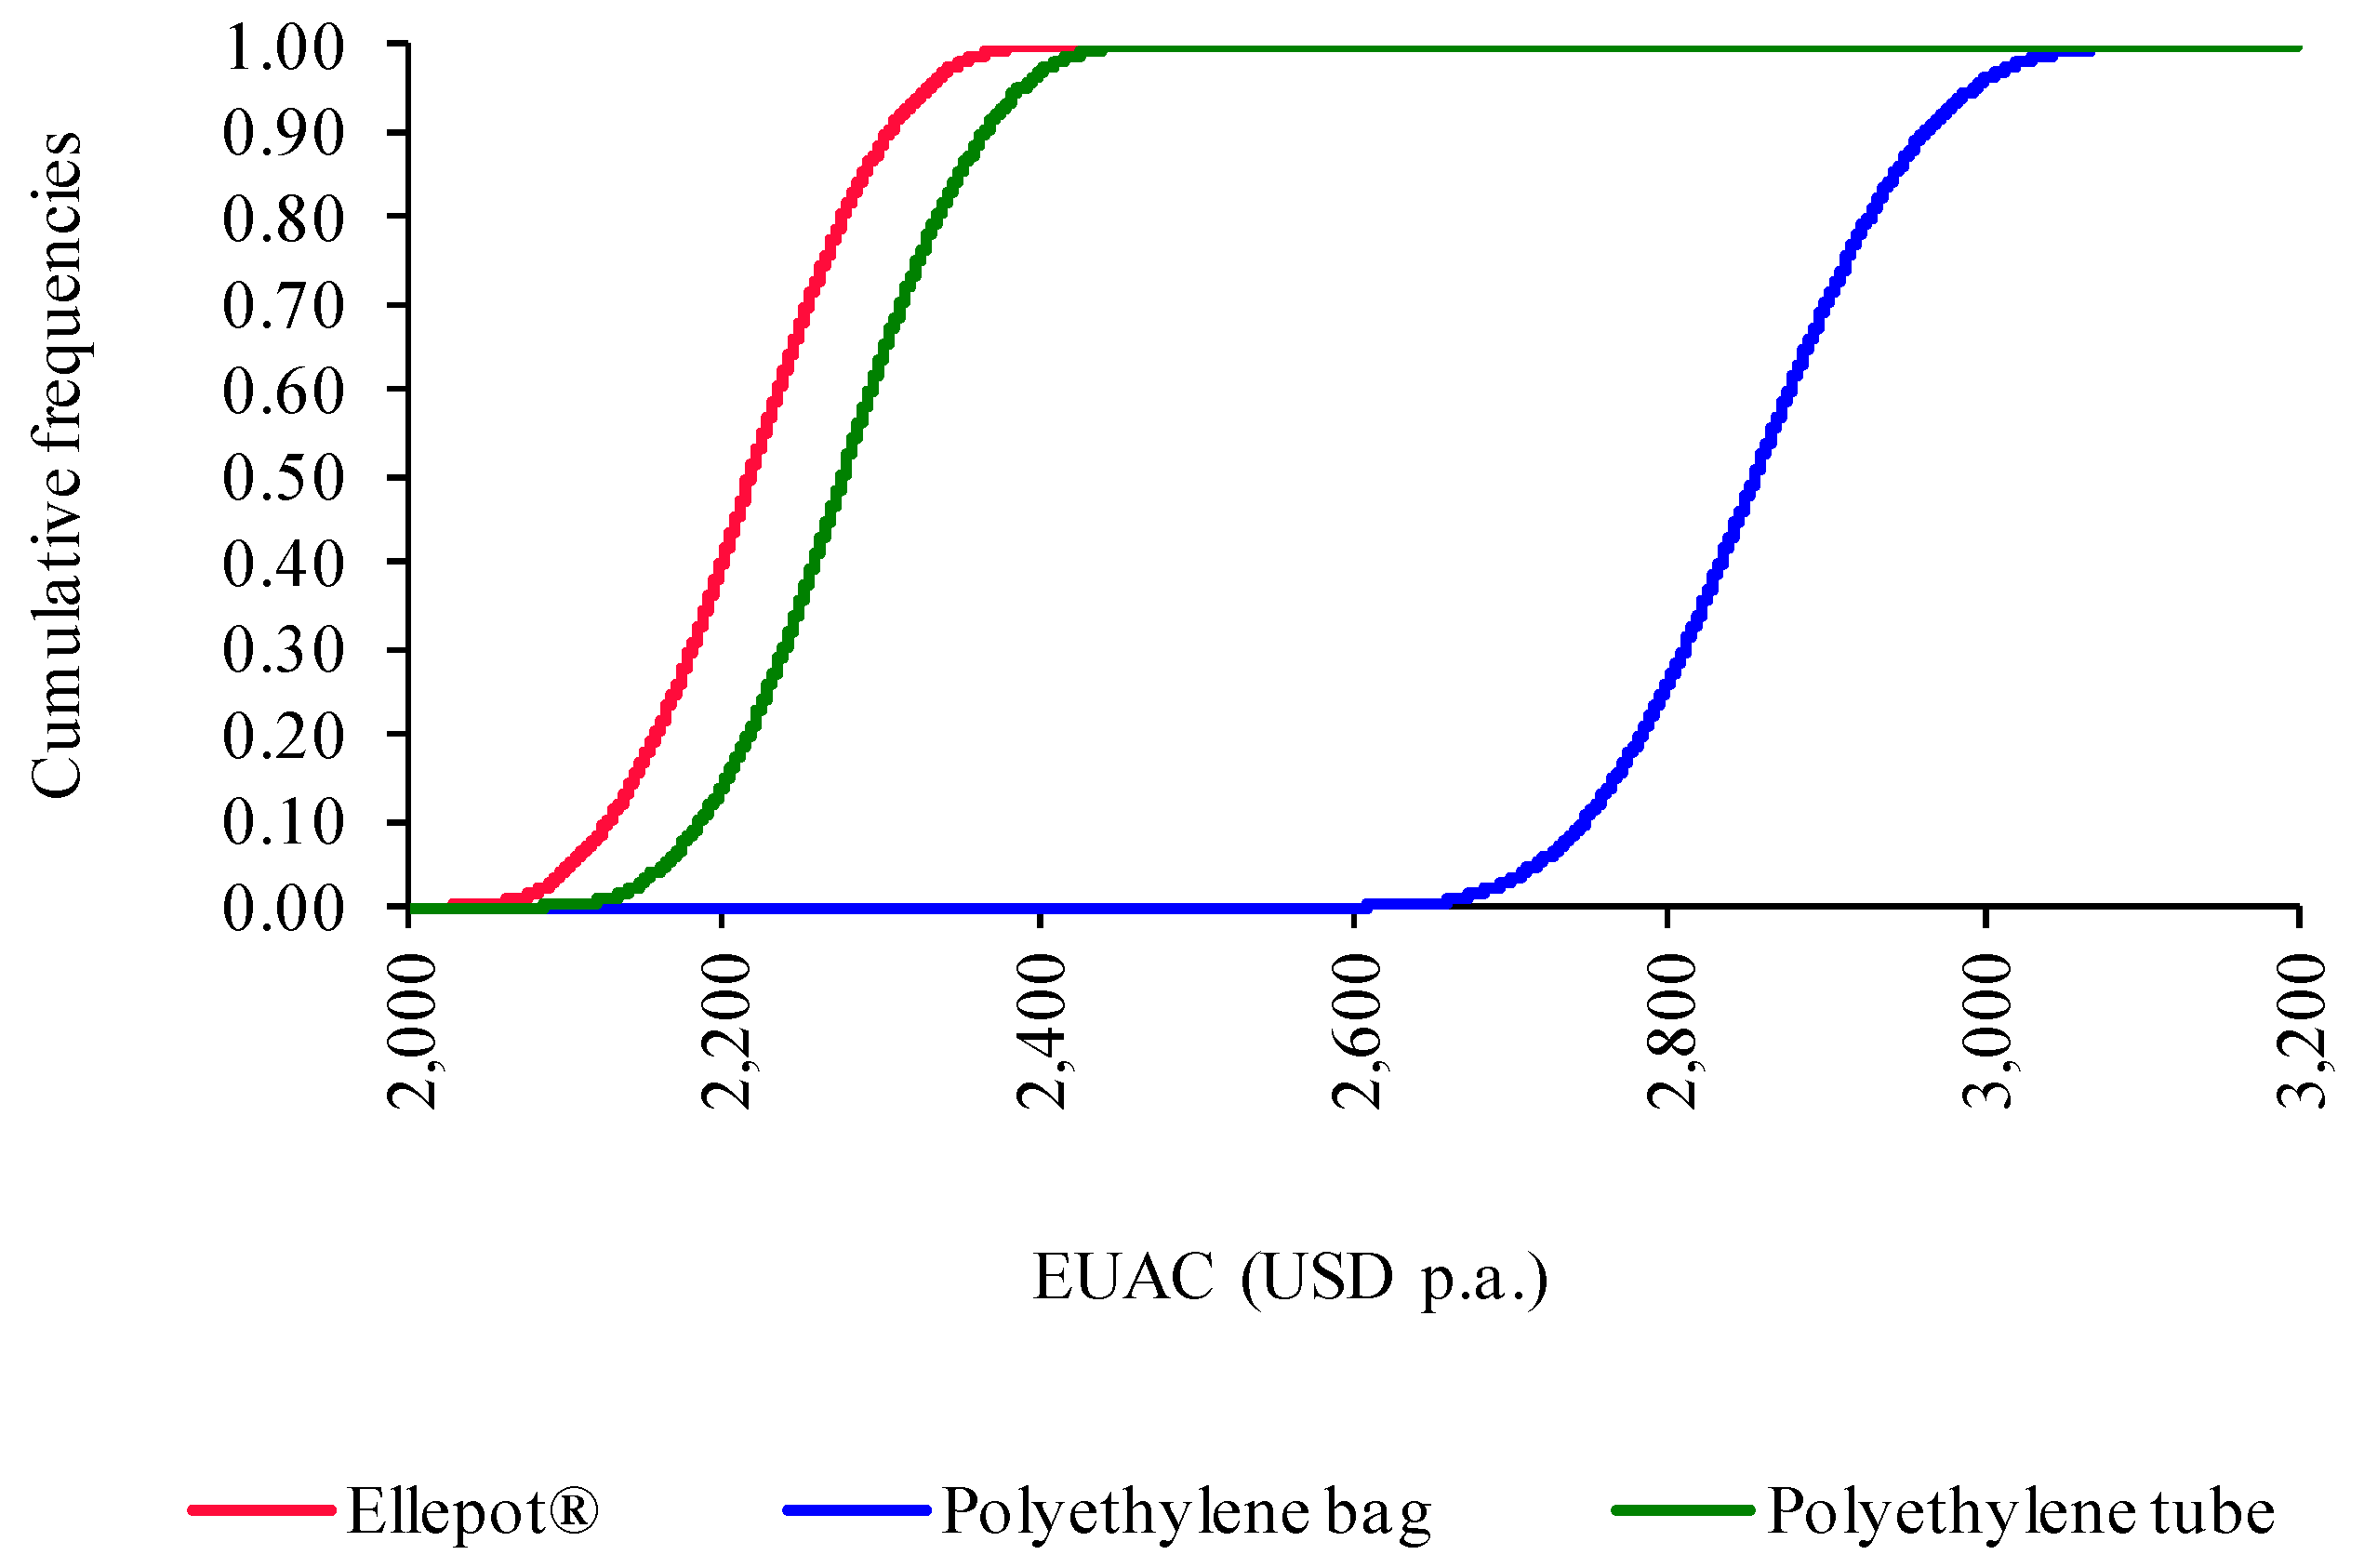
3.3. Stochastic Equivalent Uniform Annual Cost (EUAC)

When analyzing the EUAC of forest restoration investment projects, we found that the best data adjustments occurred through Beta probability distribution. The lowest EUAC value occurred in the project with tree seedlings produced in Ellepot®, with BIC value = 1,124,552, an average of USD 2216.71 p.a. and a standard deviation of USD 67.32 p.a. The highest EUAC occurred in the investment project that included tree seedlings produced in polyethylene bags; therefore, with BIC value = 1,168,304, an average of USD 2854.78 p.a., and a standard deviation of USD 83.46 p.a. In the project with the acquisition of tree seedlings in polyethylene tubes, we found that the average EUAC value was USD 2275.79 p.a. with a standard deviation of USD 68.05 p.a., and the value of the BIC model = 1,126,718 (Figure 5).

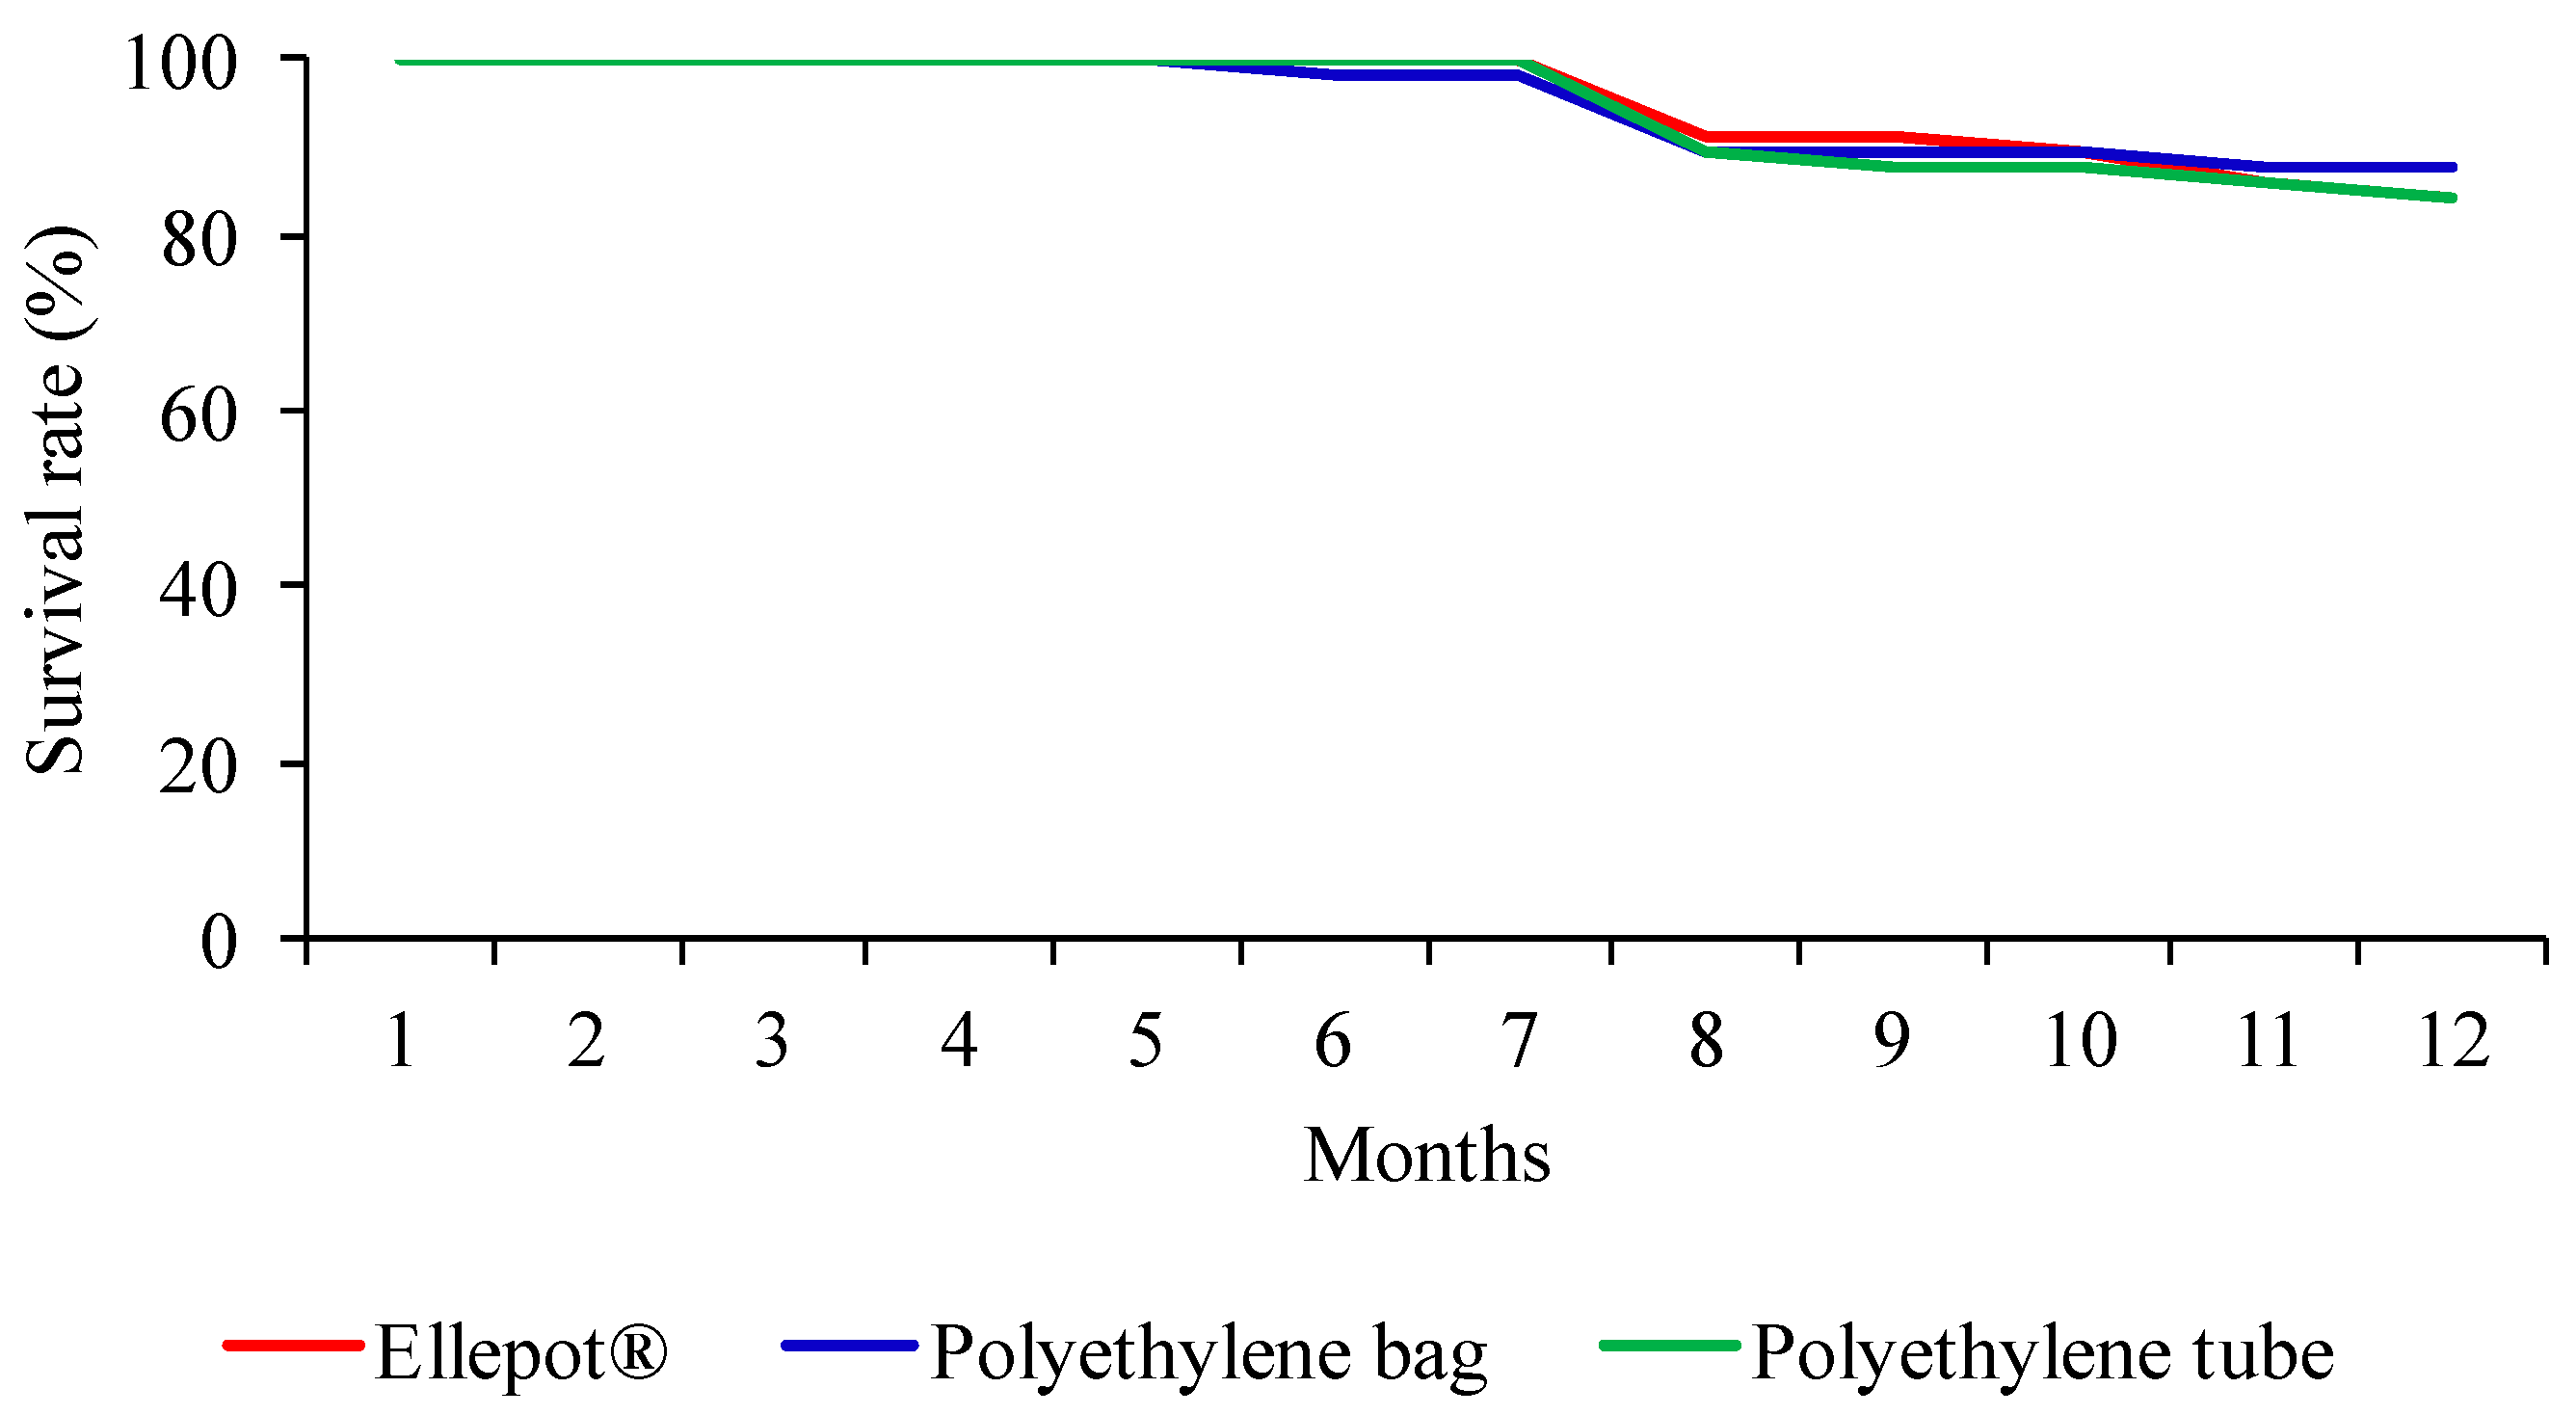
3.4. Seedling Survival Rate

The seedling survival rate up to the fifth month after planting was 100% in the three container types: ≥90% up to the seventh month with no significant difference between the treatments (χ2 = 2.0120, p = 0.3657) and higher than 80% after one year, with no significant difference between them (χ2 = 0.3759, p = 0.8286) (Figure 6 and Supplementary Materials—Table S7). Presumably, these seedlings that did not survive died because of predation (loss of photosynthetic area) and frost exposure in the winter season (necrosis and later leaf drop).

4. Discussion

4.1. Stochastic Analysis of the Total Cost

For the total cost of investment projects, the difference of USD 1115.00 ha−1 between the project with tree seedlings produced in Ellepot® and polyethylene bags can be explained, mainly by the difference of USD 0.58 in the tree seedling unit purchase prices. The purchasing tree seedlings cost produced in polyethylene bags may be related to the time spent in the tree nursery, technological level of the tree nursery, and greater container volume because they increase expenditures on forest inputs, especially with substrate, additionally to reduce the number of plants per square meter in the tree nursery [12,41].
The acquisition of tree seedlings produced in Ellepot®, polyethylene tubes, and polyethylene bags represented 29.49%, 33.83%, and 50.12% of the total cost, respectively. The values of projects with tree seedlings produced in Ellepot® and polyethylene tubes were lower than those estimated by [42] and [43], in which the acquisition of tropical tree seedlings represented, respectively, 45.29% and 41.00% of the total cost of active restoration projects in the Atlantic Forest biome.
In the three investment projects, the costs with direct labor stood out in the second position of correlation coefficients. Frequently, direct labor cost is reported as the most expensive component of restoration projects [44]. For plantations in large quantities, there is a significant investment in labor, logistical difficulties, especially in remote areas, and cascade of extra costs connected to the nursery [45].

4.2. Stochastic Analysis of Production Costs

The higher productivity of planting of tree seedlings produced in Ellepot® generated the lowest cost. The opposite was observed in the planting with tree seedlings produced in polyethylene bags. According to [46], the great merit of biodegradable containers is that they do not have to be removed when seedlings are transplanted. Further, biodegradable containers promote better drainage and aeration, which helps root growth, reducing the risk of transplant shock. When outplanted, there is little disruption to the growth vigor of the seedlings because the roots grow through the sidewall of the container into the soil.

4.3. Opportunity Cost of Forest Restoration Investment Projects

The opportunity cost rate estimated based on parameters that consider market risks, equity participation, and third parties, can be considered a differential in the analysis of forest restoration investment projects, which makes the decisions made by managers and the restoration procedures more accurate. [47] corroborates that part of monitoring takes place in accordance with financing investment project sources. The 6.75% opportunity cost rate adopted is among the values proposed by [48] (5.00 and 7.00%), within which world forest restoration of up to 250 million hectares would be promoted by 2030.

4.4. Stochastic Equivalent Uniform Annual Cost

The lowest EUAC value occurred in the project with tree seedlings produced in Ellepot®. Based on the analysis of mutually exclusive projects, according to [49], we can recommend the investment project when the EUAC is lower when compared to other investment projects. The parameters of the Beta probability distribution adjusted to uncertain EUAC variables can be used as premises in the preparation and acceptance of forest restoration investment projects. In addition, according to [50], they can also improve the prediction of results and, therefore, establish executable goals.
Furthermore, the seedling survival rate showed no significant difference between the container types and was higher than 80% after one year. Successful forest restoration involves many silvicultural practices. One important aspect of a successful forest restoration program is that planting quality seedlings [51] produced with prudent management can significantly reduce the costs of containerized tree seedling production [52].

5. Conclusions

We conclude that the forest restoration investment project with tree seedlings produced in polyethylene bags showed the highest total cost, production cost, and equivalent uniform annual cost, making it economically unfeasible in relation to other projects. The investment project with tree seedlings produced in polyethylene tubes showed economic values in an intermediate position. Finally, the forest restoration investment project with tree seedlings produced in Ellepot® showed a survival rate >80% after one year and was economically viable, since it provided the lowest total cost and production cost. Furthermore, based on Equivalent Uniform Annual Cost (EUAC), this investment project was the best economic alternative from the cash flows and opportunity cost rate.

Supplementary Materials

The following are available online at https://www.mdpi.com/article/10.3390/f12101381/s1, Table S1: Capital expenditure (CAPEX), forest inputs, and direct labor in the investment project with tree seedlings produced in polyethylene bags; Table S2: Capital expenditure (CAPEX), forest inputs, and direct labor in the investment project with tree seedlings produced in polyethylene tubes; Table S3: Capital expenditure (CAPEX), forest inputs, and direct labor in the investment project with tree seedlings produced in Ellepot®; Table S4: Productivity of operations performed in forest restoration with seedlings produced in polyethylene bags; Table S5: Productivity of operations performed in forest restoration with seedlings produced in polyethylene tubes; Table S6: Productivity of operations performed in forest restoration with seedlings produced in Ellepot®; Table S7: Post-planting survival rate of seedlings over 12 months under different container types: polyethylene bag, polyethylene tube, and Ellepot®. Chi-squared (χ2) and p values are listed for each analysis of treatment by month.

Author Contributions

Methodology, D.S.; J.F.S.G., R.B.G.d.S., R.A.M. and M.R.d.S.; investigation, J.F.S.G.; project administration, D.S. and M.R.d.S.; funding acquisition, D.S. and J.F.S.G.; supervision, D.S.; data curation, D.S.; J.F.S.G., R.B.G.d.S. and R.A.M.; formal analysis, D.S., J.F.S.G. and R.B.G.d.S.; software, D.S.; J.F.S.G. and R.B.G.d.S.; writing—original draft, J.F.S.G. and R.B.G.d.S.; writing—review and editing, D.S.; R.B.G.d.S., R.A.M. and M.R.d.S. All authors have read and agreed to the published version of the manuscript.

Funding

This research received financial support from The Brazilian Development Bank (BNDES)-funding number 17207111 and by Coordination for the Improvement of Higher Education Personnel (CAPES)-funding code 001. The APC was funded by São Paulo State University (UNESP).

Institutional Review Board Statement

Not applicable.

Informed Consent Statement

Not applicable.

Data Availability Statement

All the data are already provided in the Main Manuscript and Supplementary Materials. Contact the corresponding author if further explanation is required.

Conflicts of Interest

The authors declare no conflict of interest.

References

  1. Prevedello, J.A.; Winck, G.R.; Weber, M.M.; Nichols, E.; Sinervo, B. Impacts of forestation and deforestation on local temperature across the globe. PLoS ONE 2019, 14, e0213368. [Google Scholar] [CrossRef] [PubMed] [Green Version]
  2. Vargas Zeppetello, L.R.; Parsons, L.A.; Spector, J.T.; Naylor, R.L.; Battisti, D.S.; Masuda, Y.J.; Wolff, N.H. Large scale tropical deforestation drives extreme warming. Environ. Res. Lett. 2020, 15, 084012. [Google Scholar] [CrossRef]
  3. Luwesi, C.N.; Obando, J.A.; Shisanya, C.A. The Impact of a Warming Micro-Climate on Muooni Farmers of Kenya. Agriculture 2017, 7, 20. [Google Scholar] [CrossRef] [Green Version]
  4. Tan, B.T.; Fam, P.S.; Firdaus, R.B.R.; Tan, M.L.; Gunaratne, M.S. Impact of Climate Change on Rice Yield in Malaysia: A Panel Data Analysis. Agriculture 2021, 11, 569. [Google Scholar] [CrossRef]
  5. Ribeiro, M.C.; Metzger, J.P.; Martensen, A.C.; Ponzoni, F.J.; Hirota, M.M. The Brazilian Atlantic Forest: How much is left, and how is the remaining forest distributed? Implications for conservation. Biol. Conserv. 2009, 142, 1141–1153. [Google Scholar] [CrossRef]
  6. Fiore, N.V.; Ferreira, C.C.; Dzedzej, M.; Massi, K.G. Monitoring of a Seedling Planting Restoration in a Permanent Preservation Area of the Southeast Atlantic Forest Biome, Brazil. Forests 2019, 10, 768. [Google Scholar] [CrossRef] [Green Version]
  7. INDC Intended Nationally Determined Contribution. Available online: https://www4.unfccc.int/sites/submissions/indc/Submission%20Pages/submissions.aspx (accessed on 5 November 2020).
  8. Brancalion, P.H.S.; Meli, P.; Tymus, J.R.C.; Lenti, F.E.B.; Benini, R.M.; Silva, A.P.M.; Isernhagen, I.; Holl, K.D. What makes ecosystem restoration expensive? A systematic cost assessment of projects in Brazil. Biol. Conserv. 2019, 240, 108274. [Google Scholar] [CrossRef]
  9. da Silva, A.M.; Bortoleto, L.A.; Castelli, K.R.; e Silva, R.A.; Mendes, P.B. Prospecting the potential of ecosystem restoration: A proposed framework and a case study. Ecol. Eng. 2017, 108, 505–513. [Google Scholar] [CrossRef] [Green Version]
  10. de Oliveira, R.E.; Engel, V.L. A restauração florestal na Mata Atlântica: Três décadas em revisão. Rev. Ciência Tecnol. Ambiente 2017, 5, 40–48. [Google Scholar] [CrossRef]
  11. Suganuma, M.S.; Durigan, G. Indicators of restoration success in riparian tropical forests using multiple reference ecosystems. Restor. Ecol. 2015, 23, 238–251. [Google Scholar] [CrossRef]
  12. Lone, R.A.; Jabeen, S.; Sarlach, H.S.; Tamta, N.; Kaur, J. Effect of Different Size of Container on Growth and Quality of Seedlings of Gmelina arborea Roxb. Indian For. 2020, 146, 1046–1052. [Google Scholar]
  13. Silva, R.B.; Gabira, M.M.; Prado, D.Z.; Uesugi, G.; Simões, D.; Silva, M.R. Influence of Mean Leaf Angles and Irrigation Volumes on Water Capture, Leaching, and Growth of Tropical Tree Seedlings. Forests 2020, 11, 1198. [Google Scholar] [CrossRef]
  14. Mangueira, J.R.S.A.; Holl, K.D.; Rodrigues, R.R. Enrichment planting to restore degraded tropical forest fragments in Brazil. Ecosyst. People 2019, 15, 3–10. [Google Scholar] [CrossRef]
  15. Meli, P.; Isernhagen, I.; Brancalion, P.H.S.; Isernhagen, E.C.C.; Behling, M.; Rodrigues, R.R. Optimizing seeding density of fast-growing native trees for restoring the Brazilian Atlantic Forest. Restor. Ecol. 2018, 26, 212–219. [Google Scholar] [CrossRef]
  16. Molin, P.G.; Chazdon, R.; de Ferraz, S.F.B.; Brancalion, P.H.S. A landscape approach for cost-effective large-scale forest restoration. J. Appl. Ecol. 2018, 55, 2767–2778. [Google Scholar] [CrossRef]
  17. Brancalion, P.H.S.; Guillemot, J.; César, R.G.; Andrade, H.S.; Mendes, A.; Sorrini, T.B.; Piccolo, M.D.C.; Peluci, M.C.; Moreno, V.D.S.; Colletta, G.; et al. The cost of restoring carbon stocks in Brazil’s Atlantic Forest. Land Degrad. Dev. 2021, 32, 830–841. [Google Scholar] [CrossRef]
  18. Crouzeilles, R.; Beyer, H.L.; Monteiro, L.M.; Feltran-Barbieri, R.; Pessôa, A.C.M.; Barros, F.S.M.; Lindenmayer, D.B.; Lino, E.D.S.M.; Grelle, C.E.V.; Chazdon, R.L.; et al. Achieving cost-effective landscape-scale forest restoration through targeted natural regeneration. Conserv. Lett. 2020, 13, e12709. [Google Scholar] [CrossRef]
  19. Lemos, C.M.G.; Andrade, P.R.; Rodrigues, R.R.; Hissa, L.; Aguiar, A.P.D. Combining regional to local restoration goals in the Brazilian Atlantic forest. Reg. Environ. Chang. 2021, 21, 68. [Google Scholar] [CrossRef]
  20. Pukkala, T. Optimizing continuous cover management of boreal forest when timber prices and tree growth are stochastic. For. Ecosyst. 2015, 2, 6. [Google Scholar] [CrossRef] [Green Version]
  21. Alvares, C.A.; Stape, J.L.; Sentelhas, P.C.; de Gonçalves, J.L.M.; Sparovek, G. Köppen’s climate classification map for Brazil. Meteorol. Z. 2013, 22, 711–728. [Google Scholar] [CrossRef]
  22. Rogozhin, A.; Gallaher, M.; Helfand, G.; McManus, W. Using indirect cost multipliers to estimate the total cost of adding new technology in the automobile industry. Int. J. Prod. Econ. 2010, 124, 360–368. [Google Scholar] [CrossRef]
  23. Sahoo, K.; Bilek, E.; Bergman, R.; Kizha, A.R.; Mani, S. Economic analysis of forest residues supply chain options to produce enhanced-quality feedstocks. Biofuels Bioprod. Biorefining 2019, 13, 514–534. [Google Scholar] [CrossRef]
  24. Cuthbert, J.R. Partitioning transaction vectors into pure investments. Eng. Econ. 2018, 63, 143–152. [Google Scholar] [CrossRef]
  25. Detemple, J.; Kitapbayev, Y. The Value of Green Energy: Optimal Investment in Mutually Exclusive Projects and Operating Leverage. Rev. Financ. Stud. 2020, 33, 3307–3347. [Google Scholar] [CrossRef]
  26. Rodas, J.M.C.; Castanho, R.A.; Fernández, J.C.; Gómez, J.M.N. Sustainable valuation of land for development. Adding value with urban planning progress. A Spanish case study. Land Use Policy 2020, 92, 104456. [Google Scholar] [CrossRef]
  27. Perold, A.F. The Capital Asset Pricing Model. J. Econ. Perspect. 2004, 18, 3–24. [Google Scholar] [CrossRef]
  28. Dachraoui, H.; Smida, M.; Sebri, M. Role of capital flight as a driver of sovereign bond spreads in Latin American countries. Int. Econ. 2020, 162, 15–33. [Google Scholar] [CrossRef]
  29. Department of the Treasury T-Bonds. Available online: https://www.treasury.gov/resource-center/data-chart-center/interest-rates/Pages/TextView.aspx?data=yieldAll (accessed on 20 July 2020).
  30. Bolsa do Brasil. Cotações Históricas. Available online: http://www.b3.com.br/pt_br/market-data-e-indices/servicos-de-dados/market-data/historico/mercado-a-vista/cotacoes-historicas (accessed on 19 July 2020).
  31. S&P Down Jones S&P Global Timber & Forestry Index. Available online: https://www.spglobal.com/spdji/en/indices/equity/sp-global-timber-and-forestry-index/#overview (accessed on 20 July 2020).
  32. J.P Morgan Emerging Markets Bond Index + Risco Brasil (EMBI + RB). Available online: https://www.jpmorgan.com.br/pt/disclosures (accessed on 20 January 2021).
  33. Damodaran, A. Country Default Spreads and Risk Premiums. Available online: http://pages.stern.nyu.edu/~adamodar/New_Home_Page/datafile/ctryprem.html (accessed on 28 January 2021).
  34. Moody’s Rating Country Default Spreads. Available online: https://www.moodys.com/credit-ratings/Brazil-Government-of-credit-rating-114650 (accessed on 20 January 2021).
  35. Schwarz, G. Estimating the Dimension of a Model. Ann. Stat. 1978, 6, 461–464. [Google Scholar] [CrossRef]
  36. Ronquist, F.; Teslenko, M.; van der Mark, P.; Ayres, D.L.; Darling, A.; Höhna, S.; Larget, B.; Liu, L.; Suchard, M.A.; Huelsenbeck, J.P. MrBayes 3.2: Efficient Bayesian phylogenetic inference and model choice across a large model space. Syst. Biol. 2012, 61, 539–542. [Google Scholar] [CrossRef] [Green Version]
  37. Palisade Corporation @Risk Versão 8.0 Ithaca. Available online: https://www.palisade-br.com (accessed on 15 May 2020).
  38. Matsumoto, M.; Nishimura, T. Mersenne twister: A 623-dimensionally equidistributed uniform pseudo-random number generator. ACM Trans. Model. Comput. Simul. 1998, 8, 3–30. [Google Scholar] [CrossRef] [Green Version]
  39. Croux, C.; Dehon, C. Influence functions of the Spearman and Kendall correlation measures. Stat. Methods Appl. 2010, 19, 497–515. [Google Scholar] [CrossRef] [Green Version]
  40. Dellinger, J.B. Correlation, Spearman. In The Sage Encyclopedia of Communication Research Methods; Allen, M., Ed.; Sage Publications: Thousand Oaks, CA, USA, 2017; pp. 273–275. [Google Scholar]
  41. Sun, Q.; Dumroese, R.K.; Liu, Y. Container volume and subirrigation schedule influence Quercus variabilis seedling growth and nutrient status in the nursery and field. Scand. J. For. Res. 2018, 33, 560–567. [Google Scholar] [CrossRef]
  42. Hüller, A.; Coelho, G.C.; Meneghello, G.E.; Peske, S.T. Evaluation of direct seeding and seedling planting of two neotropical tree species with the use of natural inputs. Rev. Árvore 2017, 41. [Google Scholar] [CrossRef] [Green Version]
  43. Raupp, P.P.; Ferreira, M.C.; Alves, M.; Campos-Filho, E.M.; Sartorelli, P.A.R.; Consolaro, H.N.; Vieira, D.L.M. Direct seeding reduces the costs of tree planting for forest and savanna restoration. Ecol. Eng. 2020, 148, 105788. [Google Scholar] [CrossRef]
  44. Li, Y.M.; Gornish, E.S. General attributes and practice of ecological restoration in Arizona and California, U.S.A., revealed by restoration stakeholder surveys. Restor. Ecol. 2020, 28, 1296–1307. [Google Scholar] [CrossRef]
  45. Pérez, D.R.; González, F.; Ceballos, C.; Oneto, M.E.; Aronson, J. Direct seeding and outplantings in drylands of Argentinean Patagonia: Estimated costs, and prospects for large-scale restoration and rehabilitation. Restor. Ecol. 2019, 27, 1105–1116. [Google Scholar] [CrossRef]
  46. Muriuki, J.K.; Kuria, A.W.; Muthuri, C.W.; Mukuralinda, A.; Simons, A.J.; Jamnadass, R.H. Testing Biodegradable Seedling Containers as an Alternative for Polythene Tubes in Tropical Small-Scale Tree Nurseries. Small-Scale For. 2014, 13, 127–142. [Google Scholar] [CrossRef]
  47. Stanturf, J.A. Forest landscape restoration: Building on the past for future success. Restor. Ecol. 2021, 29, e13349. [Google Scholar] [CrossRef]
  48. Verdone, M.; Seidl, A. Time, space, place, and the Bonn Challenge global forest restoration target. Restor. Ecol. 2017, 25, 903–911. [Google Scholar] [CrossRef]
  49. Taleghani, S.T.; Sorin, M.; Gaboury, S. Thermo-economic analysis of heat-driven ejector system for cooling smelting process exhaust gas. Energy 2021, 220, 119661. [Google Scholar] [CrossRef]
  50. Miyajima, R.H.; Tonin, R.P.; Fenner, P.T.; Simões, D. Análise quantitativa do risco técnico-econômico de um trator florestal skidder. BIOFIX Sci. J. 2017, 2, 12–15. [Google Scholar] [CrossRef] [Green Version]
  51. Grossnickle, S.C. Why seedlings survive: Influence of plant attributes. New For. 2012, 43, 711–738. [Google Scholar] [CrossRef]
  52. Stowe, D.C.; Lamhamedi, M.S.; Carles, S.; Fecteau, B.; Margolis, H.A.; Renaud, M.; Bernier, P.Y. Managing irrigation to reduce nutrient leaching in containerized white spruce seedling production. New For. 2010, 40, 185–204. [Google Scholar] [CrossRef]
Figure 1. Satellite image of the restoration study area, inside Itatinga municipality, São Paulo State, Brazil.
Forests 12 01381 g001
Figure 2. Types of containers in which the tropical tree seedling were produced in this study. (A) Polyethylene bag with a volume of 1178 cm3, (B) polyethylene tube with a volume of 290 cm3, and (C) Ellepot® degradable container with a volume of 160 cm3.
Forests 12 01381 g002
Figure 3. Spearman’s correlation coefficient of the total cost components of forest restoration investment projects.
Forests 12 01381 g003
Figure 4. Modal value of production costs of forest restoration investment projects.
Forests 12 01381 g004
Figure 5. Cumulative frequencies of Equivalent Uniform Annual Costs (EUAC) for forest restoration investment projects.
Forests 12 01381 g005
Figure 6. Survival rate of seedlings over 12 months after planting under different container types: polyethylene bag, polyethylene tube, and Ellepot®.
Forests 12 01381 g006
Table 1. Average height of containerized tropical tree seedlings used in this study.
SpeciesAverage Height
(±Standard Deviation; cm)
Polyethylene BagPolyethylene TubeEllepot®
Citharexylum myrianthum Cham.37.4 ± 3.327.7 ± 2.926.3 ± 2.1
Copaifera langsdorffii Desf.69.2 ± 5.819.3 ± 1.518.0 ± 3.0
Enterolobium contortisiliquum (Vell.) Morong55.6 ± 5.617.3 ± 1.218.5 ± 3.8
Eugenia brasiliensis Lam.34.5 ± 2.39.6 ± 0.622.0 ± 2.8
Genipa americana L.22.0 ± 3.222.4 ± 1.616.7 ± 2.4
Guazuma ulmifolia Lam.41.3 ± 2.628.4 ± 1.033.7 ± 4.2
Heliocarpus popayanensis Kunth44.5 ± 5.312.7 ± 3.814.0 ± 2.7
Publisher’s Note: MDPI stays neutral with regard to jurisdictional claims in published maps and institutional affiliations.

