Article

Genome-Wide Identification and Characterization of the FAR1/FHY3 Family in Populus trichocarpa Torr. & Gray and Expression Analysis in Light Response

1
State Key Laboratory of Tree Genetics and Breeding, Key Laboratory of Tree Breeding and Cultivation of National Forestry and Grassland Administration, Research Institute of Forestry, Chinese Academy of Forestry, Beijing 100091, China
2
East Campus, College of Forestry, Inner Mongolia Agricultural University, Hohhot 010019, China
*
Authors to whom correspondence should be addressed.
Forests 2021, 12(10), 1385; https://doi.org/10.3390/f12101385
Submission received: 22 August 2021 / Revised: 30 September 2021 / Accepted: 8 October 2021 / Published: 11 October 2021
(This article belongs to the Section Genetics and Molecular Biology)

Abstract

:
Light is an important environmental factor for plant growth, and in higher plants, phytochrome A (phyA) is the predominant far-red photoreceptor, involved in various photoresponses. The FAR1/FHY3 transcription factor family, derived from transposases, is able to regulate plant development in response to multiple photosensitizers phytochrome. In total, 51 PtrFRSs were identified in the poplar genome, and were divided into 4 subfamilies. Among them, 47 PtrFRSs are located on 17 chromosomes. Upstream cis-acting elements of the PtrFRS genes were classified into three categories: growth and metabolism, stress and hormone, and the hormone and stress categories contained most of the cis-acting elements. Analysis of the regulatory networks and expression patterns showed that most PtrFRSs responded to changes in light intensity and were involved in the regulation of phytochromes. In this study, 51 PtrFRSs were identified and comprehensively bioinformatically analyzed, and preliminary functional analysis and prediction of PtrFRSs was carried out.

1. Introduction

Light, as an important abiotic factor for plant growth, plays an irreplaceable role in plant growth and development, both as a source of energy for biological photosynthesis and as a provider of important environmental information to plants [1]. In higher plants, phytochromes are the major photoreceptors for red (R) and far-red (FR) light (600–750 nm). There are five phytochromes (phyA-phyE) in Arabidopsis, and phytochrome A (phyA) is the main photoreceptor in the plant that is required for the photomorphogenesis in an environment with sufficient far-red light [2], making it an indispensable phytochrome for plants [3]. phyA, the only photosensitive phytochrome that can be activated by FR, is translocated to the nucleus after being activated by light [4], which is a key step in phyA signaling [5,6]. In the nucleus, phyA acts directly as a transcriptional regulator in concert with other transcription factors (e.g., a group of bHLH transcription factors called photosensitive pigment-interacting factors (PIFs)) to control the expression of downstream genes [7].
FAR1 (FAR-RED-IMPAIRED RESPONSE 1) and its homologue FHY3 (FAR-RED ELONGATED HYPOCOTYL 3) genes are a class of plant-specific transposase-derived transcription factors [8,9], which are the founding members of the FRS (FAR1-RELATED SEQUENCE) and FRF (FRS-RELATED FACTOR) families. They are conserved among land plants, and act together to directly activate the transcription of FAR-RED ELONGATED HYPOCOTYL1 (FHY1) and FHY1-LIKE (FHL) to regulate phyA signaling, the products of which are essential for light-induced nuclear accumulation of phyA and subsequent light response [8].
The involvement of FAR1/FHY3 in regulating plant responses to light is one of their well-known roles. Previous studies have demonstrated that FAR1/FHY3 are important components of the phyA signaling pathway, and recent findings have revealed that they are also regulated by phyB, phyD, and phyE [10]. FAR1/FHY3 regulate chlorophyll biosynthesis and seedling growth via control of HEMB1 expression in Arabidopsis thaliana (L.) Heynh. [11]. They can also bind directly to CIRCADIAN CLOCK ASSOCIATED1 (CCA1), a key component of the core oscillator of the circadian clock, to regulate the circadian clock of plants, which demonstrates that the photosensory-signaling pathway integrates with circadian oscillators to orchestrate clock gene expression [12].
FAR1/FHY3 are also involved in other regulatory processes in the plant, such as floral bud differentiation, carbon starvation, and branching regulation. In the regulation of floral bud differentiation, FAR1/FHY3 directly interact with proteins of three flowering-promoting SQUAMOSA-PROMOTER BINDING PROTEIN-LIKE (SPL) transcription factors, SPL3, SPL4, and SPL5, and inhibit their binding to the promoters of several key flowering regulatory genes, including FRUITFUL (FUL), LEAFY (LFY), APETALA1 (AP1), and MIR172C, thus downregulating their transcript levels and delaying flowering [13,14]. FAR1 is even involved in the process of floral bud sex differentiation [15]. FAR1/FHY3 are also involved in the negative feedback mediation of carbon starvation and are essential for seedlings in dark environments when disruption of both FAR1/FHY3 leads to disruption of the chloroplast envelope and cystoid membrane [16]. In addition, disruption of FAR1/FHY3 reduces starch accumulation and alters the starch granule structure in plants [17]. FHY3 and FAR1 and SMXL6/SMXL7/SMXL8 directly interact with SPL9 and SPL15, suppressing its transcriptional activation of BRC1 [18].
Poplar is an important energy and timber species with a fast growth rate, easy asexual reproduction, relatively small genome, and easy transformation [19,20]. With the successful sequencing of the P. trichocarpa genome, poplar has become an ideal model for the study of woody plants [21,22,23]. Understanding the various developmental processes in poplar will greatly facilitate the study of woody plants [24].
Although FAR1/FHY3 genes have been identified and characterized in several plant species [25,26], there is currently no genome-wide analysis of P. trichocarpa. In the present study, we sought to examine, identify, and characterize FAR1/FHY3 genes in P. trichocarpa by analyzing their phylogenetic relationship, and by structuring the conserved domain architecture. Additionally, we also investigated the expression patterns of PtrFARI/FHY3 family genes in response to changes in light intensity to predict their function. This study provides valuable information for the analysis of the structure and function of the PtrFARI/FHY3 family genes in P. trichocarpa.

2. Methods

2.1. Plant Materials

The P. trichocarpa plants, used in this study, provided by laboratory of Prof. Quanzi Li of State Key Laboratory of Tree Genetics and Breeding, were preserved in the tissue culture room of the Chinese Academy of Forestry. Tissue culture seedlings were cultured in a tissue culture room at the Chinese Academy of Forestry, with the light intensity and temperature set at 2500 lx and 25 °C, respectively.

2.2. Identification, Characteristic, and Location Analysis of PtrFRSs

The Hidden Markov Model profiles for the FAR1 domain (PF03101) were retrieved from the Pfam database (http://pfam.xfam.org/ (accessed on 18 June 2020)) [27] and used to identify the PtrFAR1/FHY3-related sequences (FRSs) of poplar (E-Value < 0.01) with HMMER 3.0 (http://hmmer.janelia.org/ (accessed on 18 June 2020)) [28]. SMART (http://smart.embl.de/ (accessed on 18 June 2020)) [29], Pfam (http://pfam.xfam.org/ (accessed on 18 June 2020)) [27], and NCBI CDD (http://www.ncbi.nlm.nih.gov/cdd/ (accessed on 18 June 2020)) were used to confirm all the candidate PtrFRS genes. Online website ProtParam (https://web.expasy.org/protparam/ (accessed on 18 June 2020)) [30], WoLF PSORT (https://wolfpsort.hgc.jp/ (accessed on 20 August 2021)), and TBtools [31] were used to analyze the characteristic, protein subcellular localization prediction, and location on the chromosomes of PtrFRSs, respectively.

2.3. Sequence Alignment and Phylogenetic Construction Tree of PtrFRSs

Sequences of protein were extracted with Bio-Linux and were used to construct the phylogenetic tree of PtrFRSs by MEGA X (https://www.megasoftware.net/dload_win_gui (accessed on 18 June 2020)) with the Maximum Likelihood Estimate after aligned by ClustalW.

2.4. Structural Analysis of PtrFRSs

The protein sequences of PtrFRS genes were submitted to MEME (http://meme-suite.org/ (accessed on 18 June 2020)) [32] to search for conserved motifs of PtrFRSs, setting the length to 6–50 and the number to 20 and other parameters were the default value. Structural information of PtrFRSs was extracted and TBtools [31] was used to draw the PtrFRS genes structural map.

2.5. Analysis of Cis-Acting Elements in the Promoter Regions of PtrFRSs

The region of 1500 bp upstream of the transcriptional start point of PtrFRSs was extracted from the P. trichocarpa genome, and was used to identify cis-acting elements with the PlantCARE online website (http://bioinformatics.psb.ugent.be/webtools/plantcare/html/ (accessed on 18 June 2020)) [33] and then cis-acting elements were analyzed and classified after that.

2.6. Prediction of the Protein–Protein Interaction Network of PtrFRSs

The protein sequences of PtrFRSs were submitted to the online database STRING (https://string-db.org/ (accessed on 15 May 2021)) [34]. For prediction and mapping of the possible protein regulatory network, the P. trichocarpa genes were selected as the reference. After the BLAST step, the genes with the highest score were used to construct the network, moderately increasing the number of core genes outside the PtrFRS genes in the network map to allow for more accurate regulatory relationships.

2.7. RNA Isolation and Expression Analysis of PtrFRSs Genes of Light Response

Uniformly growing seedlings were selected for 2 shade treatments: full shade was shaded with black cloth totally (0 lx, 25 °C) (full shade, FS) while low light was placed under low light (1000 lx, 25 °C) (low light, LL) and the control was incubated under normal light conditions (2500 lx, 25 °C) (CK). The experiment was conducted in a randomized block design with 2 blocks and 3 replicates in each block (6 biological replicates). Total RNA of leaves of P. trichocarpa was extracted using an RNAprep Pure Plant Kit (TIANGEN, Beijing, China) according to the manufacturer’s protocol, and then total RNA was reverse transcribed into cDNA using a TIANScript Ⅱ RT Kit (TIANGEN, Beijing, China). qPCR, using LightCycler480 II (Roche, Basel, Switzerland), was used to analyze the expression patterns of PtrFRSs in response to different light intensities. We did not sequence RNA from P. trichocarpa.

3. Results

3.1. Identification and Chromosomal Locations of PtrFRSs

In total, 51 PtrFRS genes were identified from P. trichocarpa. All PtrFRS genes were localized on chromosomes except for PtrFRS48 to PtrFRS51. For each chromosome, PtrFRSs was localized on all except chromosomes 18 and 19, of which, chromosomes 7 and 16 had the most PtrFRS genes (six) and chromosomes 1, 10, 11, 12, 13 and 15 had the least number of PtrFRS genes, all with only one (Figure 1).
The PtrFRS genes also varied considerably among themselves, encoding amino acid numbers ranging from 107 to 902, with PtrFRS22 and PtrFRS29 encoding the least and most amino acid residues, respectively. Their relative molecular masses ranged from 12,473.45 to 103,330.62, with PtrFRS22 and PtrFRS7 being the smallest and largest, respectively. Theoretical pI ranged from 4.79 to 10.06, with PtrFRS44 and PtrFR22 being the smallest and largest, respectively. The grand average of hydropathicity (GRAVY) ranged from −0.939 to −0.07, with PtrFRS34 and PtrFR45 being the smallest and largest, respectively. The subcellular localization of PtrFRSs were also predicted, with most PtrFRS proteins localized to the nucleus and no signal peptide predicted for all PtrFRS proteins (Table 1).

3.2. Phylogenetic Classification and Subfamily Division of PtrFRSs

A phylogenetic tree of the PtrFRS proteins was constructed by using the Maximum Likelihood Estimate, after aligning multiple protein sequences. The phylogenetic tree of the PtrFRS proteins of P. trichocarpa was established, and PtrFRSs were divided into four subfamilies (Figure 2), When classified together with the FAR1/FHY3 proteins of other species, the classification results may be more refined and precise [26], so we also constructed a phylogenetic tree of A. thaliana AtFRSs together with PtrFRSs. The results are largely consistent with the phylogenetic evolutionary tree of PtrFRSs (Figure S1). More sequences would make the results more accurate.
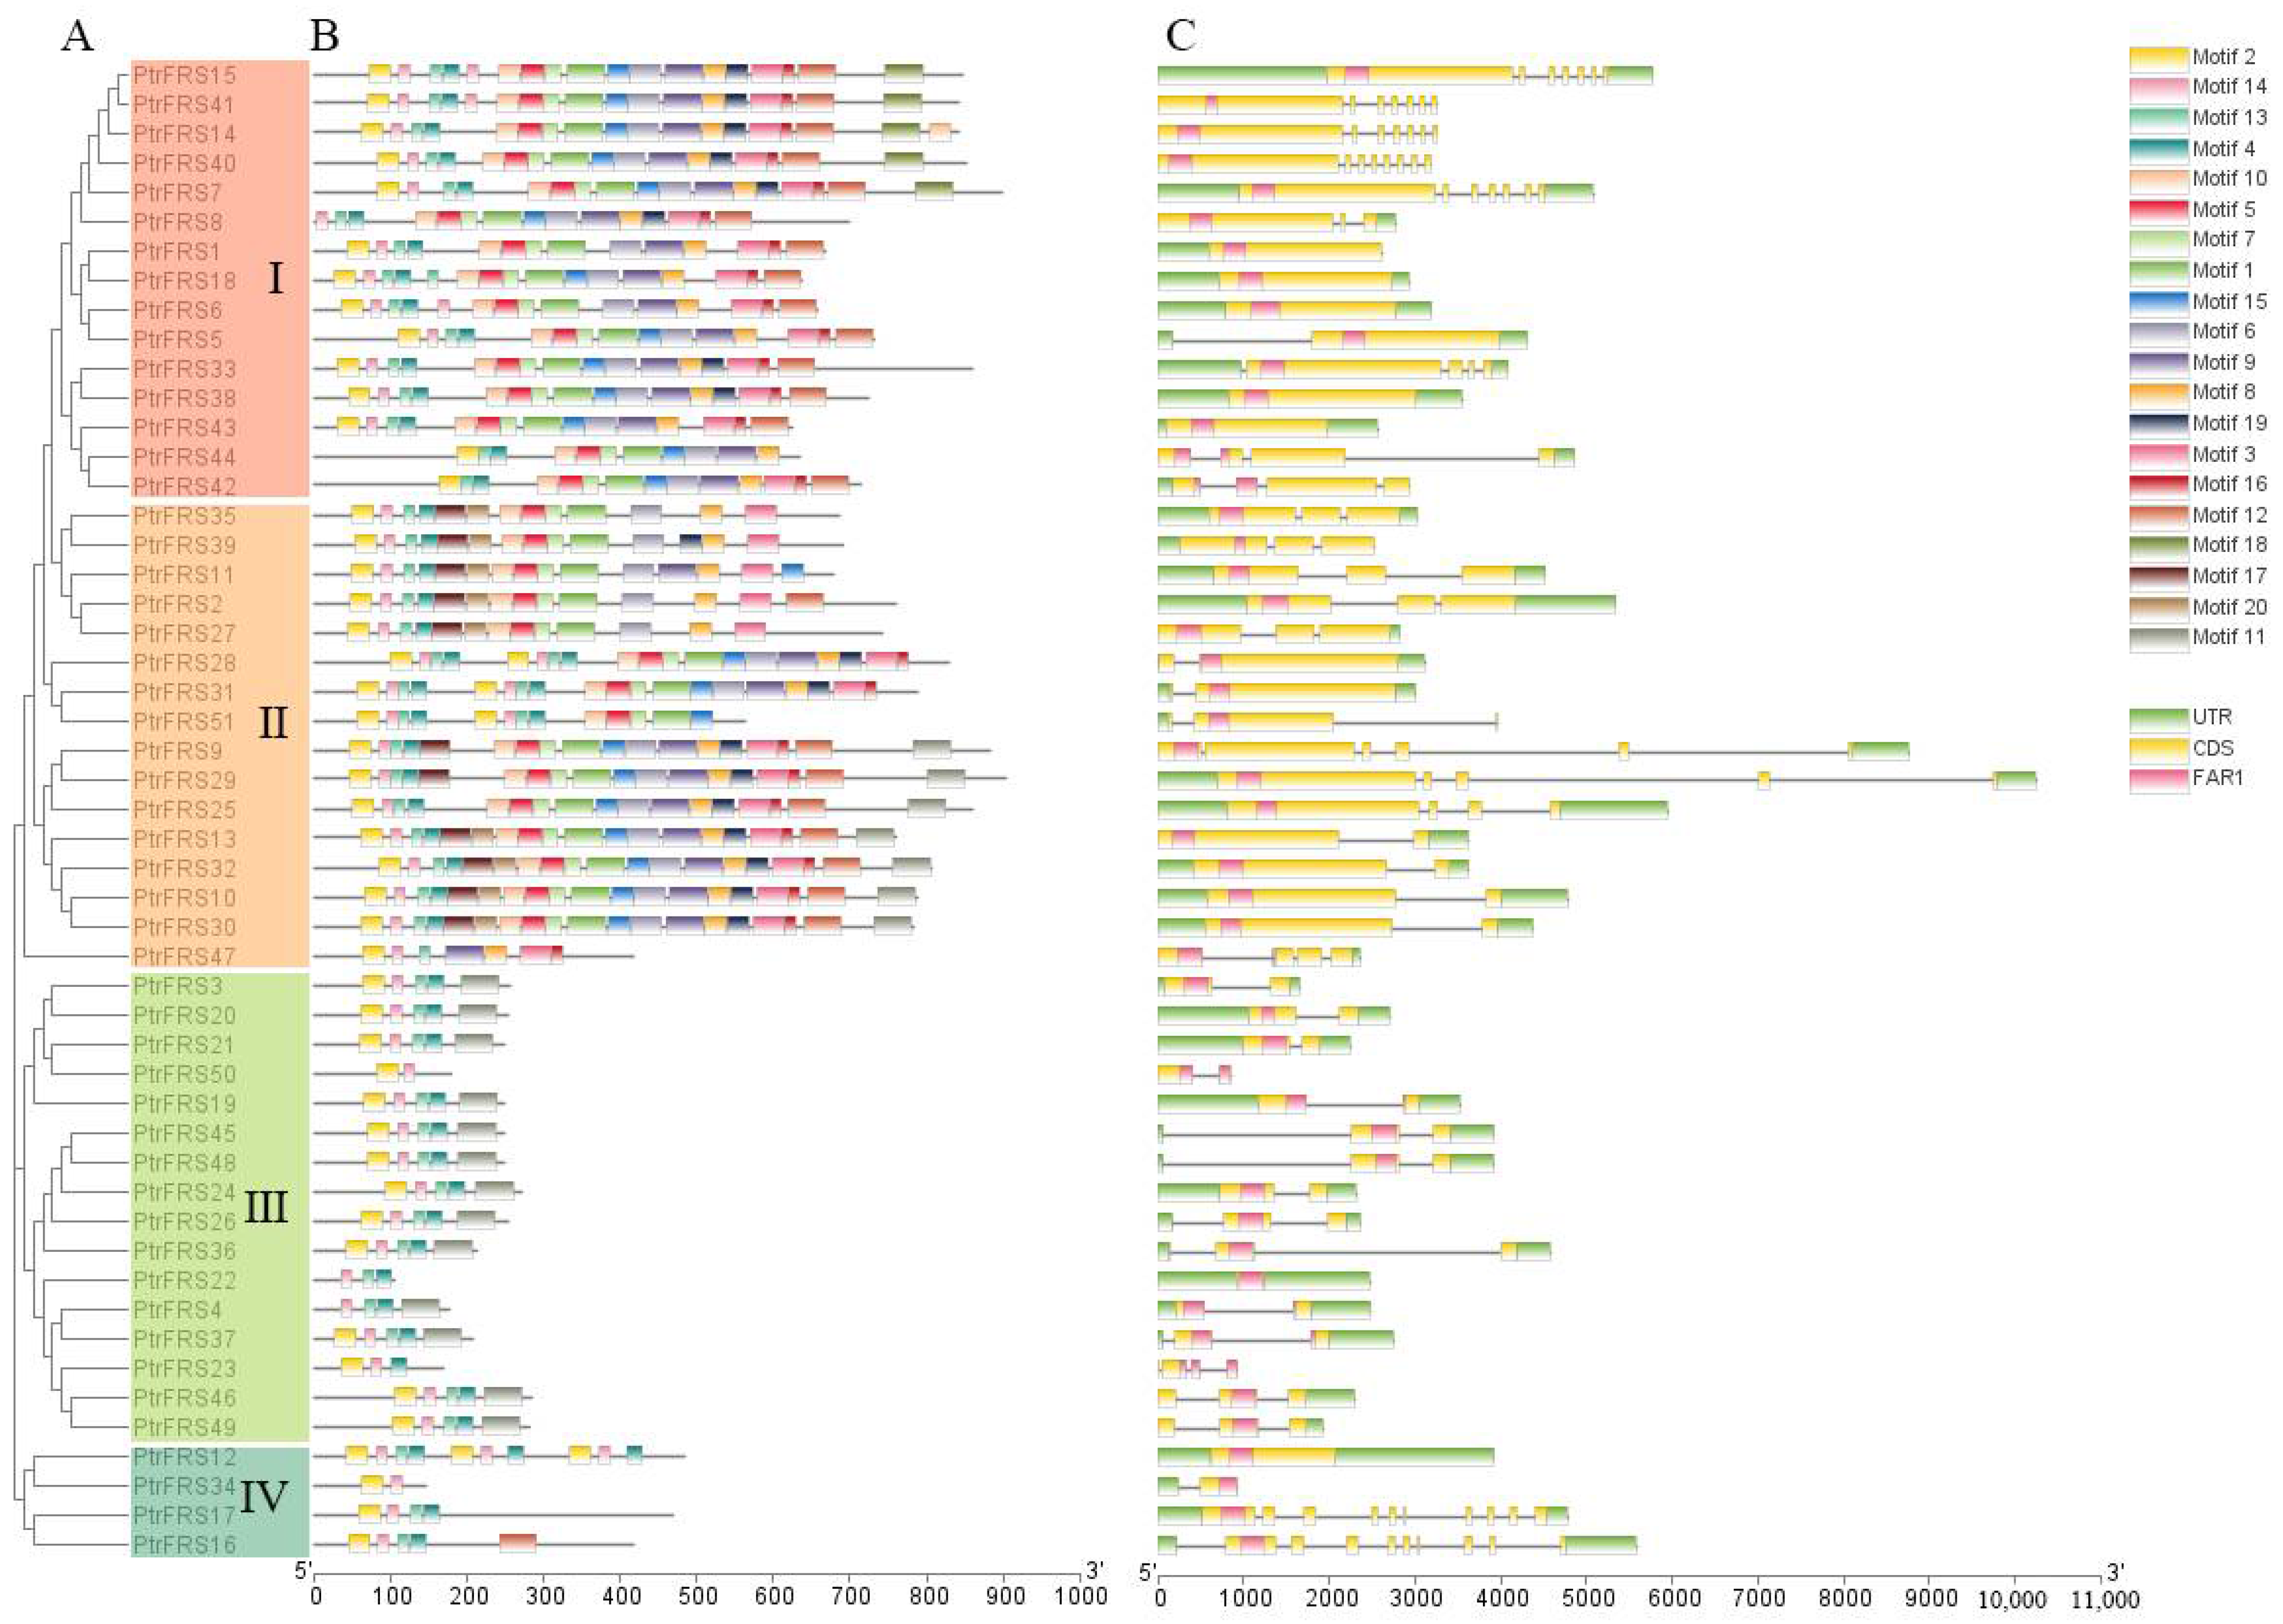
According to conservative motifs, the way in which PtrFRSs were grouped was further validated, with clear distinctions between each subfamily. For the motif signature of each subfamily, subfamilies I and II were significantly more complex in structure than the other two subfamilies, so it was also hypothesized that genes from these two subfamilies perform more complex functions in plants. Motifs 2, 14, 13, and 4 occurred frequently in tandem and in almost every gene (Figure 2), and the tandem sequence they comprise was identified as the FAR1 domain (Figure 2C). Following confirmation at the SMART (http://smart.embl.de/ (accessed on 18 June 2020)), the location of the FAR1 domains was also indicated on the figure (Figure 2C).

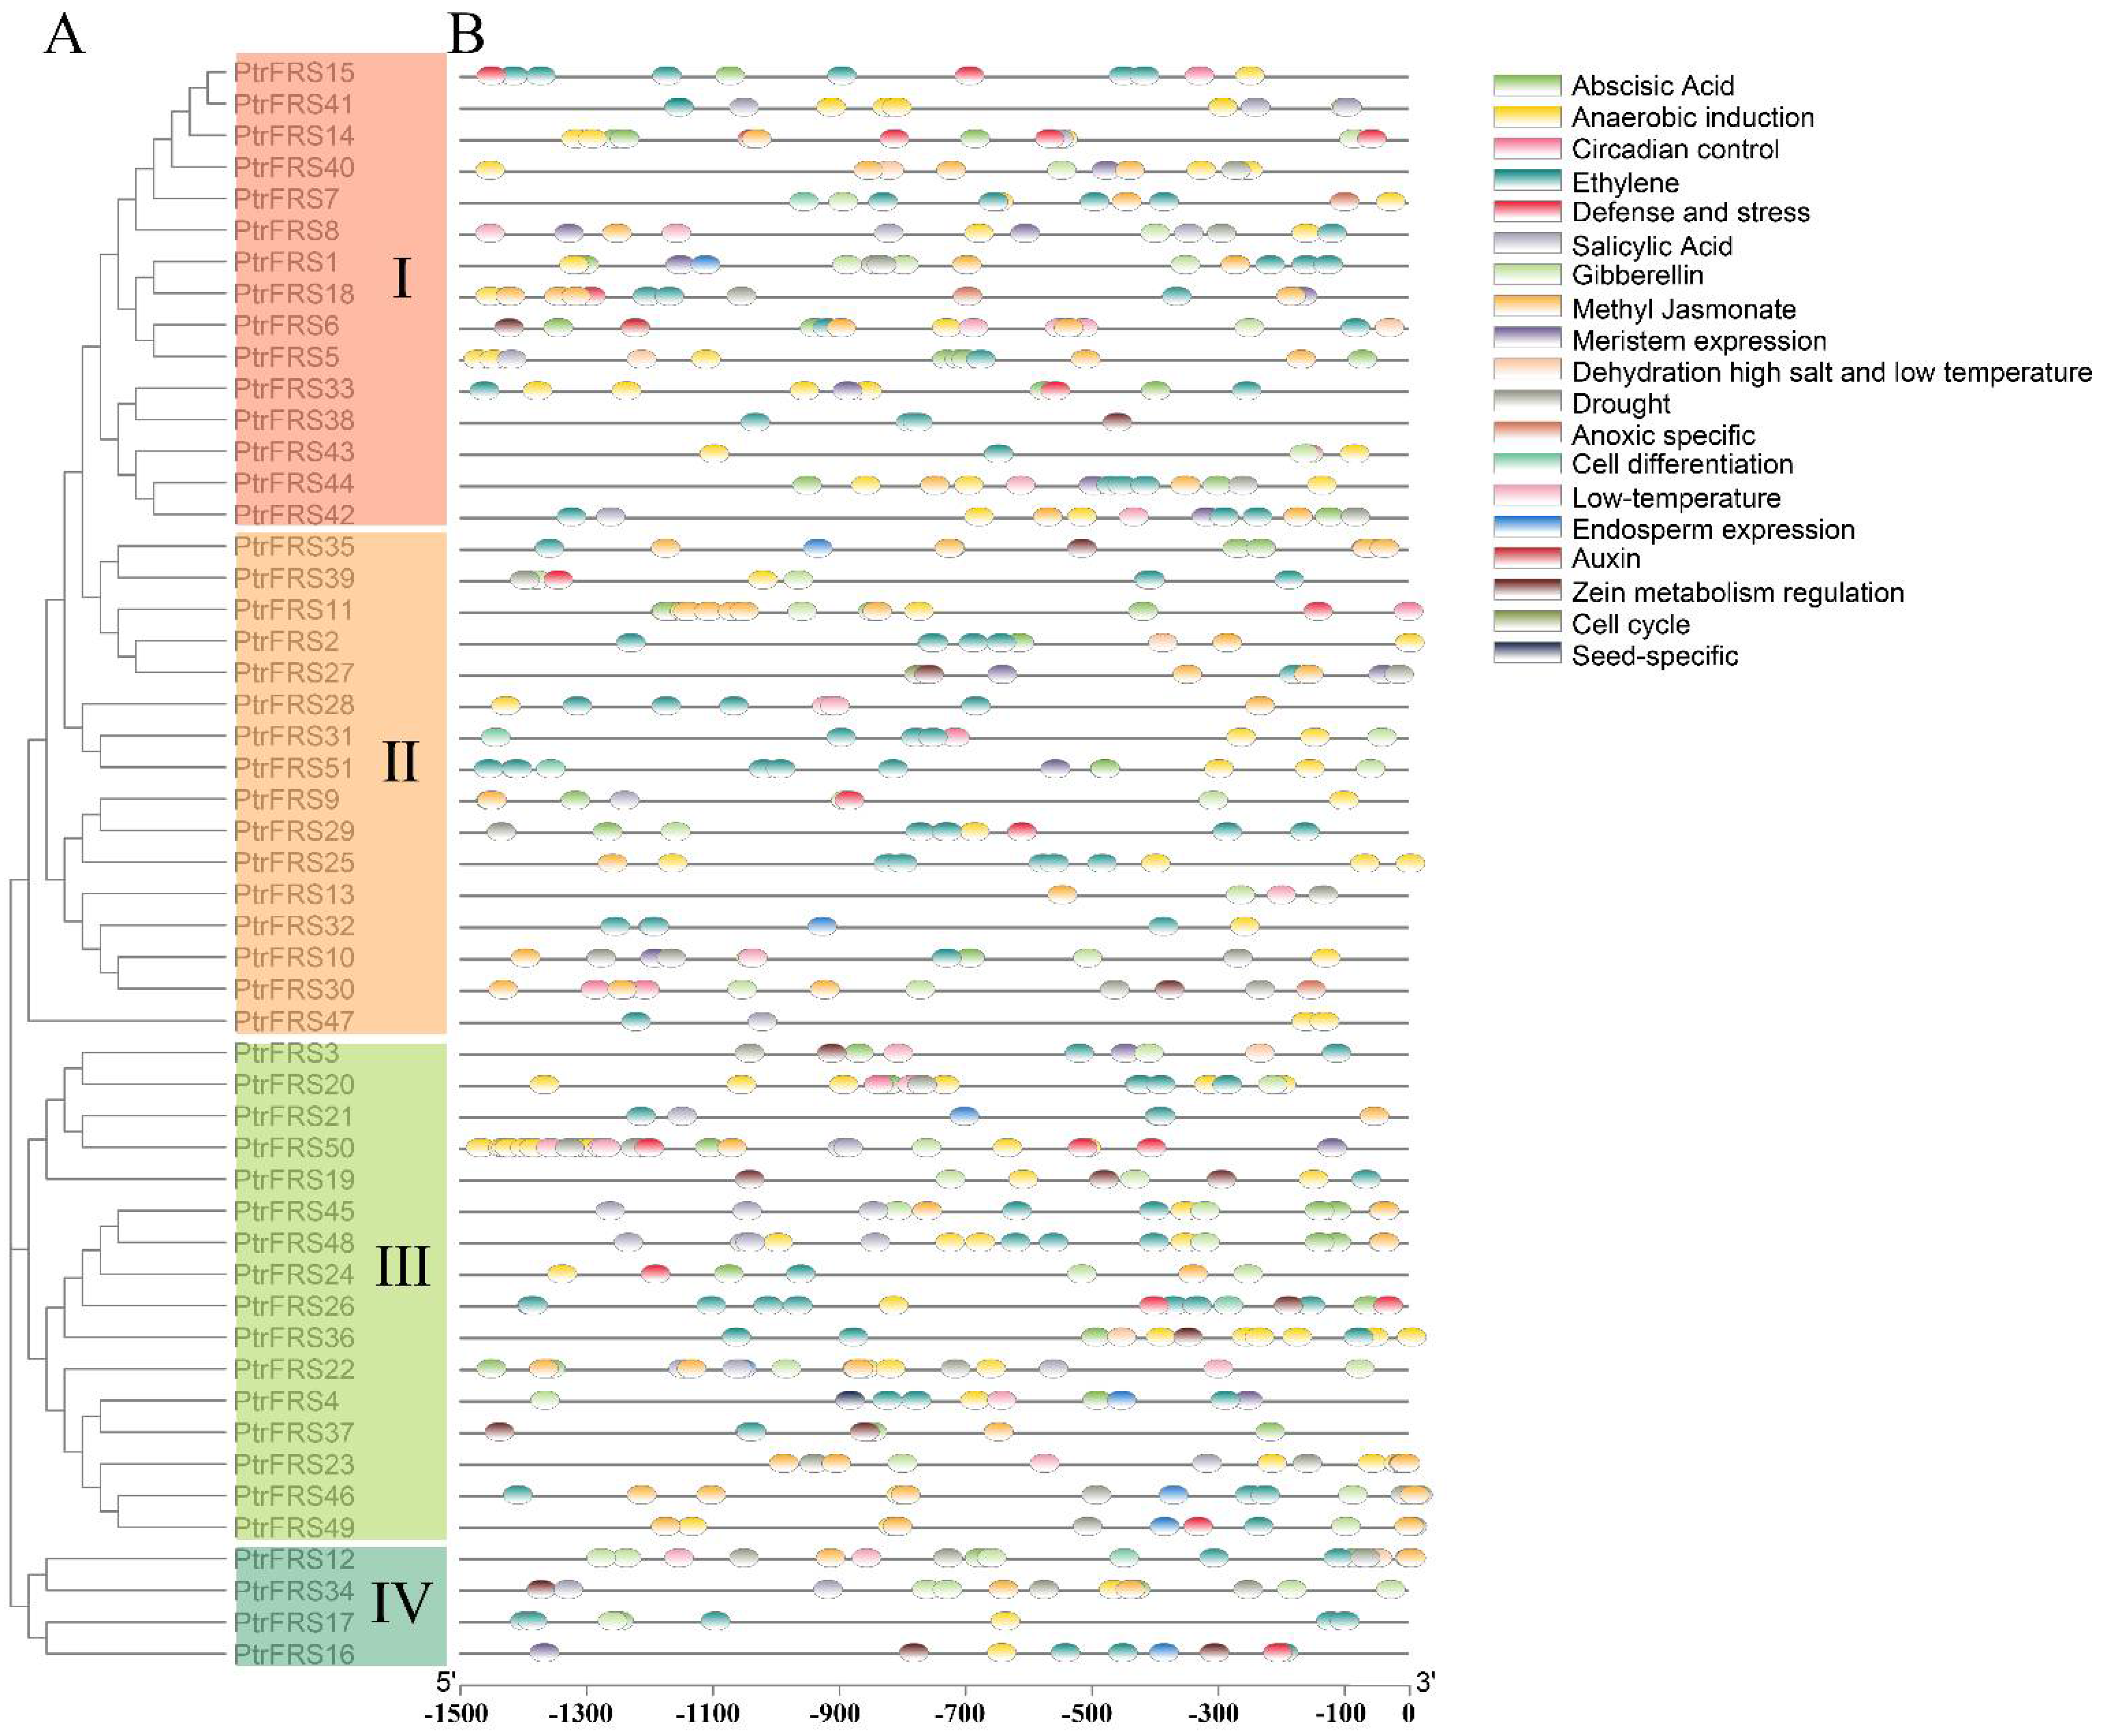
3.3. Cis-Acting Elements of the PtrFRSs Promoters

The cis-acting elements in the 1500 bp region upstream of PtrFRSs were identified (Figure 3), analyzed, and classified into three types of hormone, stress, growth, and metabolism. The hormone type contained the most cis-acting elements, including abscisic acid, auxin, gibberellin, methyl jasmonate, salicylic acid, and ethylene. The number of cis-acting elements contained in the stress type was second only to hormone, including anaerobic induction, defense and stress, drought, low temperature, anoxic specific, dehydration, and high salt and low temperature. The growth and metabolism type contained the least, including cell cycle regulation, circadian control, cell differentiation, seed-specific regulation, endosperm expression, flavonoid biosynthetic, meristem expression, and zein metabolism regulation. Among all the cis-acting elements, there were four types of them more than 80, including abscisic acid (85), methyl jasmonate (113), ethylene (118), and anaerobic induction (98). Three of them, abscisic acid, methyl jasmonate, and ethylene, belonged to the hormone type; one belonged to stress; and none belonged to growth and metabolism. Therefore, we concluded that PtrFRSs play an important role in poplar hormone and stress response (Figure 4) [26]. The information regarding the cis-acting elements of each gene is also counted (Figure S2).

3.4. Prediction of the Protein–Protein Interaction Network

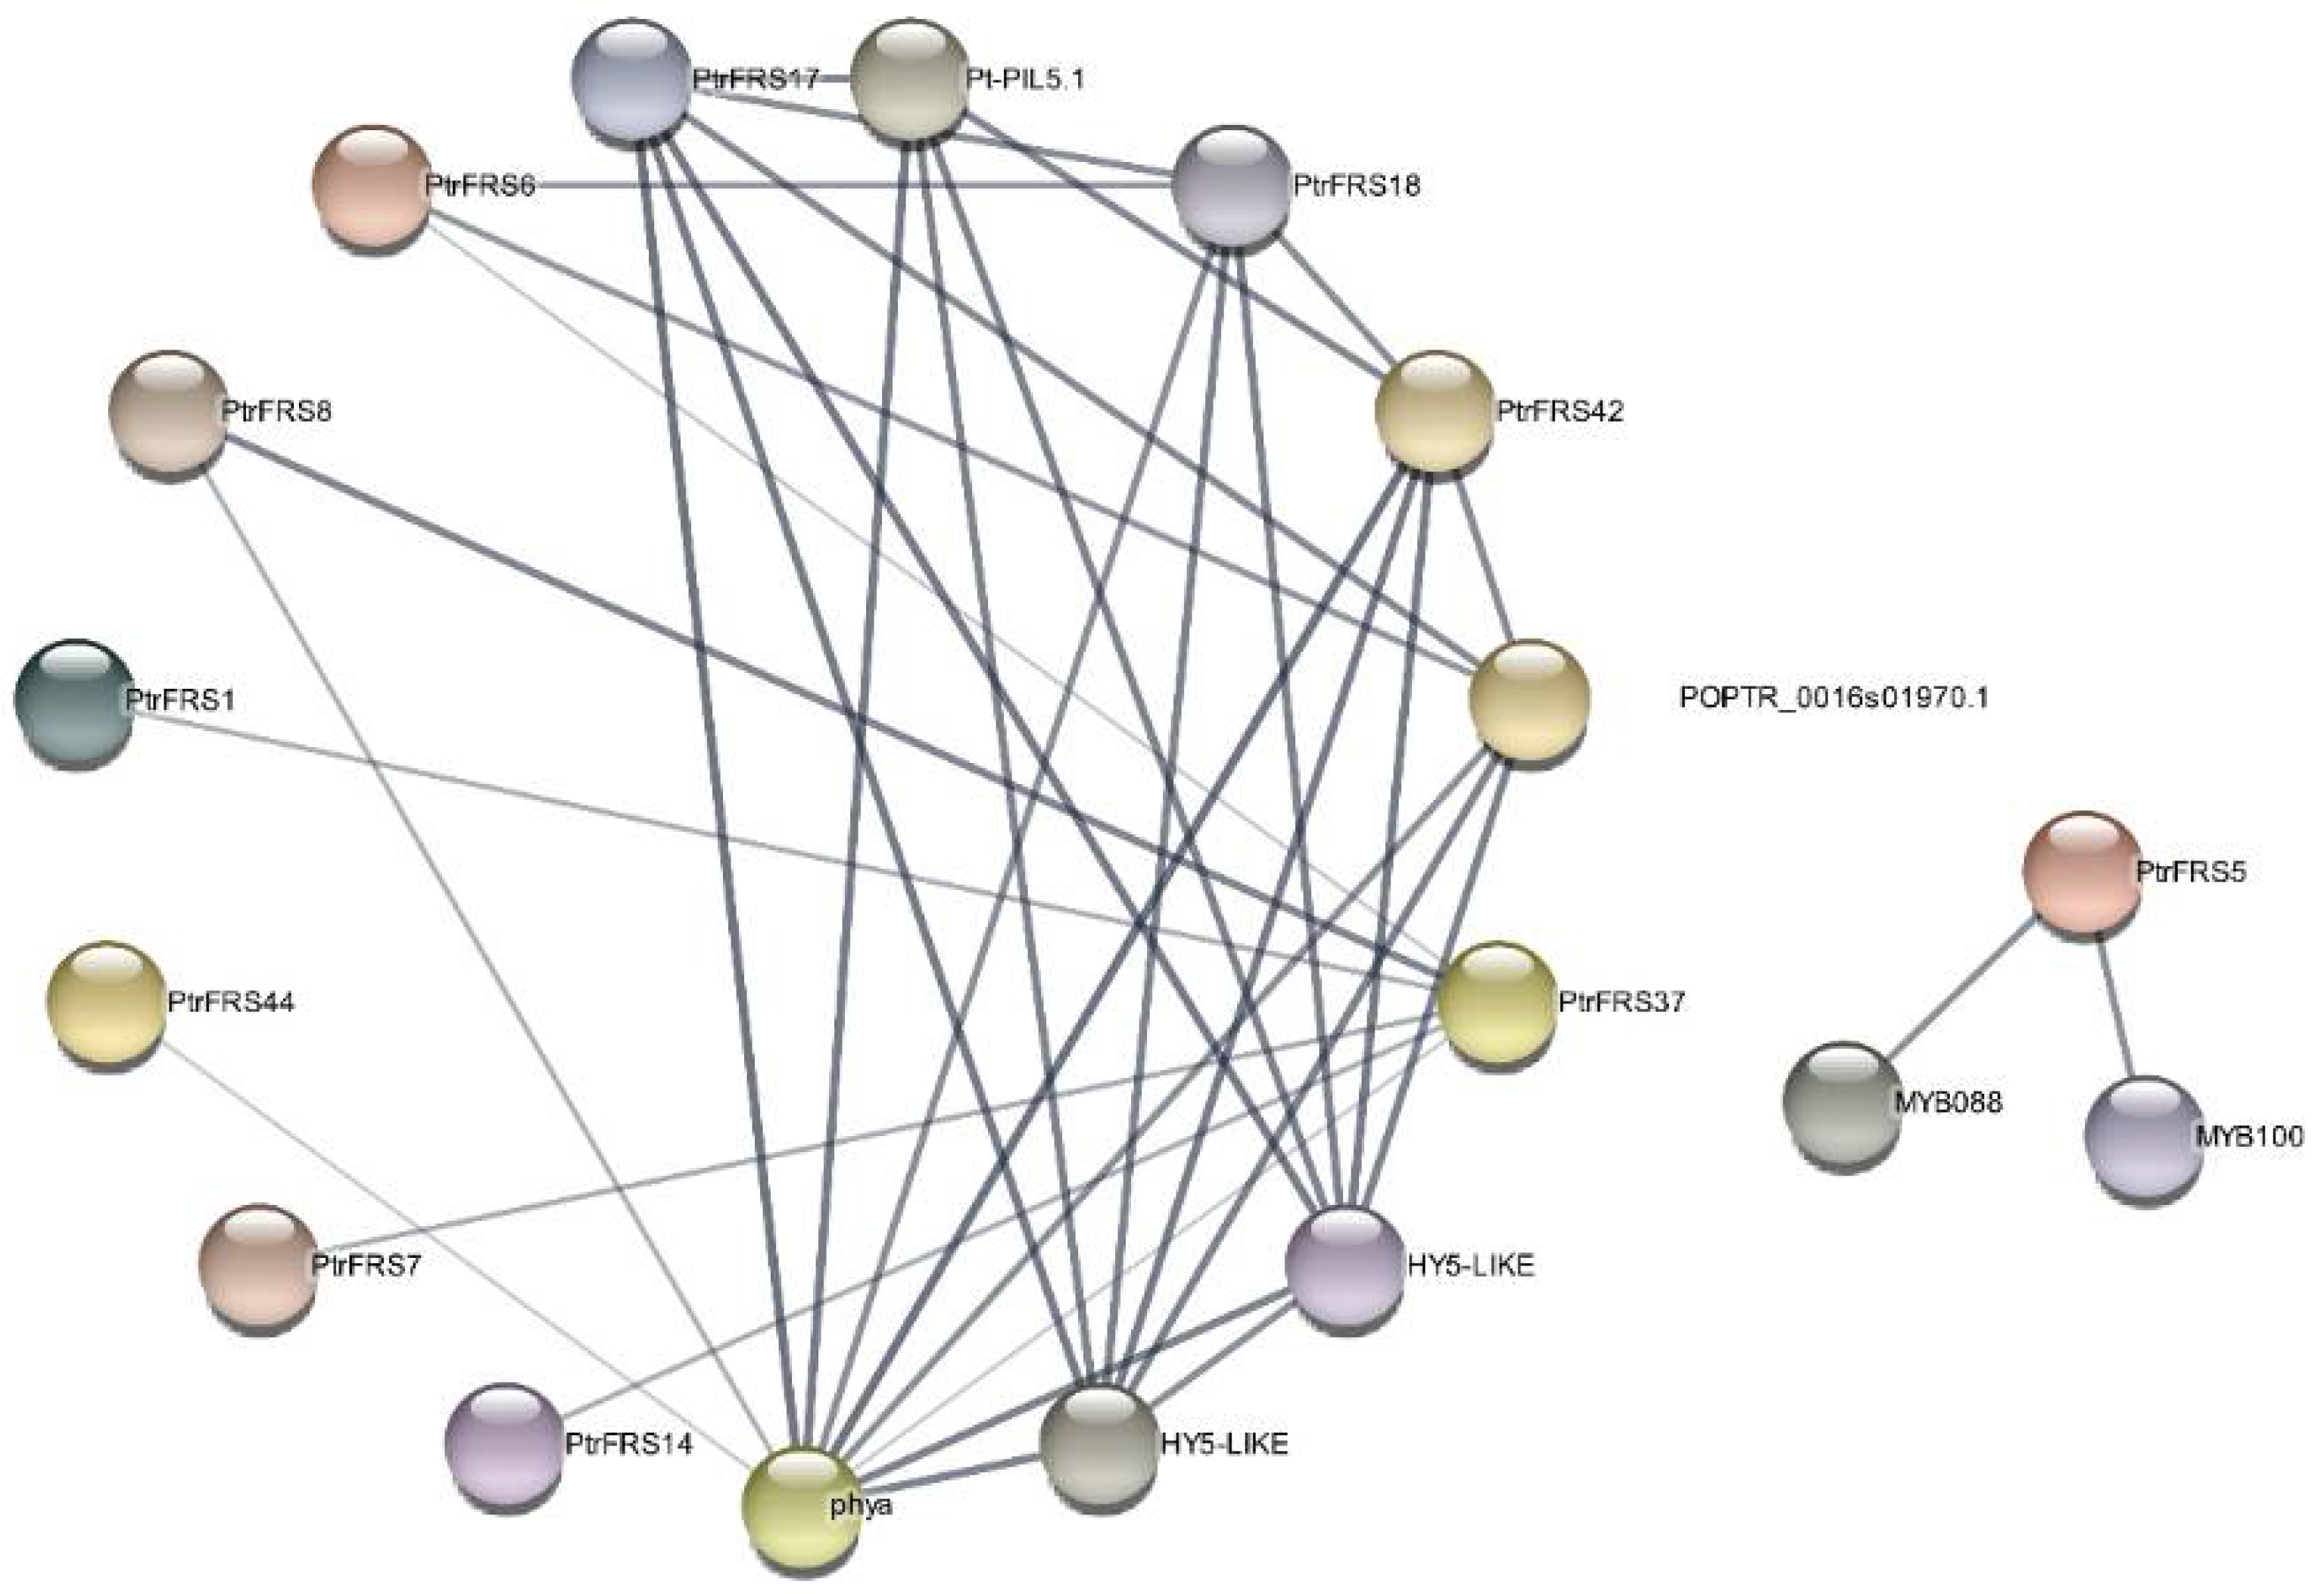
The regulatory relationships of PtrFRS genes were predicted and elucidated. In total, 11 PtrFRS genes, including PtrFRS17, PtrFRS18, and PtrFRS42, were included in the regulatory network, and the phytochrome phyA acted as an upstream regulator of the PtrFAR1/FHY3 genes, directly regulating PtrFRS8, PtrFRS17, PtrFRS18 PtrFRS42 and PtrFRS44. Three other genes, Pt-PIL5.1 and 2 HY5-LIKE genes, also interacted with several genes in the regulatory network. In addition, PtrFRS5 interacts with two MYB proteins: MYB88 and mybMYB100 (Figure 5).

3.5. Transcriptional Expression of PtrFRSs Genes during Light Repones

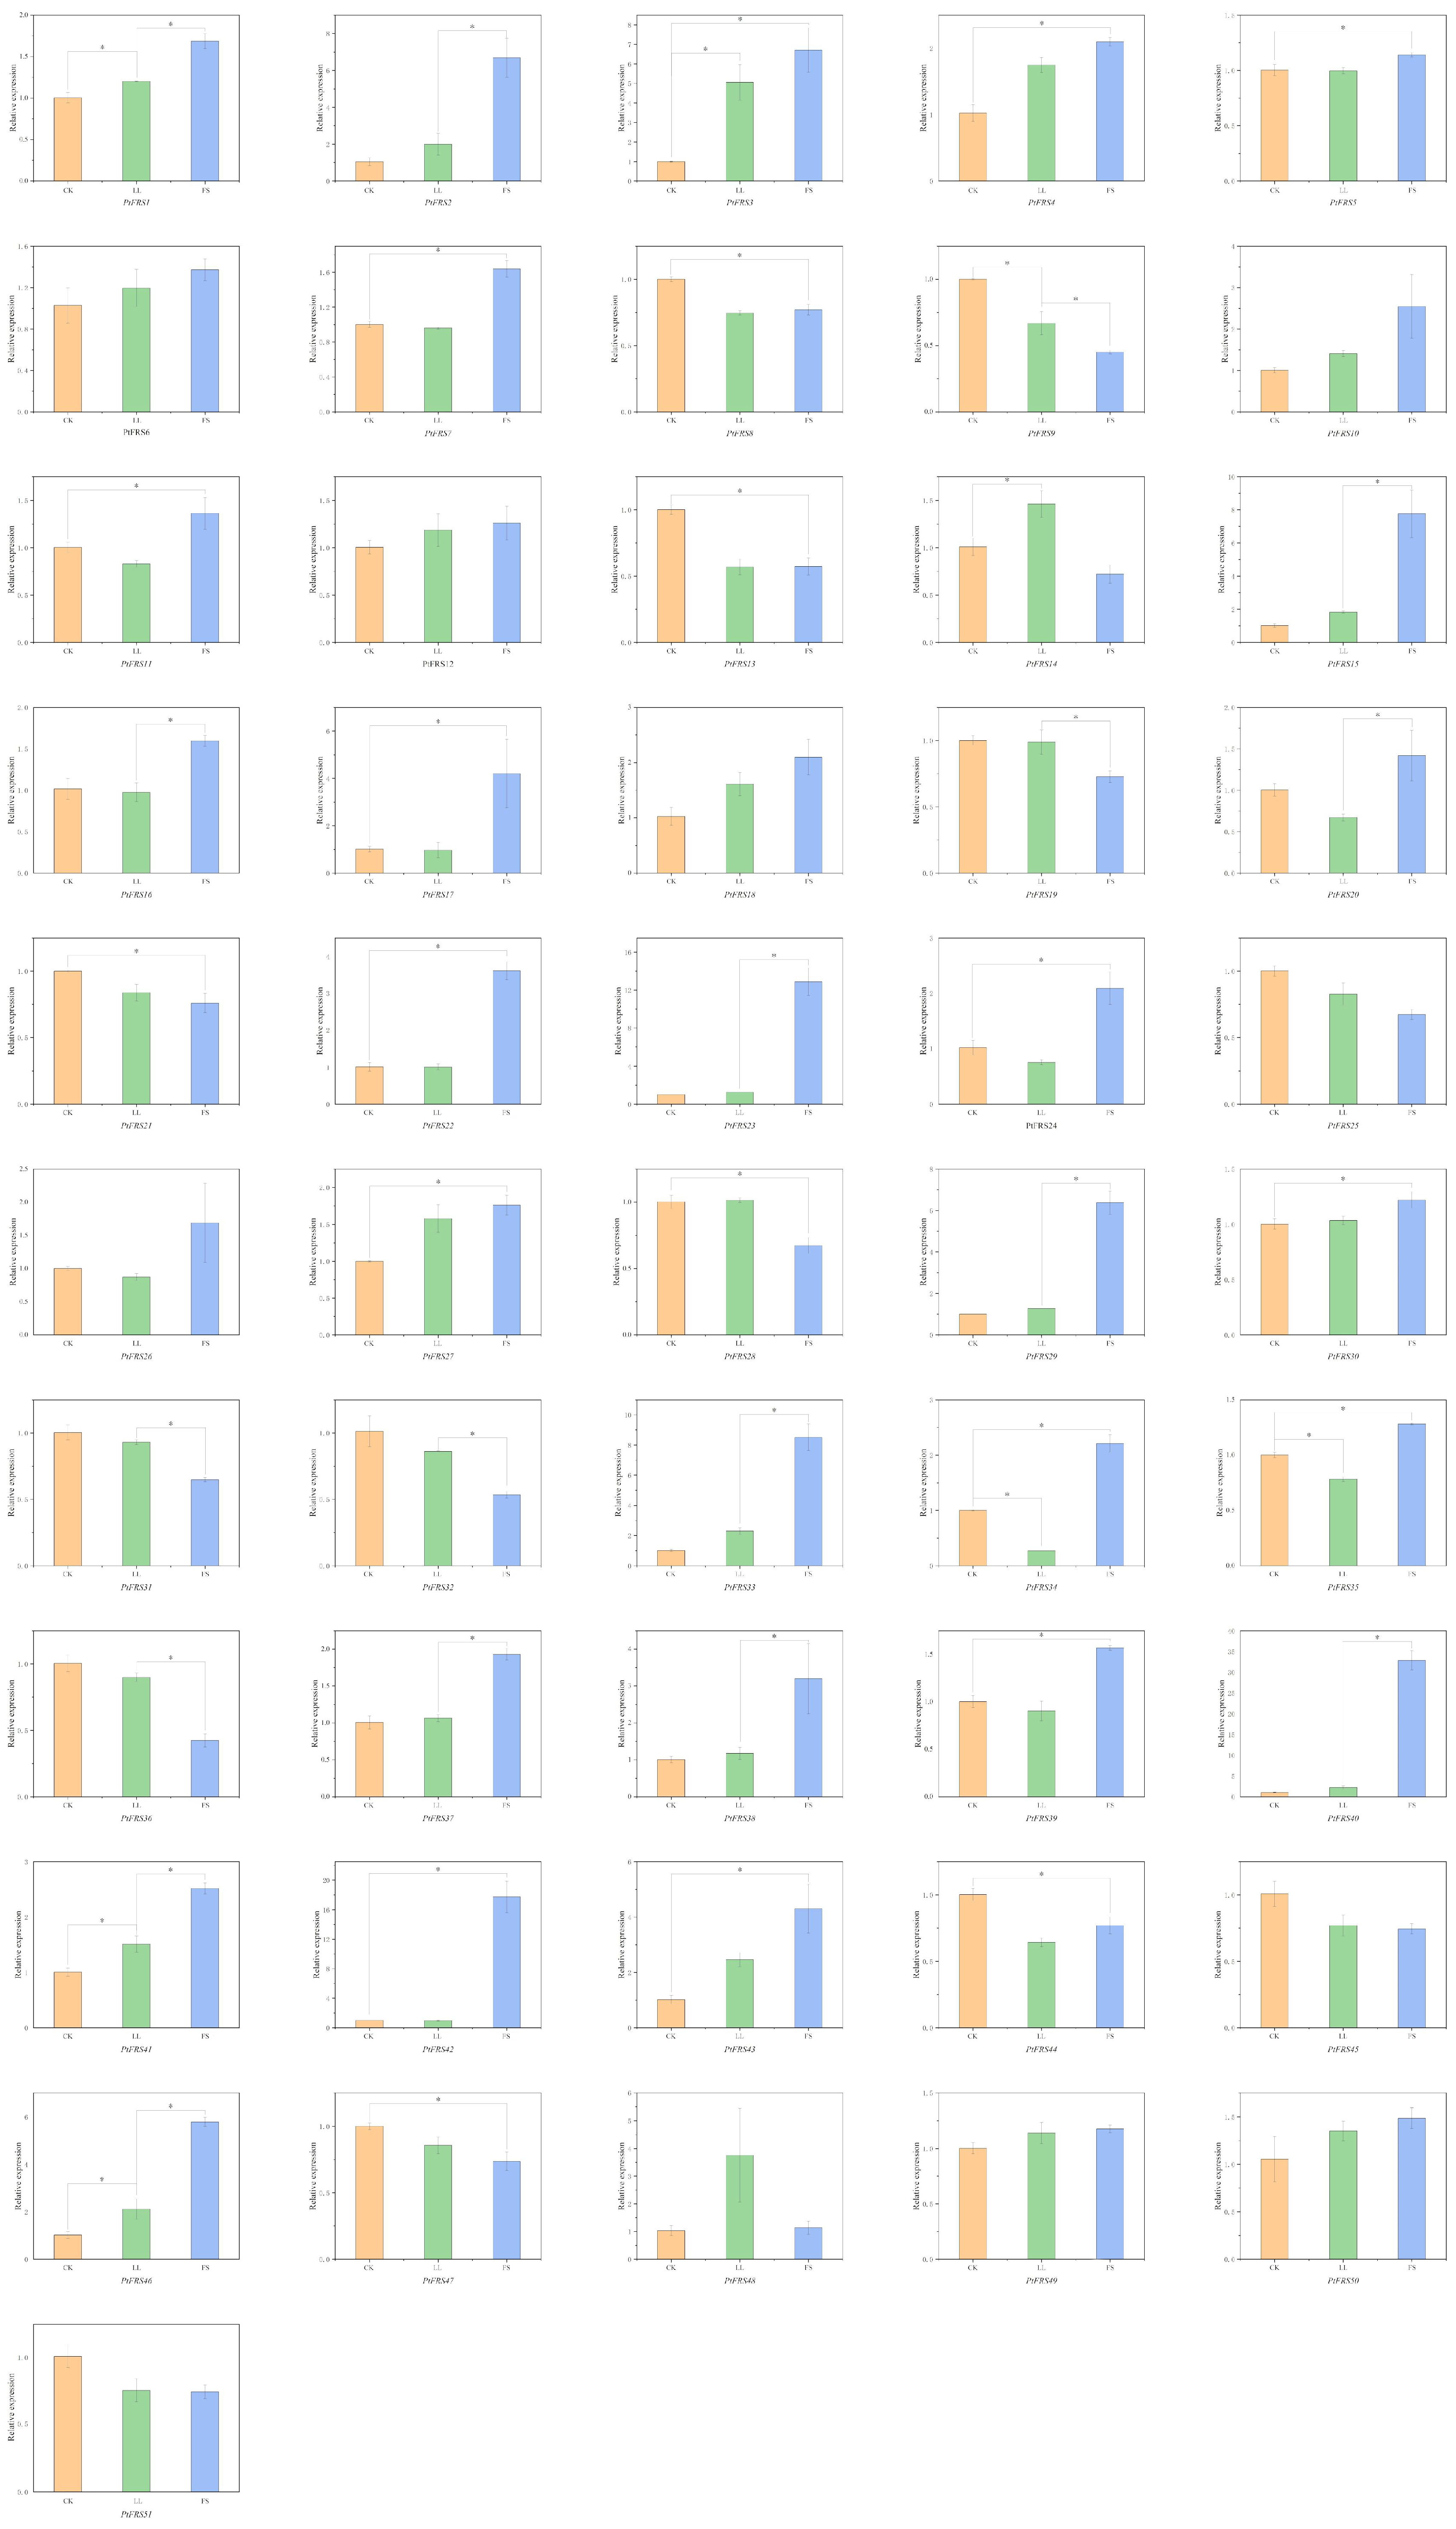
The expression patterns of 51 PtrFRS genes under different light conditions were examined by qPCR using identical growth conditions of P. trichocarpa seedlings placed under different light conditions. The results showed that all PtrFRS genes showed changes in expression, but the expression patterns were different, mainly in two patterns: a positive and negative correlation between the expression and light intensity for the different light response patterns exhibited by PtrFRS genes. About half of the PtrFRS genes were negatively correlated with light intensity, with significant changes in expression compared to positively correlated genes. Among the genes that were negatively correlated with light intensity, PtrFRS2, PtrFRS15, PtrFRS17, PtrFRS22, PtrFRS23, PtrFRS29, PtrFRS33, PtrFRS40, and PtrFRS42 showed greater changes in expression, while PtrFRS40 and PtrFRS42 showed the greatest changes in expression. Among the positive genes, the expression of PtrFRS9 and PtrFRS25 was significantly reduced (Figure 6). No clear distinction in expression patterns was shown between the subfamilies.

4. Discussion

4.1. Identification and Molecular Features of PtrFRS Proteins

The founding members of the FAR1/FHY3 gene family, FAR1 and FHY3, have been independently identified as two important signaling molecules in the PhyA-mediated FR-HIR response [35,36]. Although not much has been reported on this family, it has been studied in several plants, such as Arabidopsis. AtFHY3, AtFAR1, and 12 other AtFRSs have been identified [25]. In this research, HMMER 3.0 was used to identify the PtrFRSs and 51 PtrFRS genes were identified from P. trichocarpa (Table 1). Based on their structure, they were divided into four subfamilies, and each subfamily differed significantly from the other, with subfamilies I and II being more complex in terms of gene length and structure than III and IV (Figure 2).
The conserved protein motifs and gene structures of PtrFRSs were further investigated. During plant evolution, the structural features of genes are an important molecular basis for plant adaptation to environmental changes and for distinguishing them from other gene families [37]. Subfamilies I and II of the four subfamilies of PtrFRSs were more complex in terms of motif number, gene length, and gene structure, which also meant that they perform more complex functions in plants (Figure 2).
The FAR1/FHY3 family is directly regulated by several phytochromes, such as phyA, phyB, phyD, and phyE [10], and is an essential transcription factor family in response to light changes in plants. In this research, we examined the response of PtrFRS genes to changes in light intensity using qPCR with different light intensities in P. trichocarpa. The vast majority of genes responded to changes in light intensity and exhibited two patterns of response: a positive response and negative response, with about half of the genes being negative and showing significant changes in expression compared to the positive-responding genes (Figure 6).

4.2. Potential Regulatory of PtrFRSs

We predicted the interactions between PtrFRSs and other key genes, and a total of 11 PtrFRS genes appeared in the regulatory network, in addition to phyA, PIL5 and other key regulators of plant light response. phyA, an important factor in plant light regulation (Figure 5) [10], is in a regulatory relationship with six PtrFRS genes, and PIL5 and HY5 are also important regulators for light regulation in plants and had regulatory relationships with several PtrFRS genes [38,39]. PtrFRS5 interacted with two MYB proteins, which were homologous to AtMYB36. AtMYB36 is highly expressed in roots and is a transcription factor required for Casparian strip formation and is directly regulated by SCARECROW to regulate the transition from proliferation to differentiation in Arabidopsis roots [40,41], PtrFRS5 may therefore be involved in the regulation of poplar root development.
The expression patterns of PtrFRS genes in response to light intensity were analyzed, and the results showed that the expression of most genes changed, showing both positive and negative patterns of correlation with light intensity. The expression of most of the changed PtrFRS genes was negatively correlated with light intensity, with more pronounced changes in expression compared to the other pattern, which is also consistent with supporting the involvement of FAR1/FHY3 genes in plant photoresponses (Figure 6).
Analysis of the cis-acting elements in the 1500 bp region upstream of PtrFRS showed that cis-acting elements were divided into three categories: growth and metabolism, stress, and hormone, and that the hormone and stress categories contained most of the cis-acting elements. Thus, we can speculate that PtrFRSs also play an important role in plant response to hormonal stimuli and stresses [26].

5. Conclusions

In this study, we performed systematic bioinformatics analysis and identification of the PtrFHY3/FAR1 family genes. A total of 51 PtrFHY3/FAR1 genes (named PtrFRS1PtrFRS51) were identified and their localization on the chromosome was clarified. The PtrFRSs were classified by constructing a phylogenetic tree and analyzing the protein and gene structures of PtrFRSs. Cis-acting elements and protein-protein interaction networks were also predicted. The response of PtrFRSs to different light intensities was determined. These results clarified the bioinformatics of the PtrFHY3/FAR1 family genes and demonstrated that PtrFRSs may play a role in hormone and stress response, growth and development, and light response, providing a theoretical basis for the study of the FHY3/FAR1 family gene-mediated light response and hormone and stress response mechanisms in poplar and even other woody plants.

Supplementary Materials

The following are available online at https://www.mdpi.com/article/10.3390/f12101385/s1, Figure S1: Phylogenetic tree of P. trichocarpa and A. thaliana, Figure S2: Statistics on the distribution of cis-acting elements for PtrFRSs, Table S1: Primer sequences of PtrFRSs for qPCR analysis.

Author Contributions

J.H. and H.Y. designed experiments. J.D., L.Z. and X.G. analyzed the characteristics of sequence data. X.X. and D.C. performed qPCR experiment. J.D. wrote the manuscript. All authors have read and agreed to the published version of the manuscript.

Funding

This research was supported by the National Natural Science Foundation of China (32071797), the National Nonprofit Institute Research Grant of the Chinese Academy of Forestry (CAFYBB2017ZY008), and the National Key Program on Transgenic Research (2018ZX08020002).

Institutional Review Board Statement

Not applicable.

Informed Consent Statement

Not applicable.

Data Availability Statement

Not applicable.

Acknowledgments

We would like to thank Quanzi Li from State Key Laboratory of Tree Genetics and Breeding for providing the P. trichocarpa seedlings.

Conflicts of Interest

The authors declare no conflict of interest.

References

  1. Rausenberger, J.; Tscheuschler, A.; Nordmeier, W.; Wust, F.; Timmer, J.; Schafer, E.; Fleck, C.; Hiltbrunner, A. Photoconversion and nuclear trafficking cycles determine phytochrome A’s response profile to far-red light. Cell 2011, 146, 813–825. [Google Scholar] [CrossRef] [PubMed] [Green Version]
  2. Bae, G.; Choi, G. Decoding of light signals by plant phytochromes and their interacting proteins. Annu. Rev. Plant Biol. 2008, 59, 281–311. [Google Scholar] [CrossRef] [Green Version]
  3. Botto, J.F.U.D.; Sanchez, R.A.; Whitelam, G.C.; Casal, J.J. Phytochrome A mediates the promotion of seed germination by very low fluences of light and canopy shade light in Arabidopsis. Plant Physiol. 1996, 110, 439–444. [Google Scholar] [CrossRef] [Green Version]
  4. Quail, P.H.; Boylan, M.T.; Parks, B.M.; Short, T.W.; Xu, Y.; Wagner, D. Phytochromes: Photosensory perception and signal transduction. Science 1995, 268, 675–680. [Google Scholar] [CrossRef]
  5. Kim, L.; Kircher, S.; Toth, R.; Adam, E.; Schafer, E.; Nagy, F. Light-induced nuclear import of phytochrome-A: GFP fusion proteins is differentially regulated in transgenic tobacco and Arabidopsis. Plant J. 2000, 22, 125–133. [Google Scholar] [CrossRef] [Green Version]
  6. Kircher, S.; Gil, P.; Kozma-Bognar, L.; Fejes, E.; Speth, V.; Husselstein-Muller, T.; Bauer, D.; Adam, E.; Schafer, E.; Nagy, F. Nucleocytoplasmic partitioning of the plant photoreceptors phytochrome A, B, C, D, and E is regulated differentially by light and exhibits a diurnal rhythm. Plant Cell 2002, 14, 1541–1555. [Google Scholar] [CrossRef] [Green Version]
  7. Kevei, E.; Schafer, E.; Nagy, F. Light-regulated nucleo-cytoplasmic partitioning of phytochromes. J. Exp. Bot. 2007, 58, 3113–3124. [Google Scholar] [CrossRef]
  8. Lin, R.; Ding, L.; Casola, C.; Ripoll, D.R.; Feschotte, C.; Wang, H. Transposase-Derived Transcription Factors Regulate Light Signaling in Arabidopsis. Science 2007, 318, 1302–1305. [Google Scholar] [CrossRef] [Green Version]
  9. Huan, L.; Wang, X.X.; Liu, W.; Li, L.; Gao, D. Expression Analysis of FAR1/FHY3-related Genes Involved in Nectarine Floral Buds during Dormancy Induction. J. Shandong Agric. Univ. (Nat. Sci. Ed.) 2017, 48, 229–235. [Google Scholar]
  10. Siddiqui, H.; Khan, S.; Rhodes, B.M.; Devlin, P.F. FHY3 and FAR1 Act Downstream of Light Stable Phytochromes. Front. Plant Sci. 2016, 7, 175. [Google Scholar] [CrossRef] [Green Version]
  11. Wang, W.; Tang, W.; Ma, T.; Niu, D.; Jin, J.B.; Wang, H.; Lin, R. A pair of light signaling factors FHY3 and FAR1 regulates plant immunity by modulating chlorophyll biosynthesis. J. Integr. Plant Biol. 2016, 58, 91–103. [Google Scholar] [CrossRef]
  12. Liu, Y.; Ma, M.; Li, G.; Yuan, L.; Xie, Y.; Wei, H.; Ma, X.; Li, Q.; Devlin, P.F.; Xu, X.; et al. Transcription Factors FHY3 and FAR1 Regulate Light-Induced CIRCADIAN CLOCK ASSOCIATED1 Gene Expression in Arabidopsis. Plant Cell 2020, 32, 1464–1478. [Google Scholar] [CrossRef]
  13. Xie, Y.; Zhou, Q.; Zhao, Y.; Li, Q.; Liu, Y.; Ma, M.; Wang, B.; Shen, R.; Zheng, Z.; Wang, H. FHY3 and FAR1 Integrate Light Signals with the miR156-SPL Module-Mediated Aging Pathway to Regulate Arabidopsis Flowering. Mol. Plant 2020, 13, 483–498. [Google Scholar] [CrossRef] [PubMed] [Green Version]
  14. Wu, Q.; Bai, X.; Zhao, W.; Shi, X.; Xiang, D.; Wan, Y.; Wu, X.; Sun, Y.; Zhao, J.; Peng, L.; et al. Investigation into the underlying regulatory mechanisms shaping inflorescence architecture in Chenopodium quinoa. BMC Genom. 2019, 20, 658. [Google Scholar] [CrossRef] [PubMed]
  15. Li, H.; Wang, L.; Mai, Y.; Han, W.; Suo, Y.; Diao, S.; Sun, P.; Fu, J. Phytohormone and integrated mRNA and miRNA transcriptome analyses and differentiation of male between hermaphroditic floral buds of andromonoecious Diospyros kaki Thunb. BMC Genom. 2021, 22, 203. [Google Scholar] [CrossRef] [PubMed]
  16. Ma, L.; Li, G. Arabidopsis FAR-RED ELONGATED HYPOCOTYL3 negatively regulates carbon starvation responses. Plant Cell Environ. 2021, 44, 1816–1829. [Google Scholar] [CrossRef] [PubMed]
  17. Ma, L.; Xue, N.; Fu, X.; Zhang, H.; Li, G. Arabidopsis thaliana FAR-RED ELONGATED HYPOCOTYLS3 (FHY3) and FAR-RED-IMPAIRED RESPONSE1 (FAR1) modulate starch synthesis in response to light and sugar. New Phytol. 2017, 213, 1682–1696. [Google Scholar] [CrossRef]
  18. Xie, Y.; Liu, Y.; Ma, M.; Zhou, Q.; Zhao, Y.; Zhao, B.; Wang, B.; Wei, H.; Wang, H. Arabidopsis FHY3 and FAR1 integrate light and strigolactone signaling to regulate branching. Nat. Commun. 2020, 11, 1955. [Google Scholar] [CrossRef] [PubMed] [Green Version]
  19. Bryant, N.D.; Pu, Y.; Tschaplinski, T.J.; Tuskan, G.A.; Muchero, W.; Kalluri, U.C.; Yoo, C.G.; Ragauskas, A.J. Transgenic Poplar Designed for Biofuels. Trends Plant Sci. 2020, 25, 881–896. [Google Scholar] [CrossRef]
  20. Kucharska, K.; Łukajtis, R.; Słupek, E.; Cieśliński, H.; Rybarczyk, P.; Kamiński, M. Hydrogen Production from Energy Poplar Preceded by MEA Pre-Treatment and Enzymatic Hydrolysis. Molecules 2018, 23, 3029. [Google Scholar] [CrossRef] [Green Version]
  21. Taylor, G. Populus: Arabidopsis for forestry. Do we need a model tree? Ann. Bot. 2002, 90, 681–689. [Google Scholar] [CrossRef] [PubMed] [Green Version]
  22. Tuskan, G.A.; DiFazio, S.; Jansson, S.; Bohlmann, J.; Grigoriev, I.; Hellsten, U.; Putnam, N.; Ralph, S.; Rombauts, S.; Salamov, A.; et al. The Genome of Black Cottonwood, Populus trichocarpa (Torr. & Gray). Science 2006, 313, 1596–1604. [Google Scholar] [PubMed] [Green Version]
  23. Wullschleger, S.D.; Tuskan, G.A.; DiFazio, S.P. Genomics and the tree physiologist. Tree Physiol. 2002, 22, 1273–1276. [Google Scholar] [CrossRef] [PubMed] [Green Version]
  24. Liu, Q.; Ding, C.; Chu, Y.; Chen, J.; Zhang, W.; Zhang, B.; Huang, Q.; Su, X. PoplarGene: Poplar gene network and resource for mining functional information for genes from woody plants. Sci. Rep. 2016, 6, 31356. [Google Scholar] [CrossRef] [Green Version]
  25. Lin, R.; Wang, H. Arabidopsis FHY3/FAR1 gene family and distinct roles of its members in light control of Arabidopsis development. Plant Physiol. 2004, 136, 4010–4022. [Google Scholar] [CrossRef] [Green Version]
  26. Liu, Z.; An, C.; Zhao, Y.; Xiao, Y.; Bao, L.; Gong, C.; Gao, Y. Genome-Wide Identification and Characterization of the CsFHY3/FAR1 Gene Family and Expression Analysis under Biotic and Abiotic Stresses in Tea Plants (Camellia sinensis). Plants 2021, 10, 570. [Google Scholar] [CrossRef]
  27. El-Gebali, S.; Mistry, J.; Bateman, A.; Eddy, S.R.; Luciani, A.; Potter, S.C.; Qureshi, M.; Richardson, L.J.; Salazar, G.A.; Smart, A.; et al. The Pfam protein families database in 2019. Nucleic Acids Res. 2019, 47, D427–D432. [Google Scholar] [CrossRef]
  28. Johnson, L.S.; Eddy, S.R.; Portugaly, E. Hidden Markov model speed heuristic and iterative HMM search procedure. BMC Bioinform. 2010, 11, 431. [Google Scholar] [CrossRef] [Green Version]
  29. Letunic, I.; Khedkar, S.; Bork, P. SMART: Recent updates, new developments and status in 2020. Nucleic Acids Res. 2021, 49, D458–D460. [Google Scholar] [CrossRef]
  30. Wilkins, M.R.; Gasteiger, E.; Bairoch, A.; Sanchez, J.C.; Williams, K.L.; Appel, R.D.; Hochstrasser, D.F. Protein identification and analysis tools in the ExPASy server. Methods Mol. Biol. 1999, 112, 531–552. [Google Scholar]
  31. Chen, C.J.; Chen, H.; Zhang, Y.; Thomas, H.R.; Frank, M.H.; He, Y.H.; Xia, R. TBtools: An integrative toolkit developed for interactive analyses of big biological data. Mol. Plant 2020, 13, 1194–1202. [Google Scholar] [CrossRef]
  32. Bailey, T.L.; Boden, M.; Buske, F.A.; Frith, M.; Grant, C.E.; Clementi, L.; Ren, J.; Li, W.W.; Noble, W.S. MEME SUITE: Tools for motif discovery and searching. Nucleic Acids Res. 2009, 37, W202–W208. [Google Scholar] [CrossRef]
  33. Lescot, M.; Dehais, P.; Thijs, G.; Marchal, K.; Moreau, Y.; Van de Peer, Y.; Rouze, P.; Rombauts, S. PlantCARE, a database of plant cis-acting regulatory elements and a portal to tools for in silico analysis of promoter sequences. Nucleic Acids Res. 2002, 30, 325–327. [Google Scholar] [CrossRef]
  34. Szklarczyk, D.; Gable, A.L.; Lyon, D.; Junge, A.; Wyder, S.; Huerta-Cepas, J.; Simonovic, M.; Doncheva, N.T.; Morris, J.H.; Bork, P.; et al. STRING v11: Protein-protein association networks with increased coverage, supporting functional discovery in genome-wide experimental datasets. Nucleic Acids Res. 2019, 47, D607–D613. [Google Scholar] [CrossRef] [Green Version]
  35. Hudson, M.; Ringli, C.; Boylan, M.T.; Quail, P.H. The FAR1 locus encodes a novel nuclear protein specific to phytochrome A signaling. Genes Dev. 1999, 13, 2017–2027. [Google Scholar] [CrossRef] [Green Version]
  36. Wang, H.; Deng, X.W. Arabidopsis FHY3 defines a key phytochrome A signaling component directly interacting with its homologous partner FAR1. EMBO J. 2002, 21, 1339–1349. [Google Scholar] [CrossRef] [PubMed] [Green Version]
  37. Jeffares, D.C.; Penkett, C.J.; Bahler, J. Rapidly regulated genes are intron poor. Trends Genet. 2008, 24, 375–378. [Google Scholar] [CrossRef]
  38. Gangappa, S.N.; Botto, J.F. The Multifaceted Roles of HY5 in Plant Growth and Development. Mol. Plant 2016, 9, 1353–1365. [Google Scholar] [CrossRef] [Green Version]
  39. Wu, M.; Liu, D.; Abdul, W.; Upreti, S.; Liu, Y.; Song, G.; Wu, J.; Liu, B.; Gan, Y. PIL5 represses floral transition in Arabidopsis under long day conditions. Biochem. Biophys. Res. Commun. 2018, 499, 513–518. [Google Scholar] [CrossRef] [PubMed]
  40. Kamiya, T.; Borghi, M.; Wang, P.; Danku, J.M.C.; Kalmbach, L.; Hosmani, P.S.; Naseer, S.; Fujiwara, T.; Geldner, N.; Salt, D.E. The MYB36 transcription factor orchestrates Casparian strip formation. Proc. Natl. Acad. Sci. USA 2015, 112, 10533–10538. [Google Scholar] [CrossRef] [PubMed] [Green Version]
  41. Liberman, L.M.; Sparks, E.E.; Moreno-Risueno, M.A.; Petricka, J.J.; Benfey, P.N. MYB36 regulates the transition from proliferation to differentiation in the Arabidopsis root. Proc. Natl. Acad. Sci. USA 2015, 112, 12099–12104. [Google Scholar] [CrossRef] [PubMed] [Green Version]
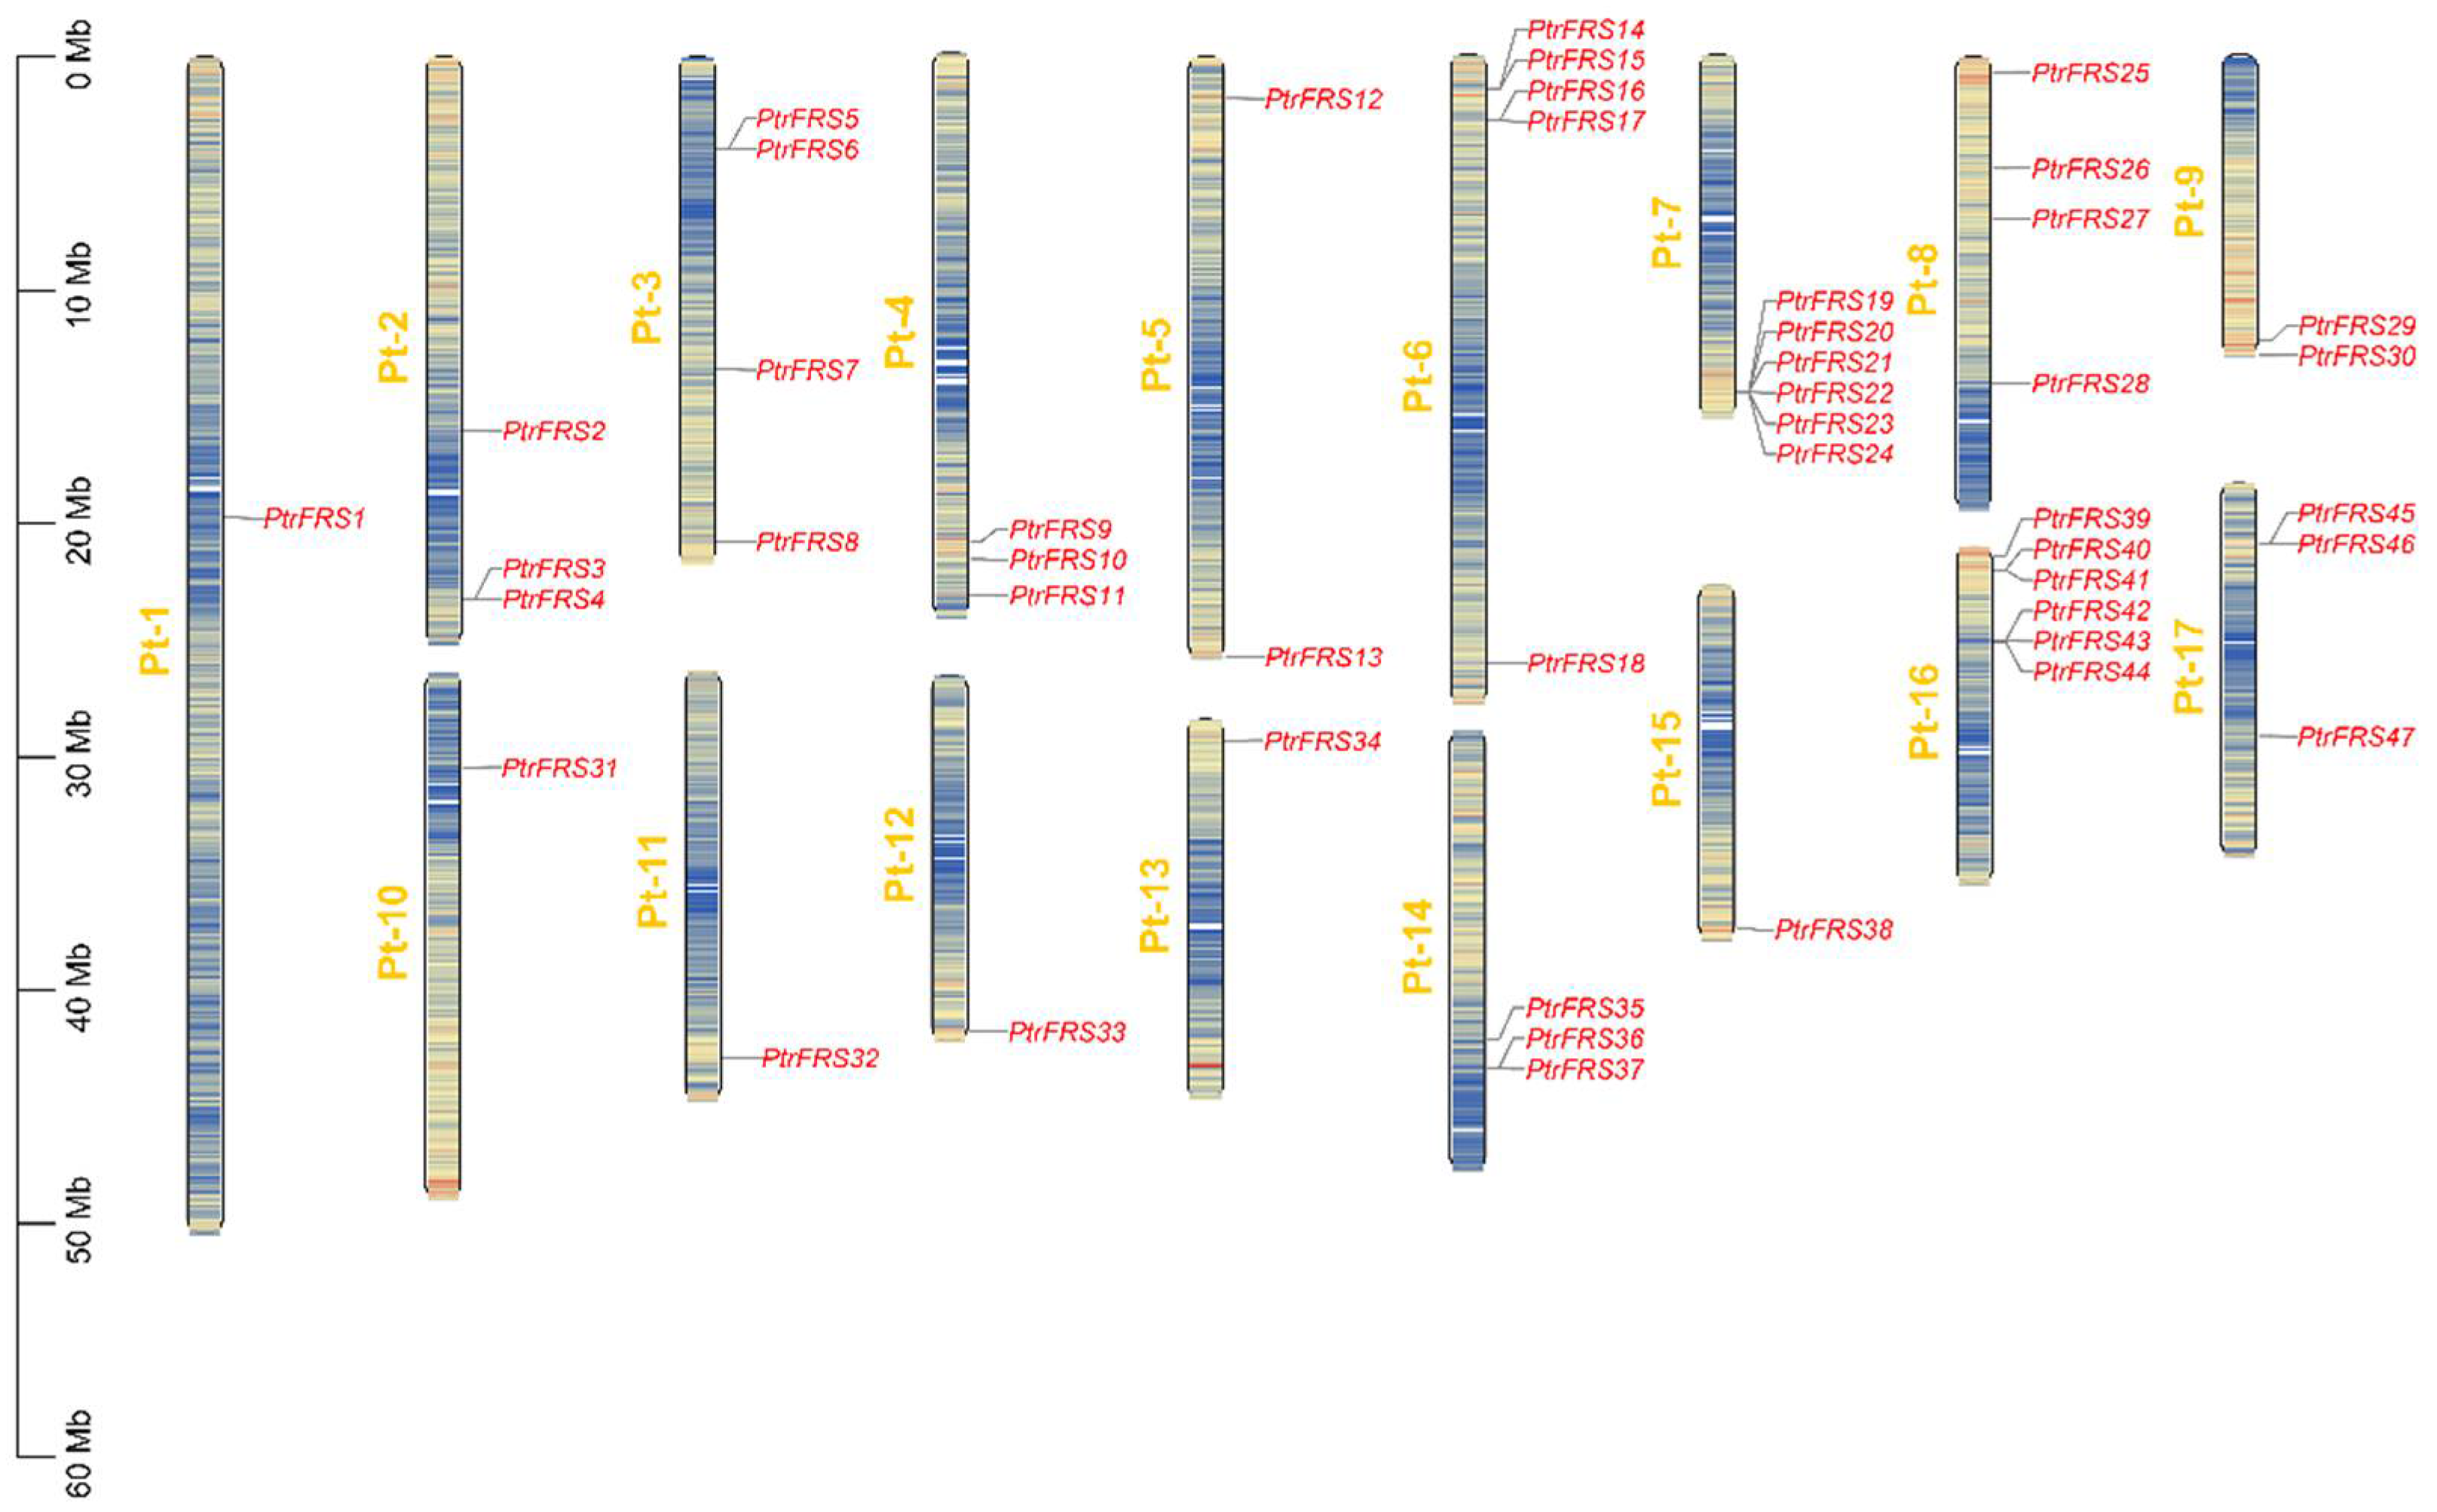
Figure 1. Chromosome localization of the PtrFRSs.
Forests 12 01385 g001
Figure 2. Phylogenetic and genetic structure analysis of PtrFRSs. (A) Phylogenetic tree constructed using the maximum likelihood method using 51 PtrFRS protein sequences and divided into four subfamilies. (B) Distribution of motifs in PtrFRS proteins, 20 motifs in total. (C) Structure of the PtrFRS genes, with the UTR in green, the FAR1 domain in pink, the exon in yellow, and the intron in the middle of the blank region.
Forests 12 01385 g002
Figure 3. Analysis of the cis-acting elements of PtrFRSs. (A) Phylogenetic tree of PtrFRSs. (B) Distribution of cis-acting elements in the 1500 bp region upstream of PtrFRSs, with each colored oval representing a different cis-acting element.
Forests 12 01385 g003
Figure 4. Statistics and classification of the cis-acting elements of PtrFRSs. (A) The cis-acting elements in the 1500 bp region upstream of PtrFRSs were divided into three groups according to their function. (B) The number of each cis-acting element of PtrFRSs.
Forests 12 01385 g004
Figure 5. Predictive analysis of the PtrFREs regulatory networks.
Forests 12 01385 g005
Figure 6. Expression patterns of PtrFRSs in response to changes in light intensity. CK normal light, LL low light, FS full shade. Average data with standard errors from three replicates is presented (* p < 0.05).
Forests 12 01385 g006
Table 1. Information of PtrFRS genes.
Gene ID Phytozome IDChr
Location
ProteinSubcellular LocalizationSignal Pep
LengthMwpIGRAVY
PtrFRS1Potri.001G201600166977,238.955.74−0.426NucleusNO
PtrFRS2Potri.002G199300275986,585.615.95−0.321NucleusNO
PtrFRS3Potri.002G239300225730,079.925.27−0.721NucleusNO
PtrFRS4Potri.002G239400217820,460.269.61−0.83NucleusNO
PtrFRS5Potri.003G031200373285,391.065.09−0.566NucleusNO
PtrFRS6Potri.003G031400365876,223.958.1−0.429NucleusNO
PtrFRS7Potri.003G1103003897103,330.628.3−0.691NucleusNO
PtrFRS8Potri.003G207100374886,459.716.81−0.567NucleusNO
PtrFRS9Potri.004G196300488399,461.926.22−0.495NucleusNO
PtrFRS10Potri.004G209000478990,574.946.37−0.563NucleusNO
PtrFRS11Potri.004G227600467978,035.737.89−0.435NucleusNO
PtrFRS12Potri.005G023700548454,628.347.81−0.877NucleusNO
PtrFRS13Potri.005G257600575986,814.746.06−0.495NucleusNO
PtrFRS14Potri.006G020600684297,070.986.67−0.548CytoplasmNO
PtrFRS15Potri.006G020700684696,918.047.06−0.674CytoplasmNO
PtrFRS16Potri.006G039700641746,188.239.29−0.312NucleusNO
PtrFRS17Potri.006G039800647051,097.488.7−0.267NucleusNO
PtrFRS18Potri.006G256300667077,830.436.27−0.469NucleusNO
PtrFRS19Potri.007G128700724828,544.495.61−0.535CytoplasmNO
PtrFRS20Potri.007G128800725329,360.945.75−0.895CytoplasmNO
PtrFRS21Potri.007G128900724828,675.985.46−0.923NucleusNO
PtrFRS22Potri.007G129000710712,473.4510.06−0.717NucleusNO
PtrFRS23Potri.007G129100716919,509.578.93−0.534NucleusNO
PtrFRS24Potri.007G129500727331,258.185.72−0.662NucleusNO
PtrFRS25Potri.008G011800886097,563.176.06−0.432PeroxisomesNO
PtrFRS26Potri.008G076800825528,646.27.09−0.762NucleusNO
PtrFRS27Potri.008G108800874284,679.095.73−0.326NucleusNO
PtrFRS28Potri.008G199300883095,699.098.21−0.594NucleusNO
PtrFRS29Potri.009G1584009902100,979.556.18−0.476NucleusNO
PtrFRS30Potri.009G170100978489,932.746.99−0.502NucleusNO
PtrFRS31Potri.010G0290001078890,350.188.72−0.514NucleusNO
PtrFRS32Potri.011G1458001180792,308.166.33−0.509NucleusNO
PtrFRS33Potri.012G1375001286199,483.875.88−0.584NucleusNO
PtrFRS34Potri.013G0140001314816,491.427.73−0.939NucleusNO
PtrFRS35Potri.014G1670001468679,495.165.95−0.413ChloroplastNO
PtrFRS36Potri.014G1765001421424,735.018.39−0.866NucleusNO
PtrFRS37Potri.014G1766001420723,296.236.26−0.71NucleusNO
PtrFRS38Potri.015G1393001572583,760.736.02−0.532NucleusNO
PtrFRS39Potri.016G0073001669180,354.365.87−0.415NucleusNO
PtrFRS40Potri.016G0181001685396,769.585.95−0.43NucleusNO
PtrFRS41Potri.016G0183001684396,537.657.09−0.685NucleusNO
PtrFRS42Potri.016G0585001671481,170.664.89−0.518NucleusNO
PtrFRS43Potri.016G0587001662572,679.857.21−0.478NucleusNO
PtrFRS44Potri.016G0591001663472,139.354.79−0.538NucleusNO
PtrFRS45Potri.017G0291001725028,553.236.52−0.07NucleusNO
PtrFRS46Potri.017G0294001728632,877.487.13−0.622ChloroplastNO
PtrFRS47Potri.017G0910001741847,330.855.08−0.607CytoplasmNO
PtrFRS48Potri.T124200Scaffold25028,553.236.52−0.7NucleusNO
PtrFRS49Potri.T124600Scaffold28332,491.987.14−0.657NucleusNO
PtrFRS50Potri.T124700Scaffold17920,547.285.07−0.445CytoplasmNO
PtrFRS51Potri.T137500Scaffold56363,665.59.17−0.604NucleusNO
Publisher’s Note: MDPI stays neutral with regard to jurisdictional claims in published maps and institutional affiliations.