Appendix A
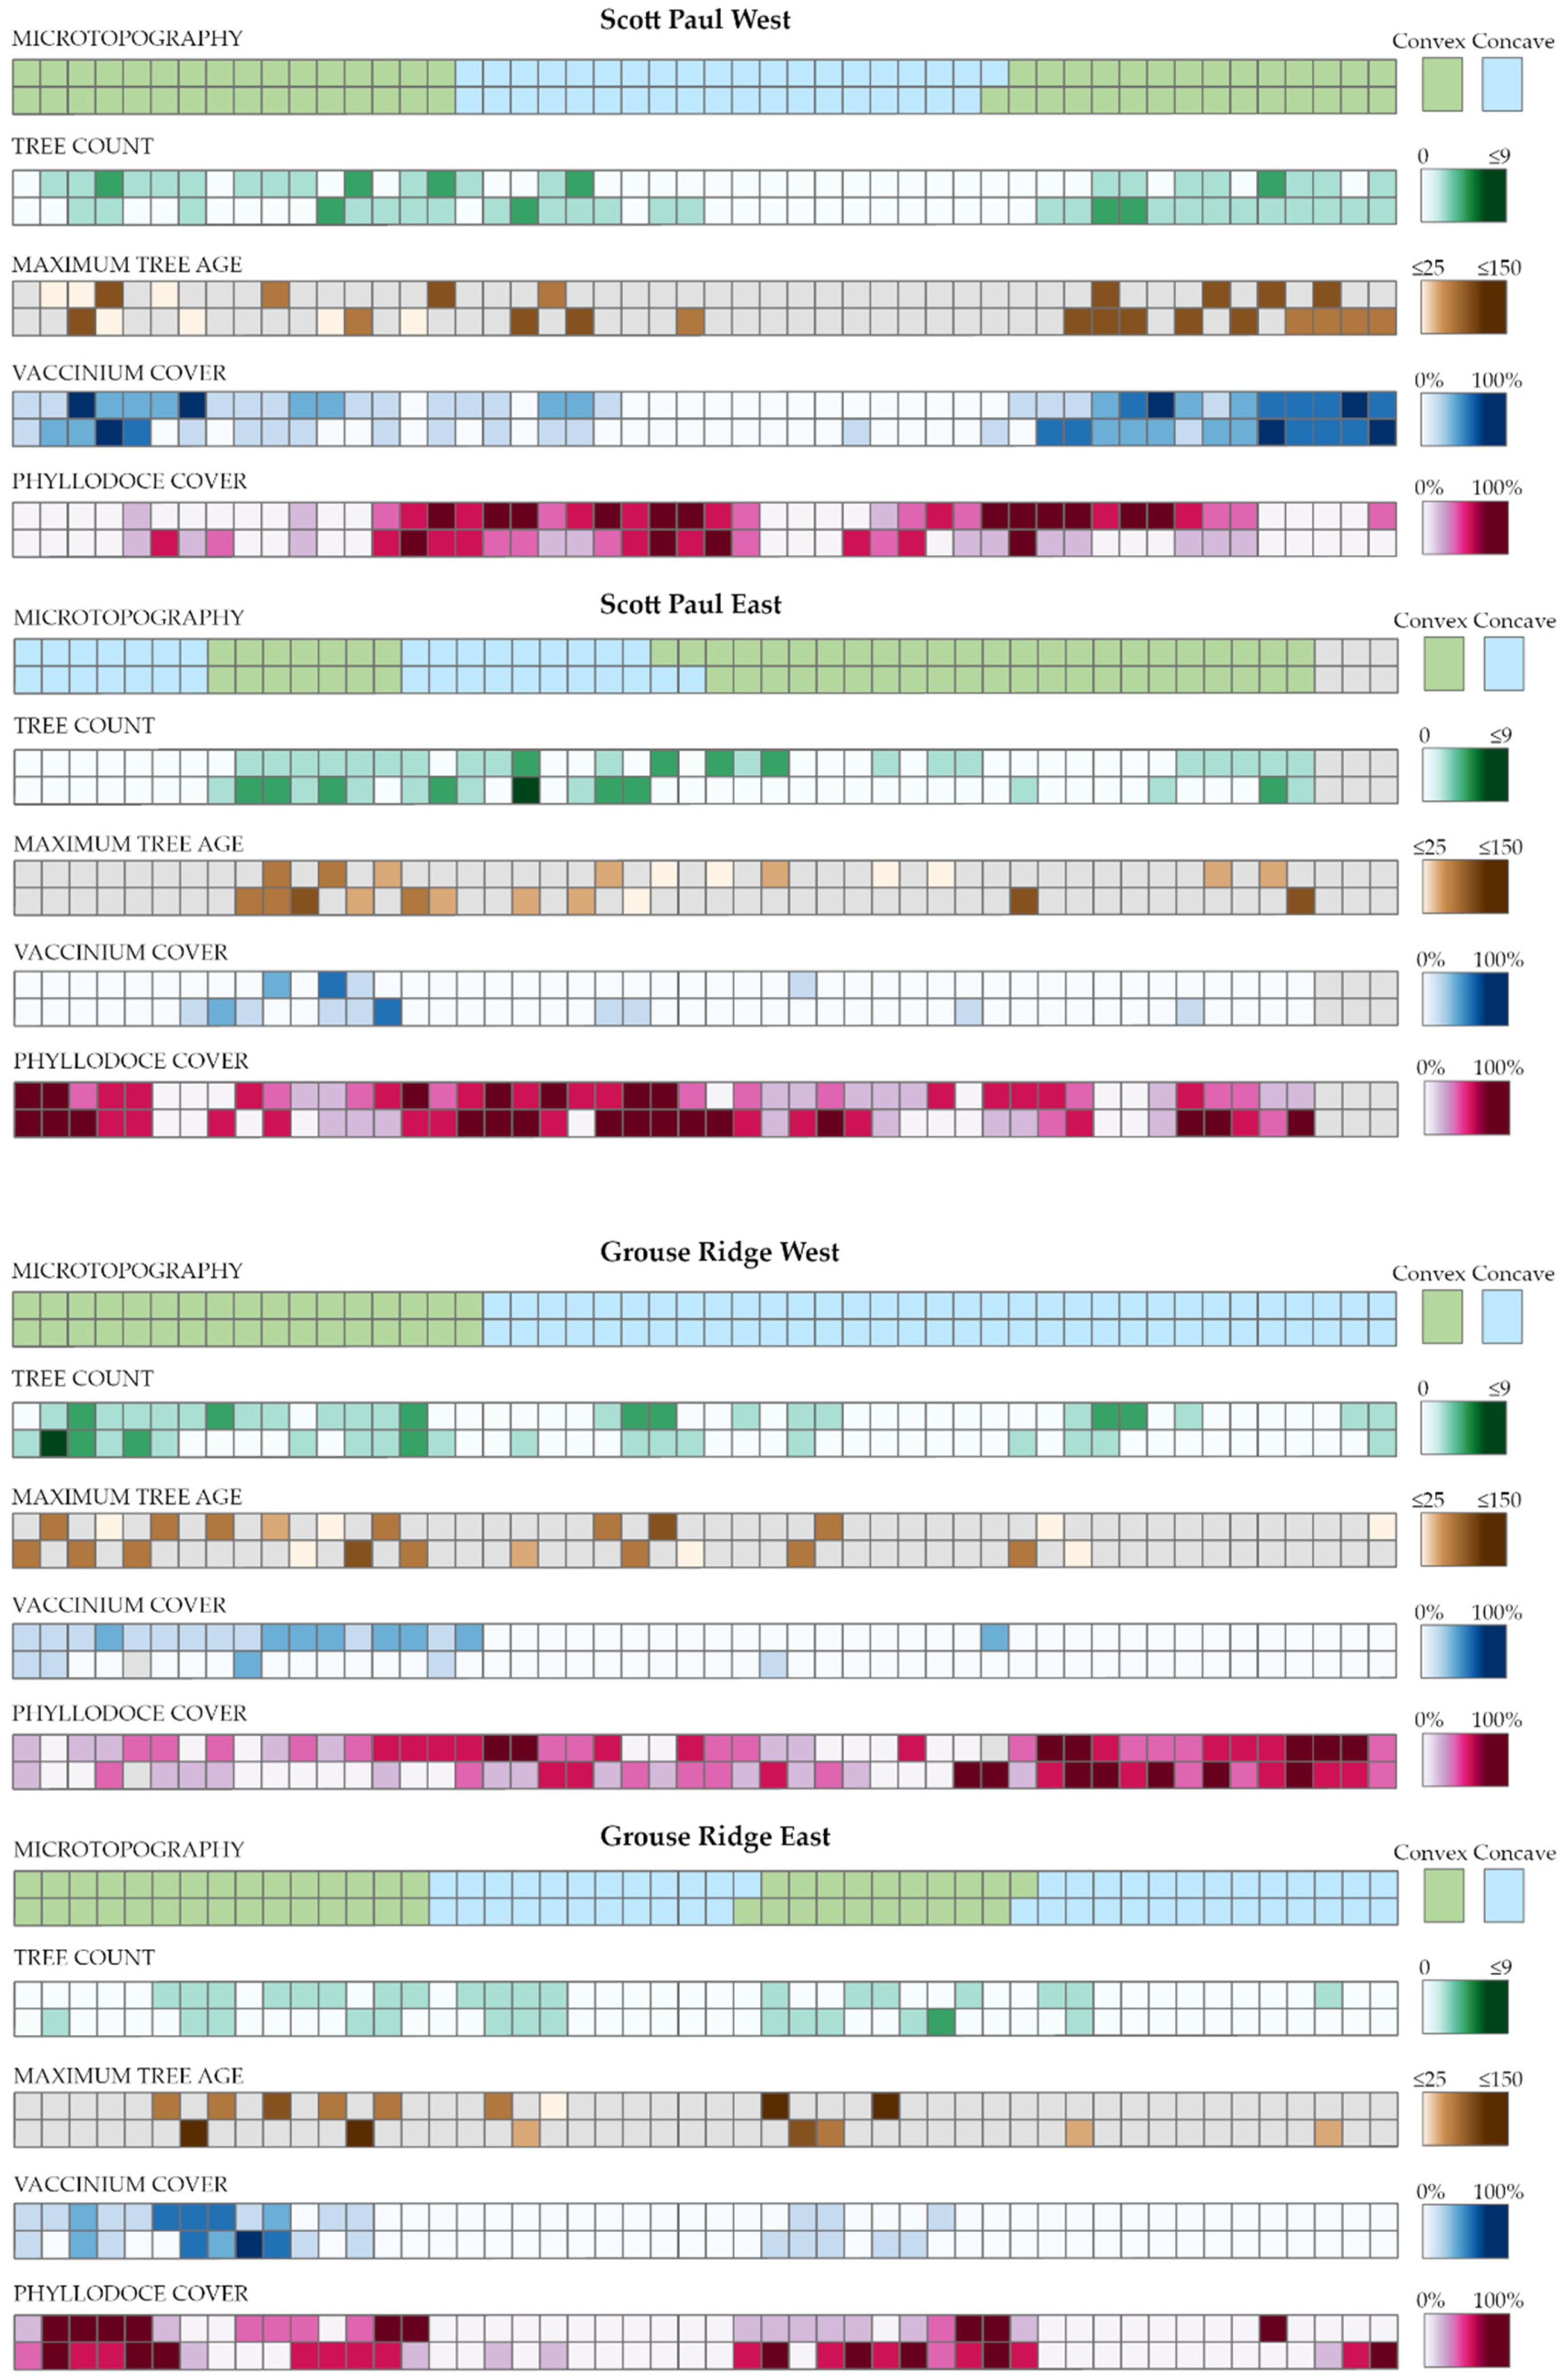
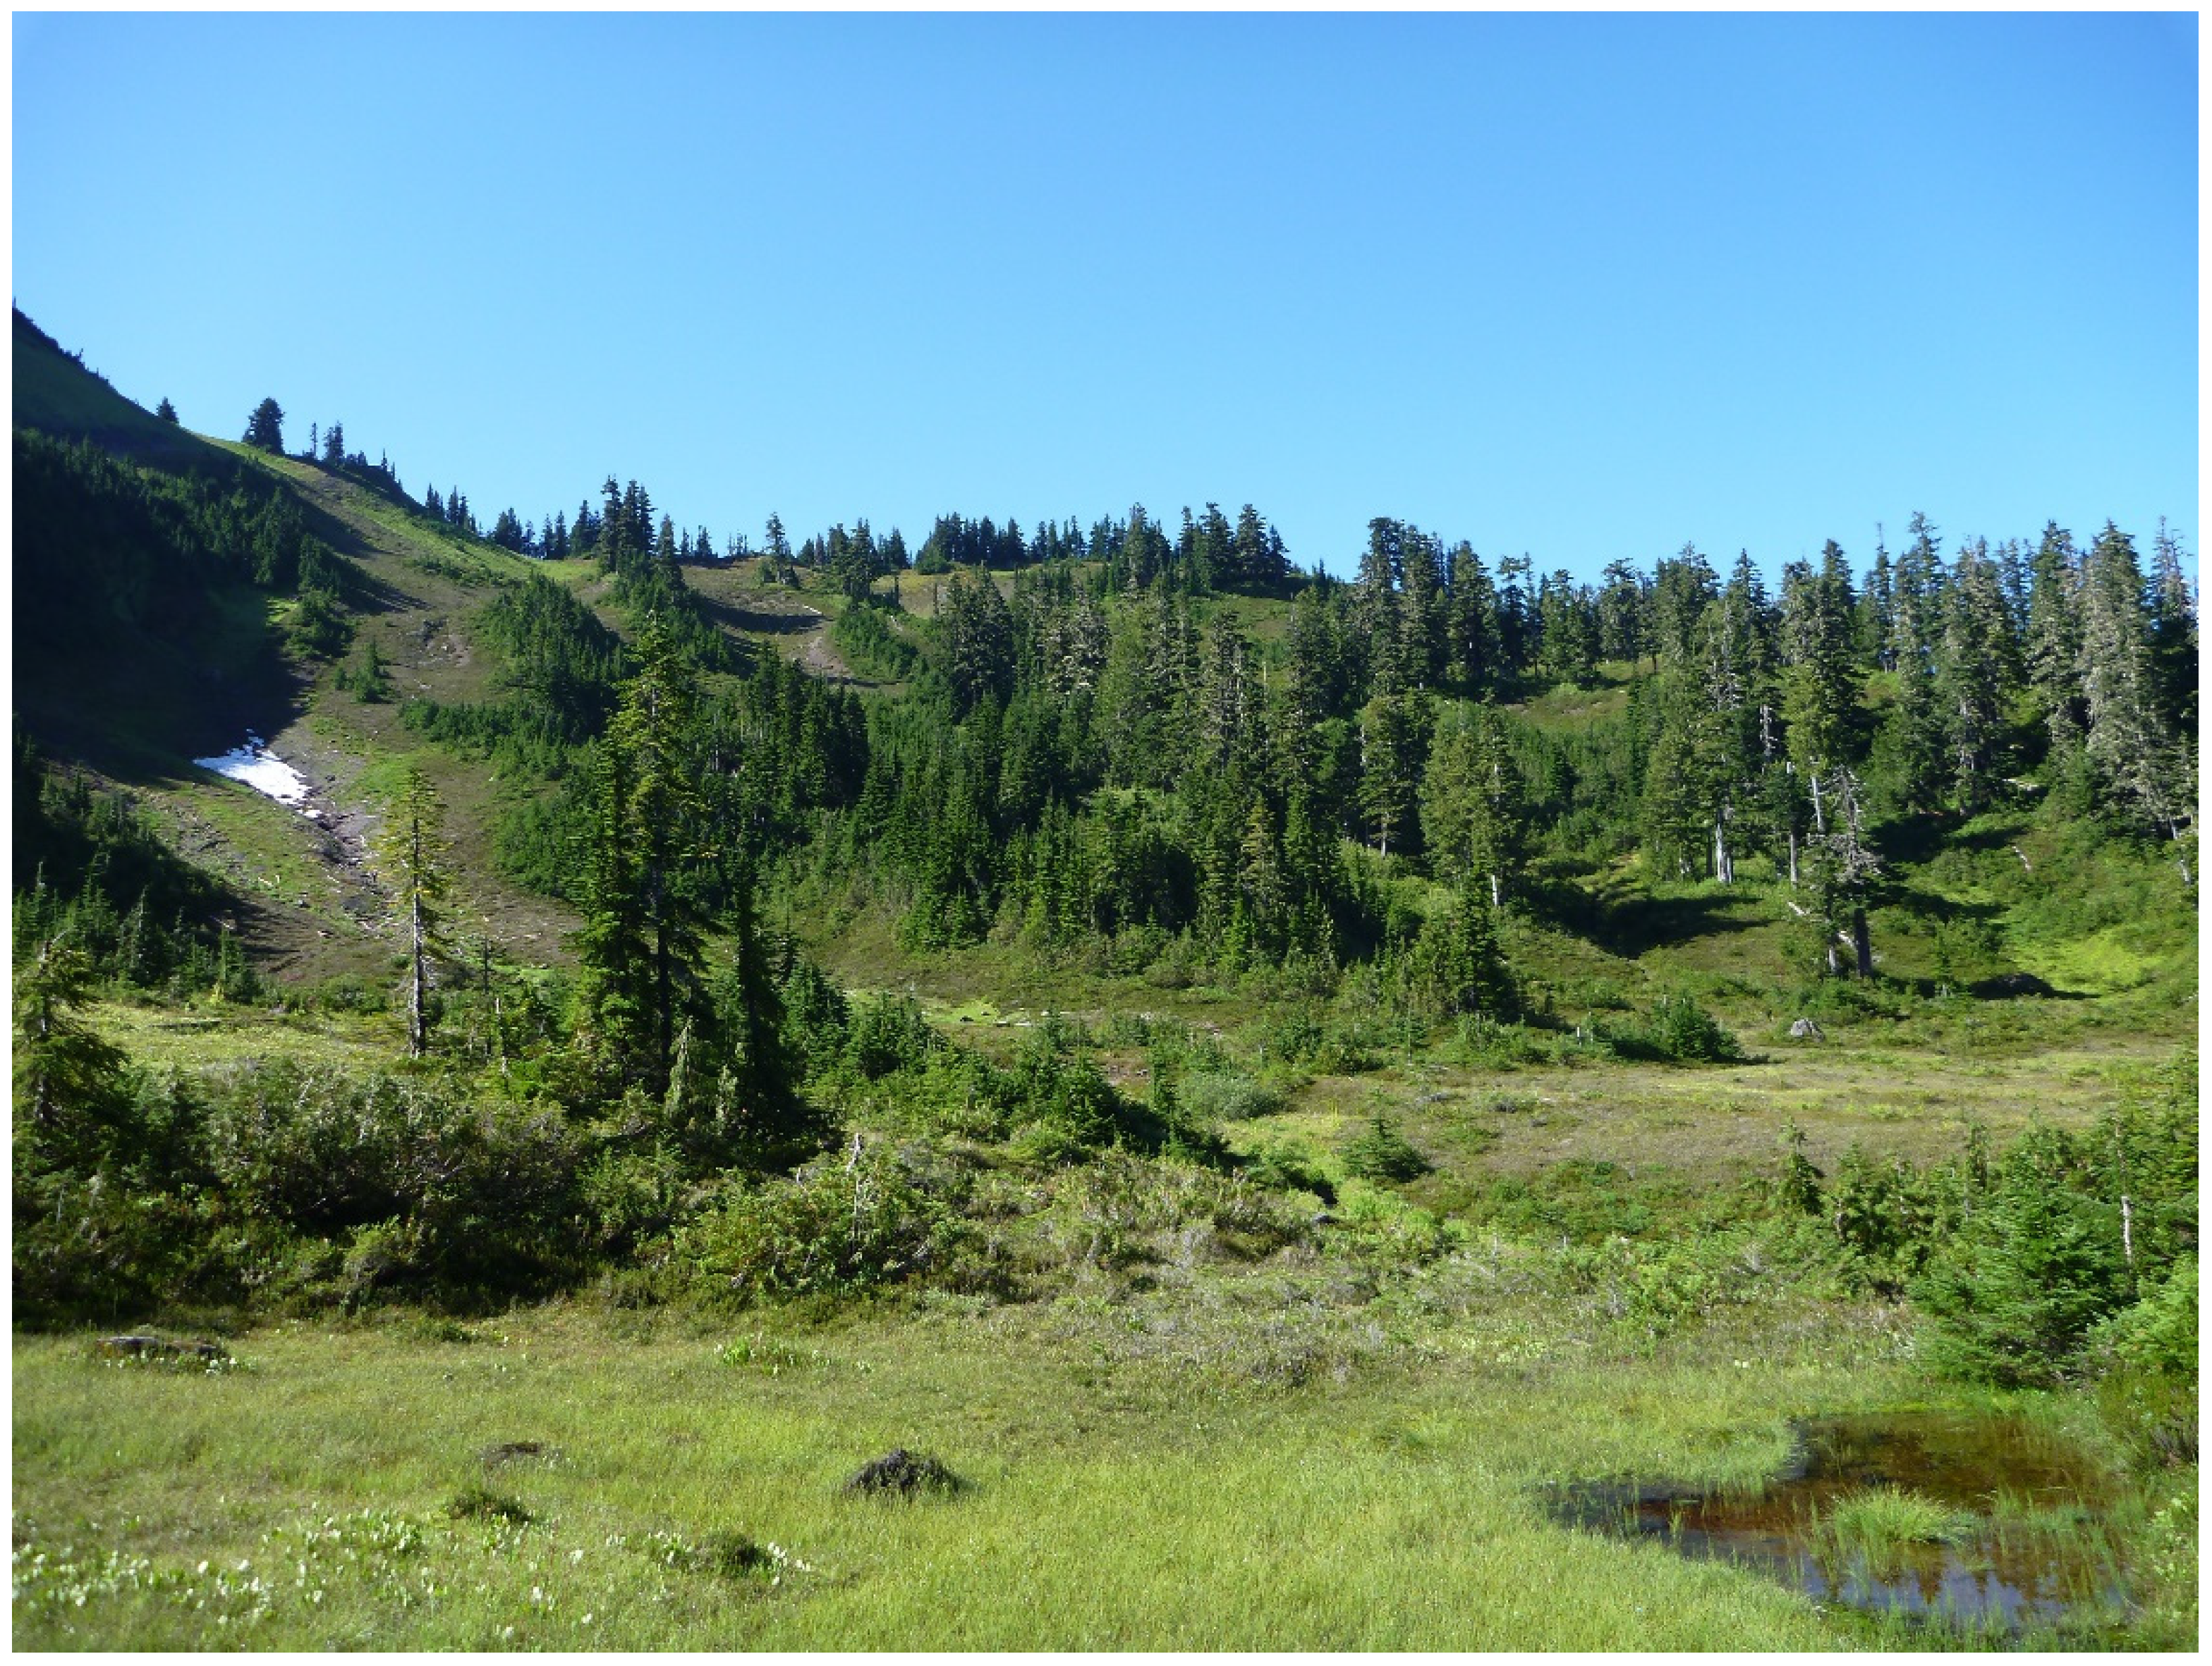
Figure A1.
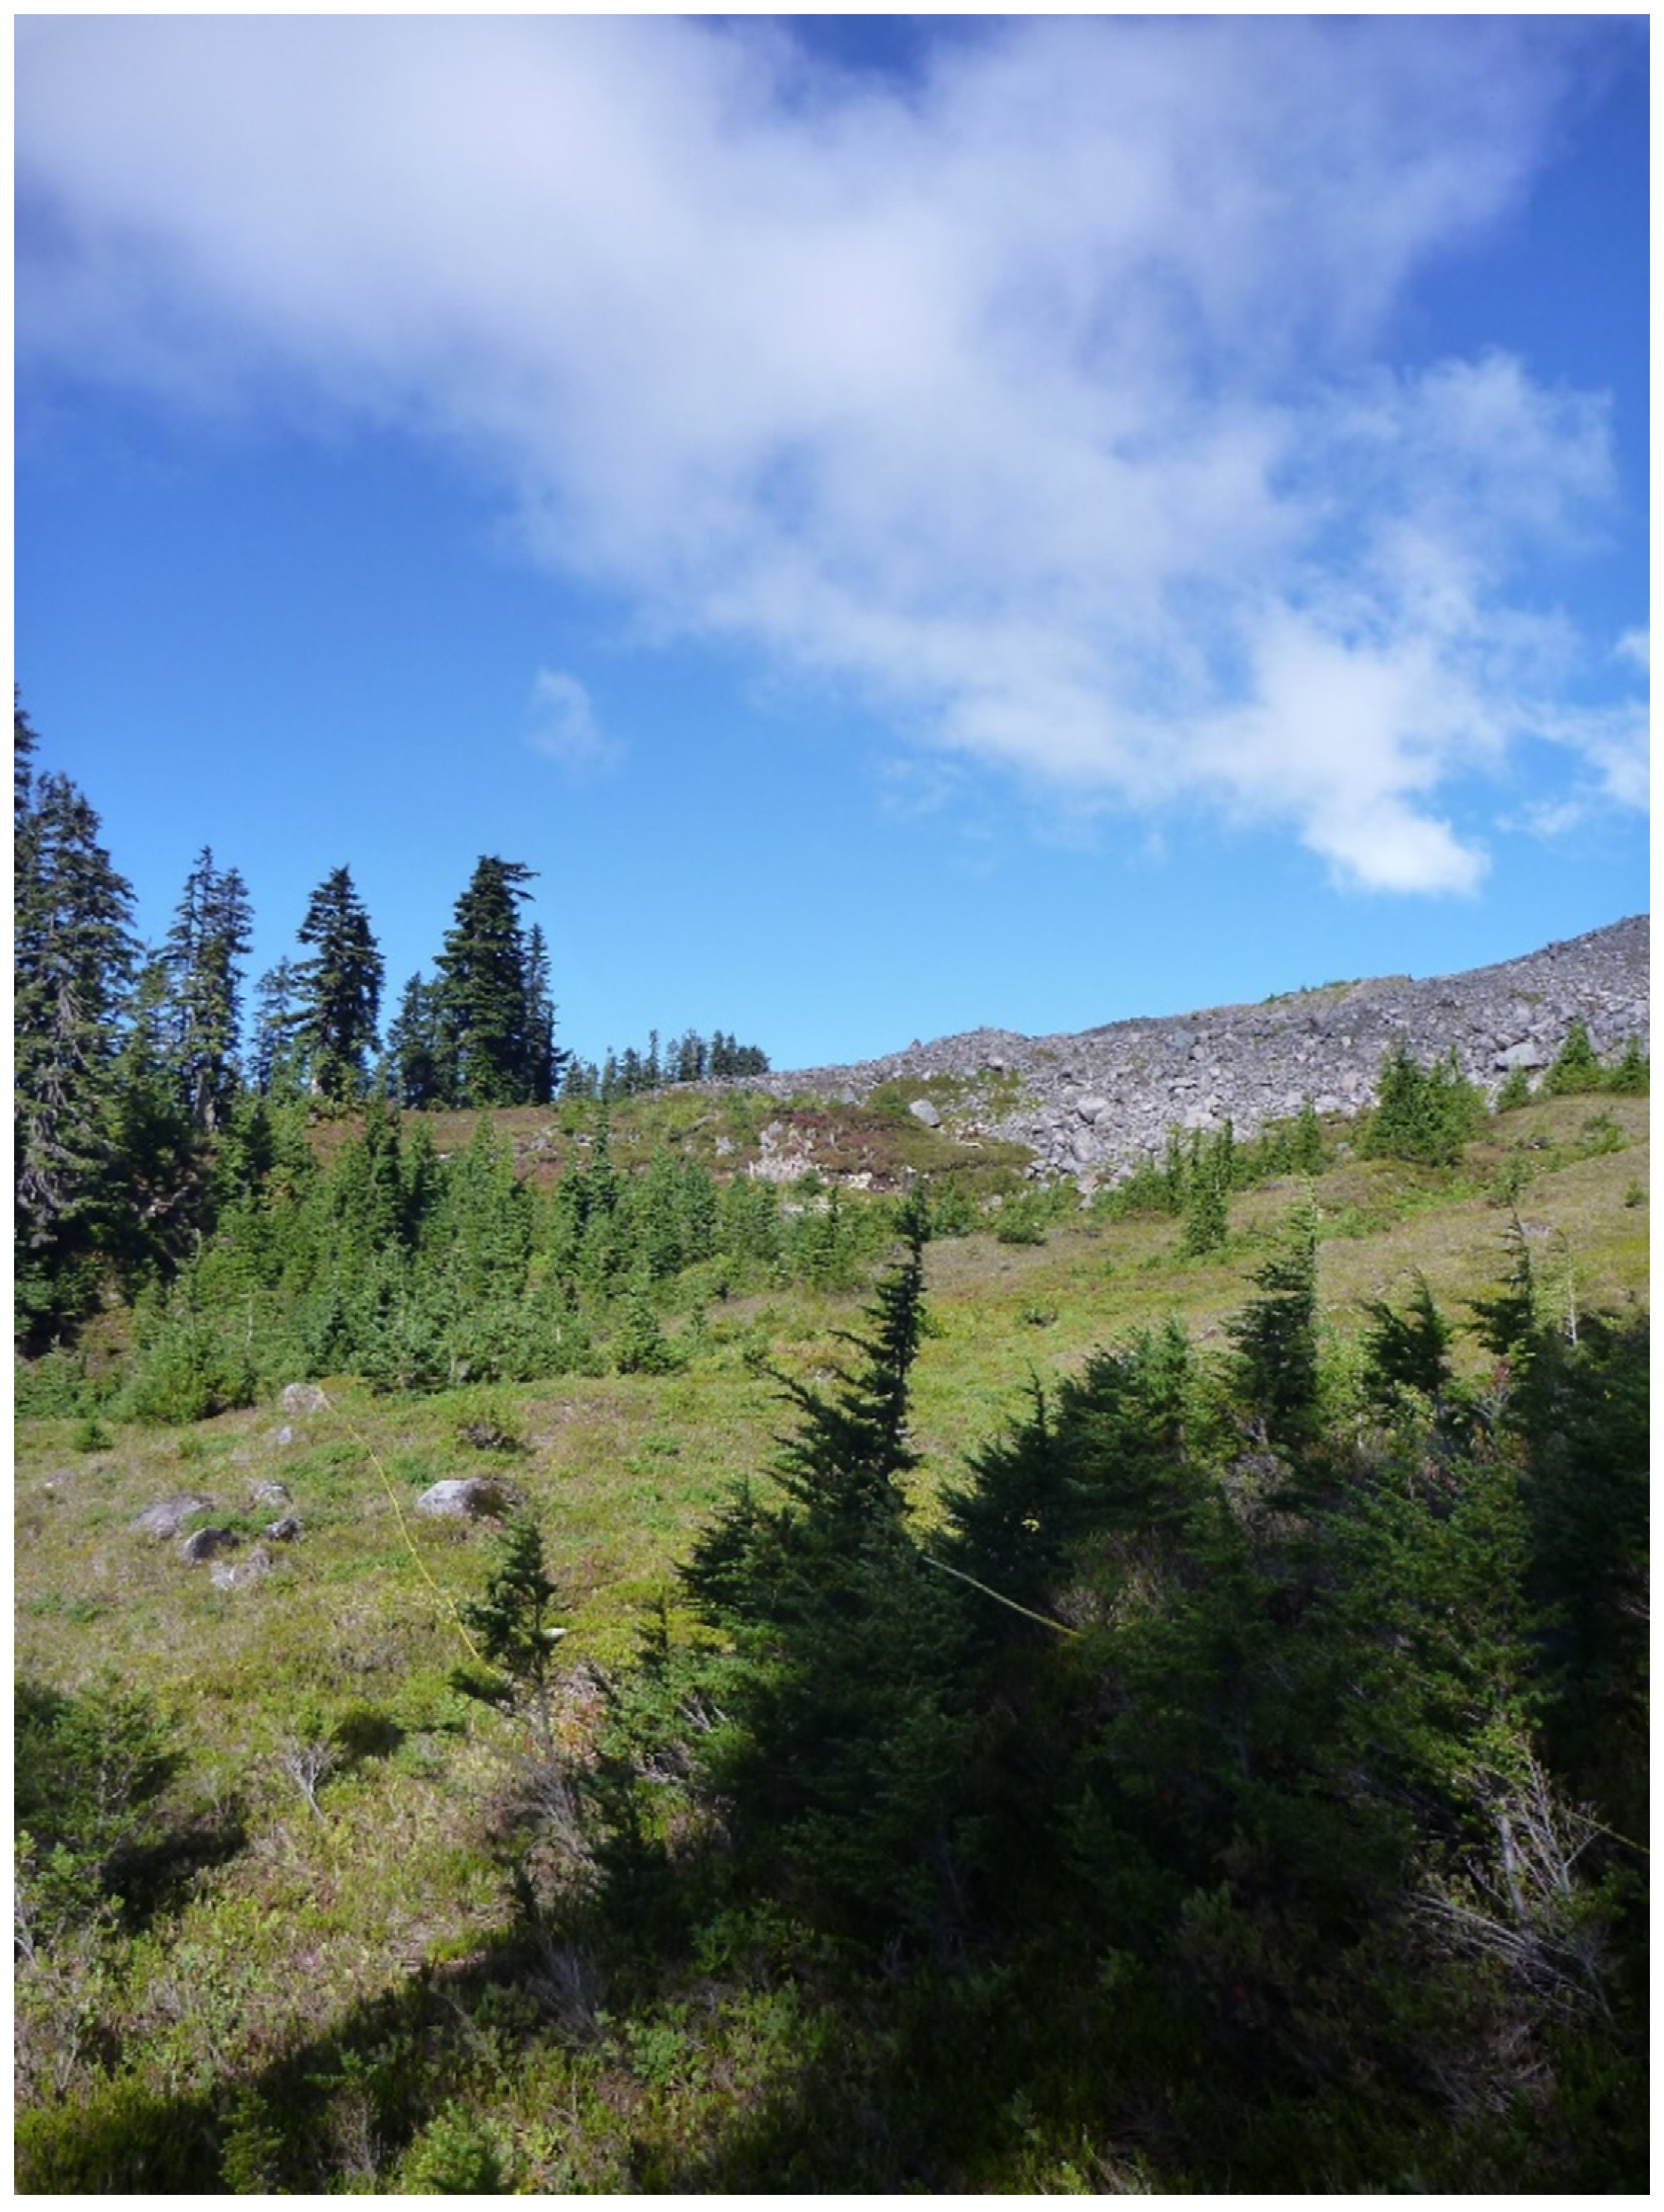
Scott Paul East transect crosses a meadow directly below end moraines Squak glacier.
Figure A1.
Scott Paul East transect crosses a meadow directly below end moraines Squak glacier.
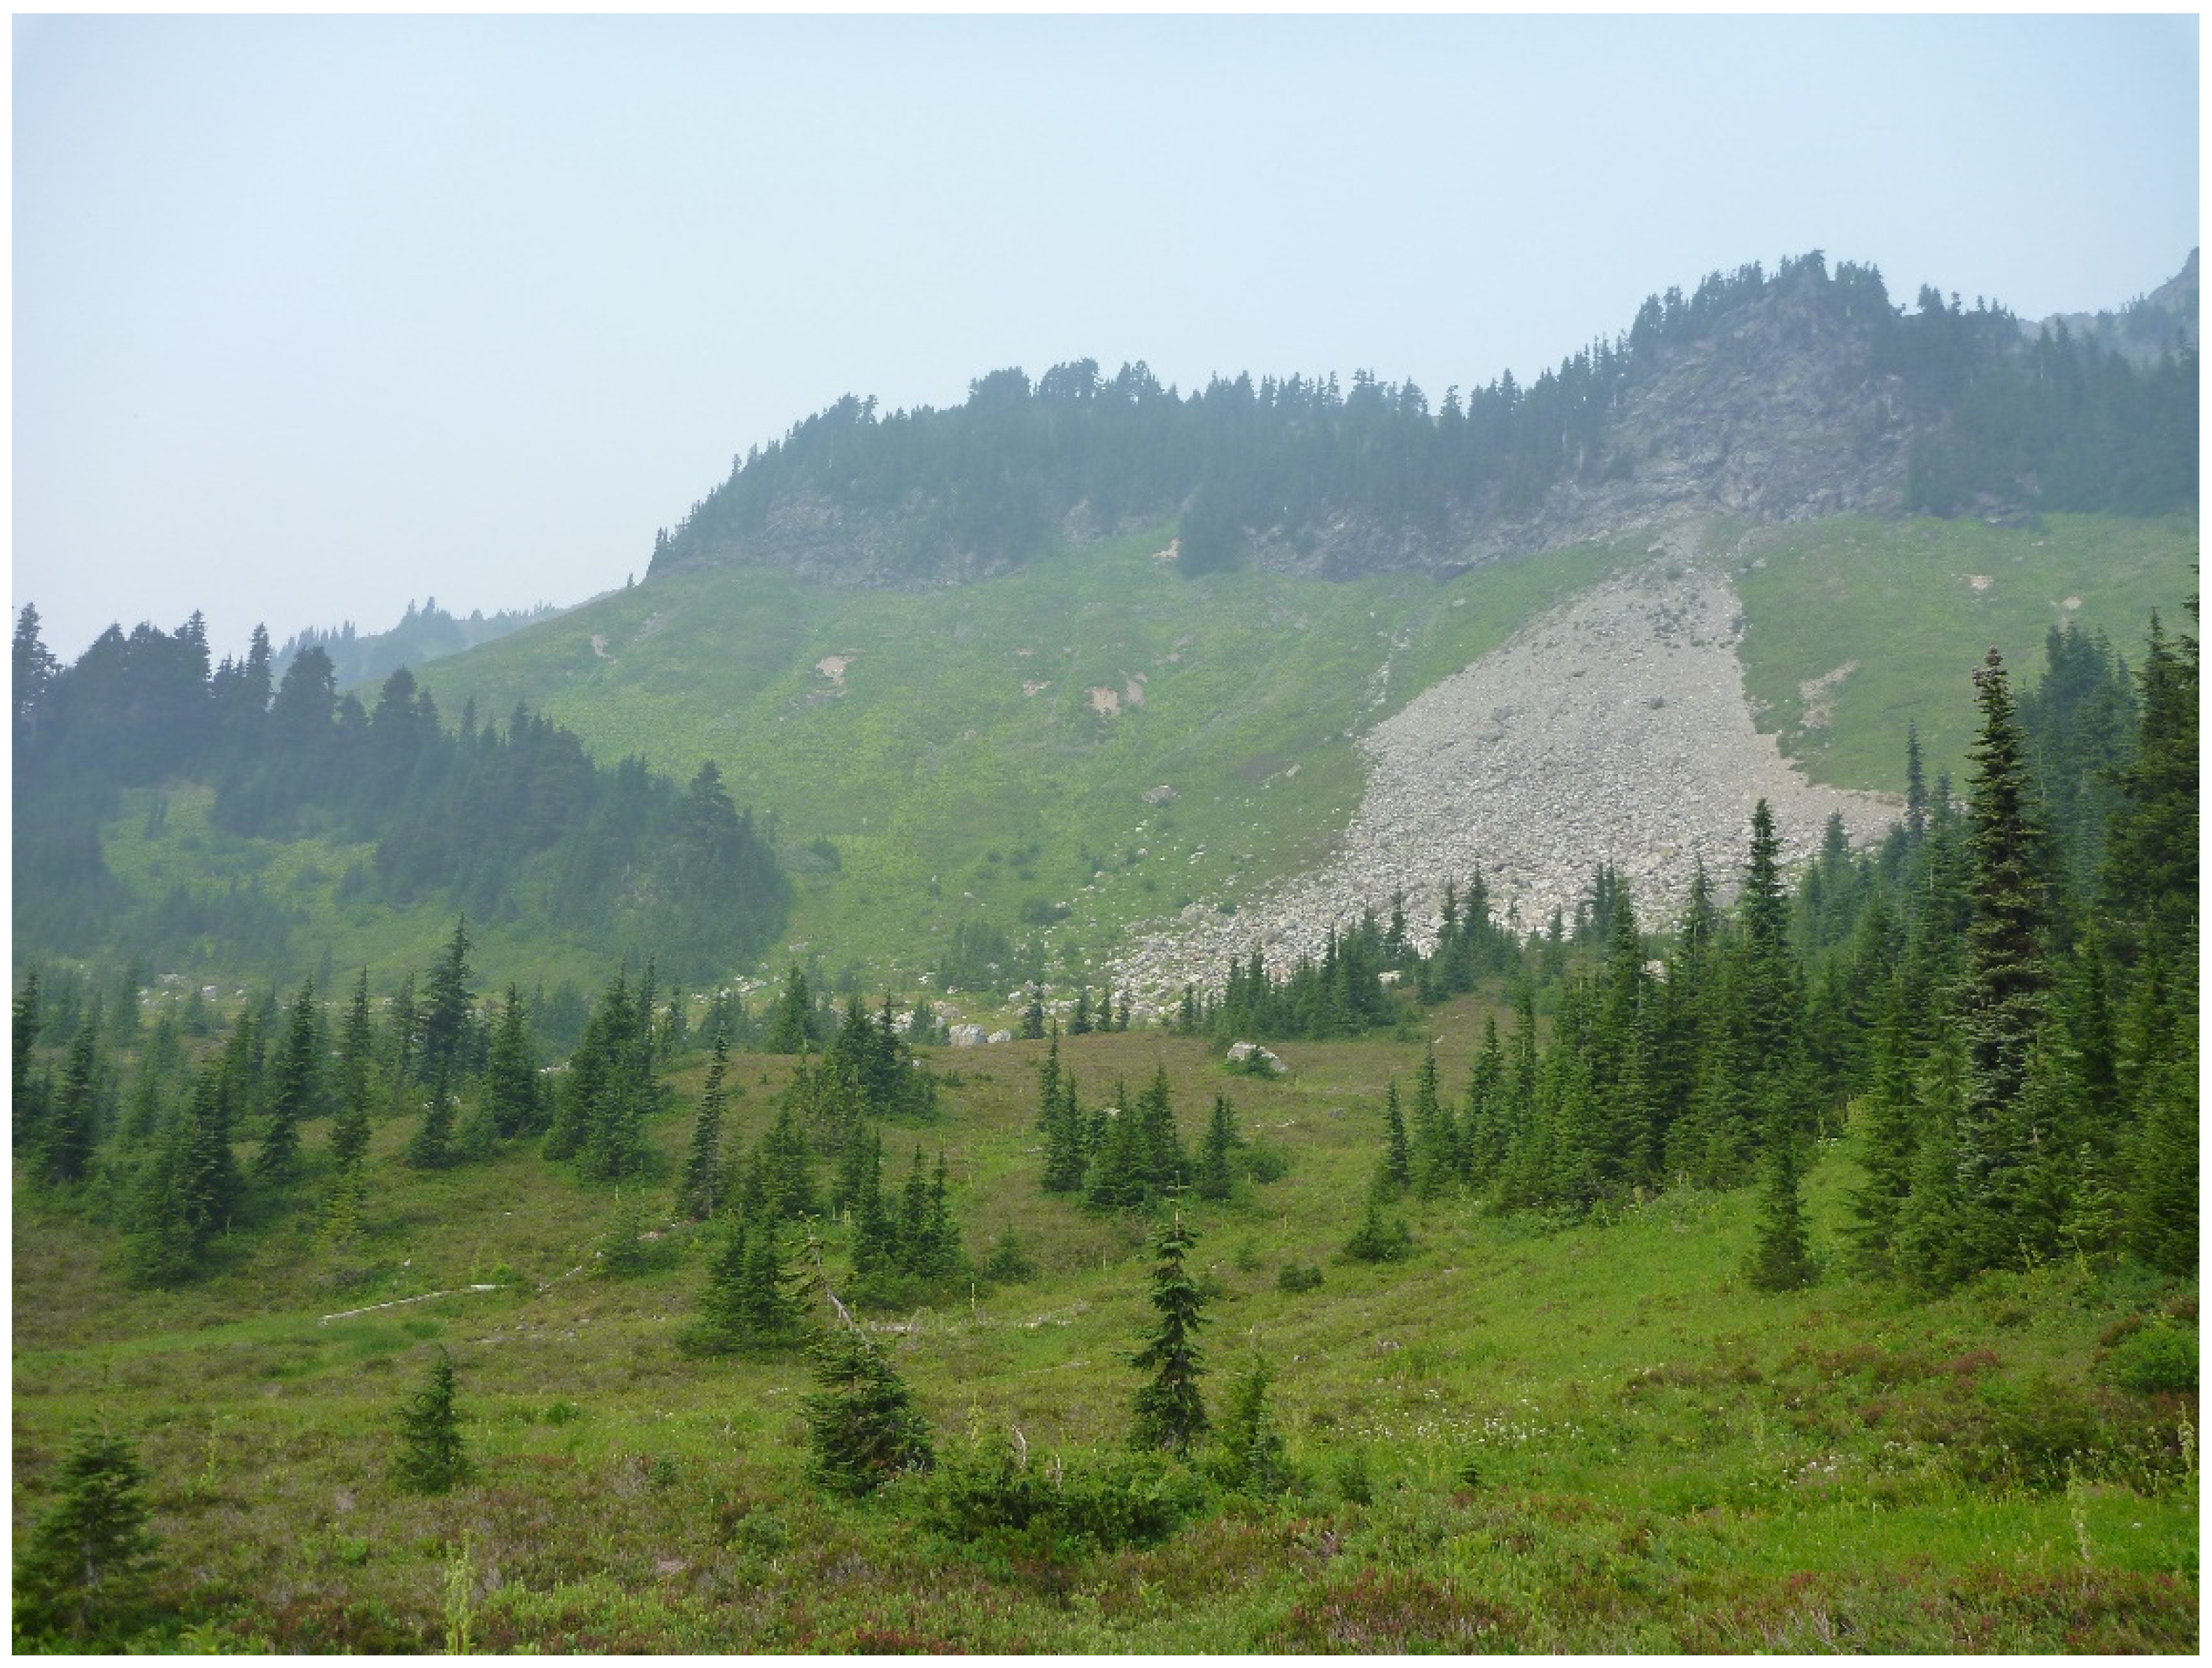
Figure A2.
The Grouse Ridge site sits at the head of a glacially carved valley.
Figure A2.
The Grouse Ridge site sits at the head of a glacially carved valley.
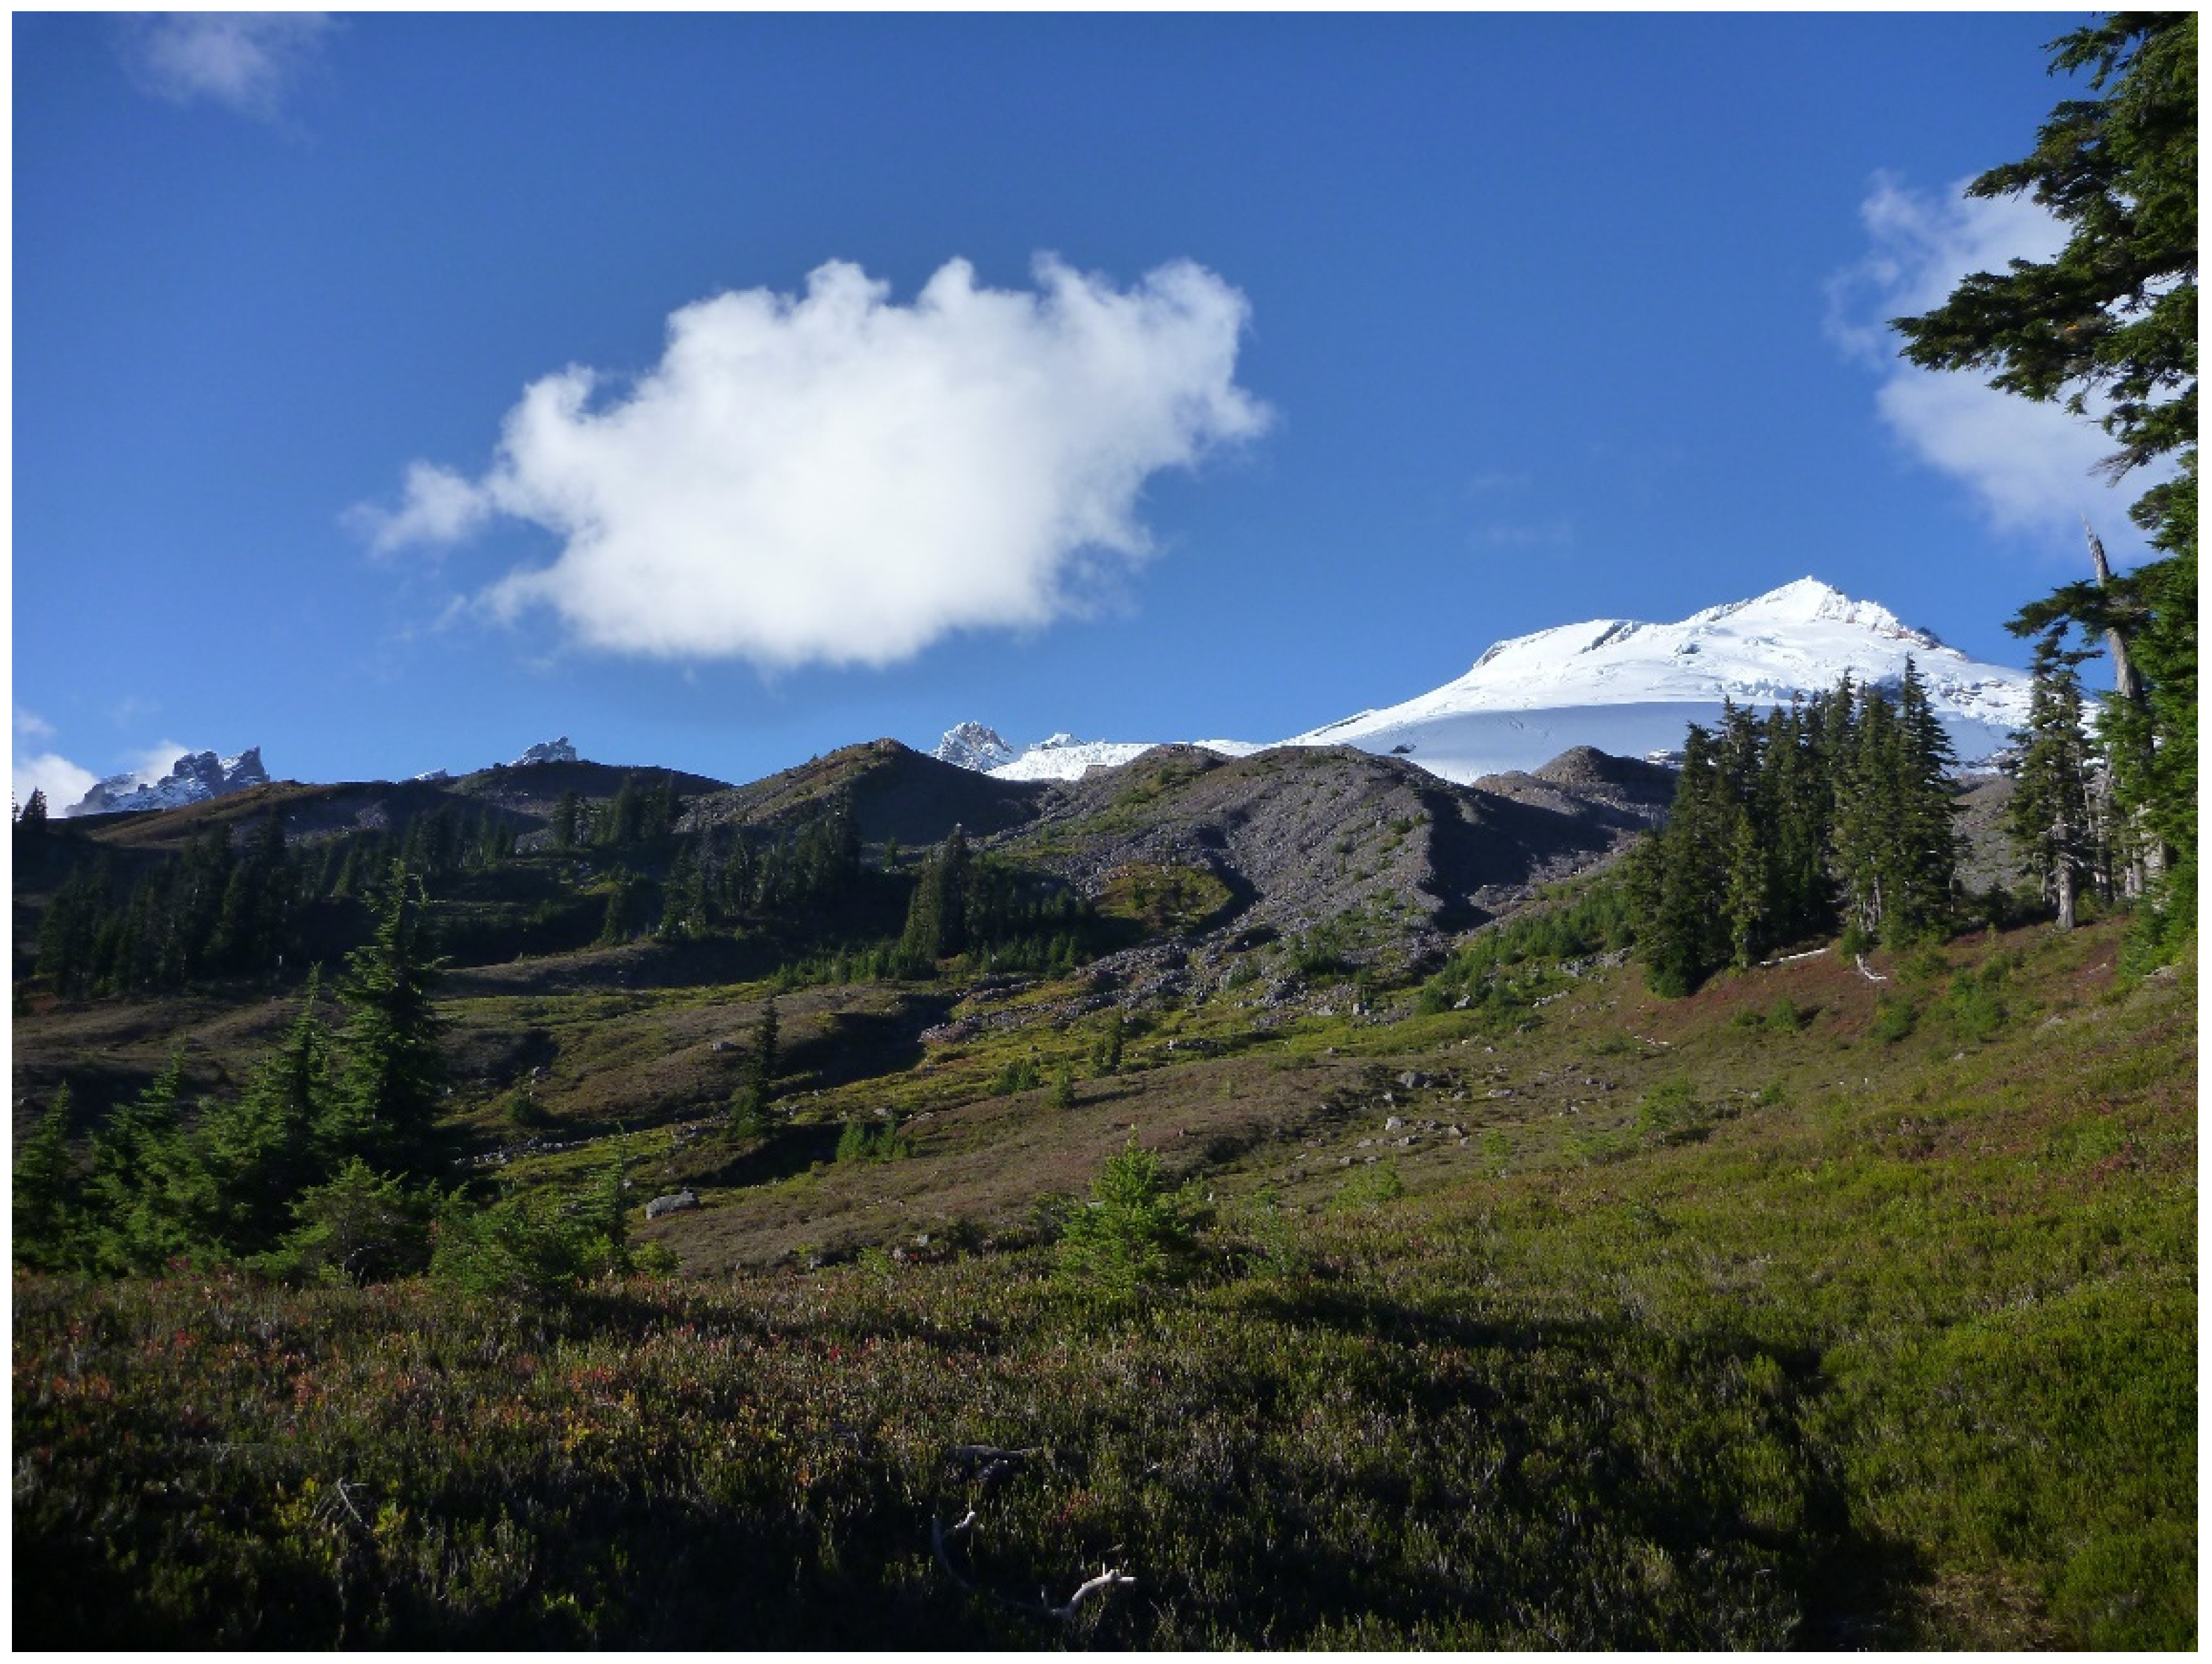
Figure A3.
A recent mass wasting event just above a meadow near our study sites.
Figure A3.
A recent mass wasting event just above a meadow near our study sites.
Figure A4.
End moraines above the Scott Paul site and the uneven terrain below them left by previous mass wasting events.
Figure A4.
End moraines above the Scott Paul site and the uneven terrain below them left by previous mass wasting events.
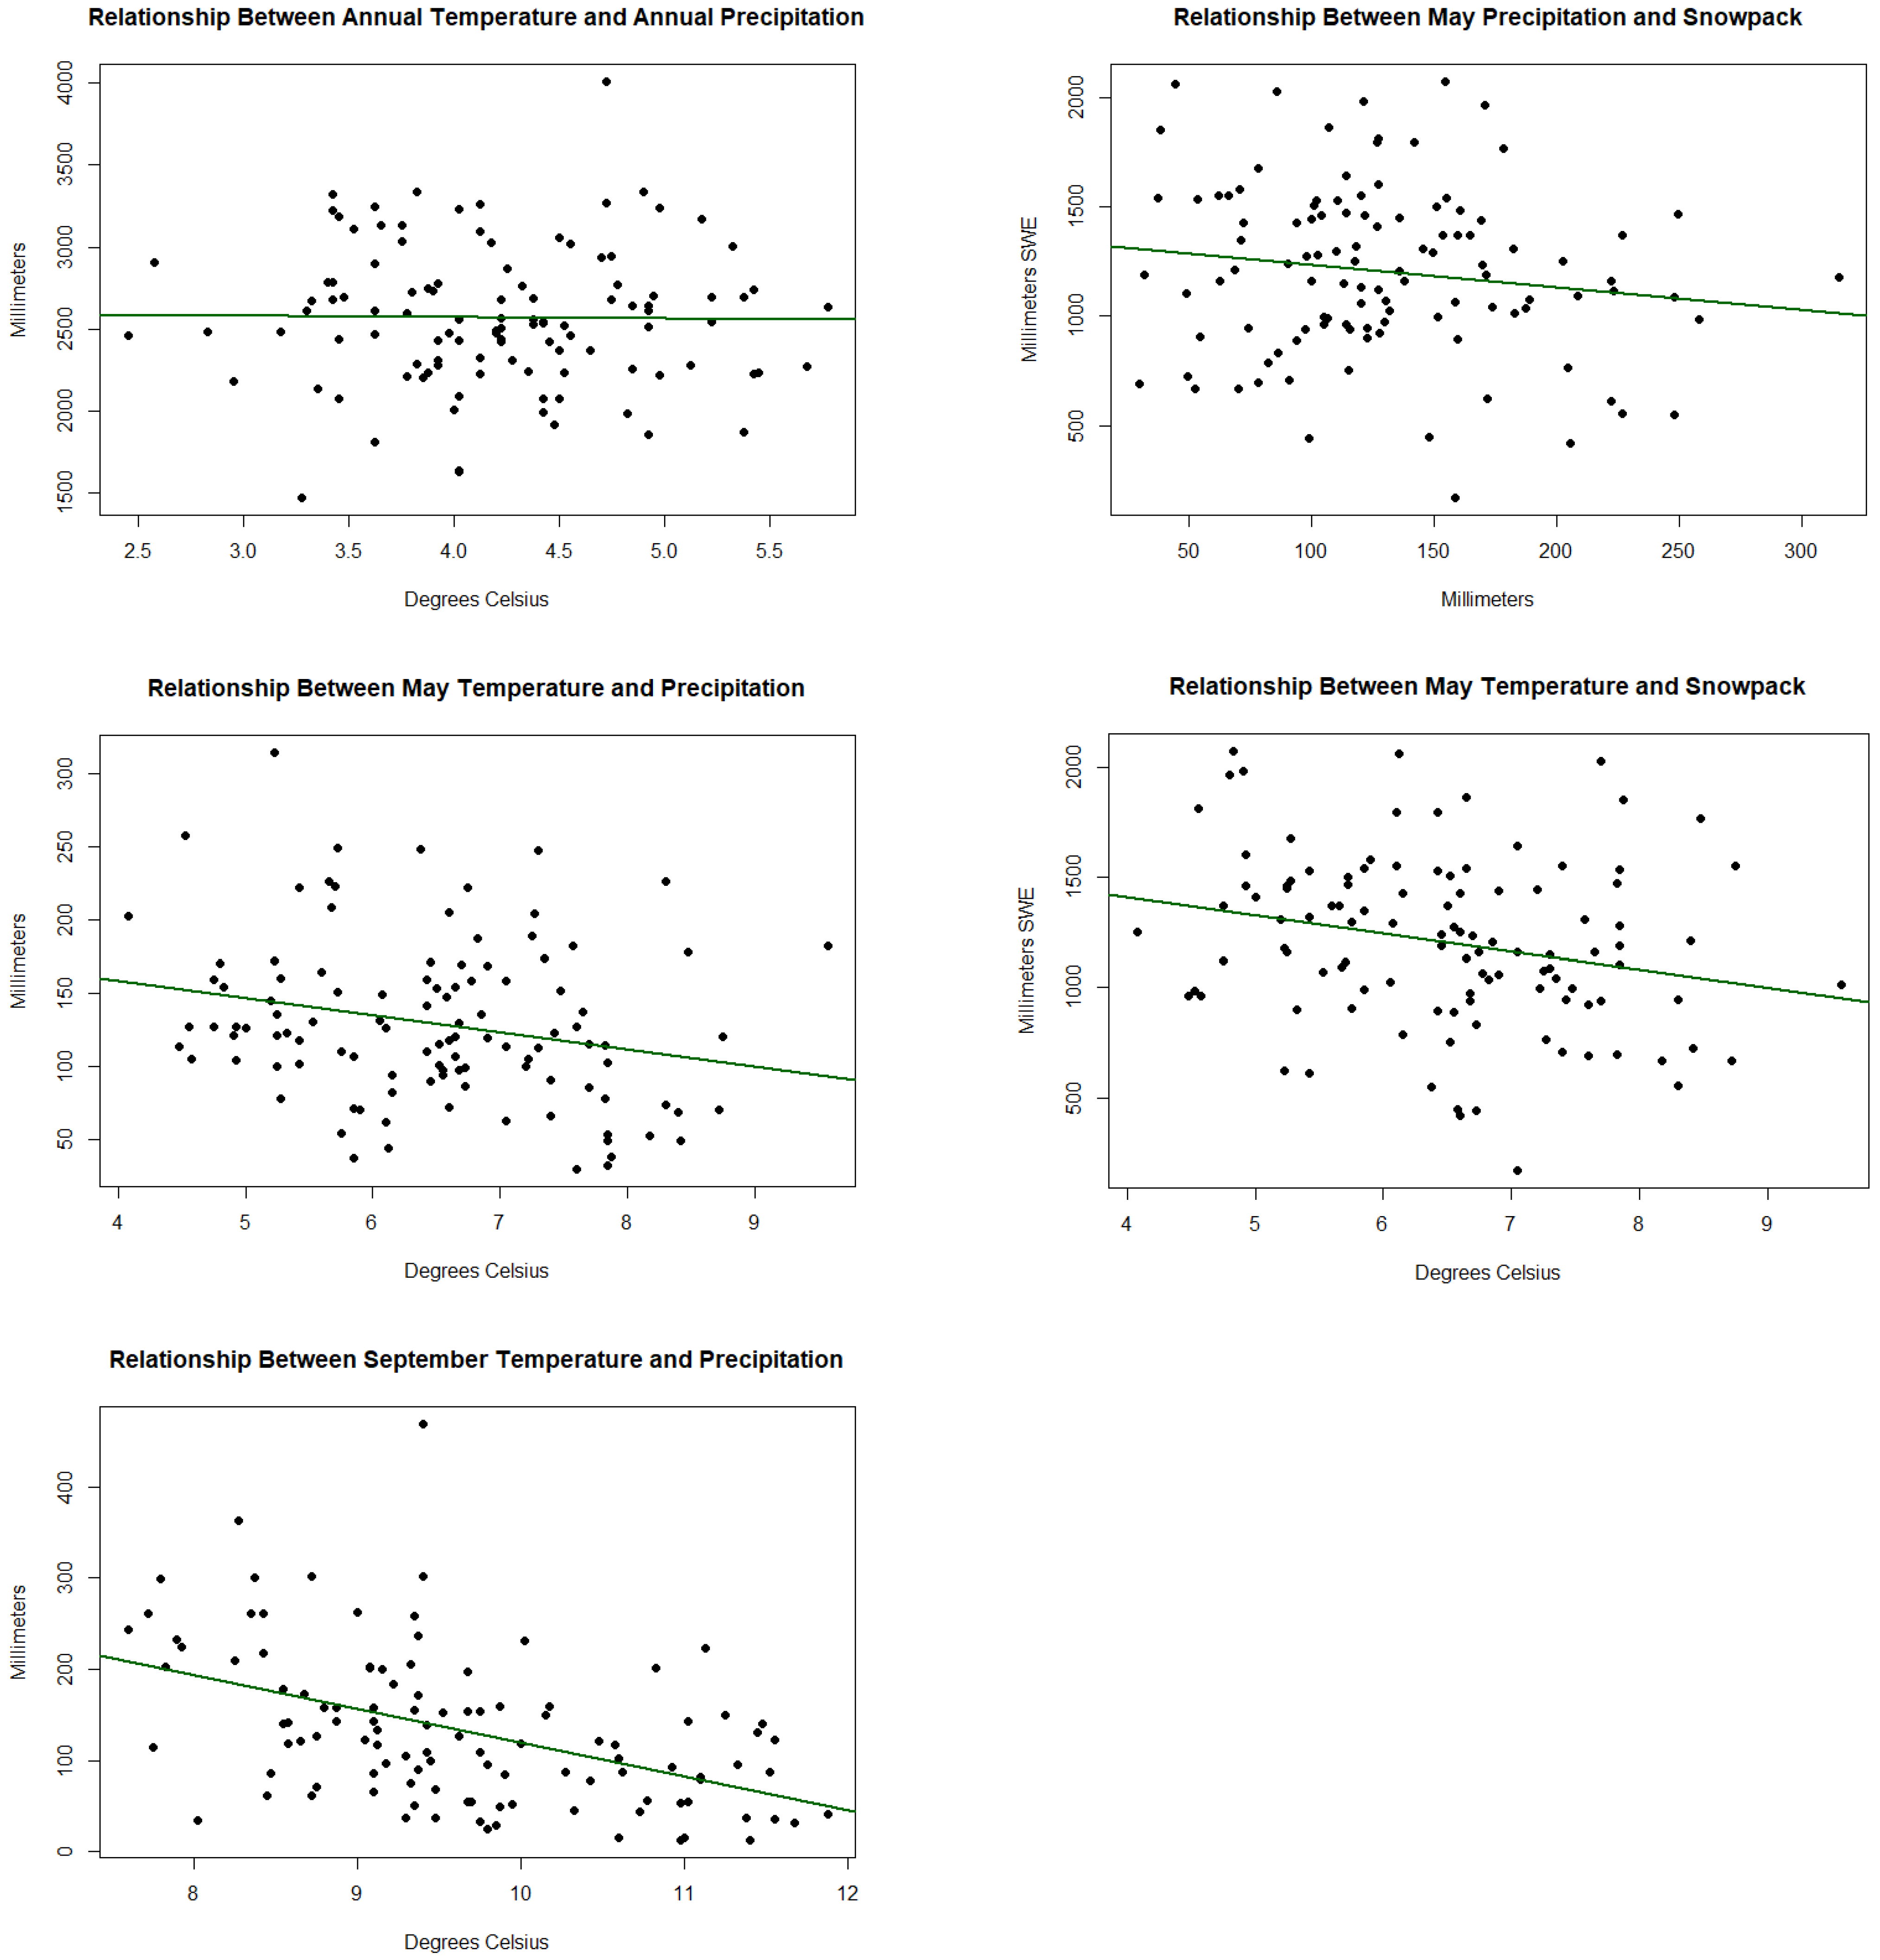
Figure A5.
Shows the correlations between different climate variables.
Figure A5.
Shows the correlations between different climate variables.
Table A1.
Shows the values for the correlations shown in
Figure A5.
Table A1.
Shows the values for the correlations shown in
Figure A5.
| Climate Variable Correlations | T-Score | Degrees of Freedom | p-Value | R |
|---|
| MAT and MAP | −0.165 | 108 | 0.869 | −0.016 |
| May Temp and Precip | −2.556 | 108 | 0.012 | −2.388 |
| September Temp and Precip | −5.537 | 108 | 2.182 × 10⁻⁷ | −0.470 |
| May Precip and Snowpack | −1.543 | 108 | 0.1257 | −0.147 |
| May Temp and Snowpack | −2.58 | 108 | 0.011 | −0.241 |
Table A2.
Shows consistently significant p-values for the Shapiro-Wilkes test, which indicates that data is not normally distributed.
Table A2.
Shows consistently significant p-values for the Shapiro-Wilkes test, which indicates that data is not normally distributed.
Shapiro Test
p-Values | | | | | | | |
|---|
| | Phylo. | Vacc. | Lupinus | TSME | ABAM | CANO | All Trees |
| GRW18 | 0.001 | 5.73 × 10⁻¹⁰ | NA | <2.2 × 10⁻¹⁶ | 1.52 × 10⁻¹⁵ | <2.2 × 10⁻¹⁶ | 1.72 × 10⁻¹² |
| GRE18 | 3.87 × 10⁻⁸ | 6.61 × 10⁻¹⁰ | NA | <2.2 × 10⁻¹⁶ | <2.2 × 10⁻¹⁶ | <2.2 × 10⁻¹⁶ | 2.80 × 10⁻¹⁵ |
| SPW18 | 3.68 × 10⁻⁶ | 2.88 × 10⁻⁵ | NA | 1.35 × 10⁻¹² | <2.2 × 10⁻¹⁶ | NA | 9.64 × 10⁻¹¹ |
| SPE18 | 3.98 × 10⁻⁵ | 6.00 × 10⁻¹⁰ | 4.99 × 10⁻¹¹ | 1.45 × 10⁻¹² | <2.2 × 10⁻¹⁶ | NA | 4.27 × 10⁻¹² |
Table A3.
Shows consistently significant p-values for the Fligner-Killeen test, which indicates that data is not homoscedastic.
Table A3.
Shows consistently significant p-values for the Fligner-Killeen test, which indicates that data is not homoscedastic.
Fligner Test
p-Values | | | | | | | |
|---|
| | Phylo. | Vacc. | Lupinus | TSME | ABAM | CANO | All Trees |
| | 0.007 | 1.02 × 10⁻¹⁰ | <2.2 × 10⁻¹⁶ | 7.01 × 10⁻⁷ | 1.25 × 10⁻⁸ | 3.98 × 10⁻¹⁰ | 0.0001 |
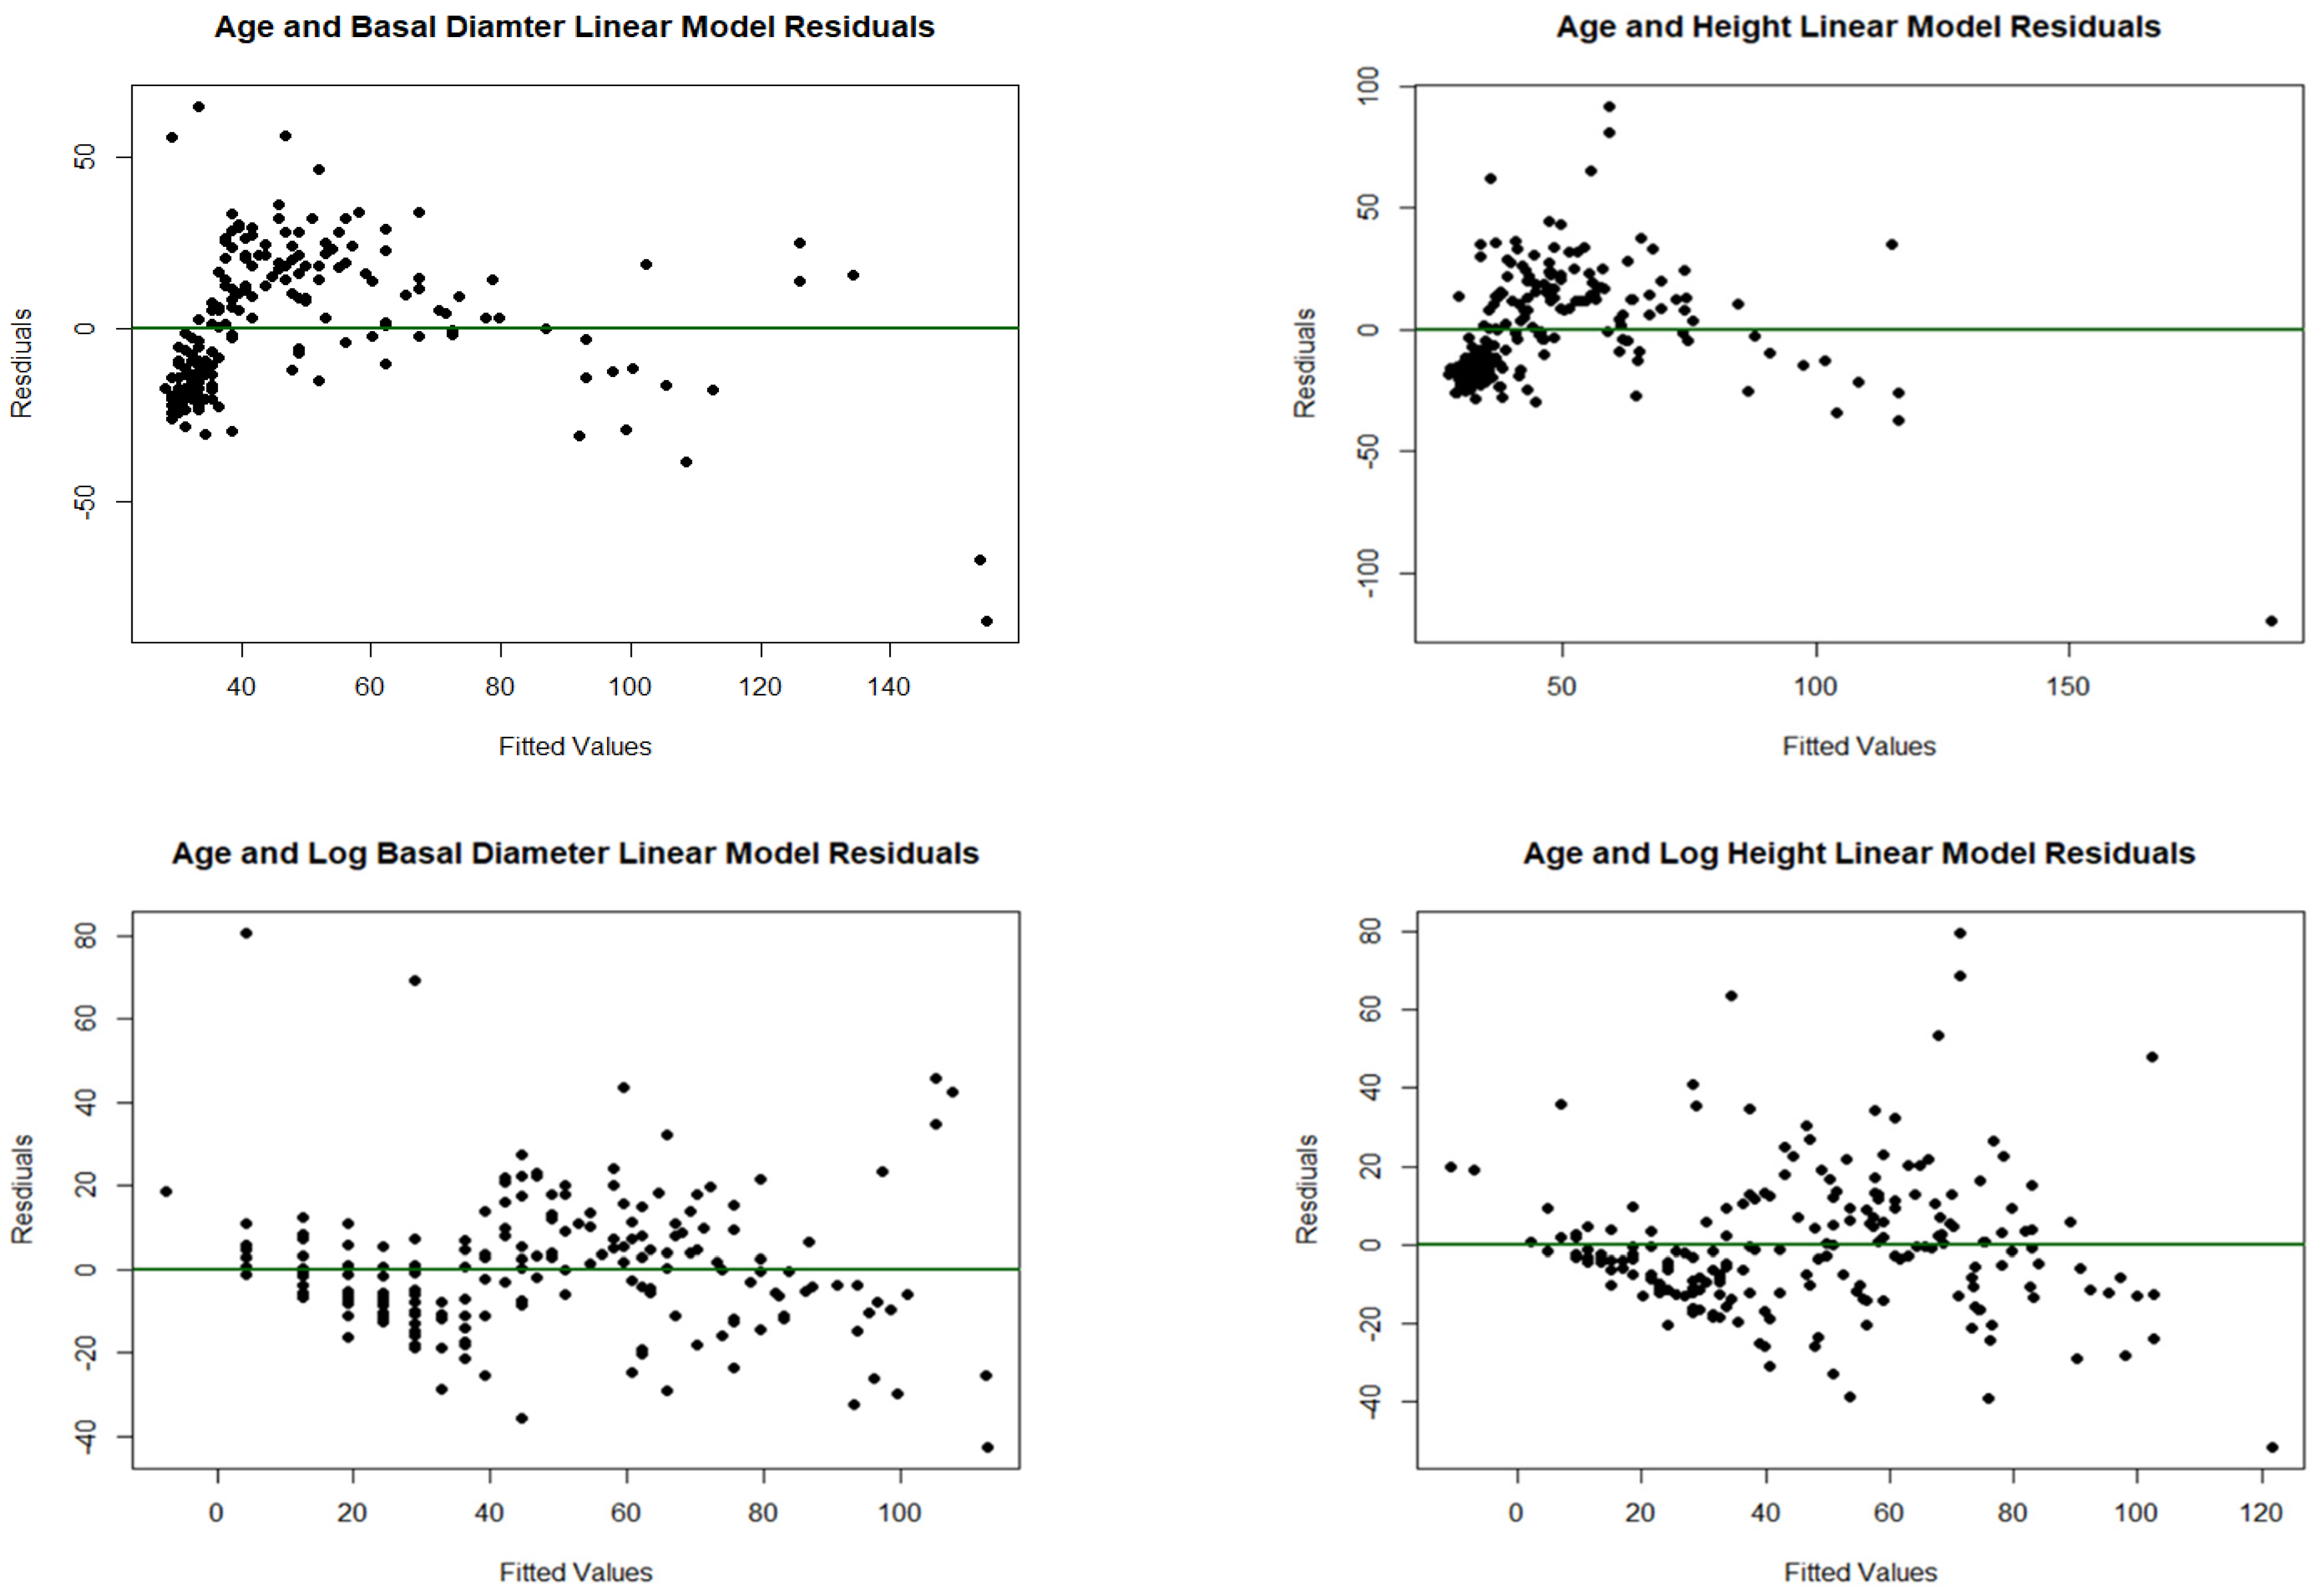
Figure A6.
Shows the difference between the transformed and untransformed residuals for linear models built to show the relationships between age and growth of trees.
Figure A6.
Shows the difference between the transformed and untransformed residuals for linear models built to show the relationships between age and growth of trees.
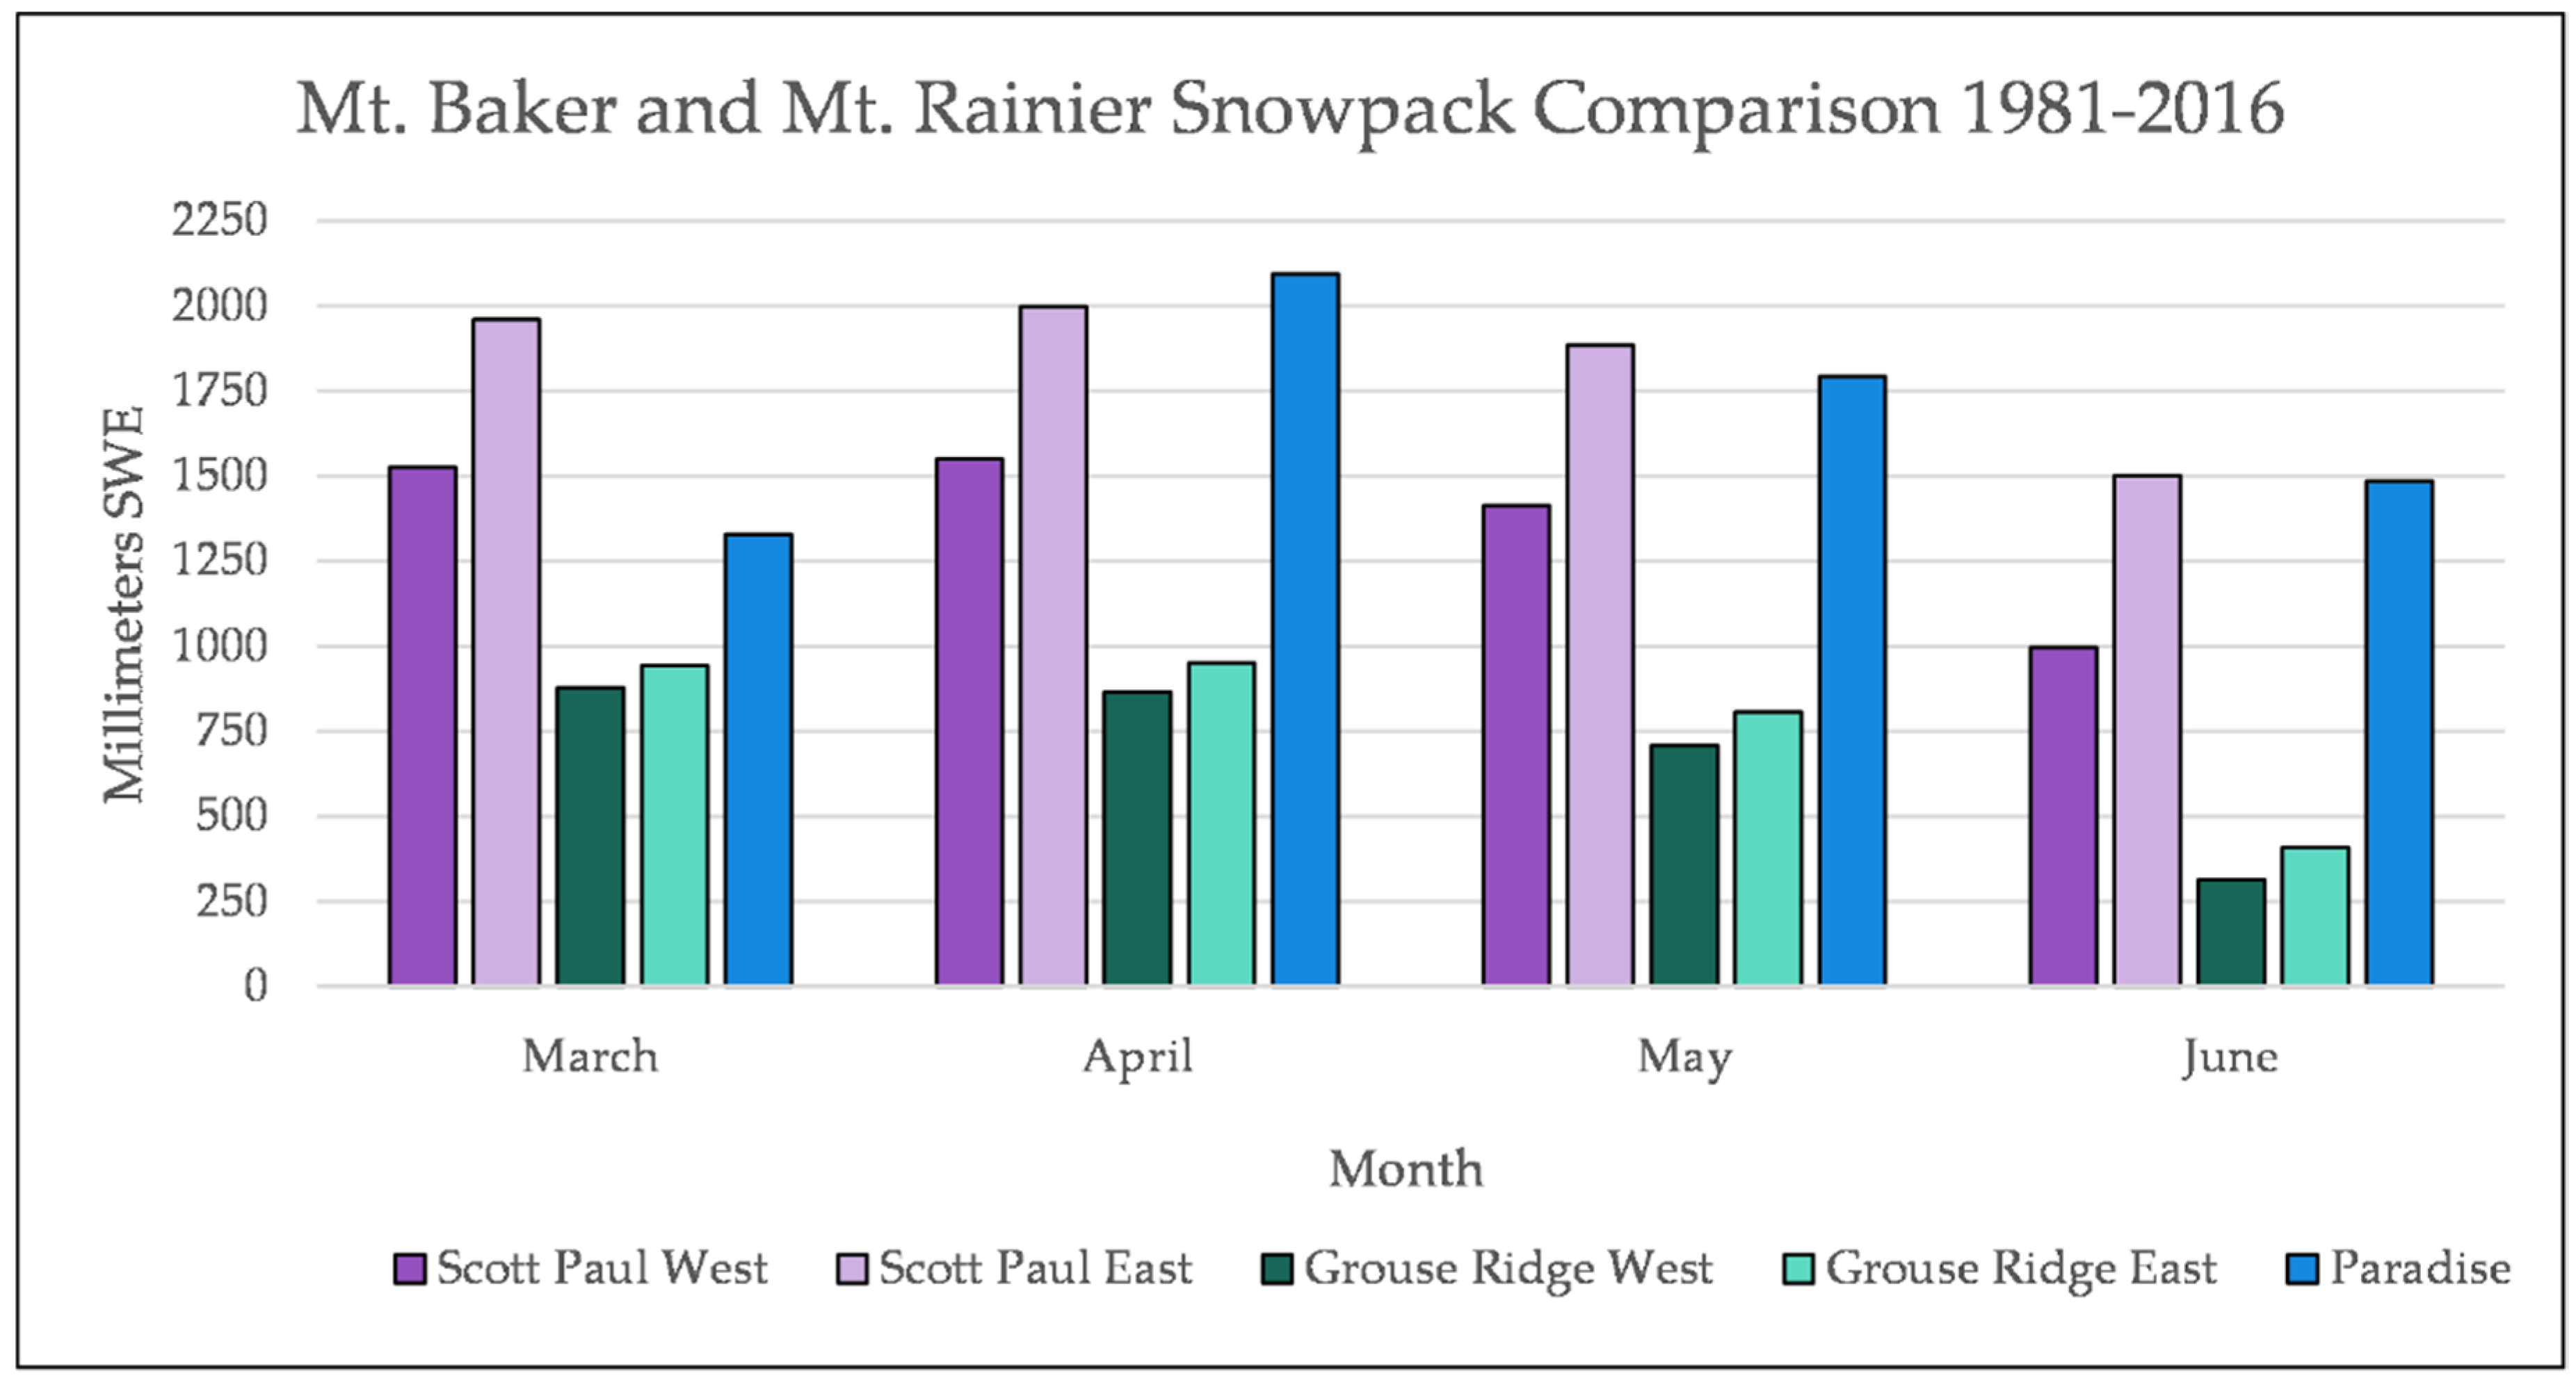
Figure A7.
A comparison of early growing season snowpack at Mt. Baker Transects and at Paradise on the south side of Mt. Rainier.
Figure A7.
A comparison of early growing season snowpack at Mt. Baker Transects and at Paradise on the south side of Mt. Rainier.
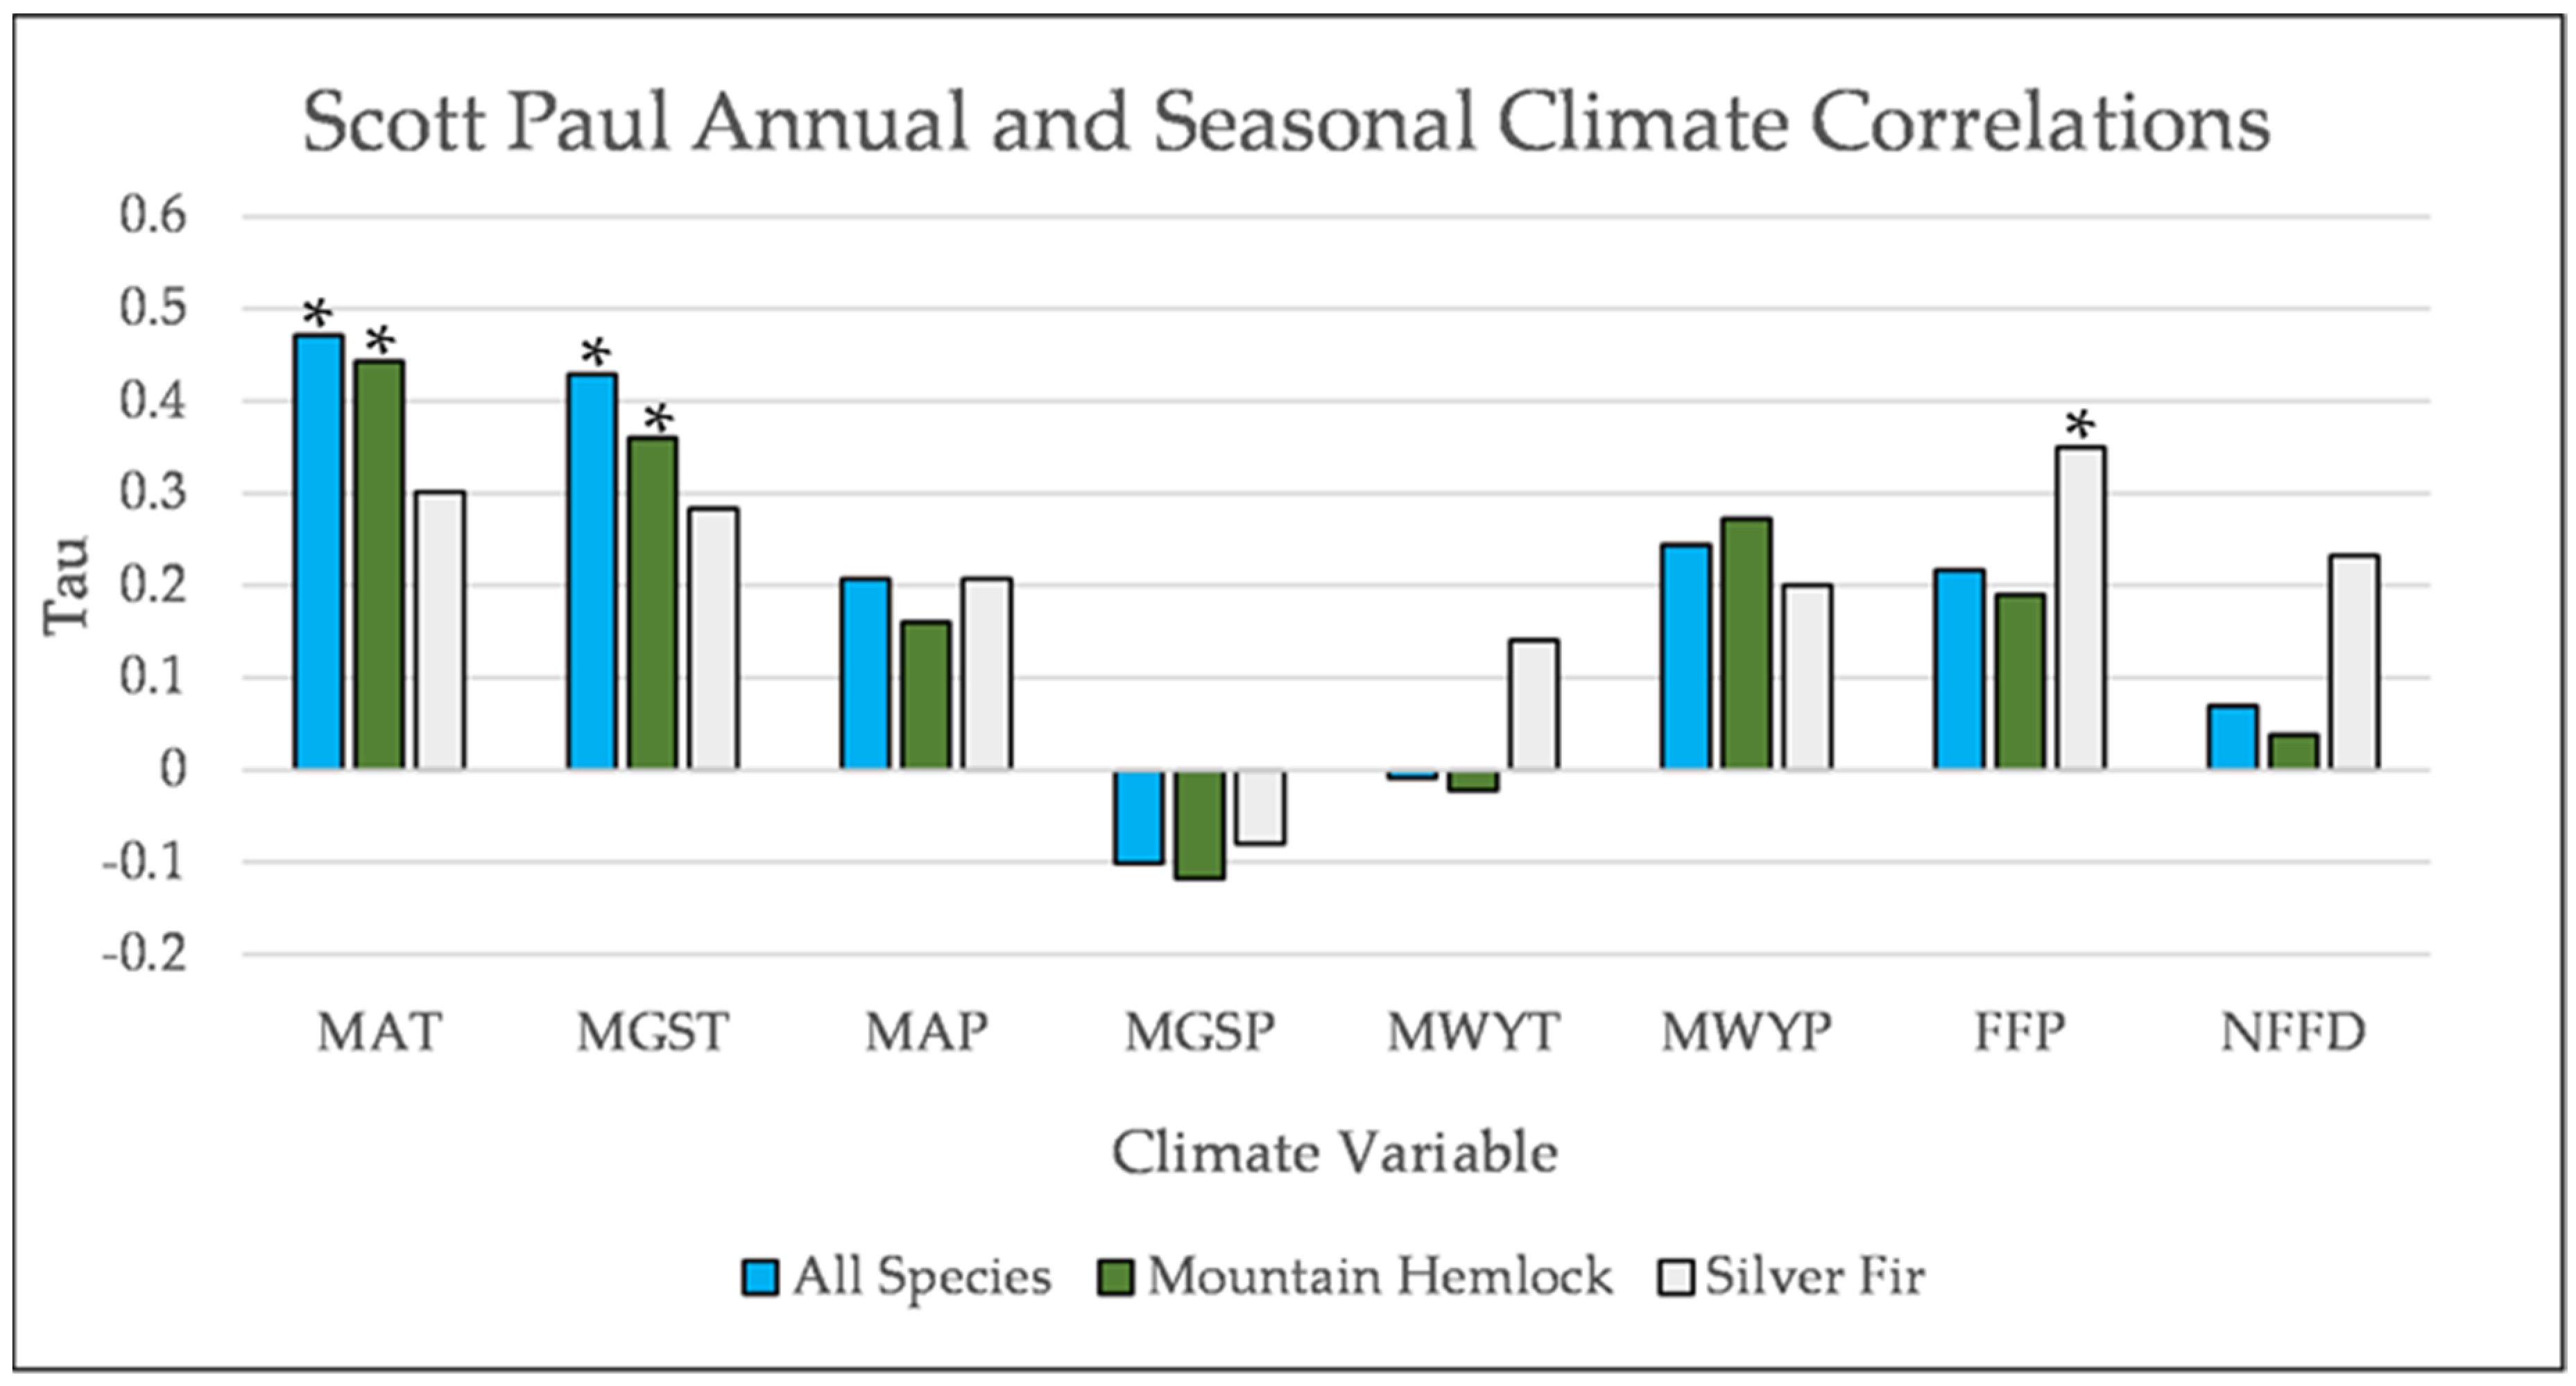
Figure A8.
Partial Kendall’s correlations between establishment and annual and seasonal climate variables at Scott Paul. * = p-value < 0.05. Mean Annual Temperature (MAT), Mean Growing Season Temperature (MGST), Mean Annual Precipitation (MAP), Mean Growing Season Precipitation (MGSP), Mean Water Year Temperature (MWYT), Mean Water Year Precipitation (MWYP), Frost Free Period (FFP), and Number of Frost-Free Days (NFFD).
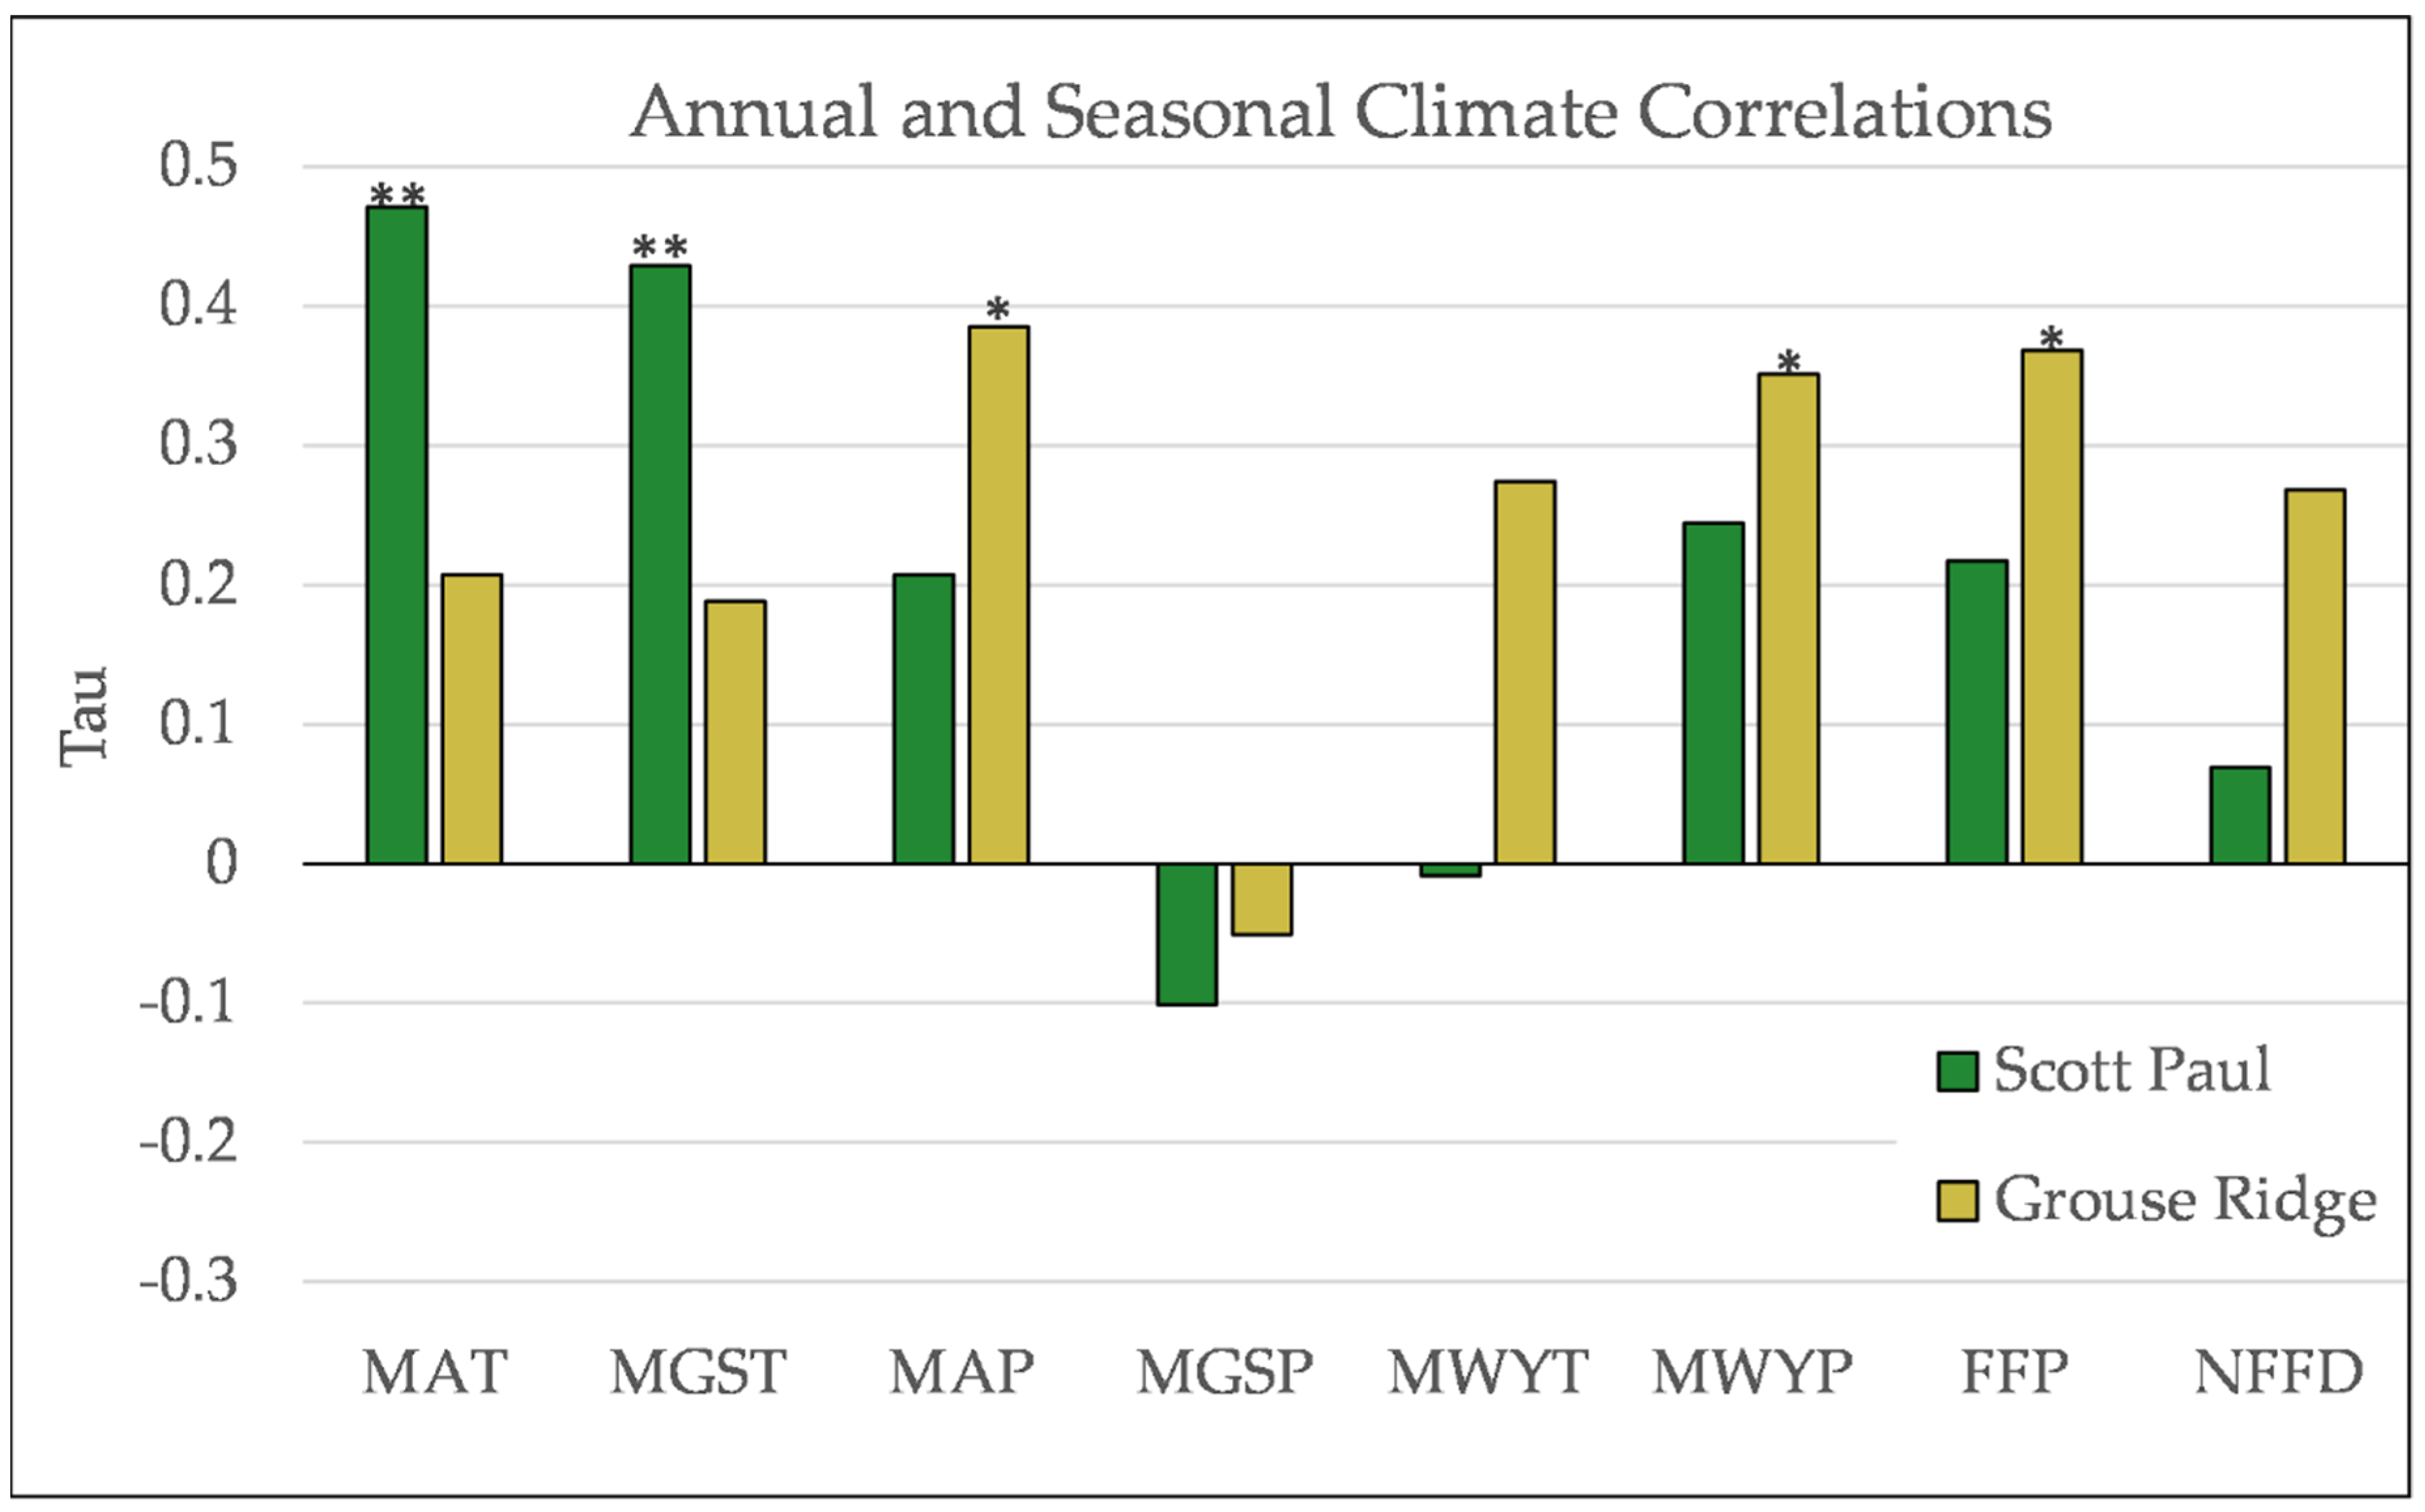
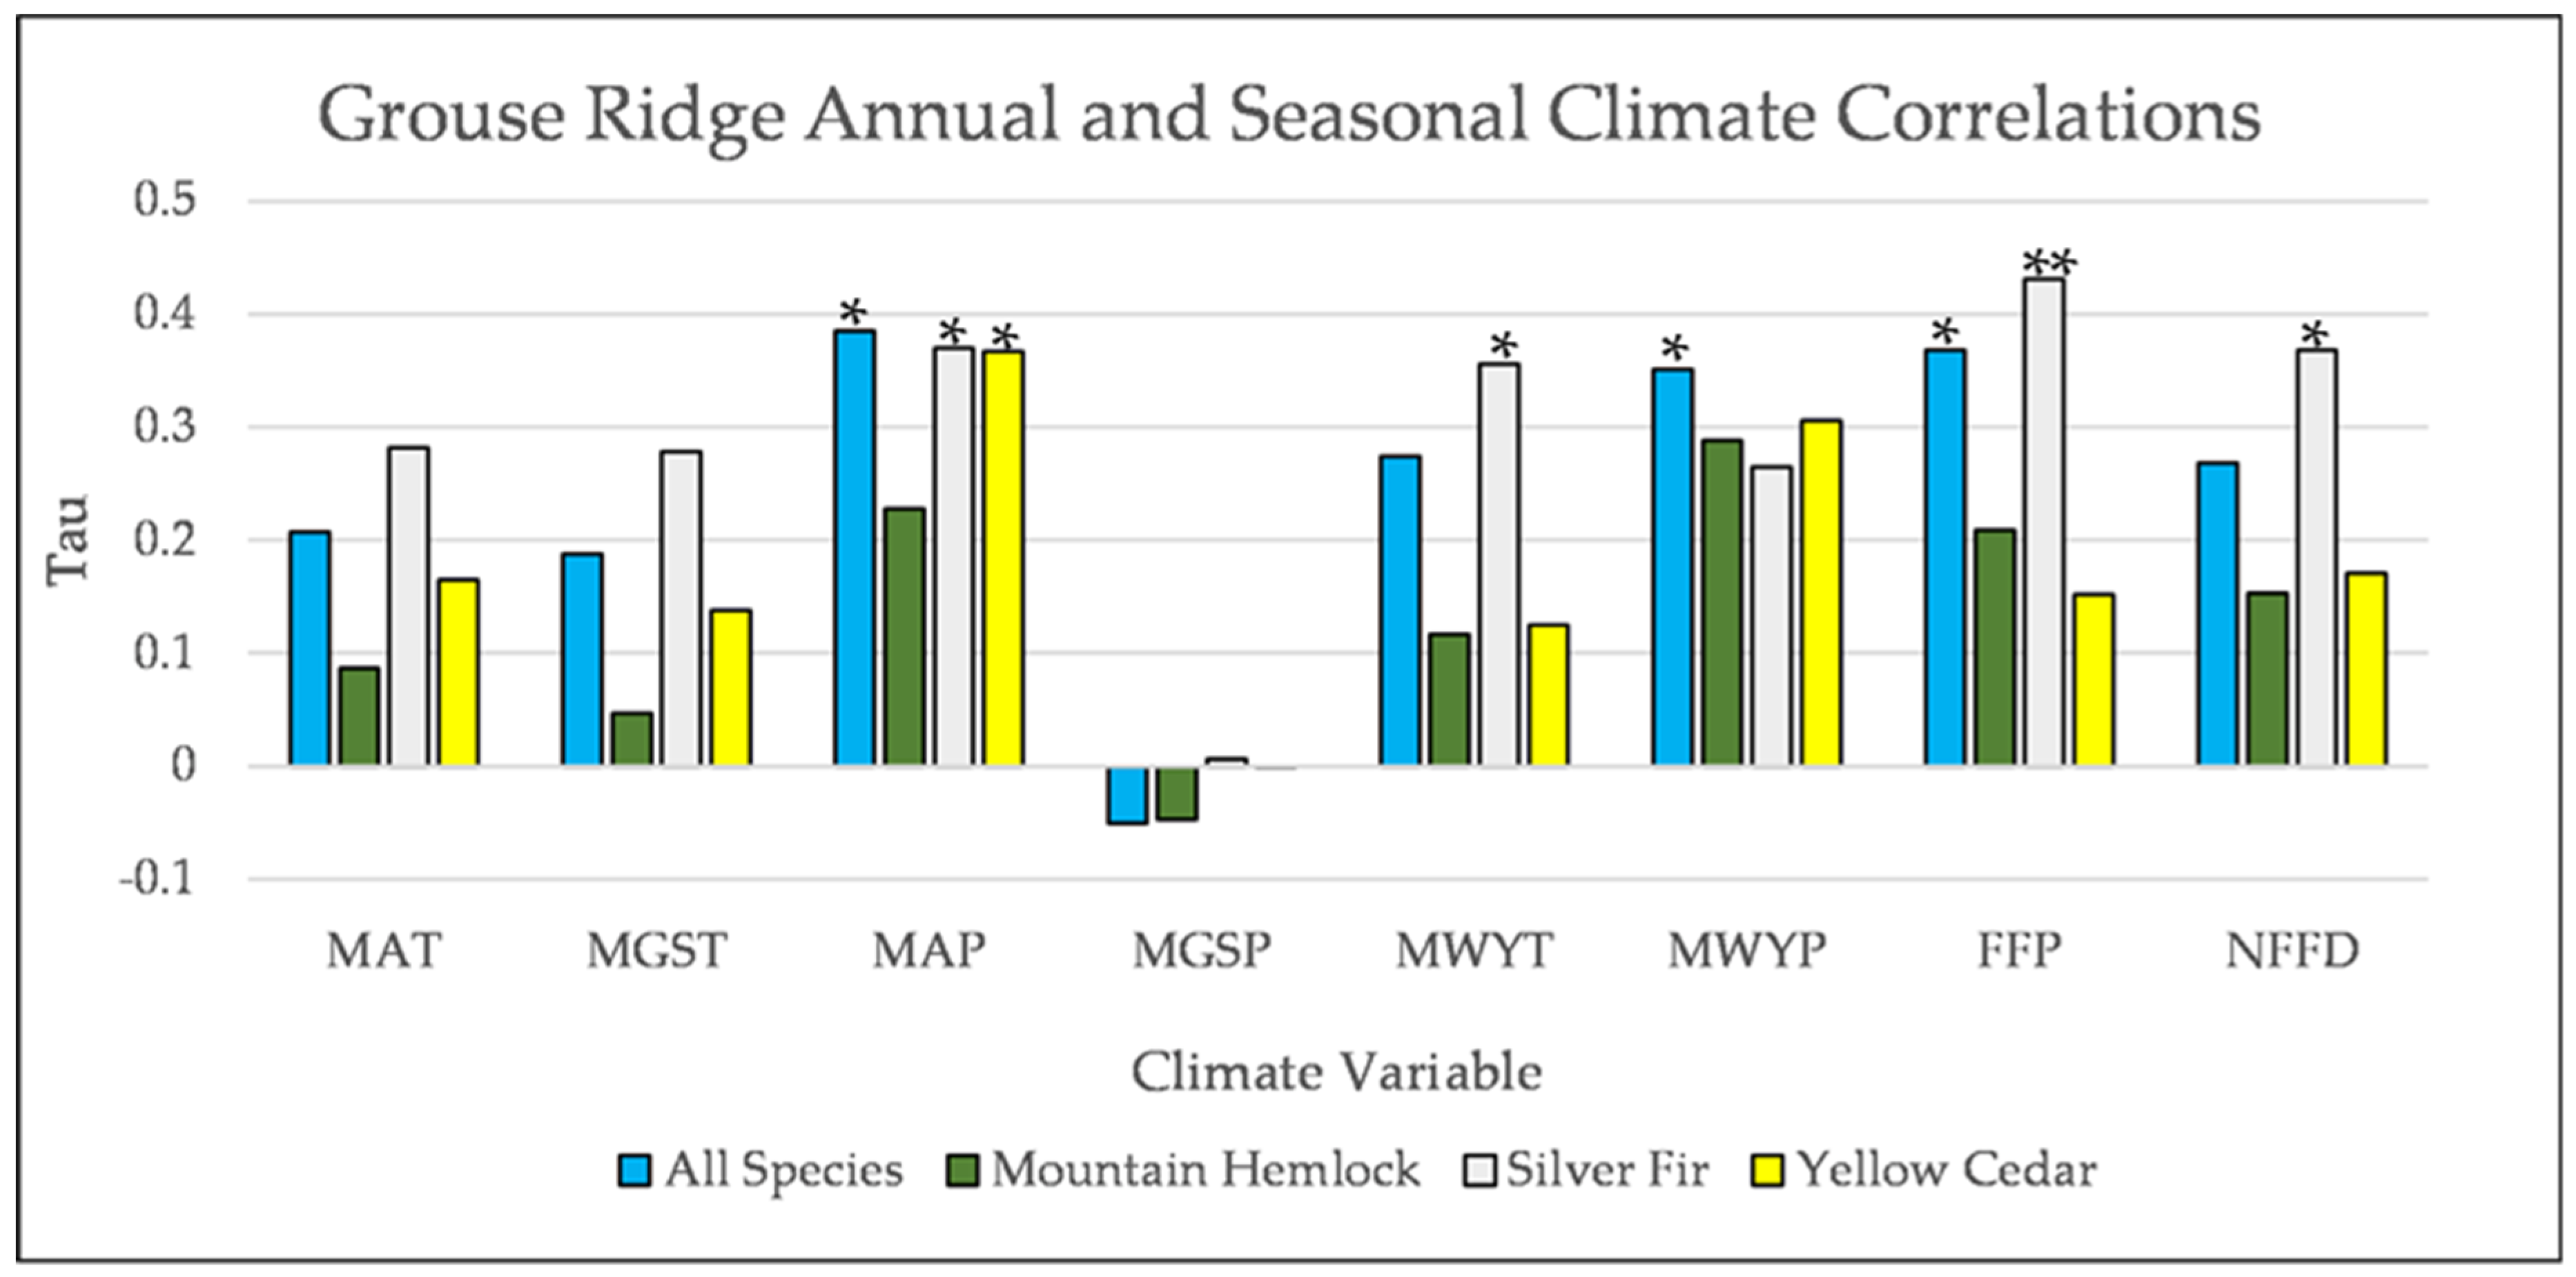
Figure A9.
Partial Kendall’s correlations between establishment and annual and seasonal climate variables at Grouse Ridge. * = p-value < 0.05, ** = p-value < 0.01. Mean Annual Temperature (MAT), Mean Growing Season Temperature (MGST), Mean Annual Precipitation (MAP), Mean Growing Season Precipitation (MGSP), Mean Water Year Temperature (MWYT), Mean Water Year Precipitation (MWYP), Frost Free Period (FFP), and Number of Frost-Free Days (NFFD).
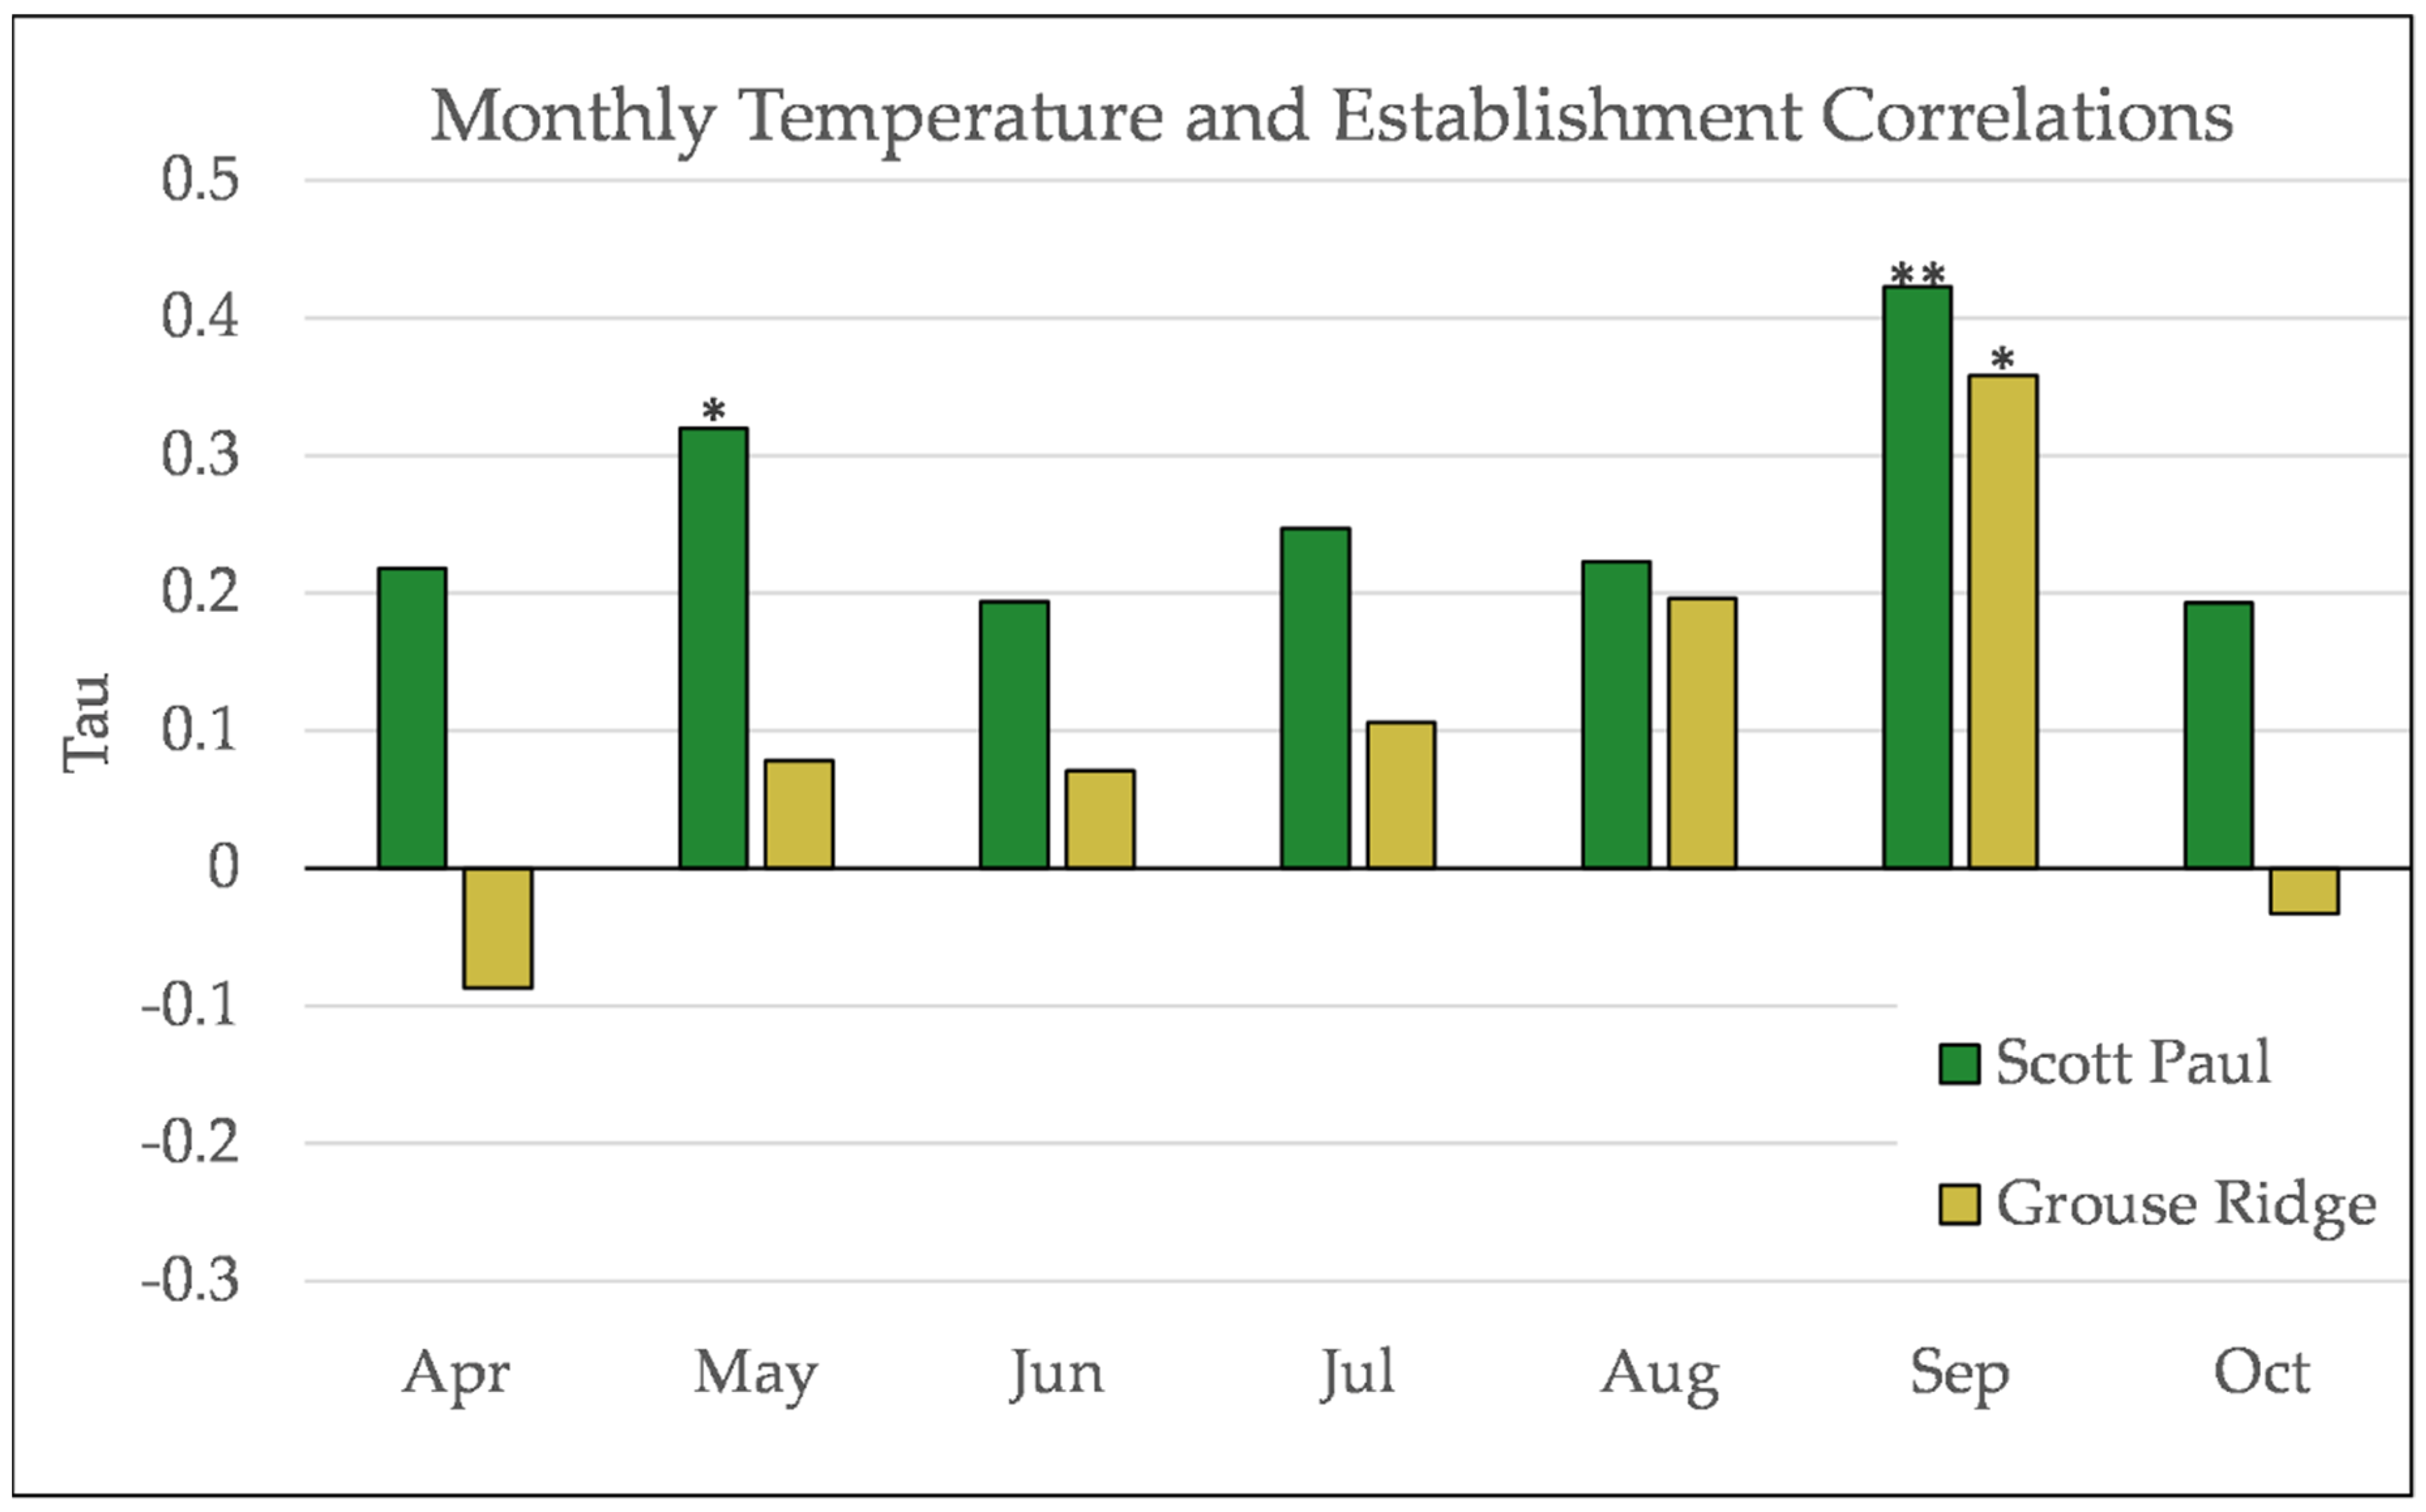
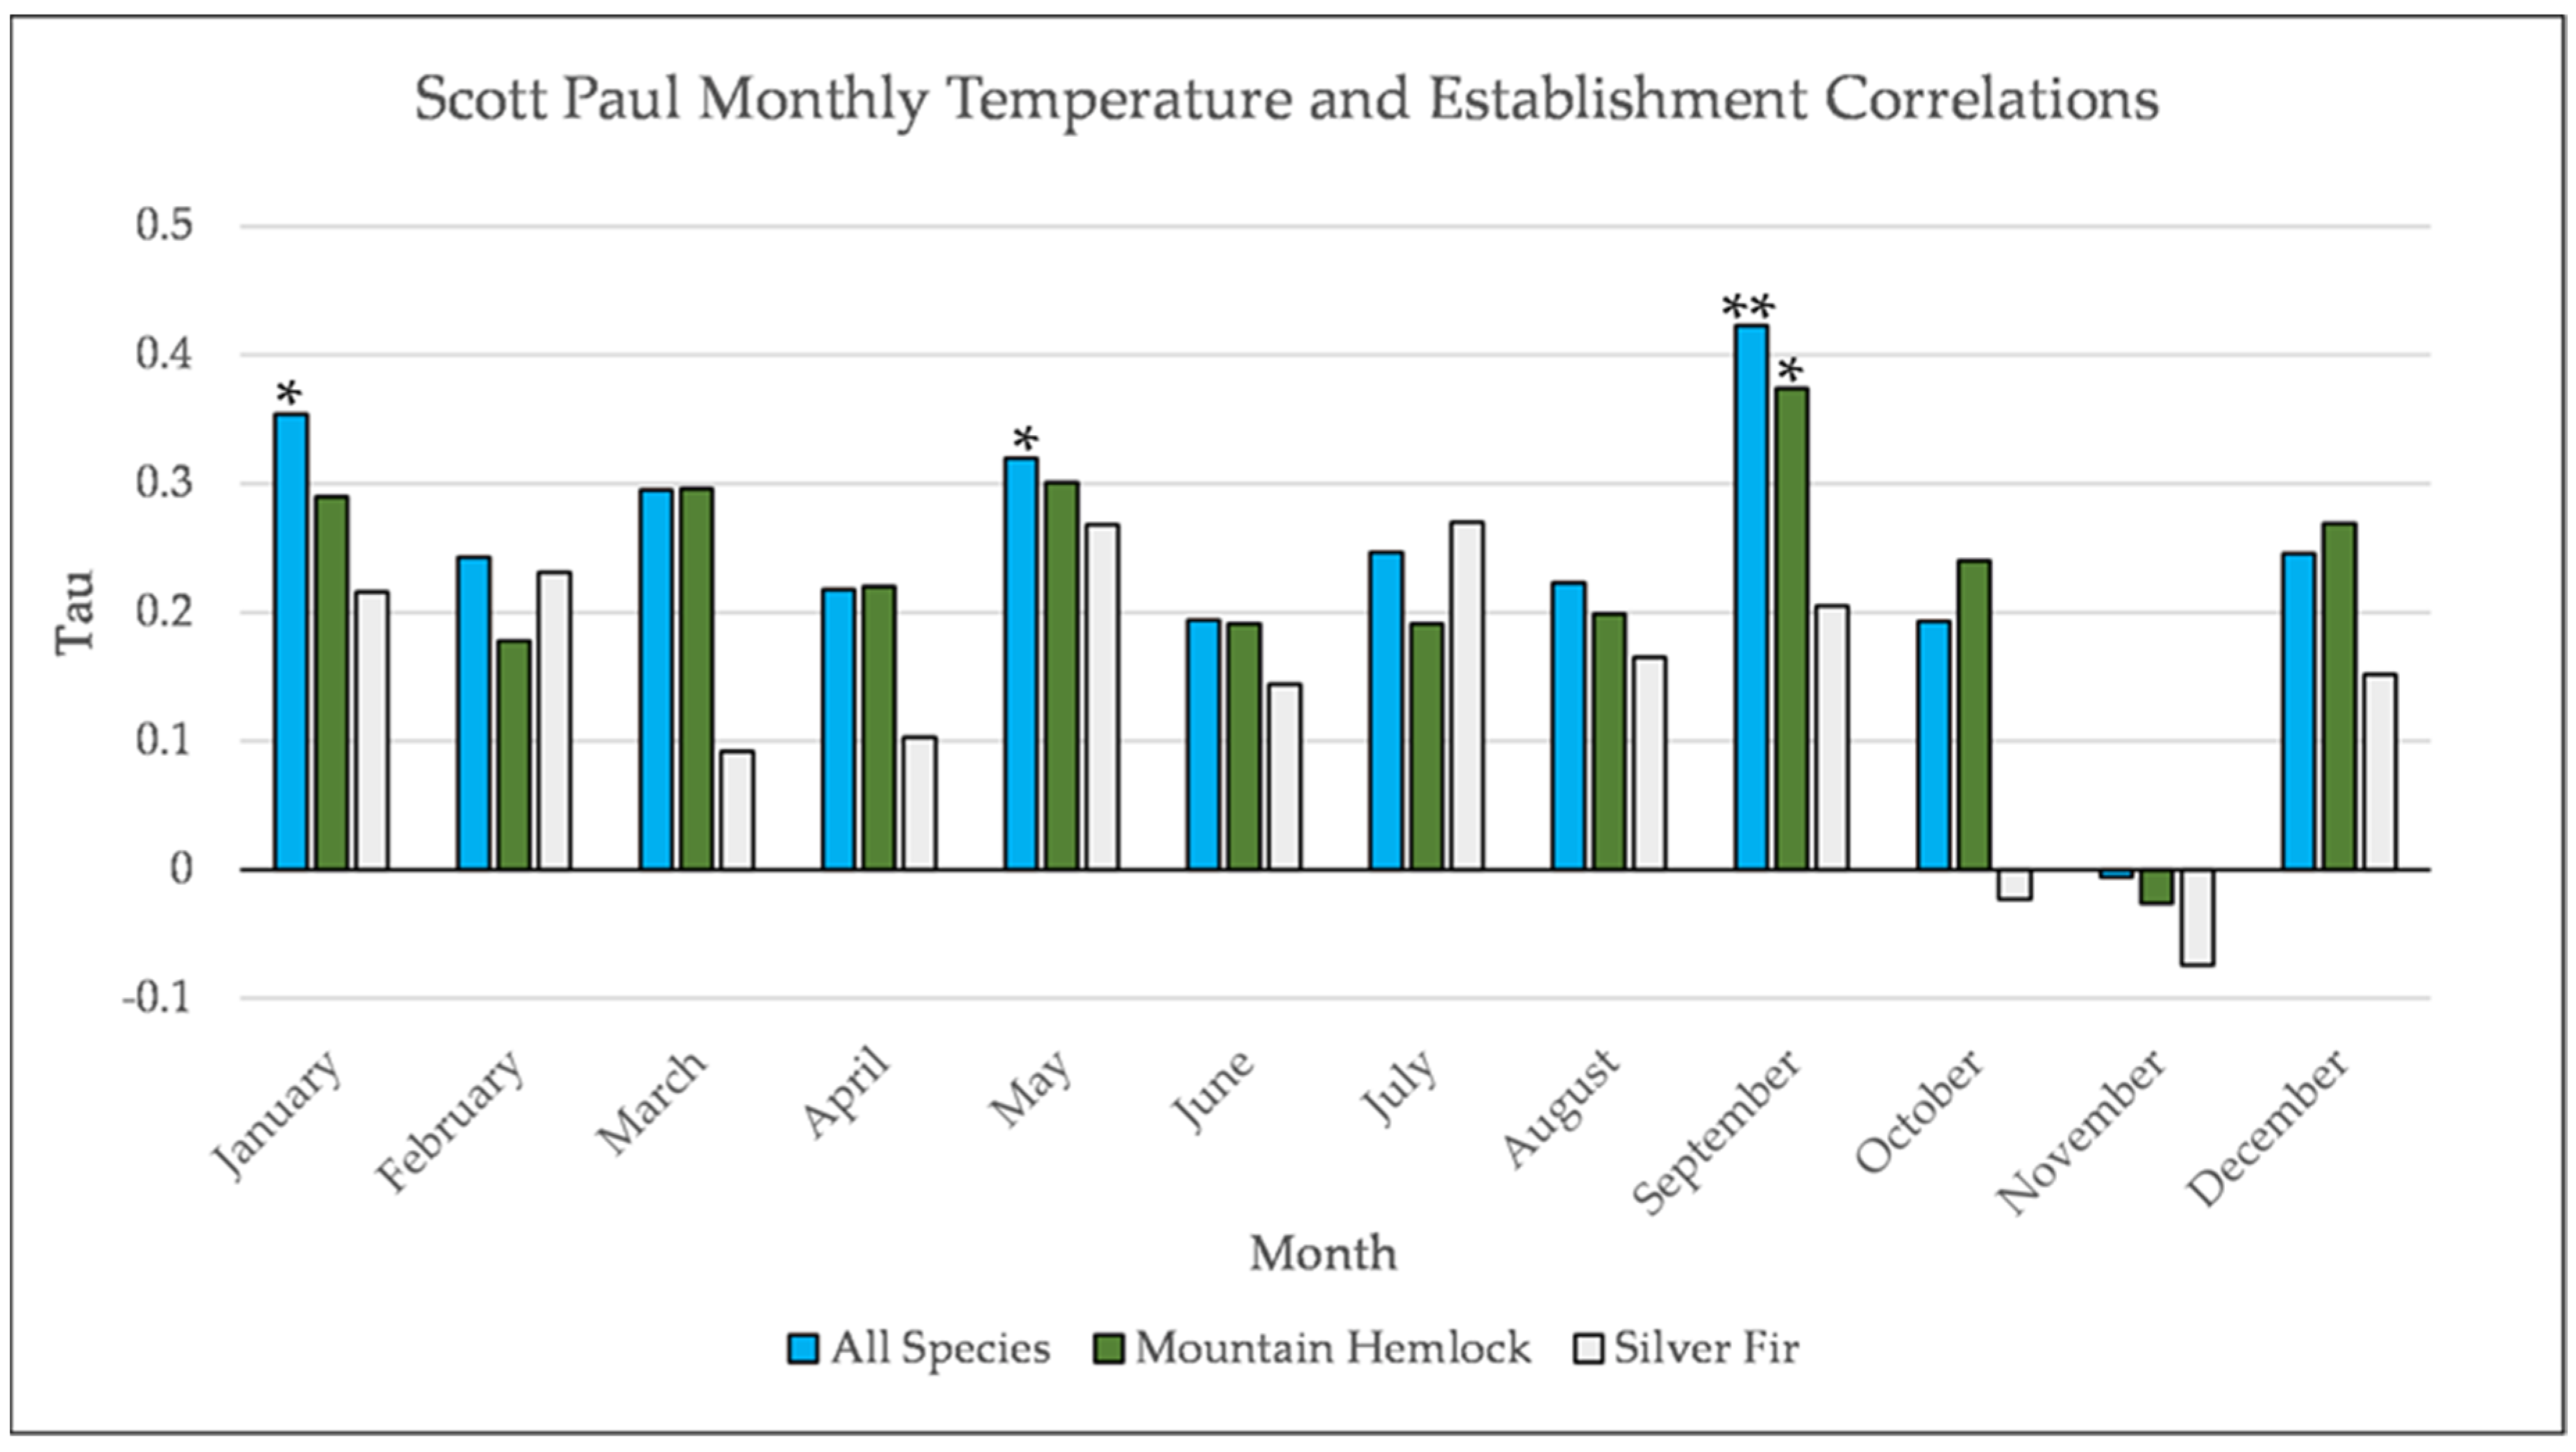
Figure A10.
Partial Kendall’s correlation between mean monthly temperature and establishment at the Scott Paul site. * = p-value < 0.05, ** = p-value < 0.01.
Figure A10.
Partial Kendall’s correlation between mean monthly temperature and establishment at the Scott Paul site. * = p-value < 0.05, ** = p-value < 0.01.
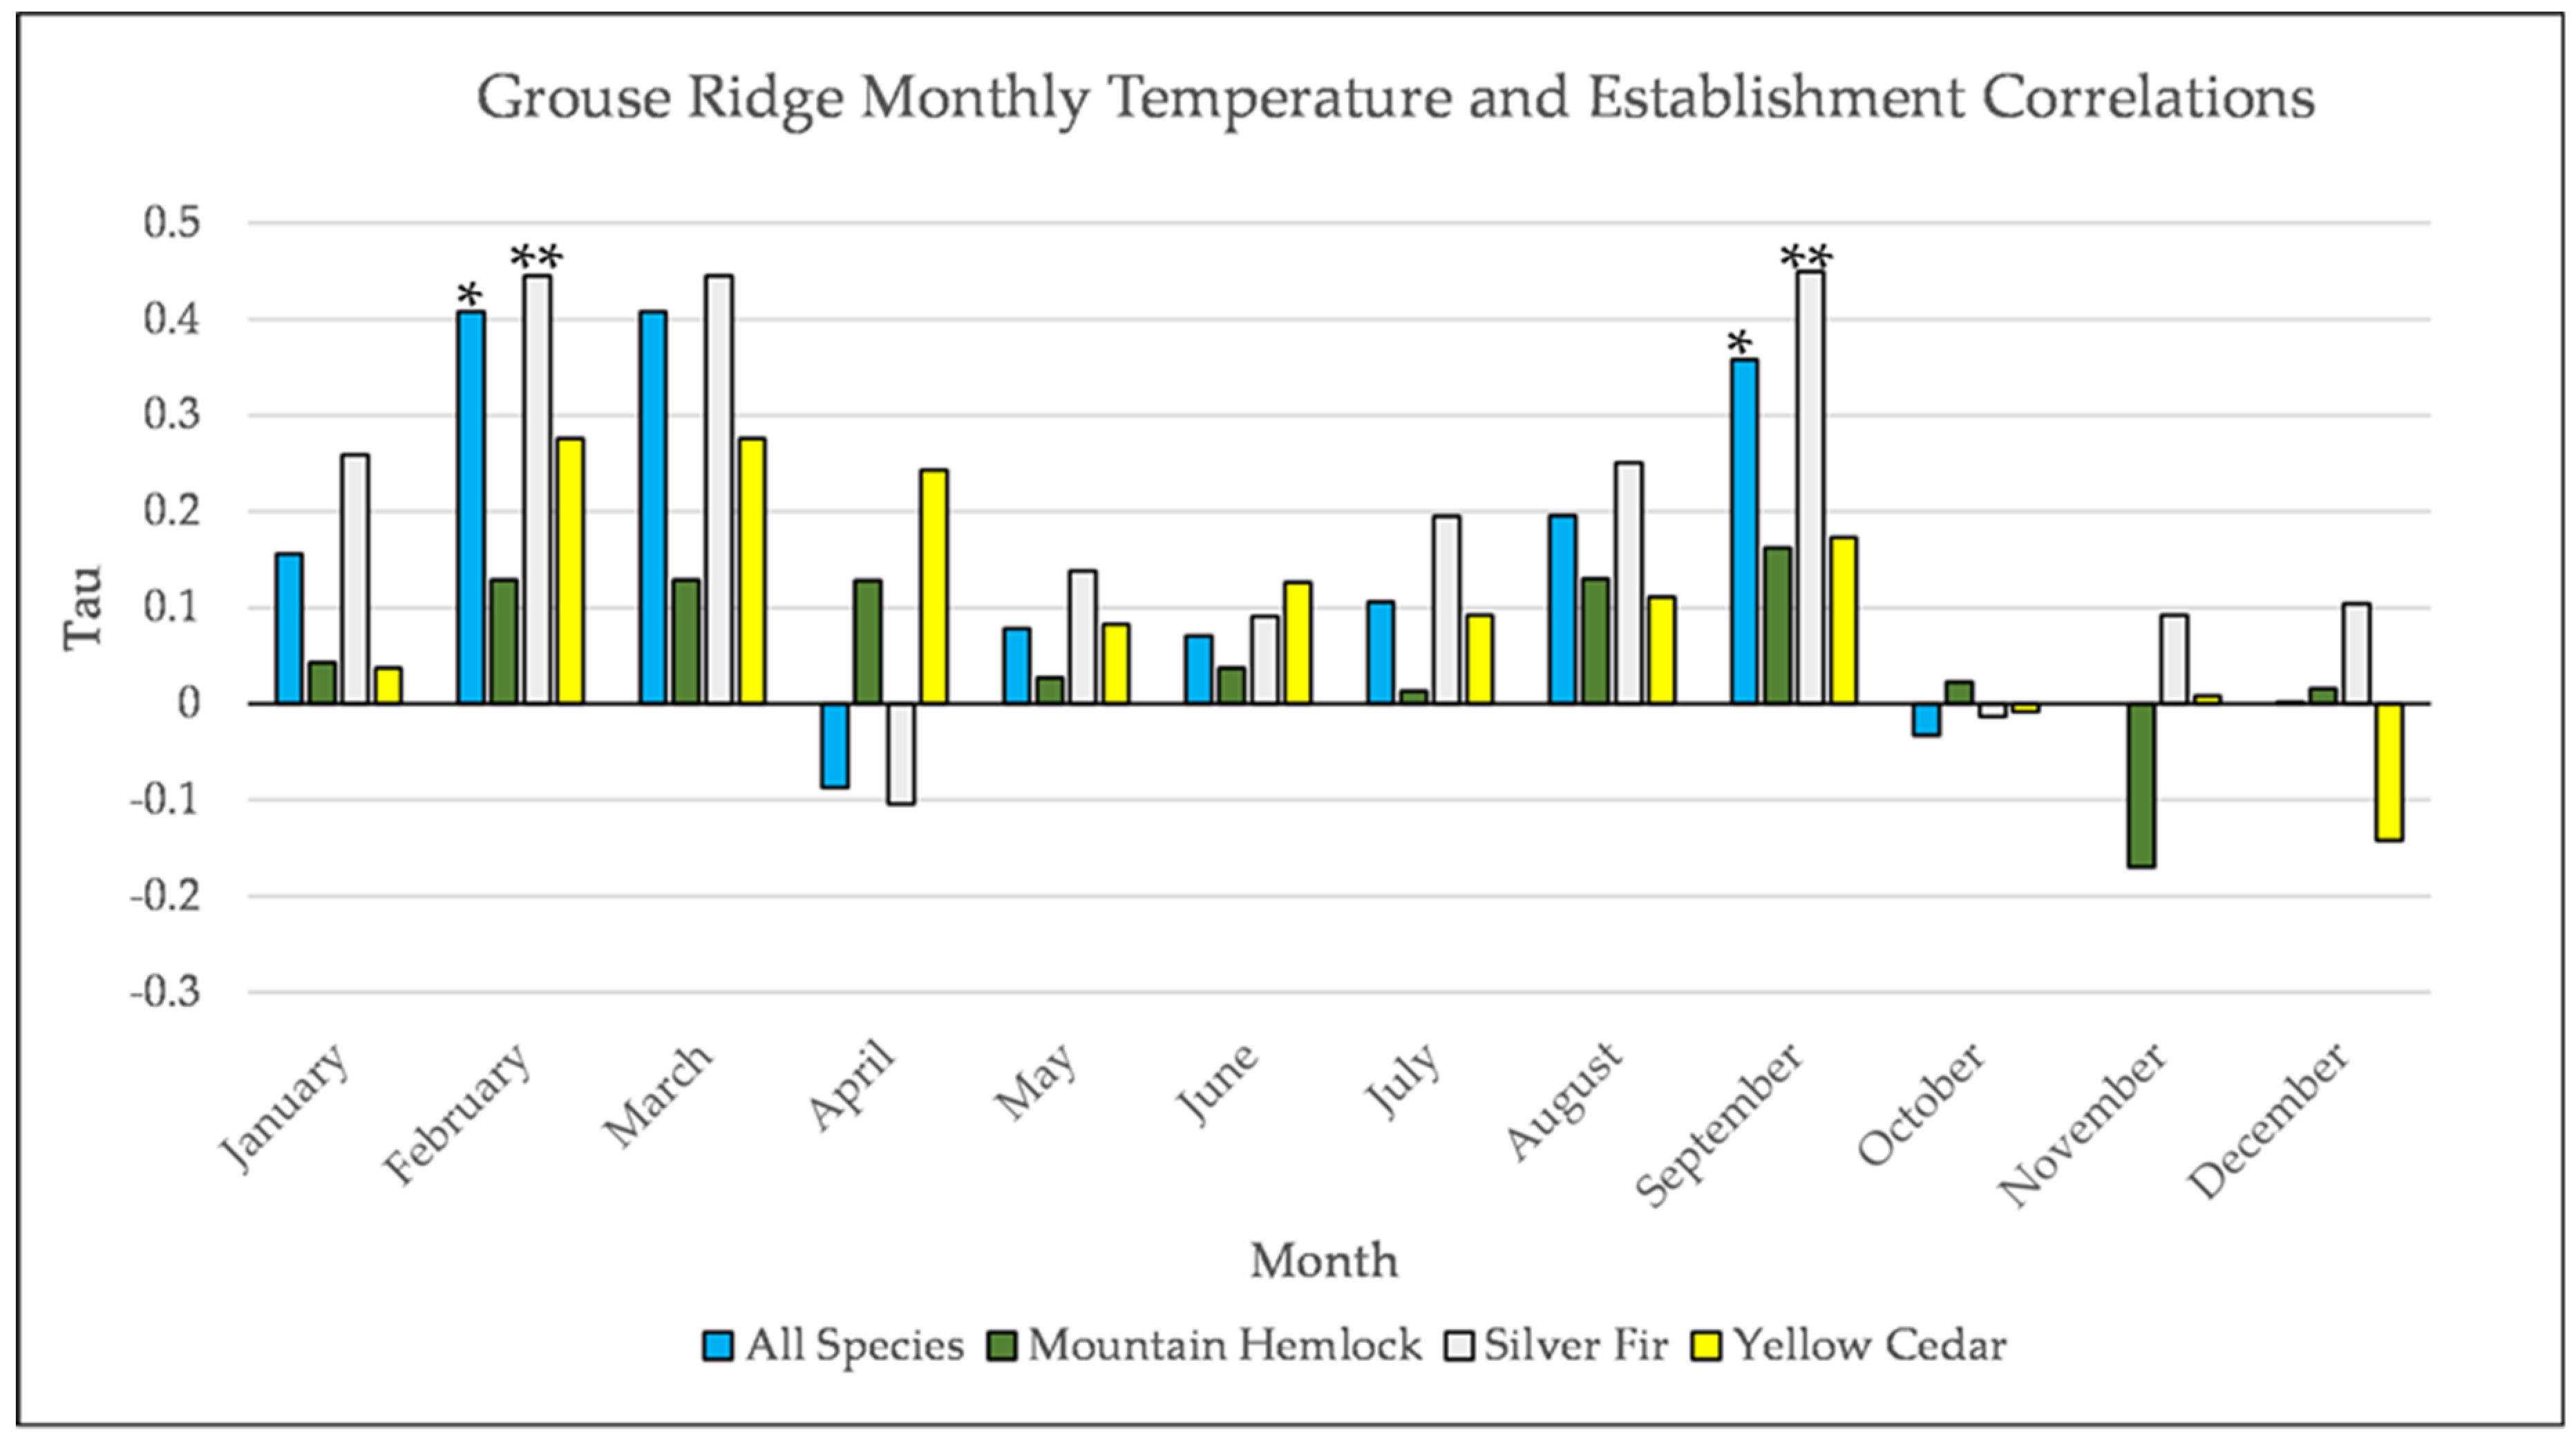
Figure A11.
Partial Kendall’s correlation between mean monthly temperature and establishment at the Grouse Ridge site * = p-value < 0.05, ** = p-value < 0.01.
Figure A11.
Partial Kendall’s correlation between mean monthly temperature and establishment at the Grouse Ridge site * = p-value < 0.05, ** = p-value < 0.01.
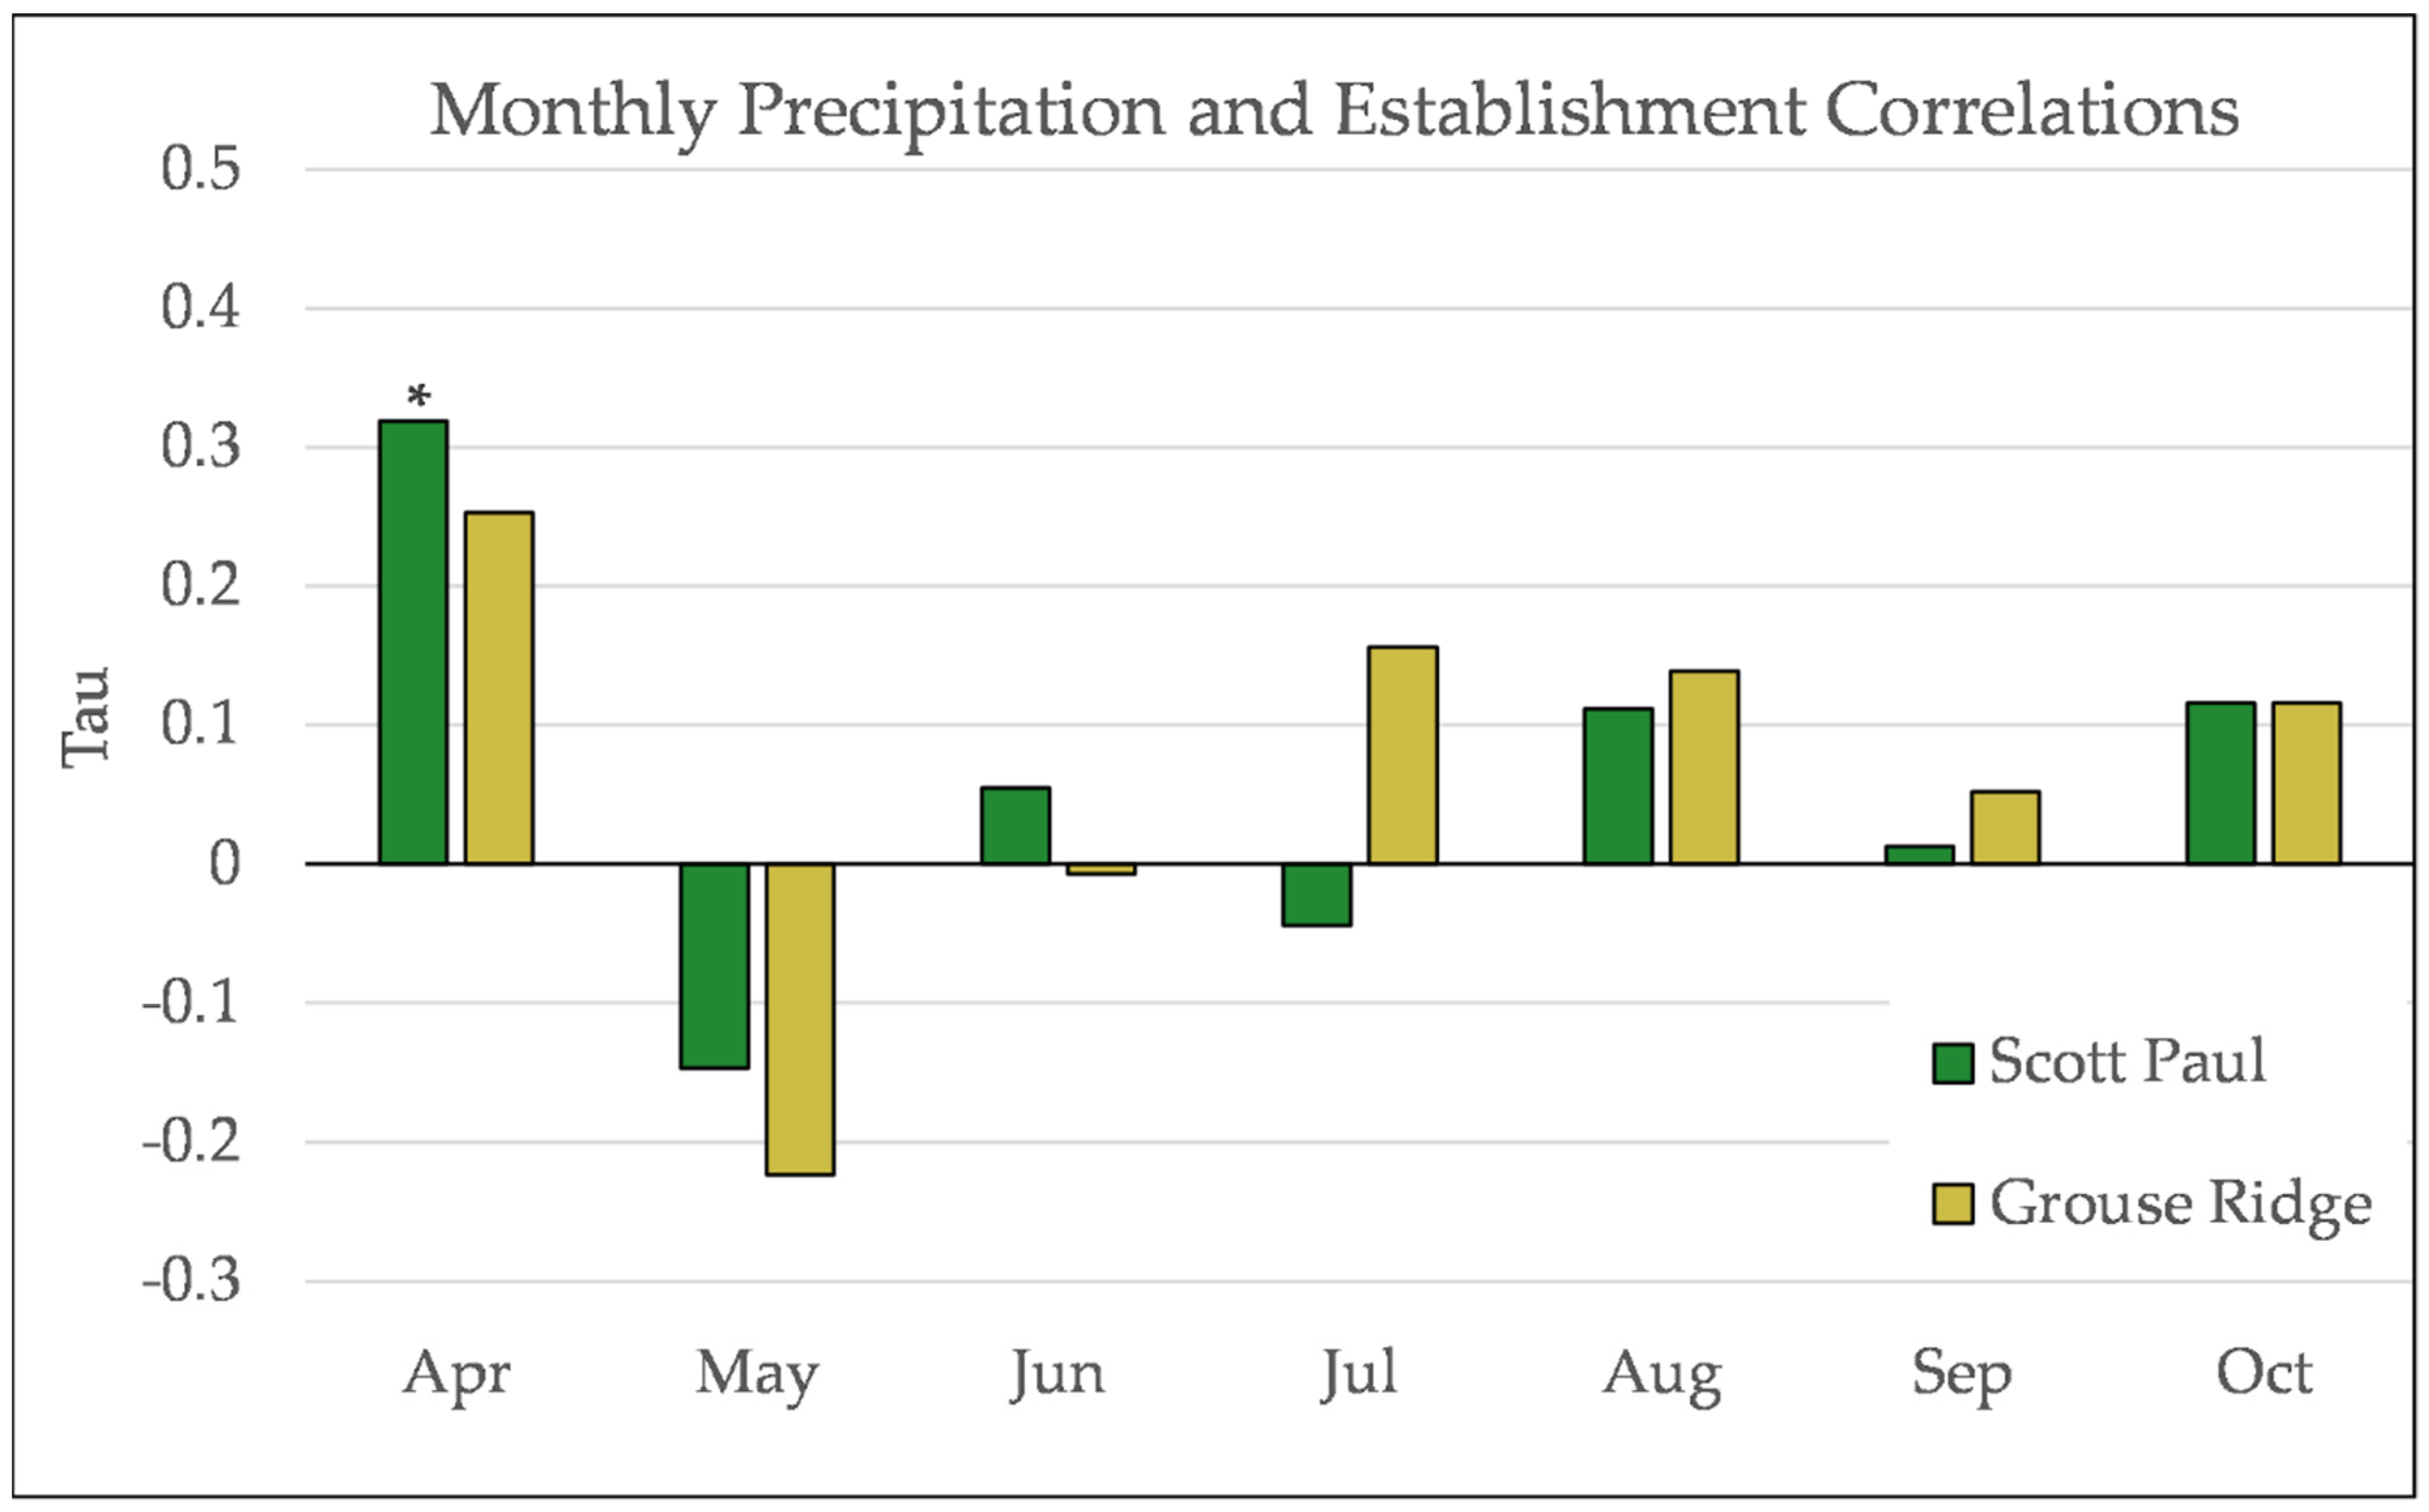
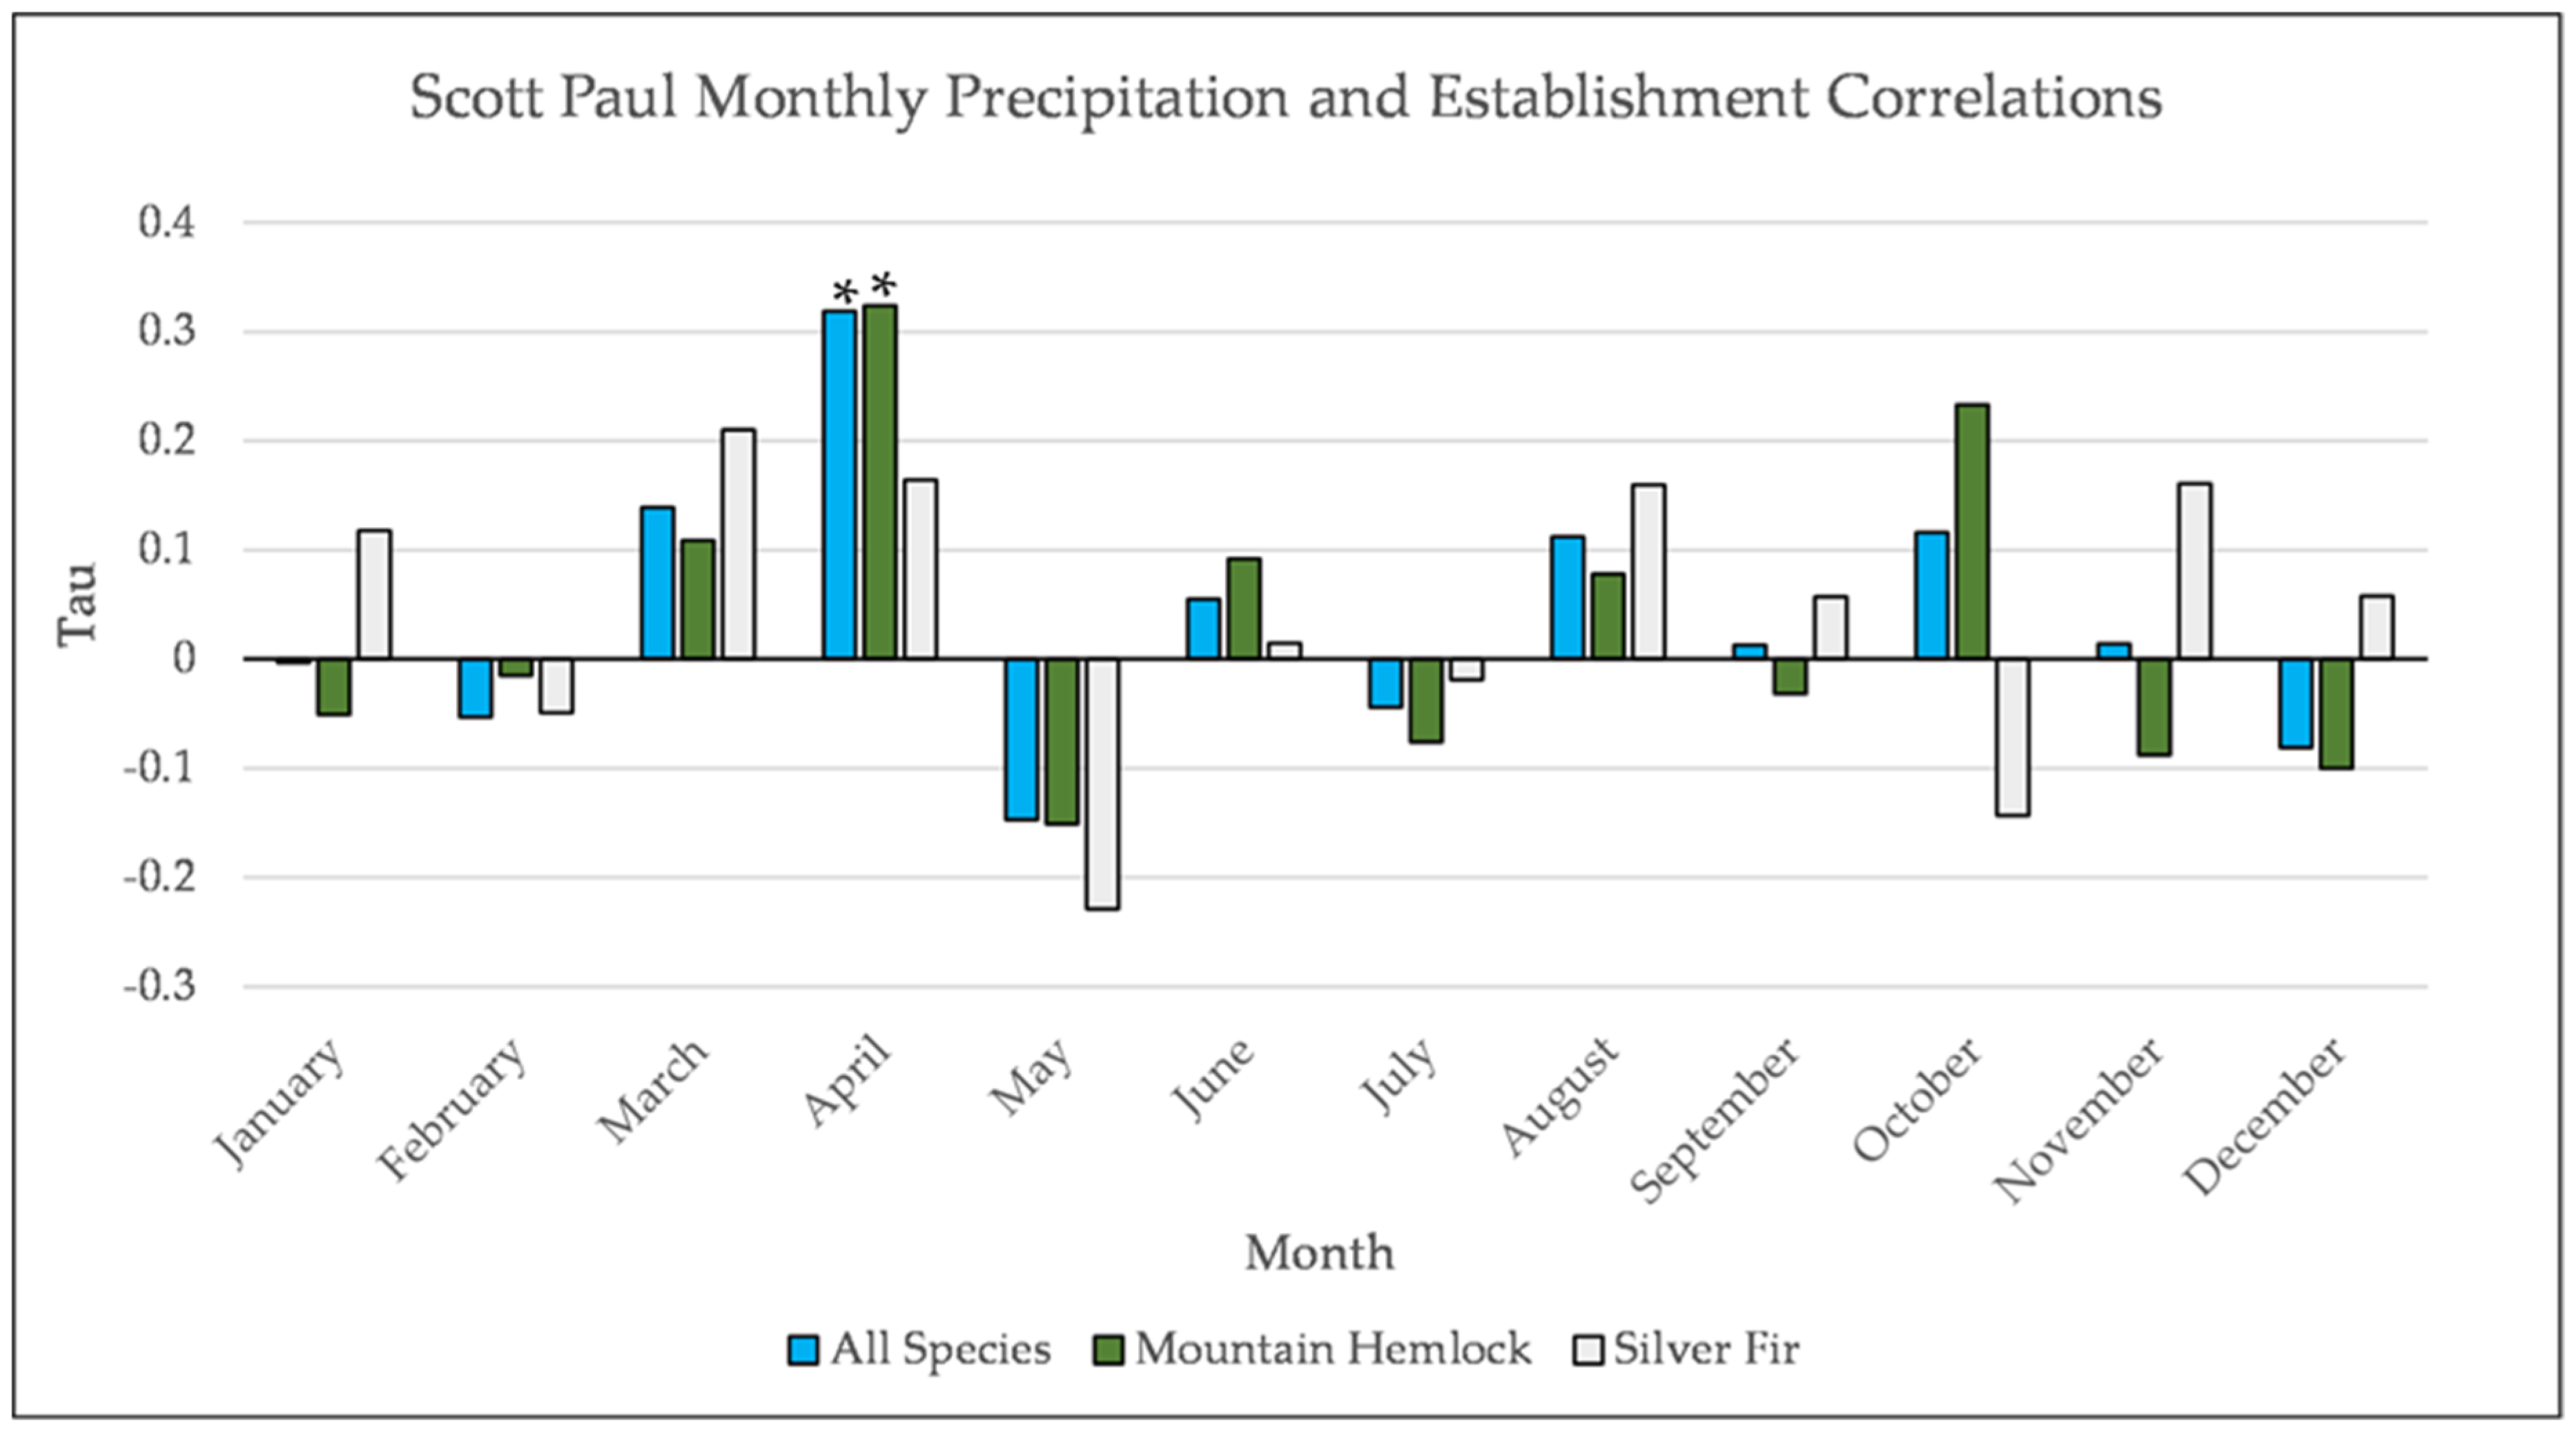
Figure A12.
Partial Kendall’s correlation between mean monthly precipitation and establishment at the Scott Paul site. * = p-value < 0.05.
Figure A12.
Partial Kendall’s correlation between mean monthly precipitation and establishment at the Scott Paul site. * = p-value < 0.05.
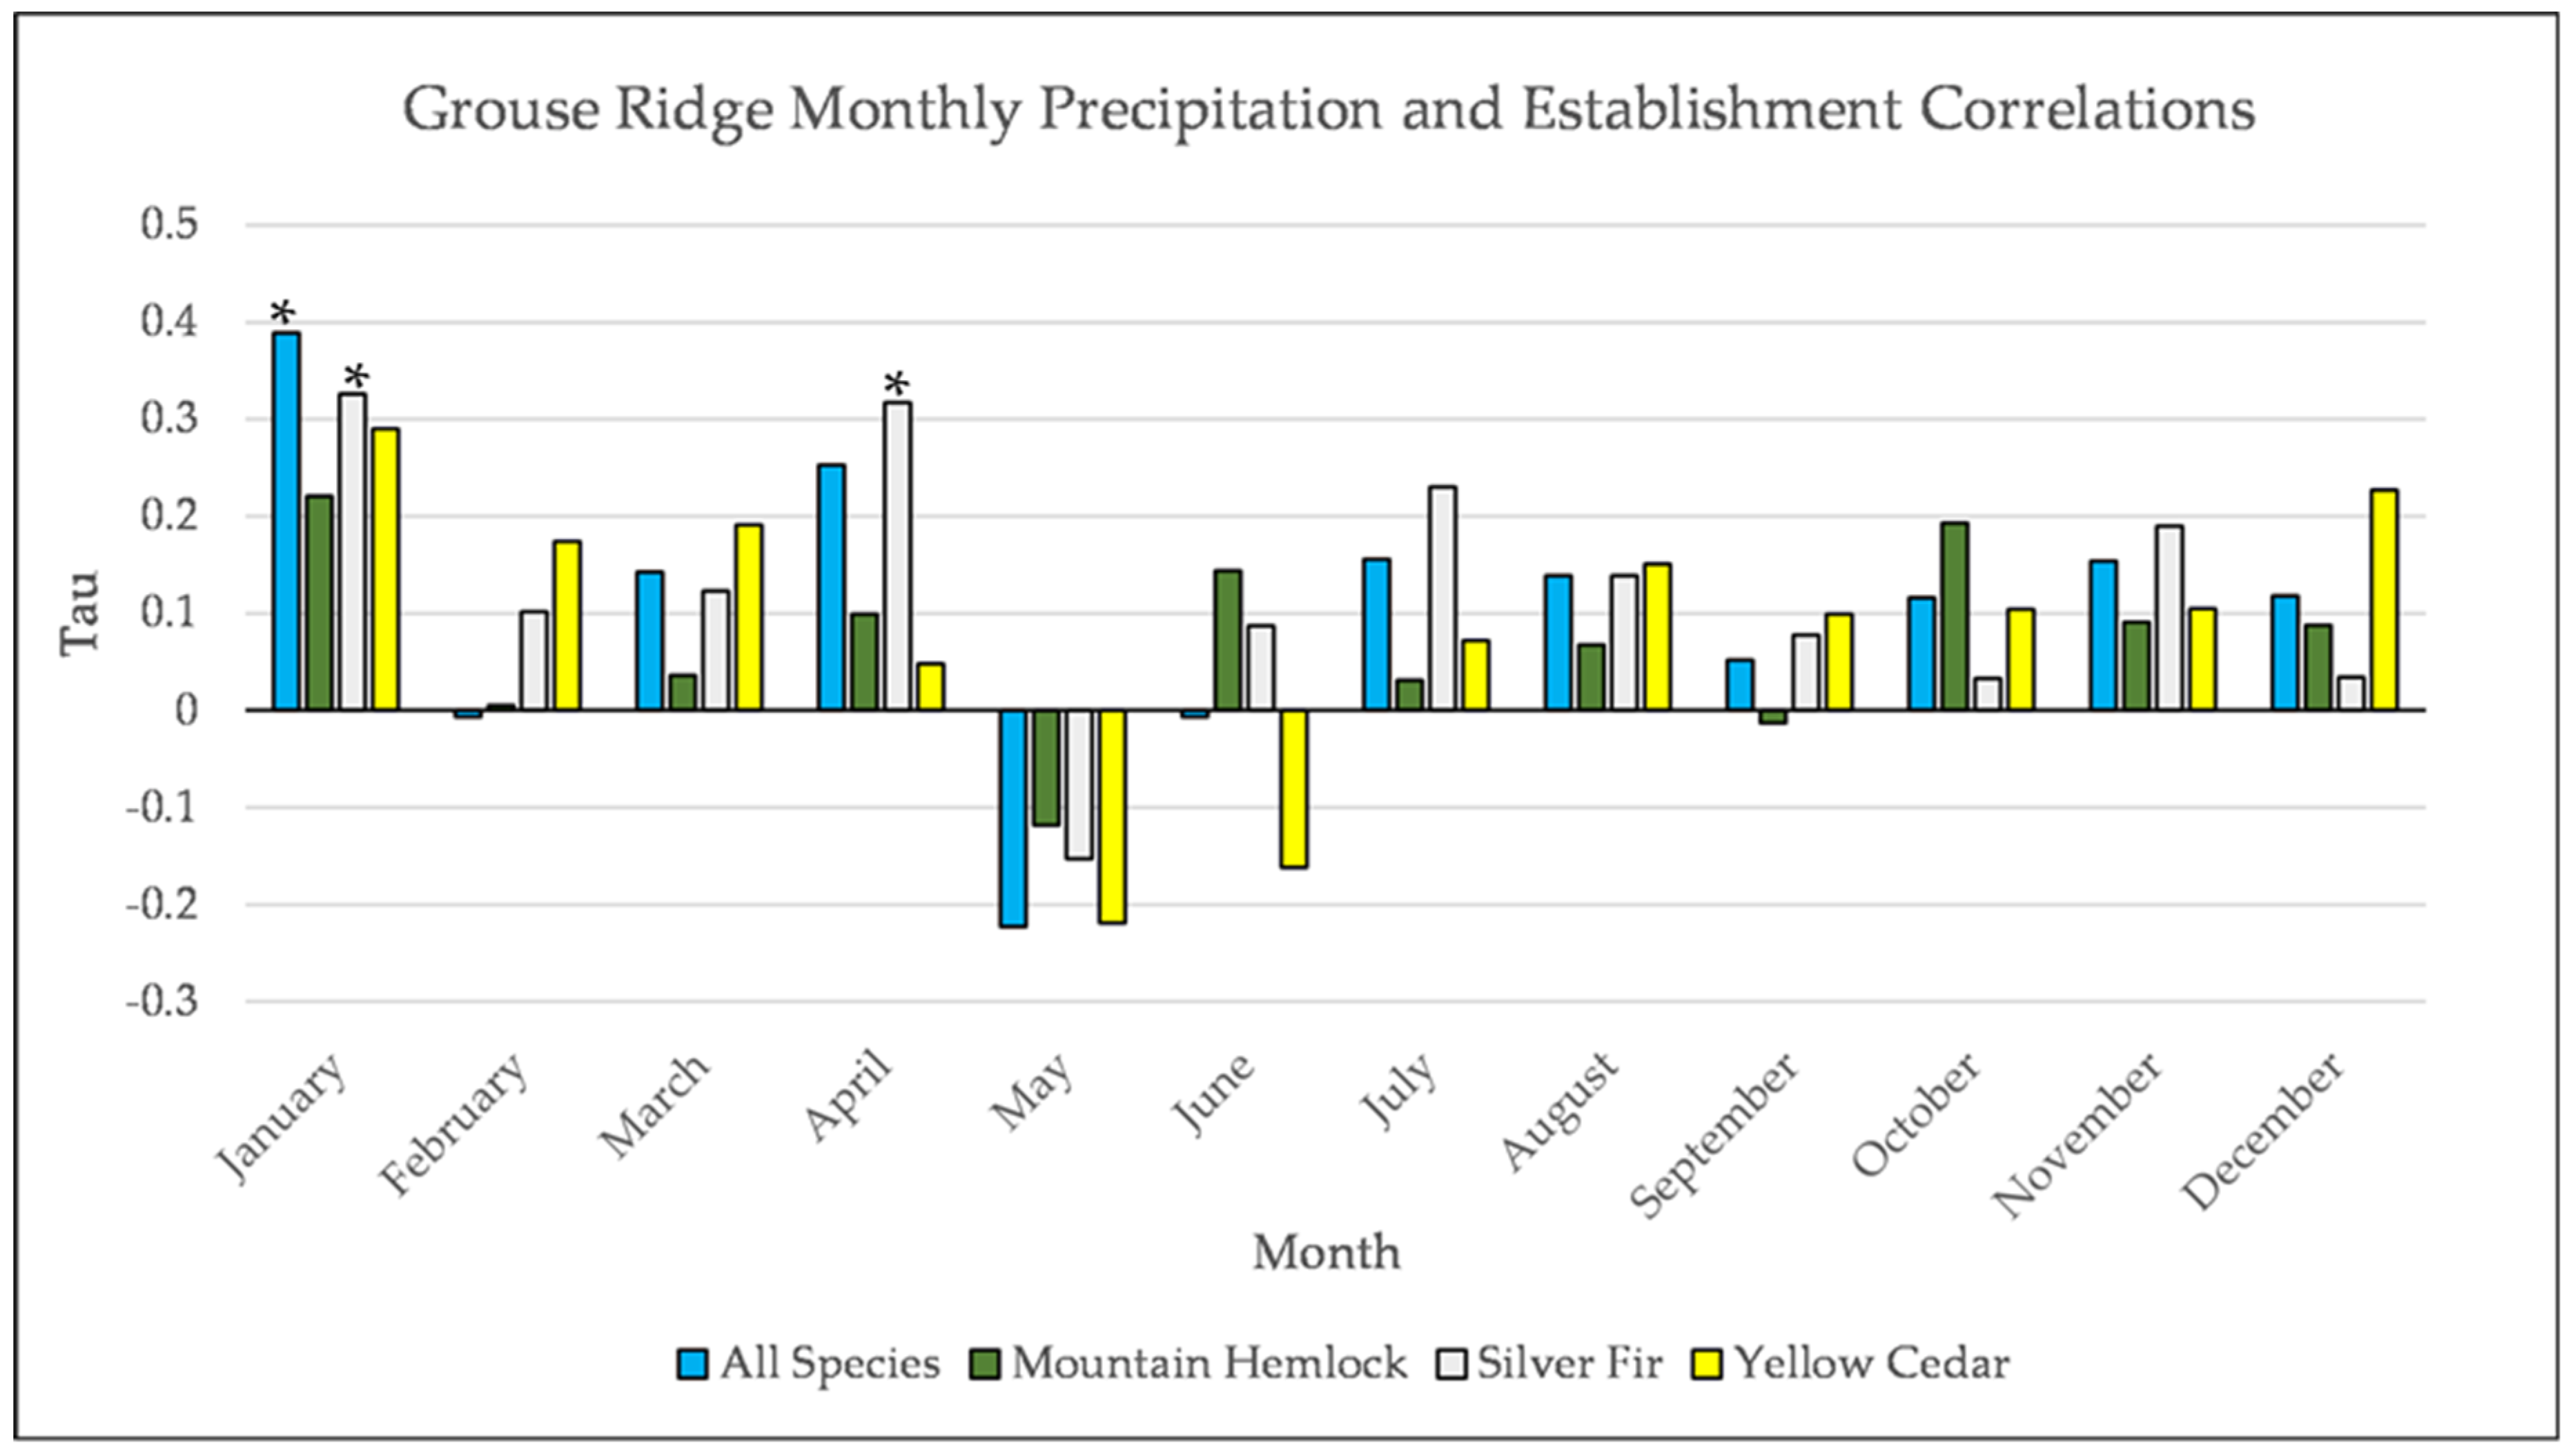
Figure A13.
Partial Kendall’s correlation between mean monthly precipitation and establishment at the Grouse Ridge site. * = p-value < 0.05.
Figure A13.
Partial Kendall’s correlation between mean monthly precipitation and establishment at the Grouse Ridge site. * = p-value < 0.05.
Figure A14.
Partial Kendall’s correlation controlled for temperature between mean monthly snowpack and establishment at Scott Paul. None of these correlations are significant.
Figure A14.
Partial Kendall’s correlation controlled for temperature between mean monthly snowpack and establishment at Scott Paul. None of these correlations are significant.
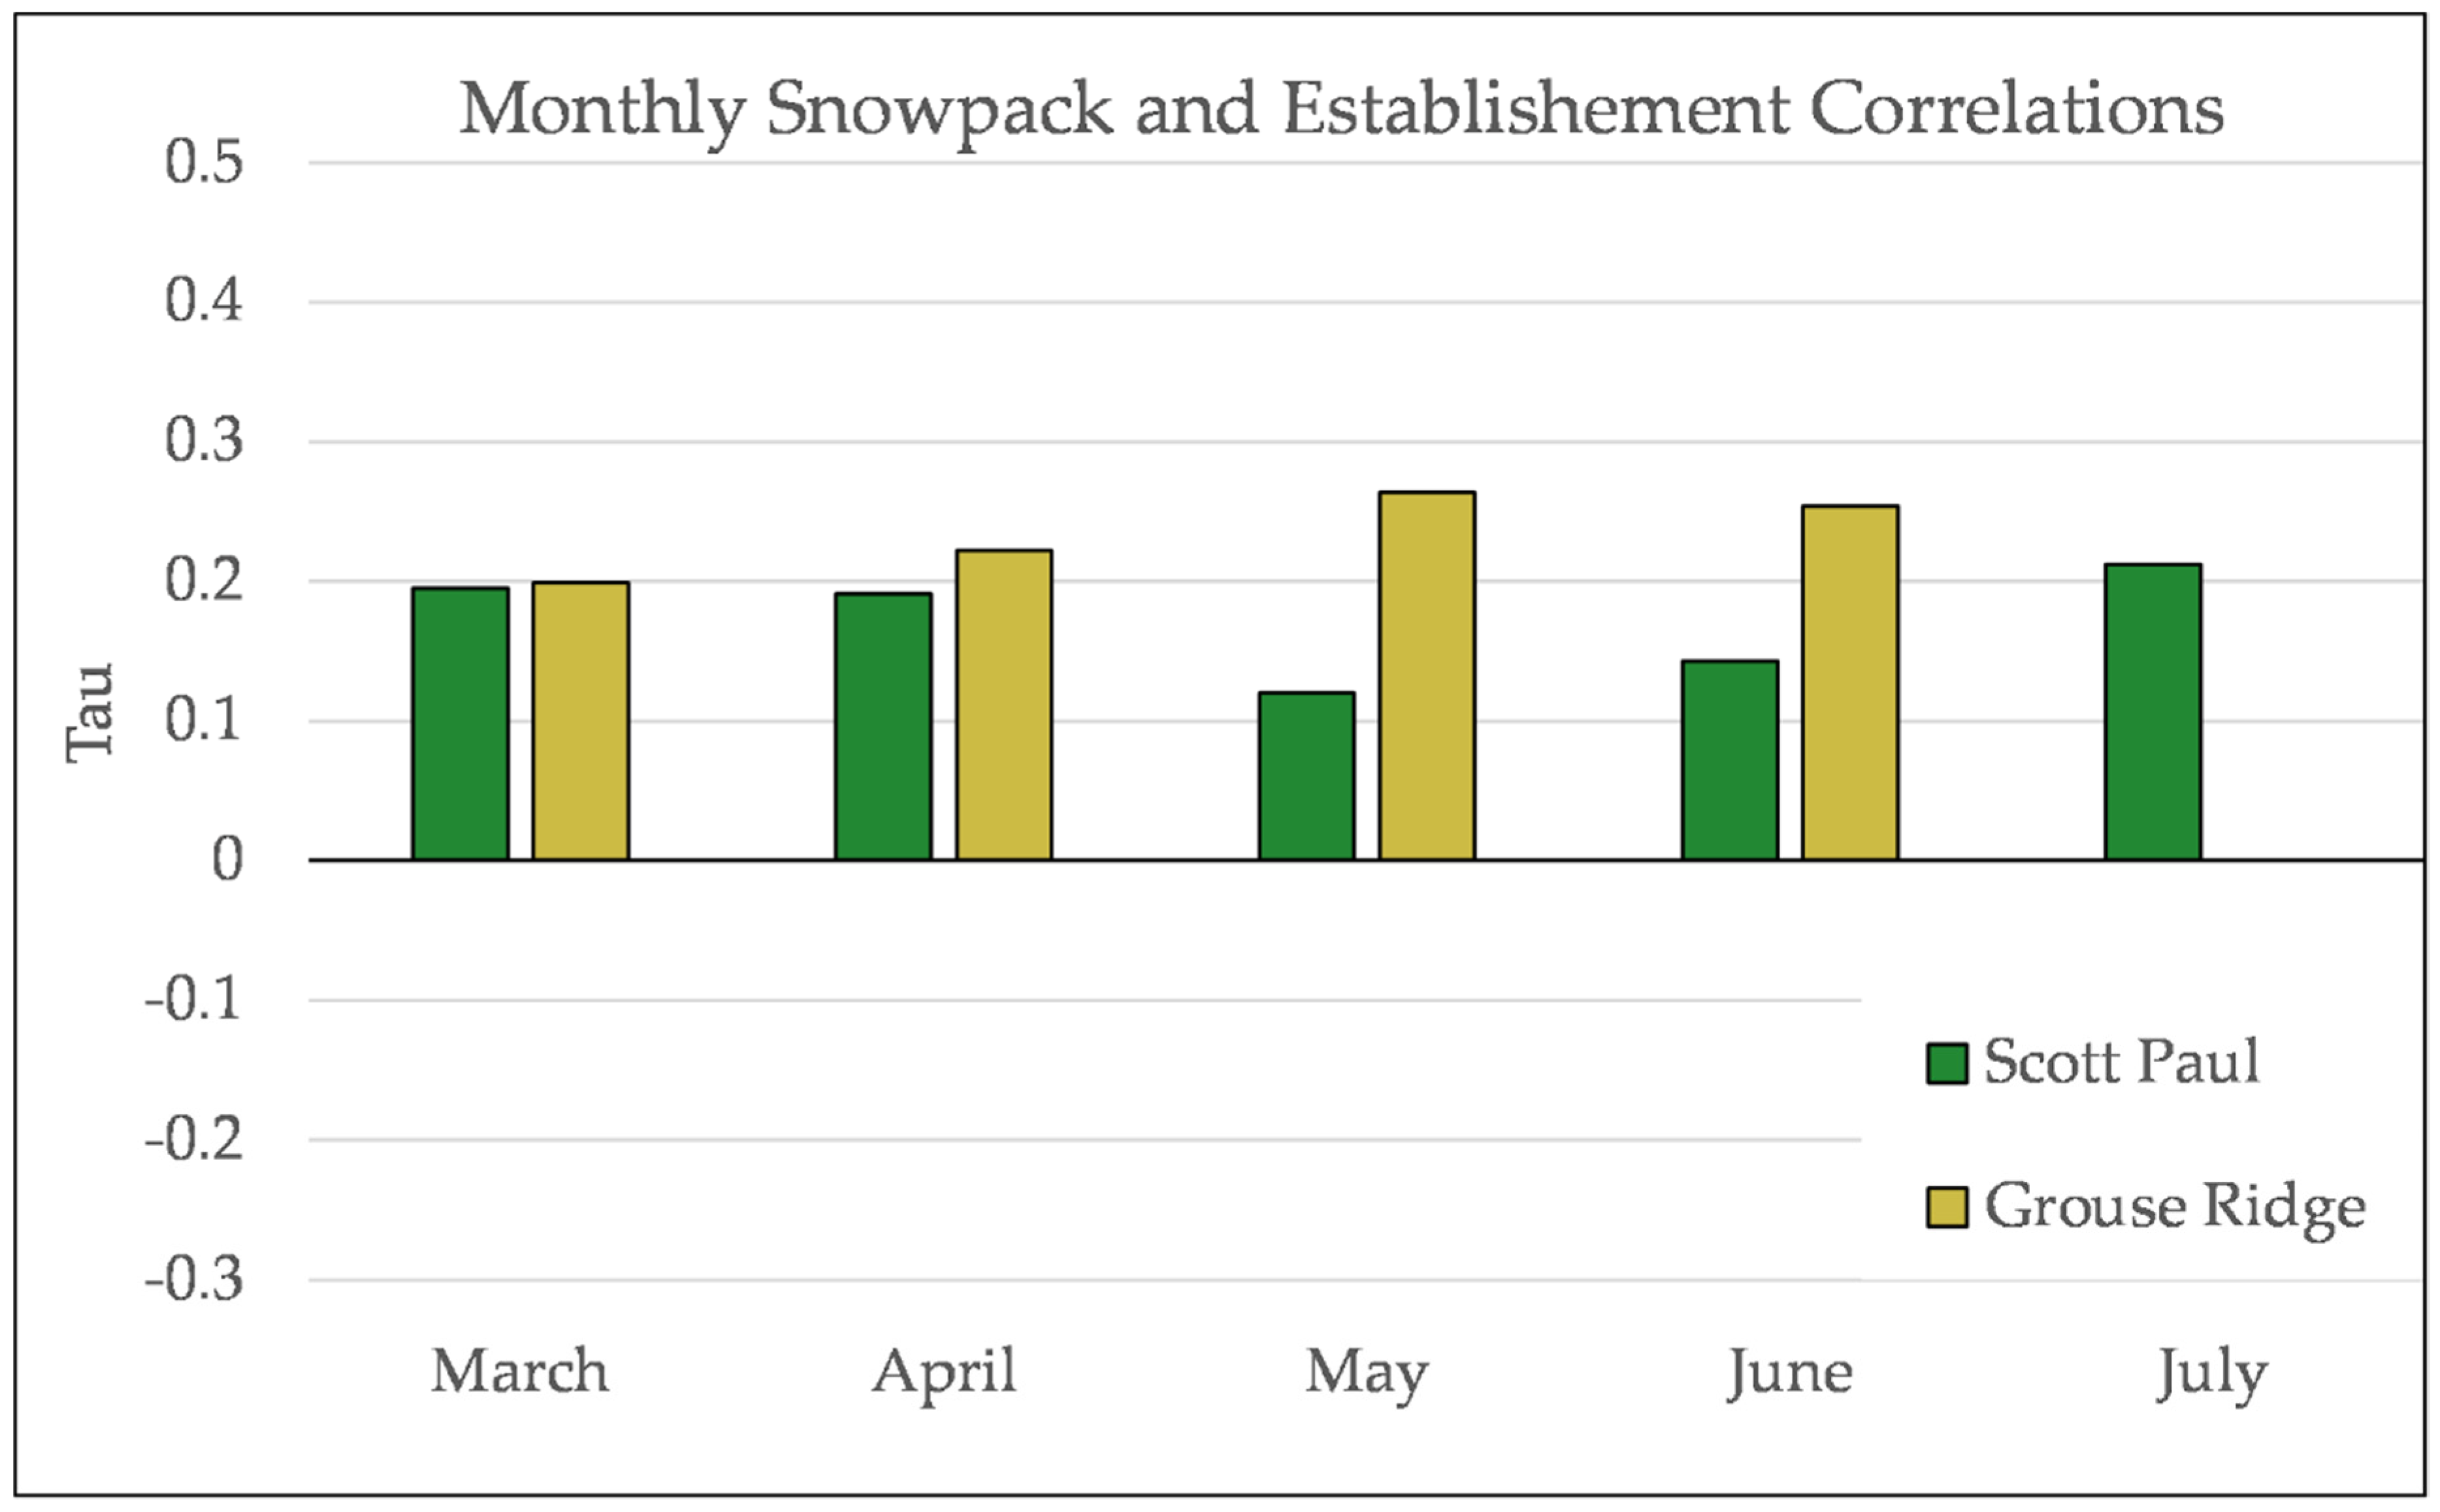
Figure A15.
Partial Kendall’s correlation controlled for temperature between snowpack and establishment at Grouse Ridge. * = p-value < 0.05. July is not included for snowpack at Grouse Ridge because there is rarely any snowpack at Grouse Ridge in July.
Figure A15.
Partial Kendall’s correlation controlled for temperature between snowpack and establishment at Grouse Ridge. * = p-value < 0.05. July is not included for snowpack at Grouse Ridge because there is rarely any snowpack at Grouse Ridge in July.
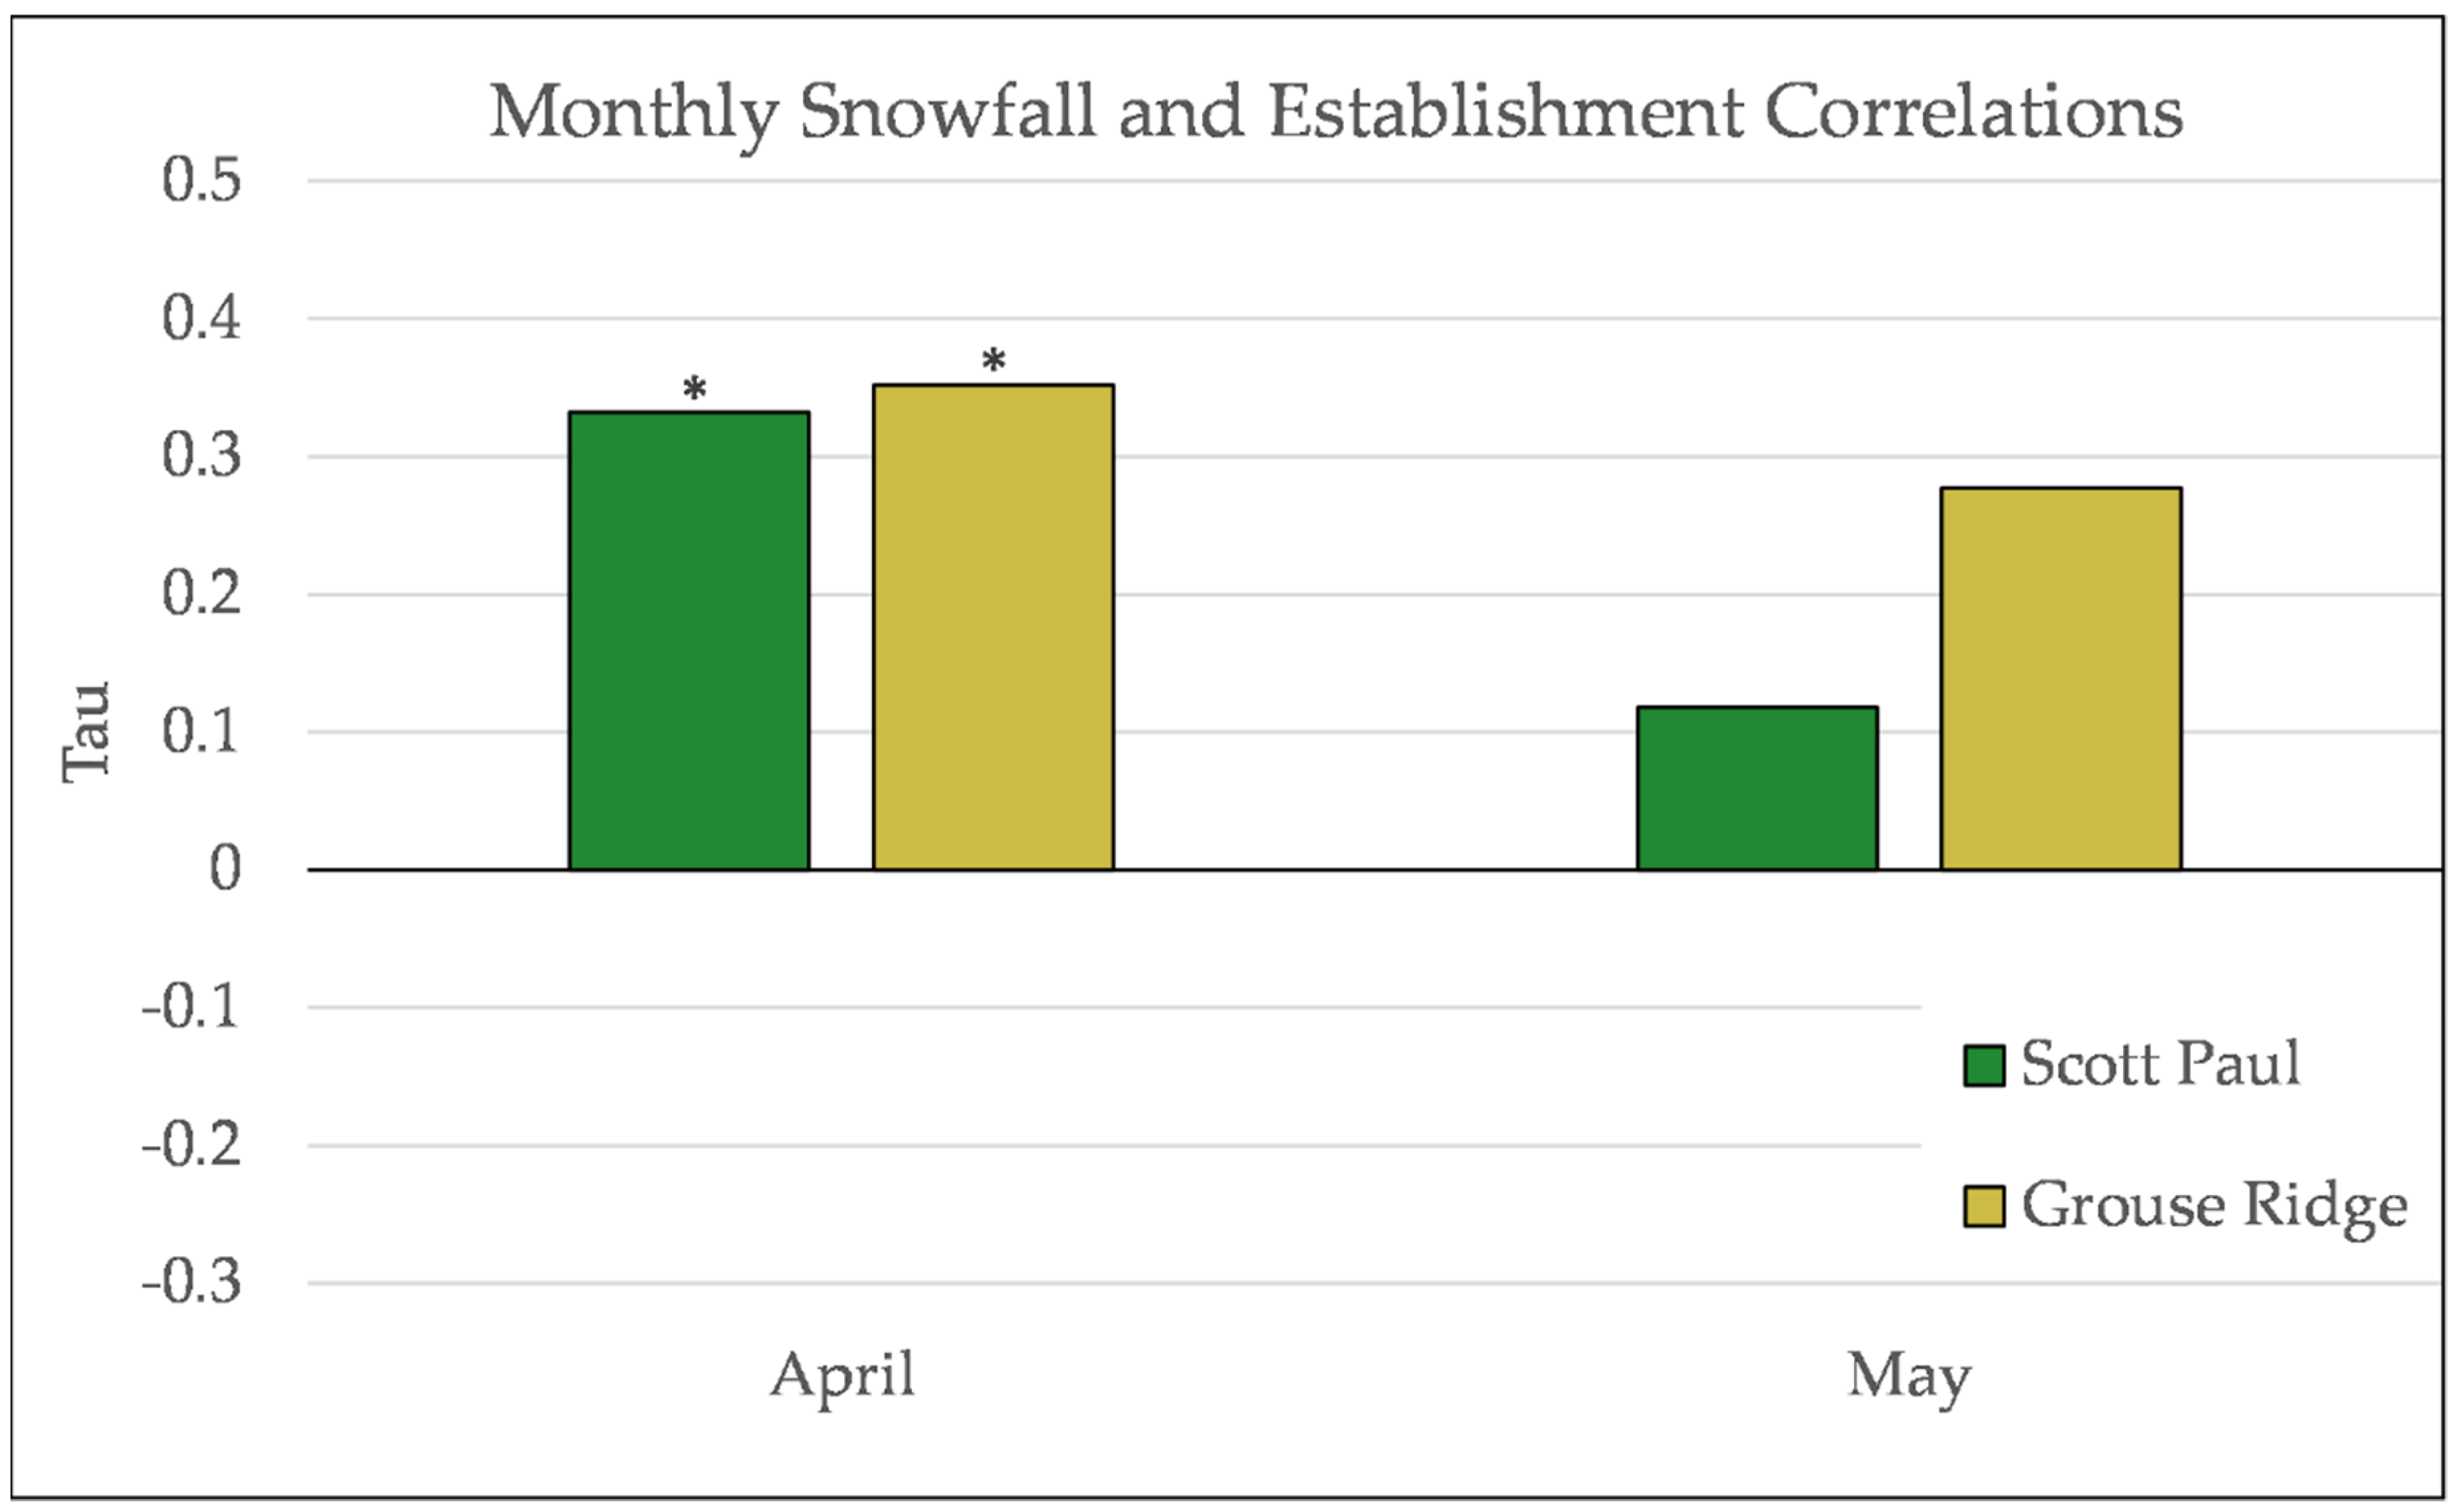
Figure A16.
Partial Kendall’s correlation controlled for temperature between snowfall and establishment at Scott Paul. * = p-value < 0.05.
Figure A16.
Partial Kendall’s correlation controlled for temperature between snowfall and establishment at Scott Paul. * = p-value < 0.05.
Figure A17.
Partial Kendall’s correlation controlled for temperature between snowfall and establishment at Grouse Ridge. * = p-value < 0.05.
Figure A17.
Partial Kendall’s correlation controlled for temperature between snowfall and establishment at Grouse Ridge. * = p-value < 0.05.
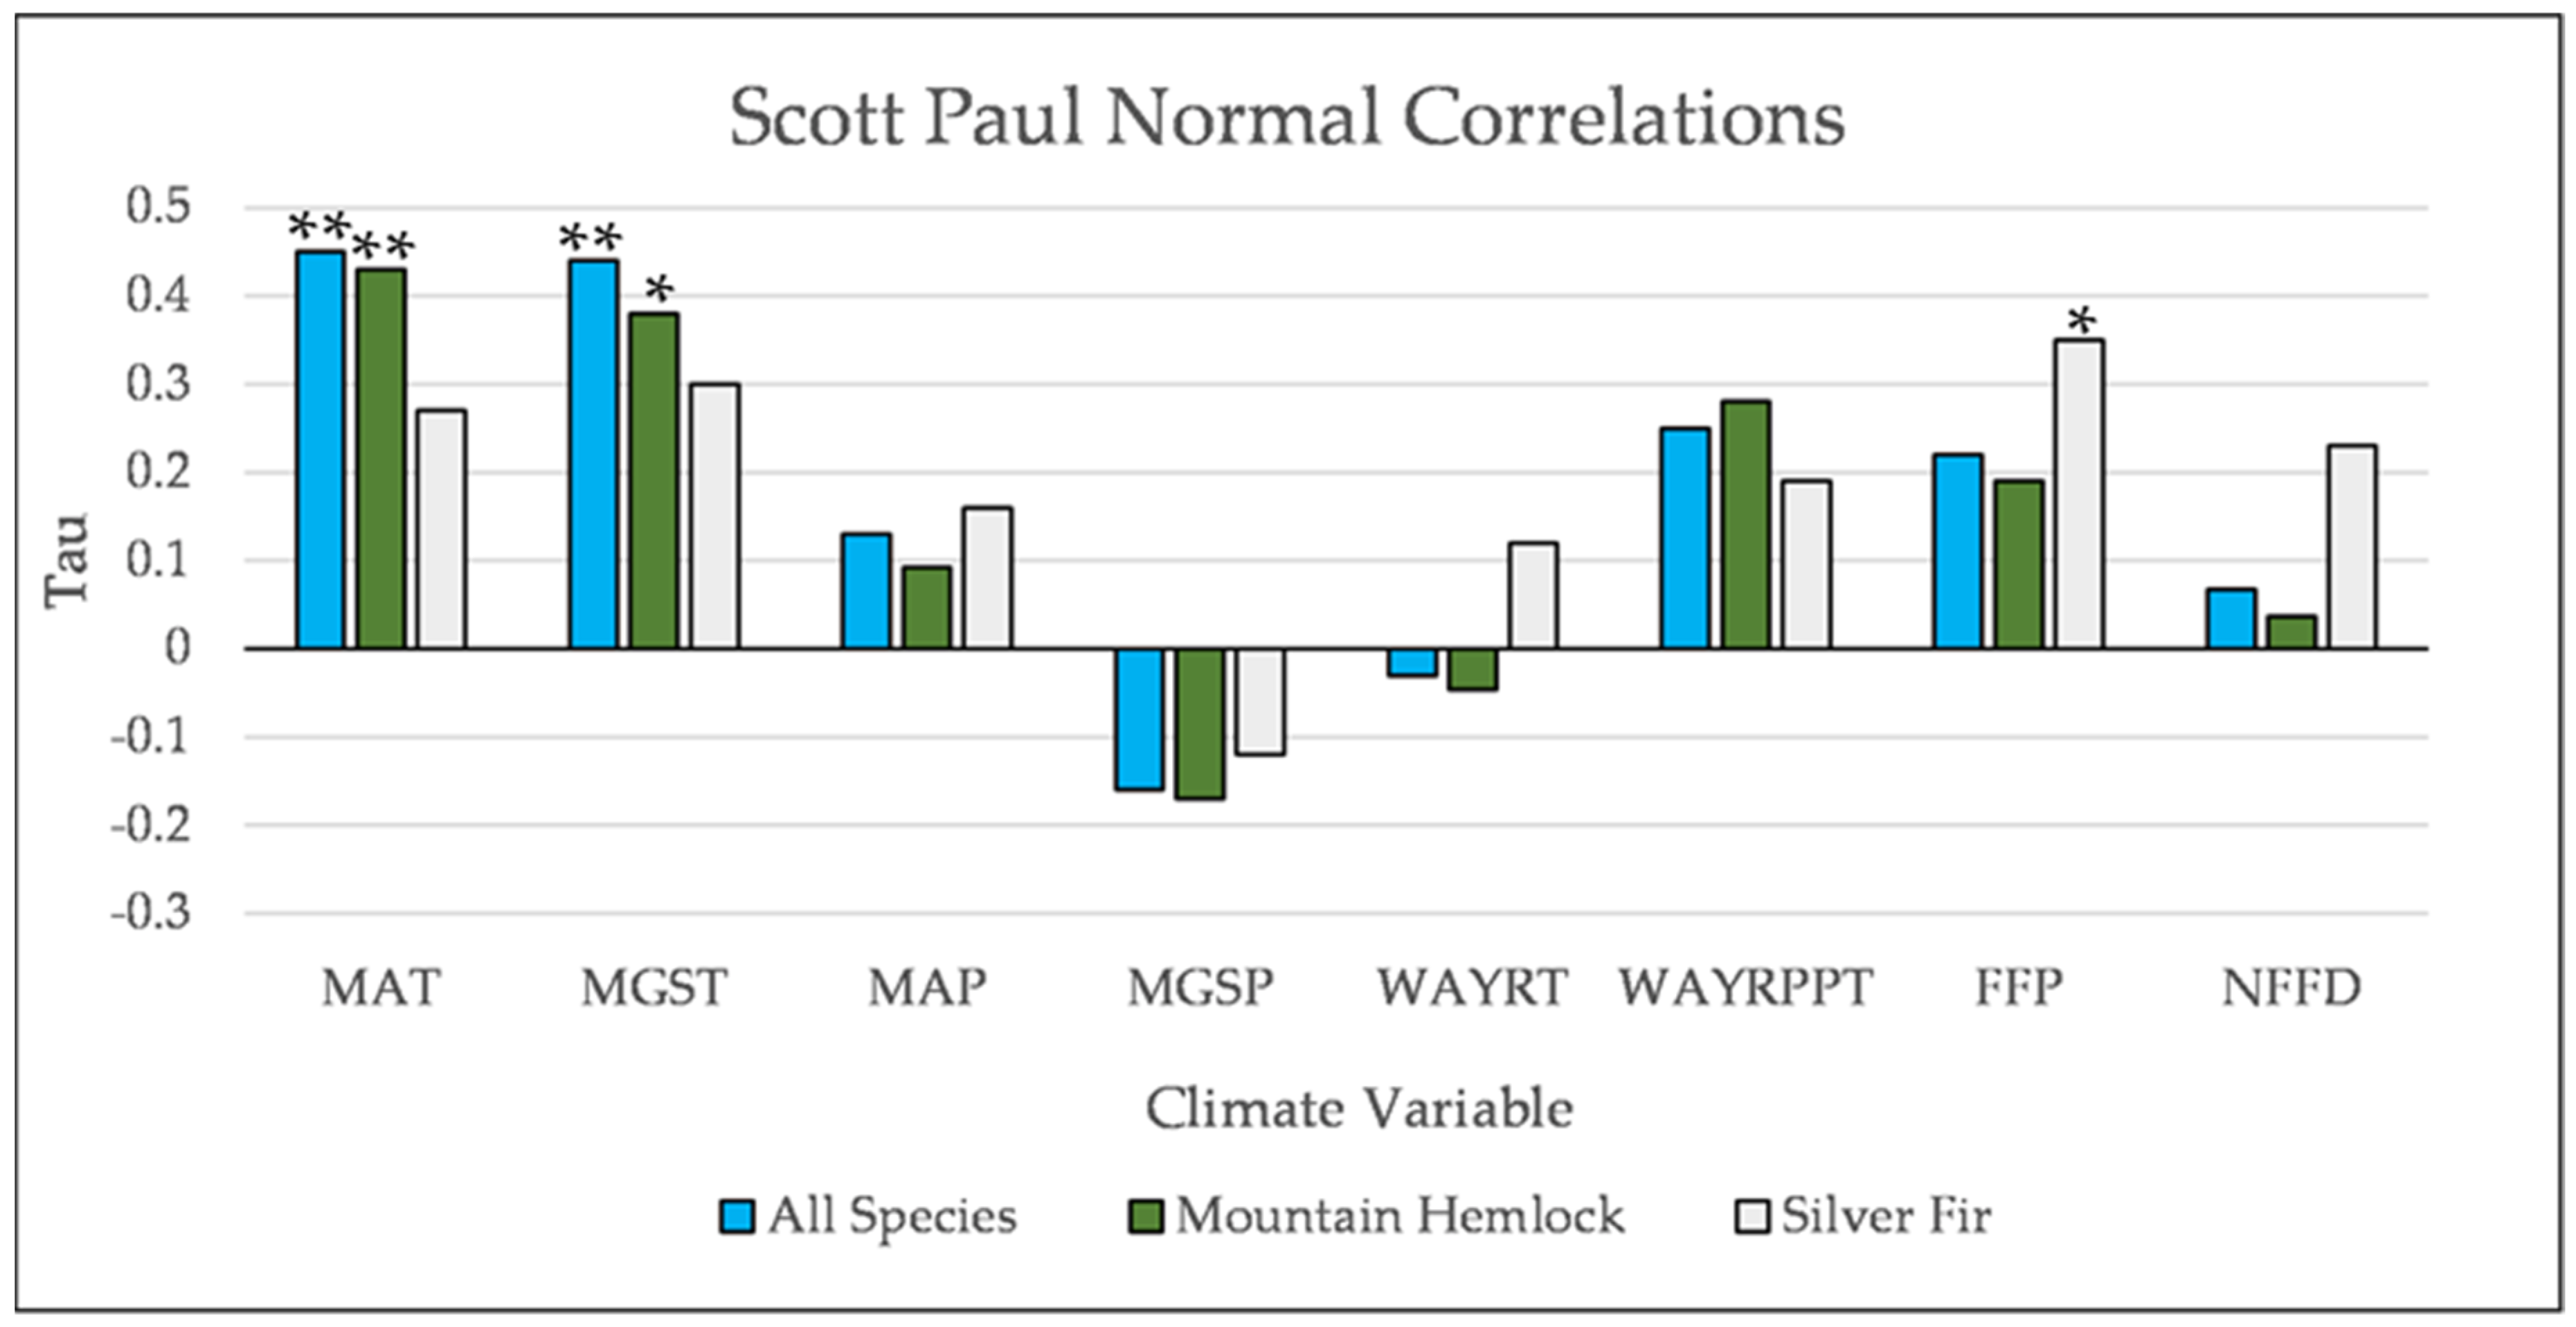
Figure A18.
Normal Kendall’s correlations between establishment and annual and seasonal climate variables at Scott Paul. * = p-value < 0.05, ** = p-value < 0.01. Mean Annual Temperature (MAT), Mean Growing Season Temperature (MGST), Mean Annual Precipitation (MAP), Mean Growing Season Precipitation (MGSP), Mean Water Year Temperature (MWYT), Mean Water Year Precipitation (MWYP), Frost Free Period (FFP), and Number of Frost Free Days (NFFD).
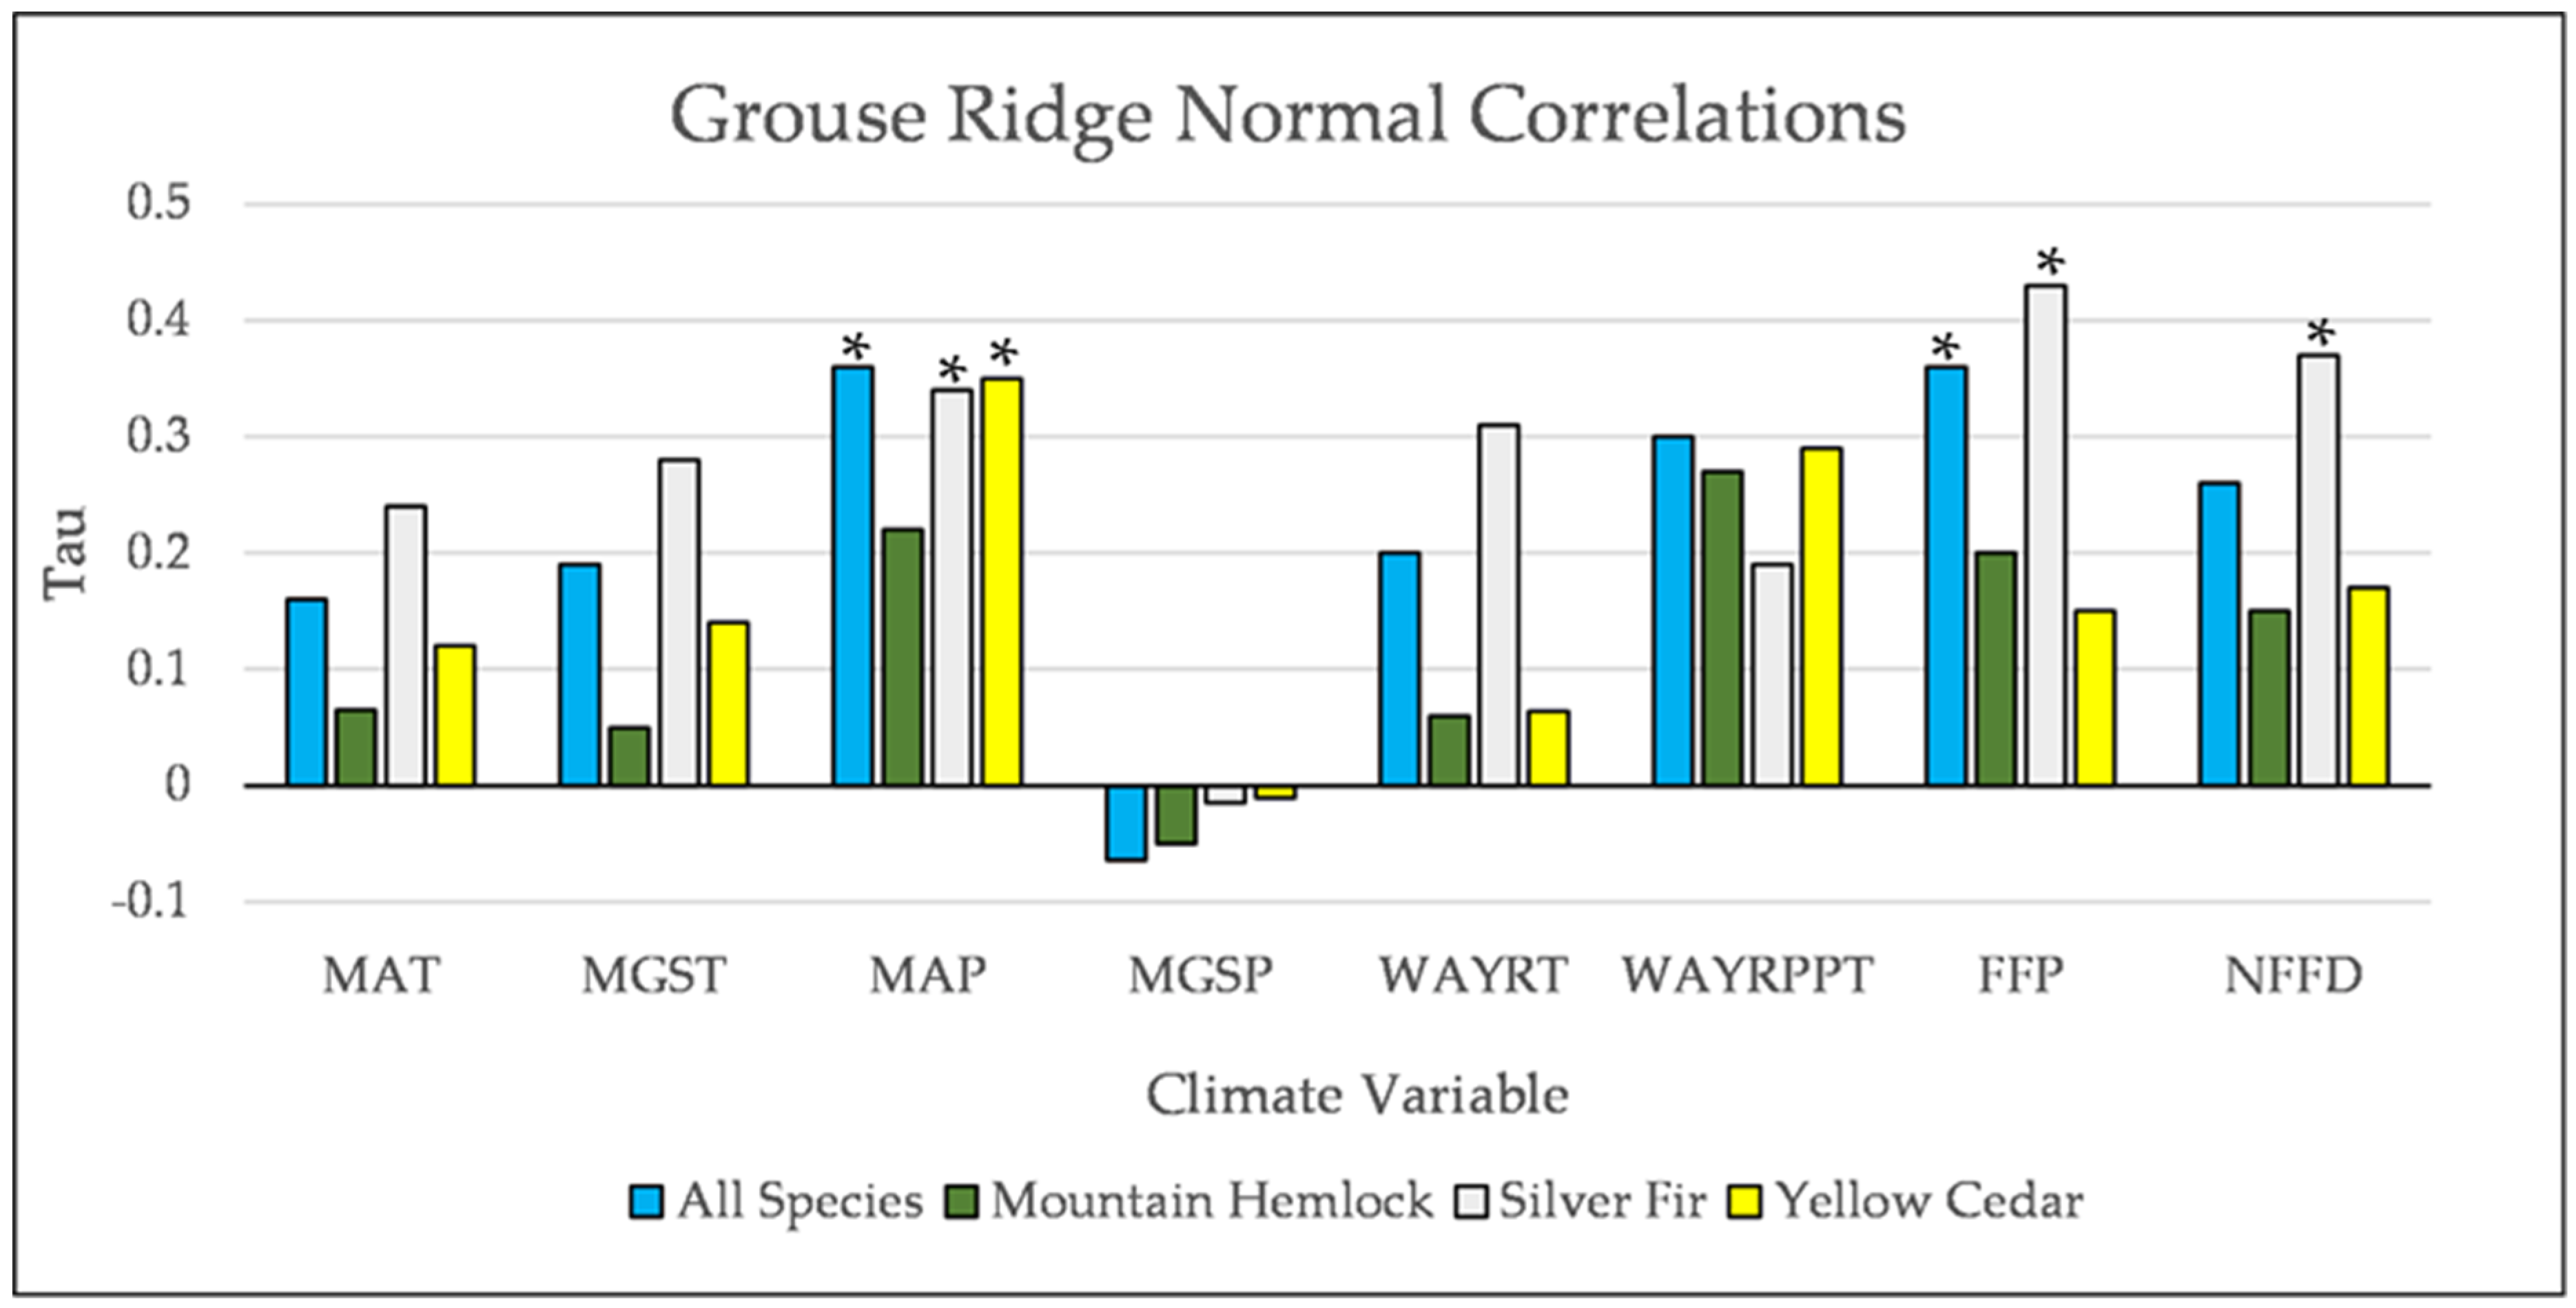
Figure A19.
Normal Kendall’s correlations between establishment and annual and seasonal climate variables at Grouse Ridge. * = p-value < 0.05. Mean Annual Temperature (MAT), Mean Growing Season Temperature (MGST), Mean Annual Precipitation (MAP), Mean Growing Season Precipitation (MGSP), Mean Water Year Temperature (MWYT), Mean Water Year Precipitation (MWYP), Frost Free Period (FFP), and Number of Frost Free Days (NFFD).
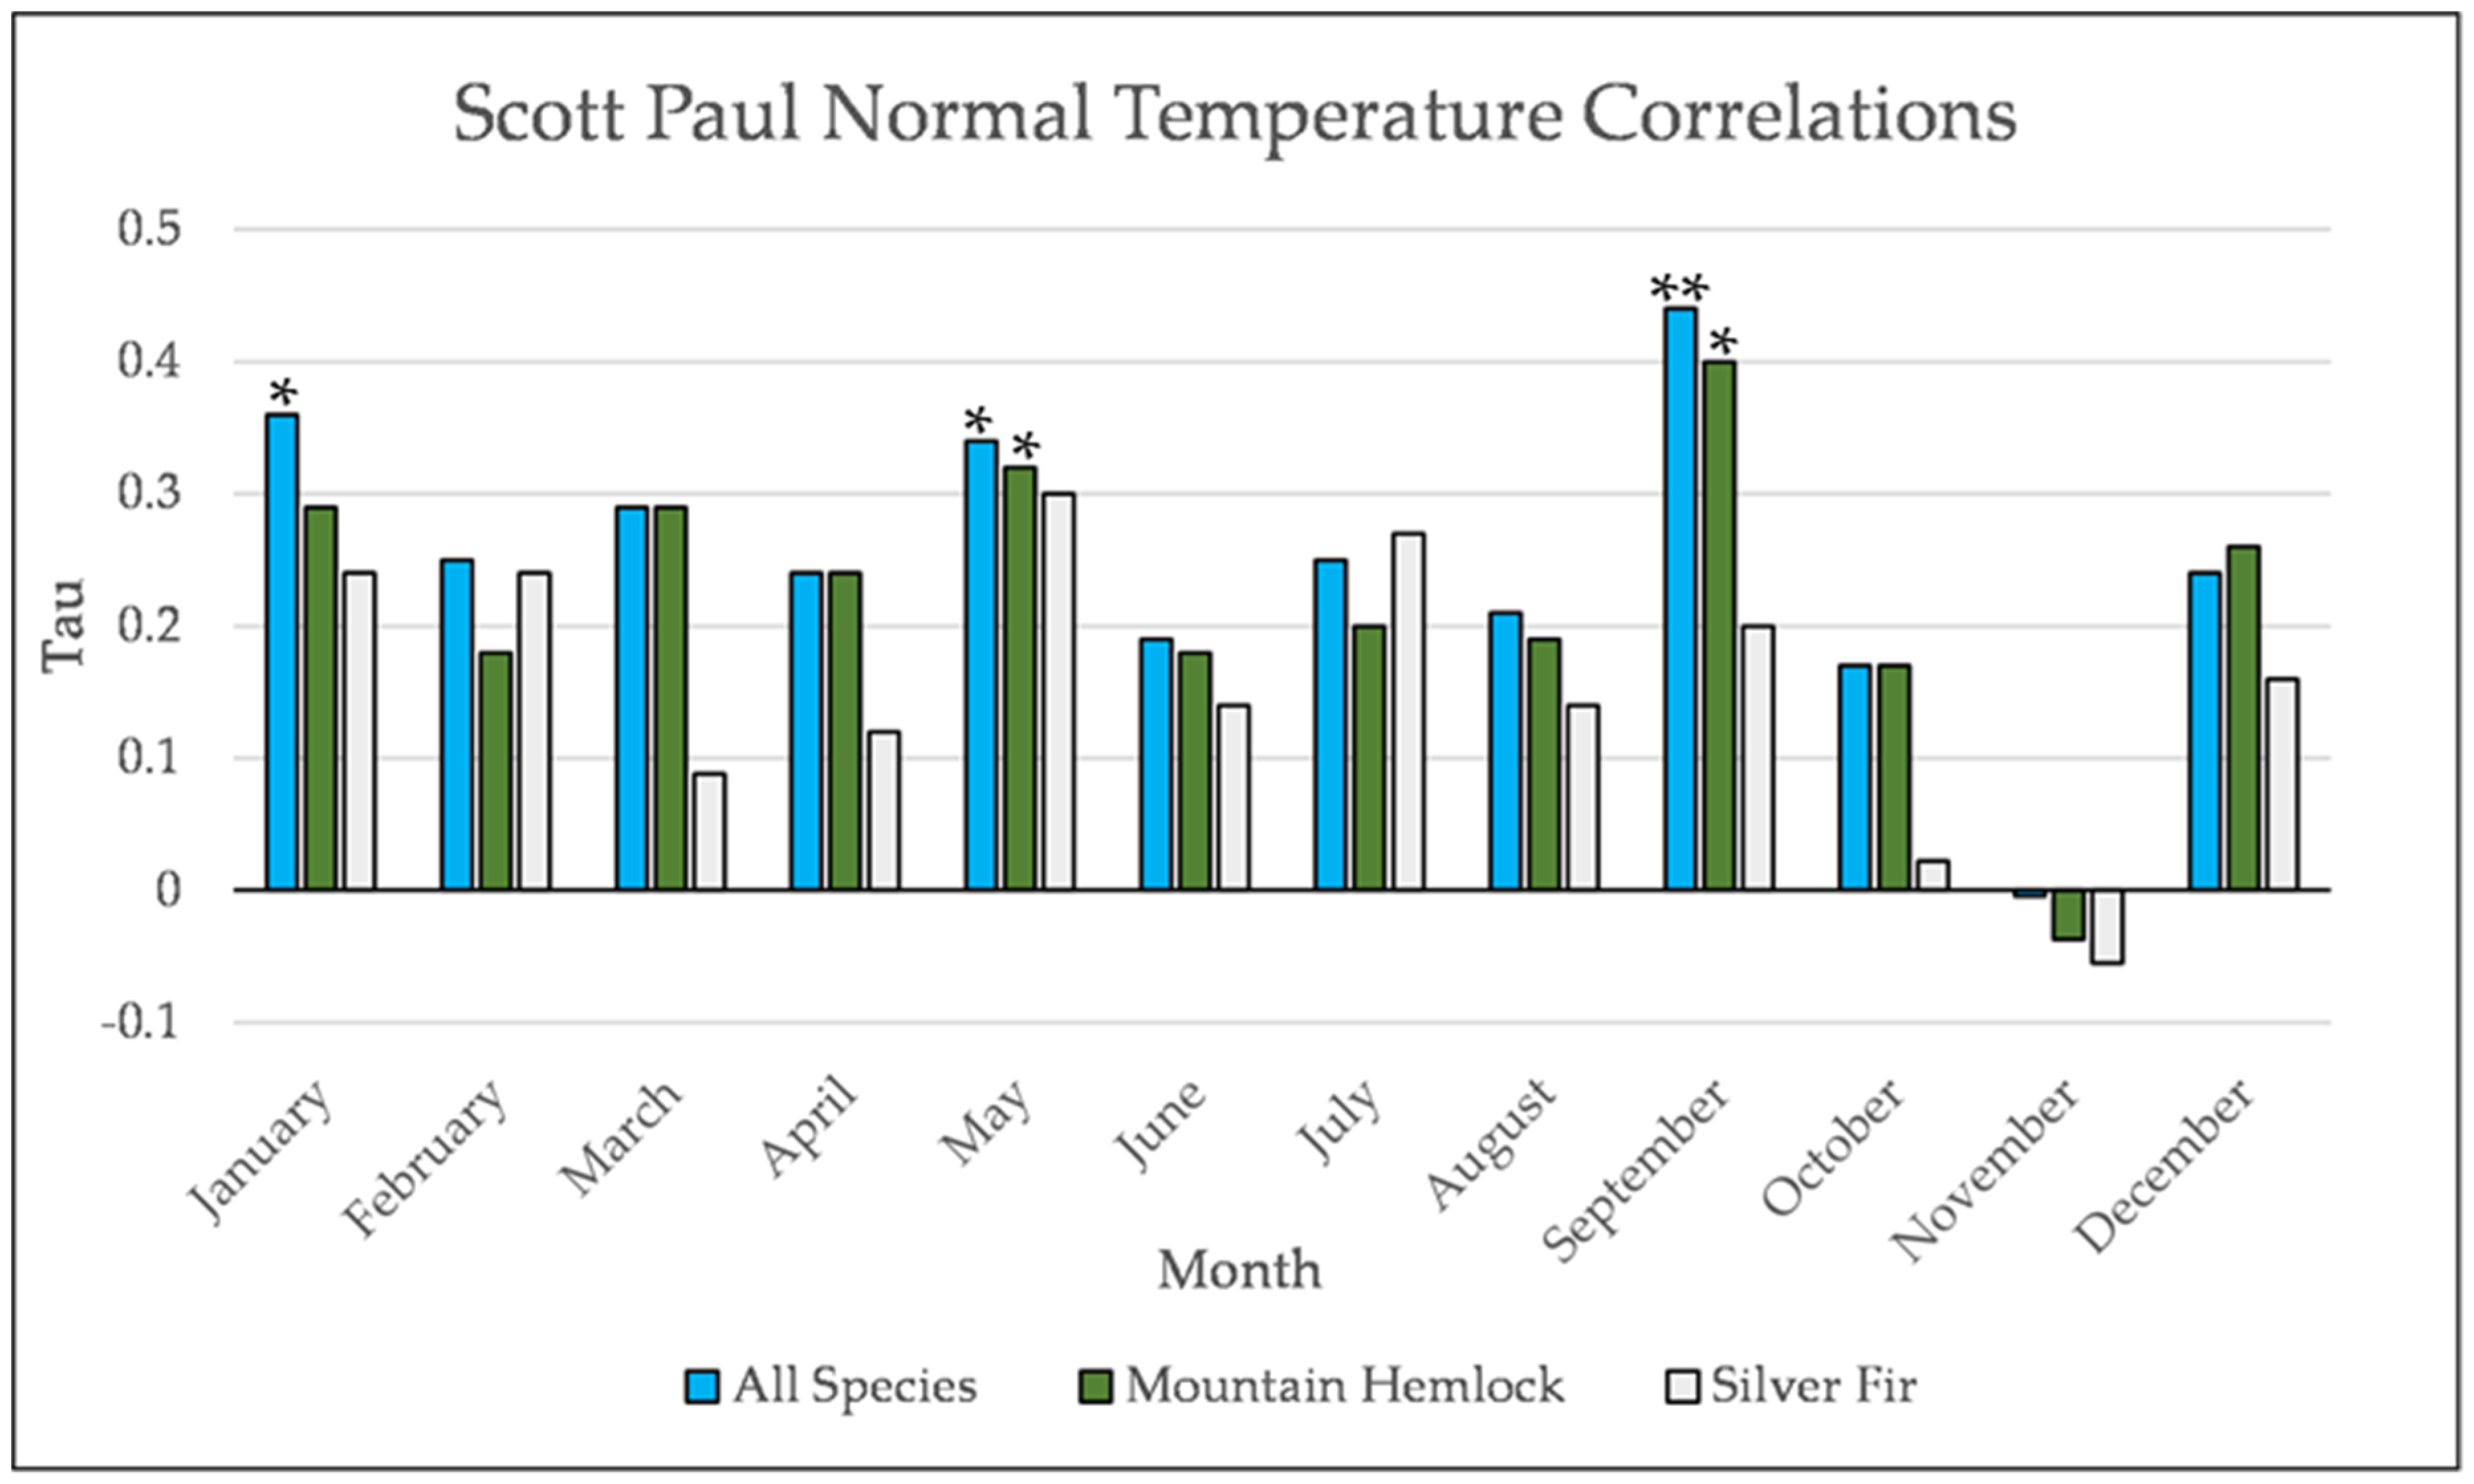
Figure A20.
Normal Kendall’s correlation between mean monthly temperature and establishment at the Scott Paul site. * = p-value < 0.05, ** = p-value < 0.01.
Figure A20.
Normal Kendall’s correlation between mean monthly temperature and establishment at the Scott Paul site. * = p-value < 0.05, ** = p-value < 0.01.
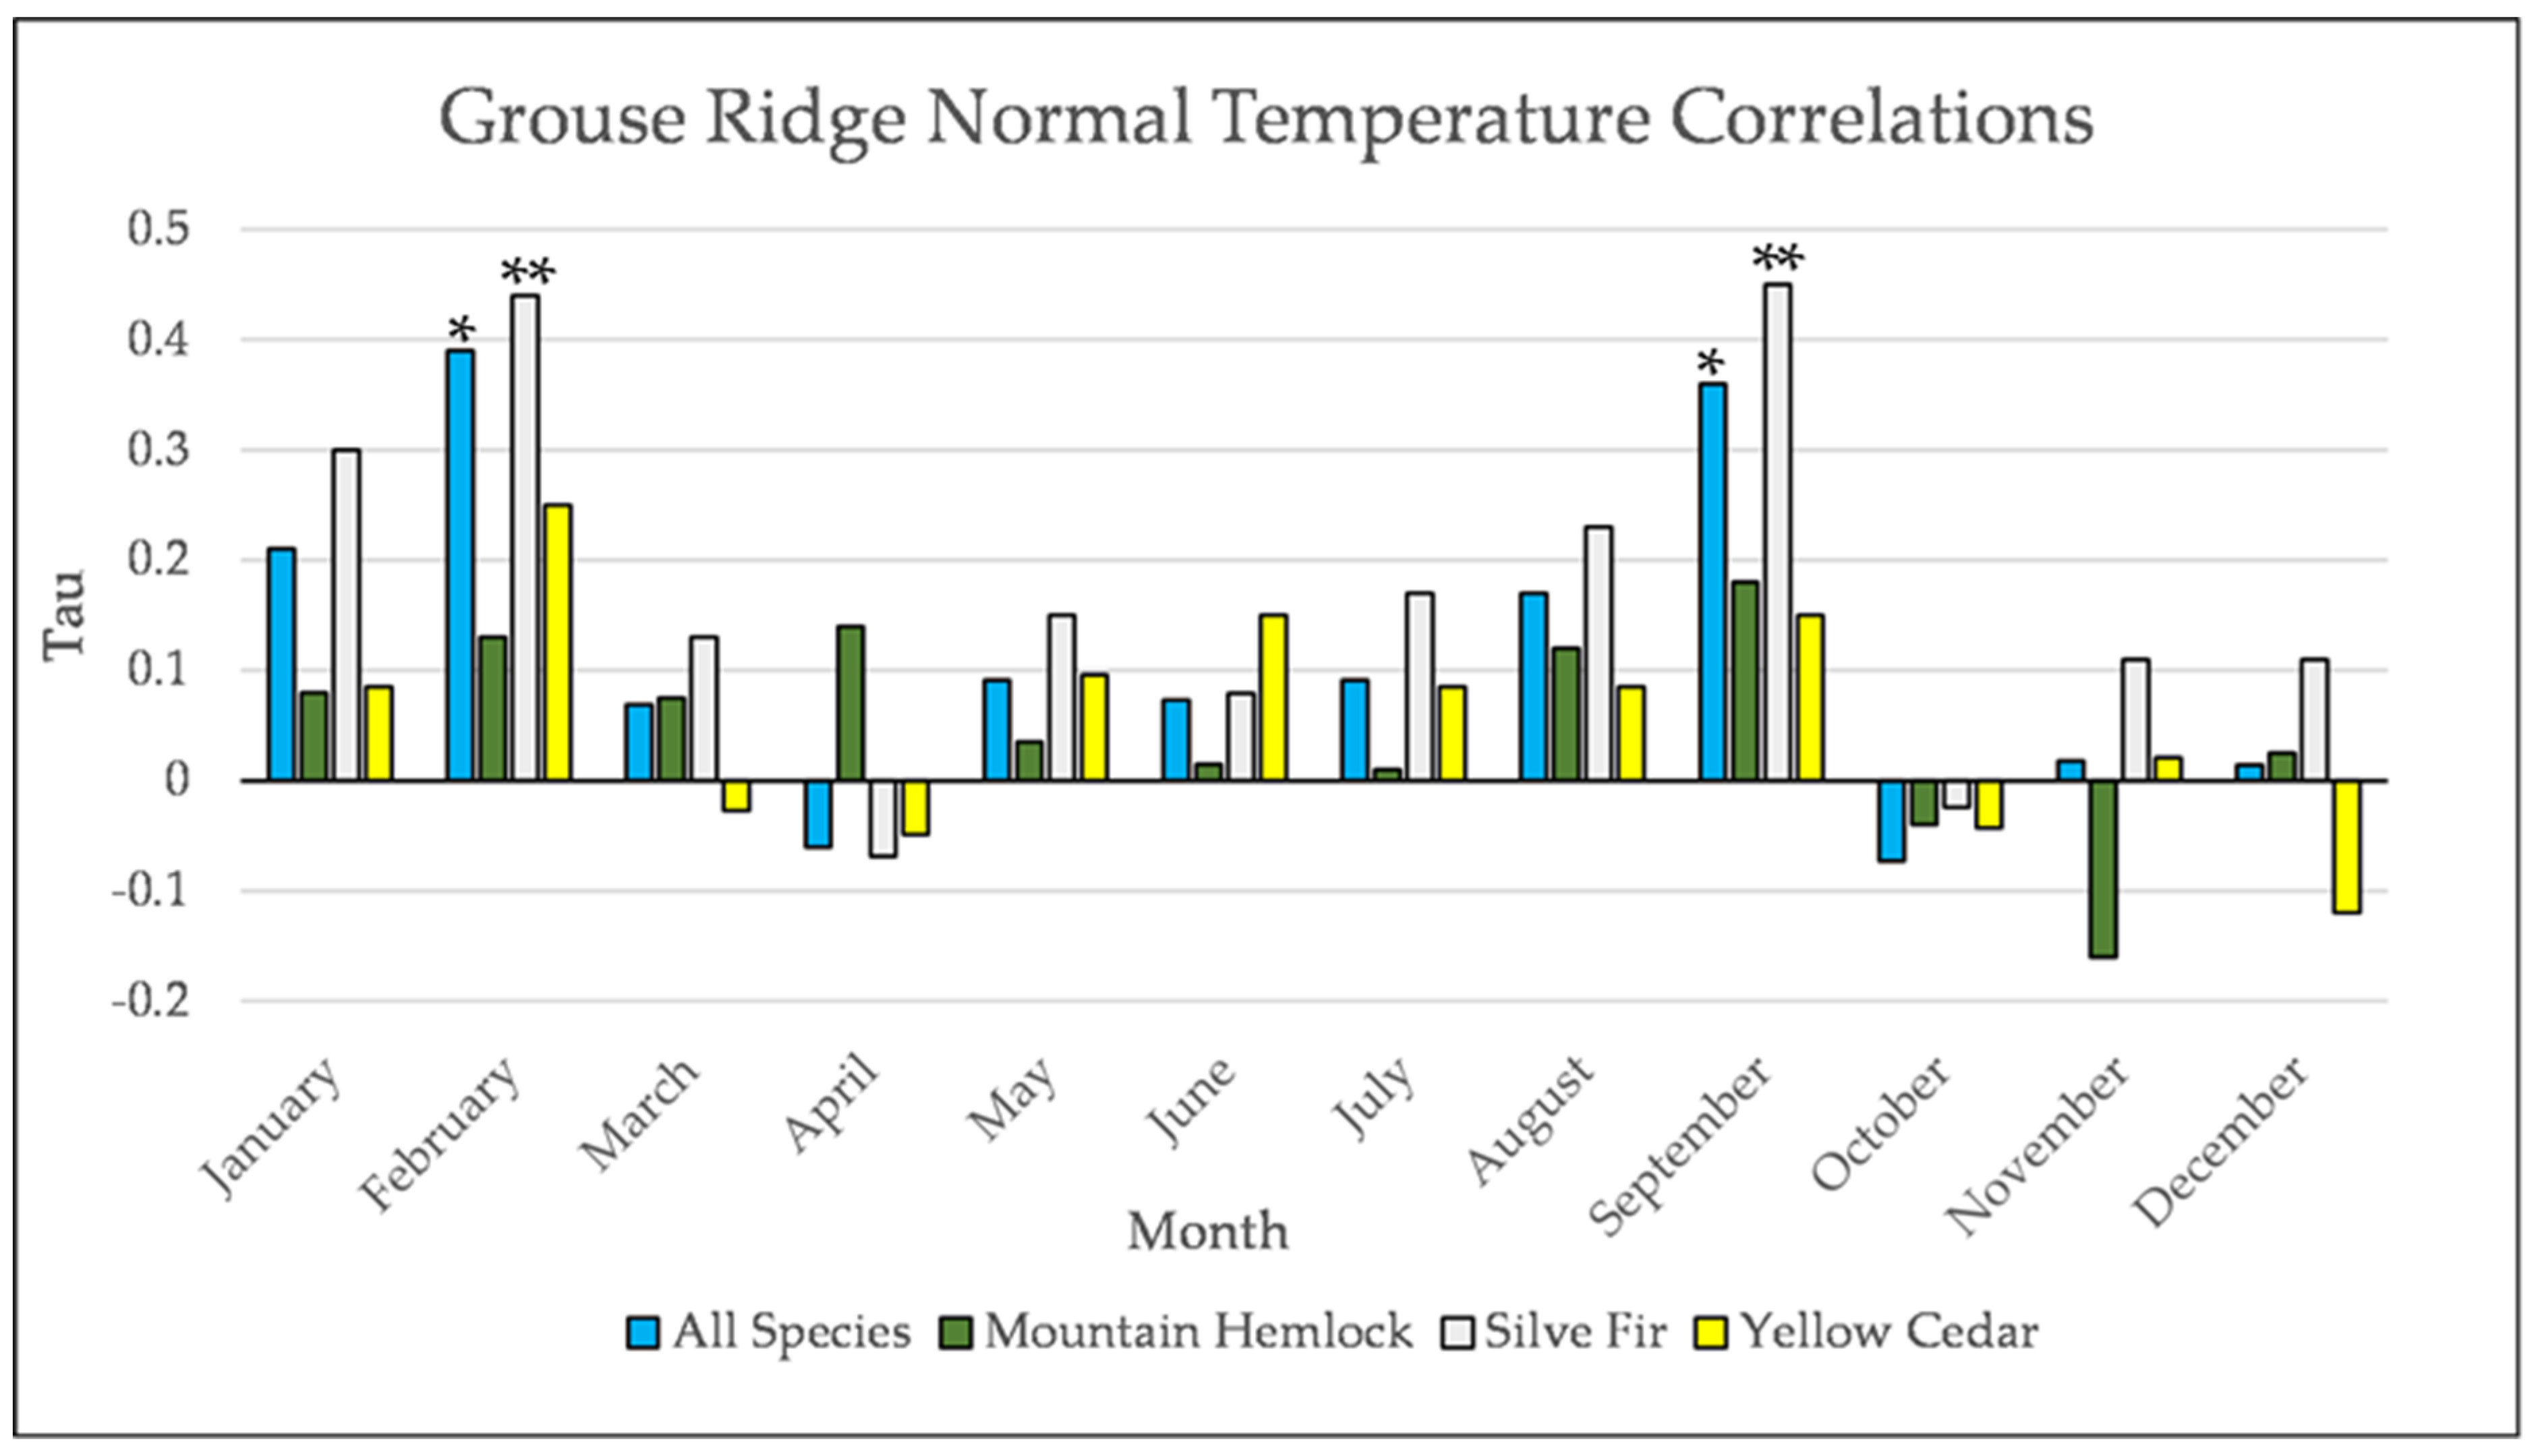
Figure A21.
Normal Kendall’s correlation between mean monthly temperature and establishment at the Grouse Ridge site * = p-value < 0.05, ** = p-value < 0.01.
Figure A21.
Normal Kendall’s correlation between mean monthly temperature and establishment at the Grouse Ridge site * = p-value < 0.05, ** = p-value < 0.01.
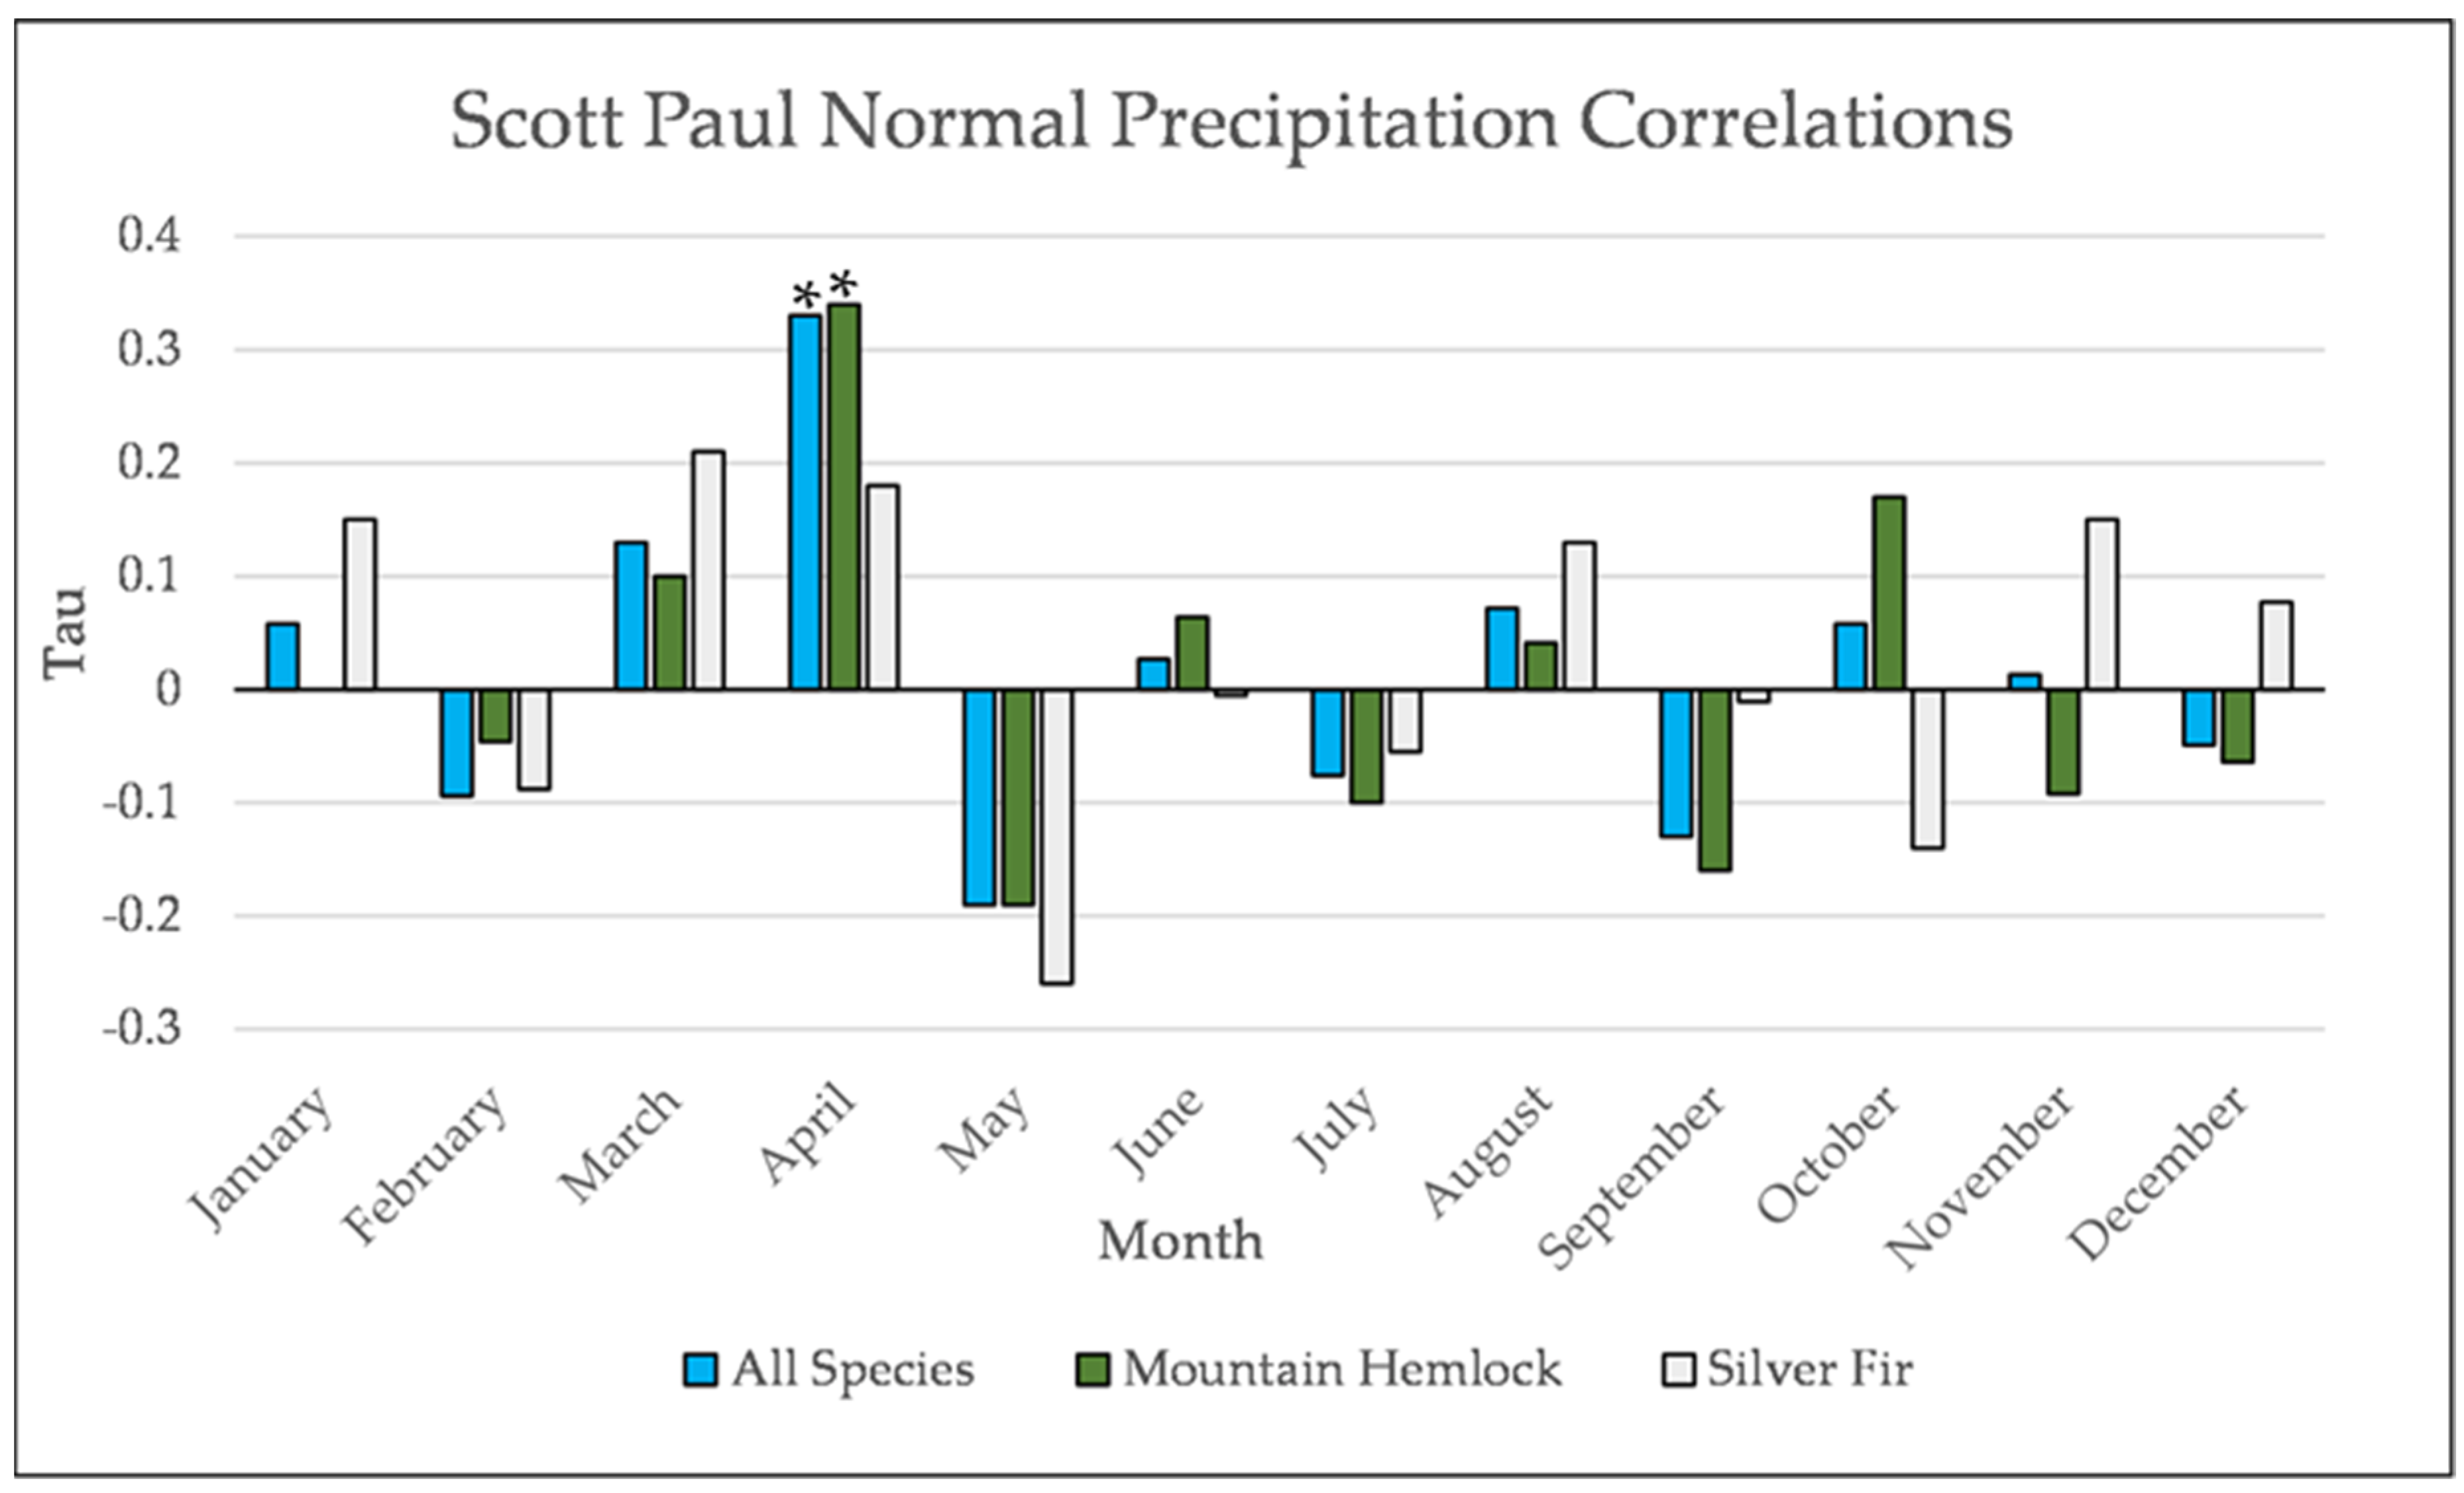
Figure A22.
Normal Kendall’s correlation between mean monthly precipitation and establishment at the Scott Paul site. * = p-value < 0.05.
Figure A22.
Normal Kendall’s correlation between mean monthly precipitation and establishment at the Scott Paul site. * = p-value < 0.05.
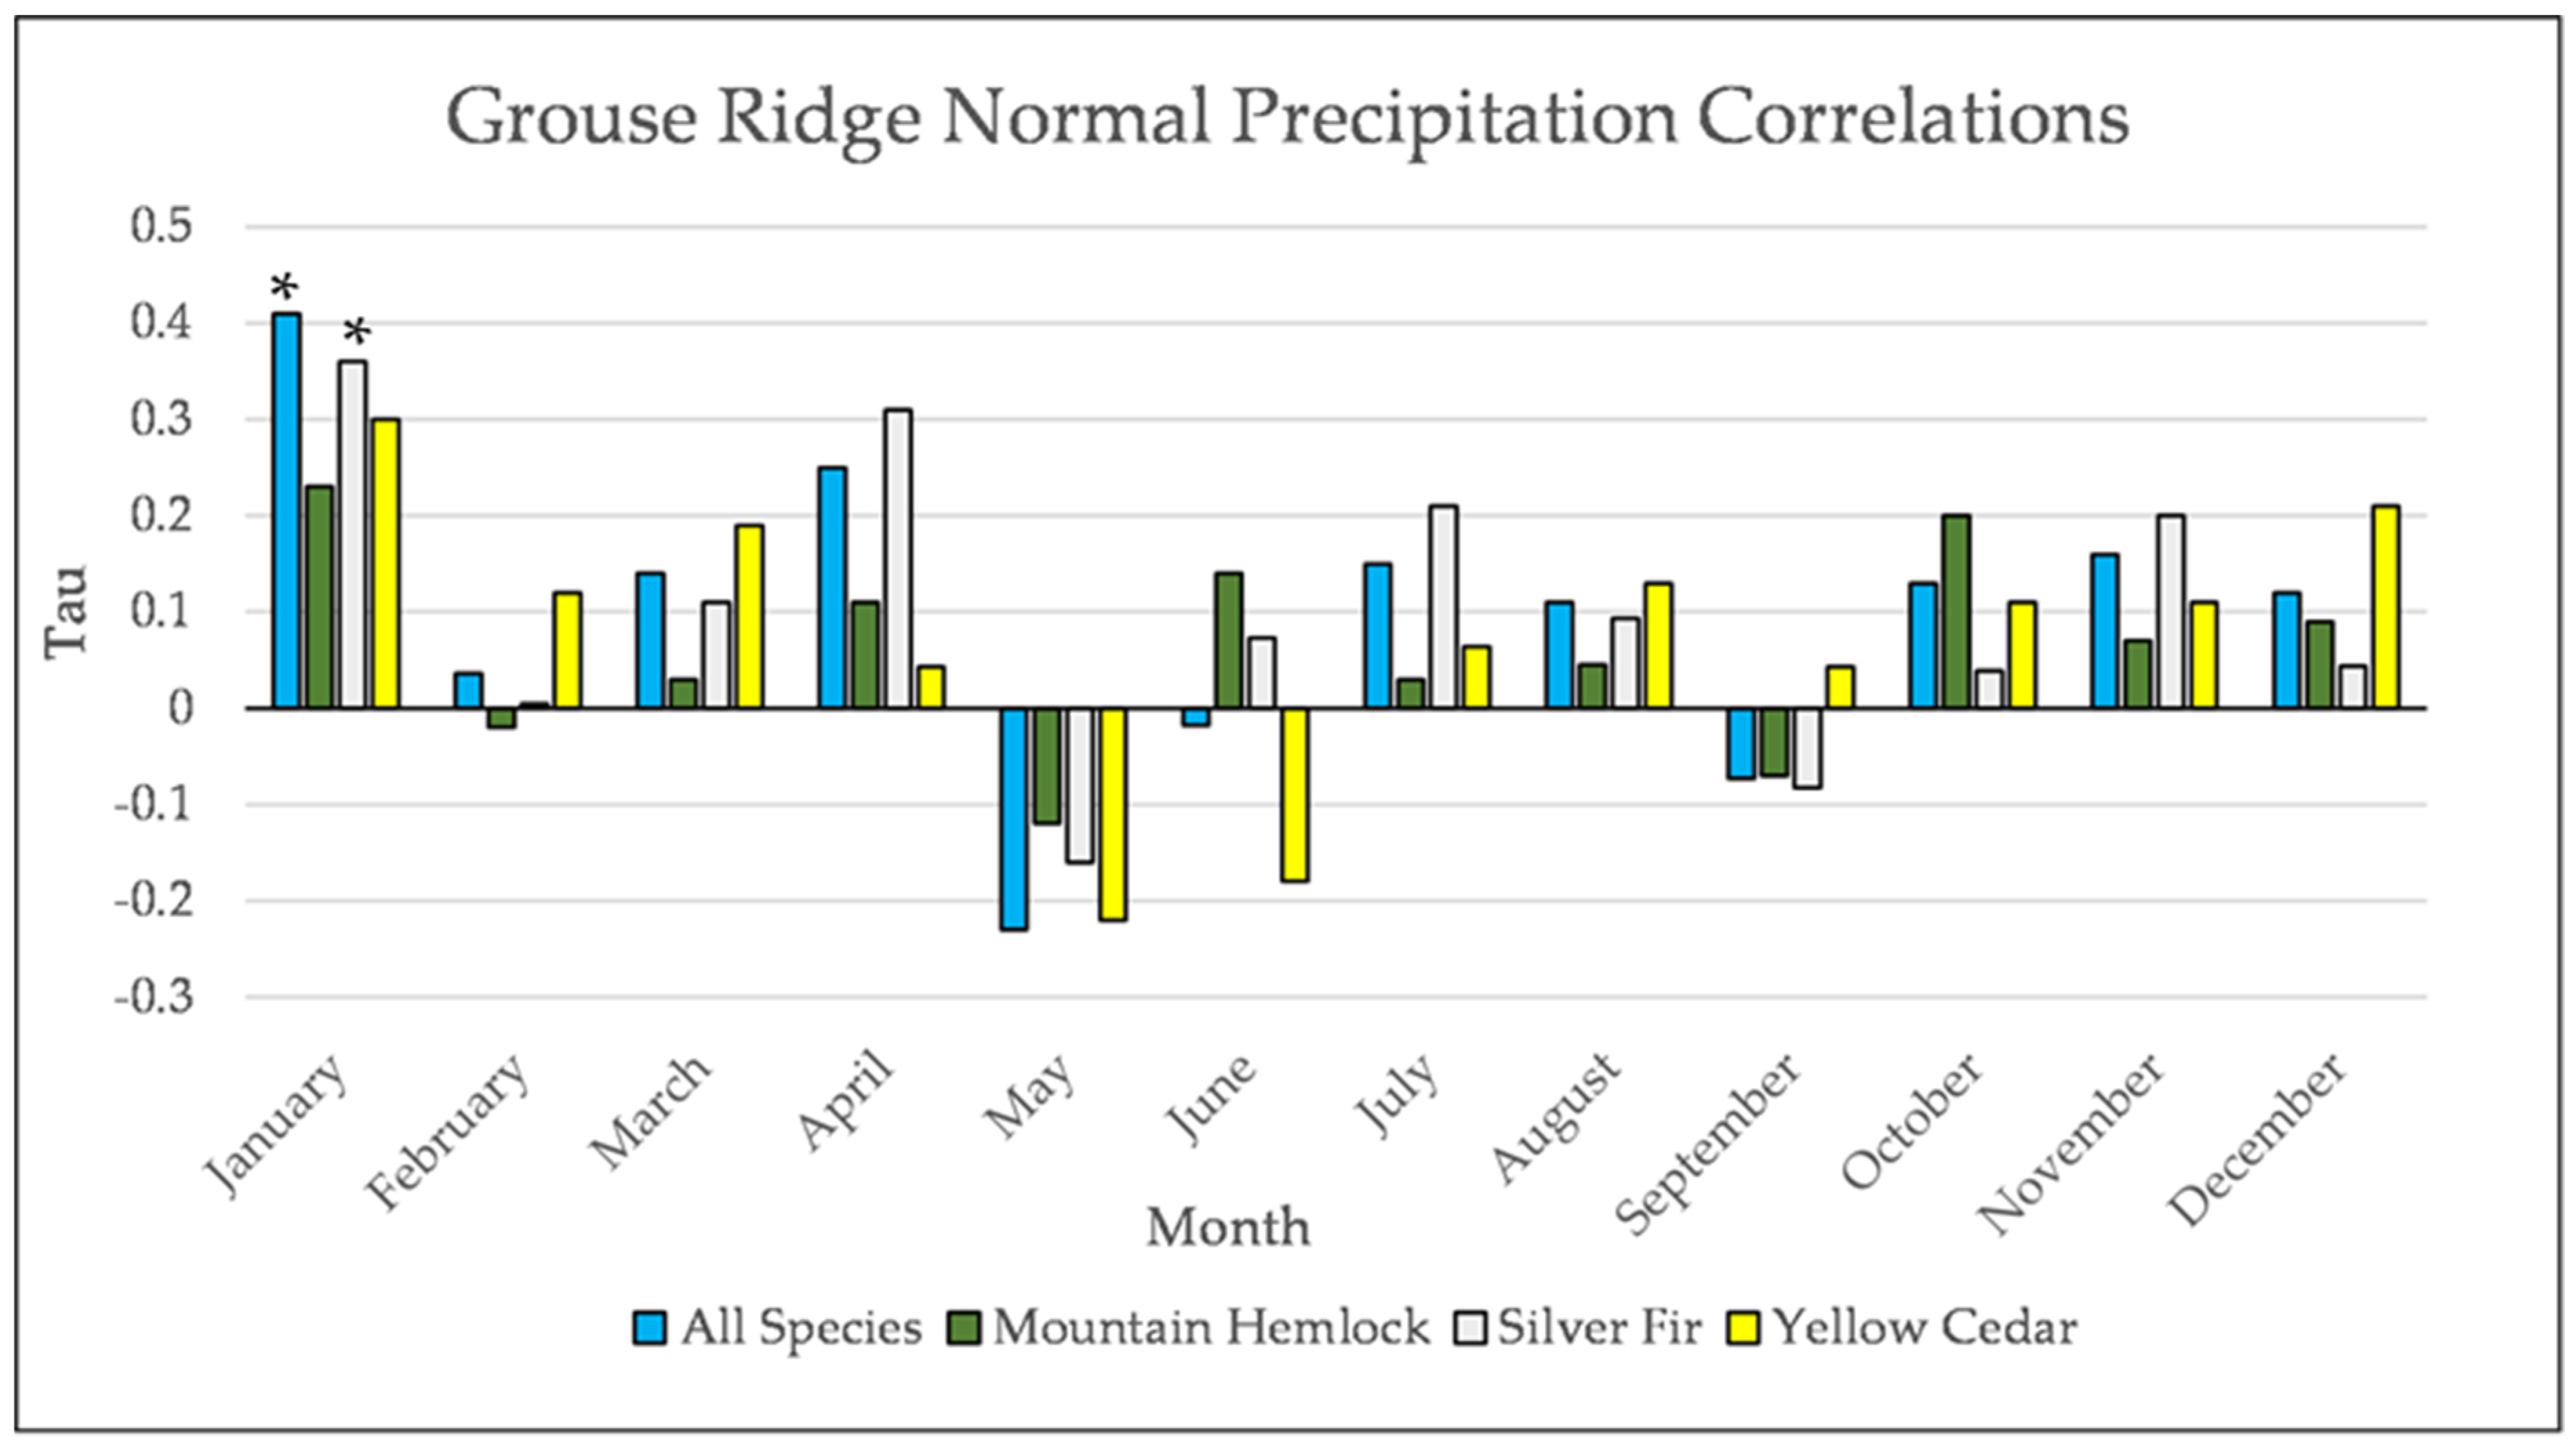
Figure A23.
Normal Kendall’s correlation between mean monthly precipitation and establishment at the Grouse Ridge site. * = p-value < 0.05.
Figure A23.
Normal Kendall’s correlation between mean monthly precipitation and establishment at the Grouse Ridge site. * = p-value < 0.05.
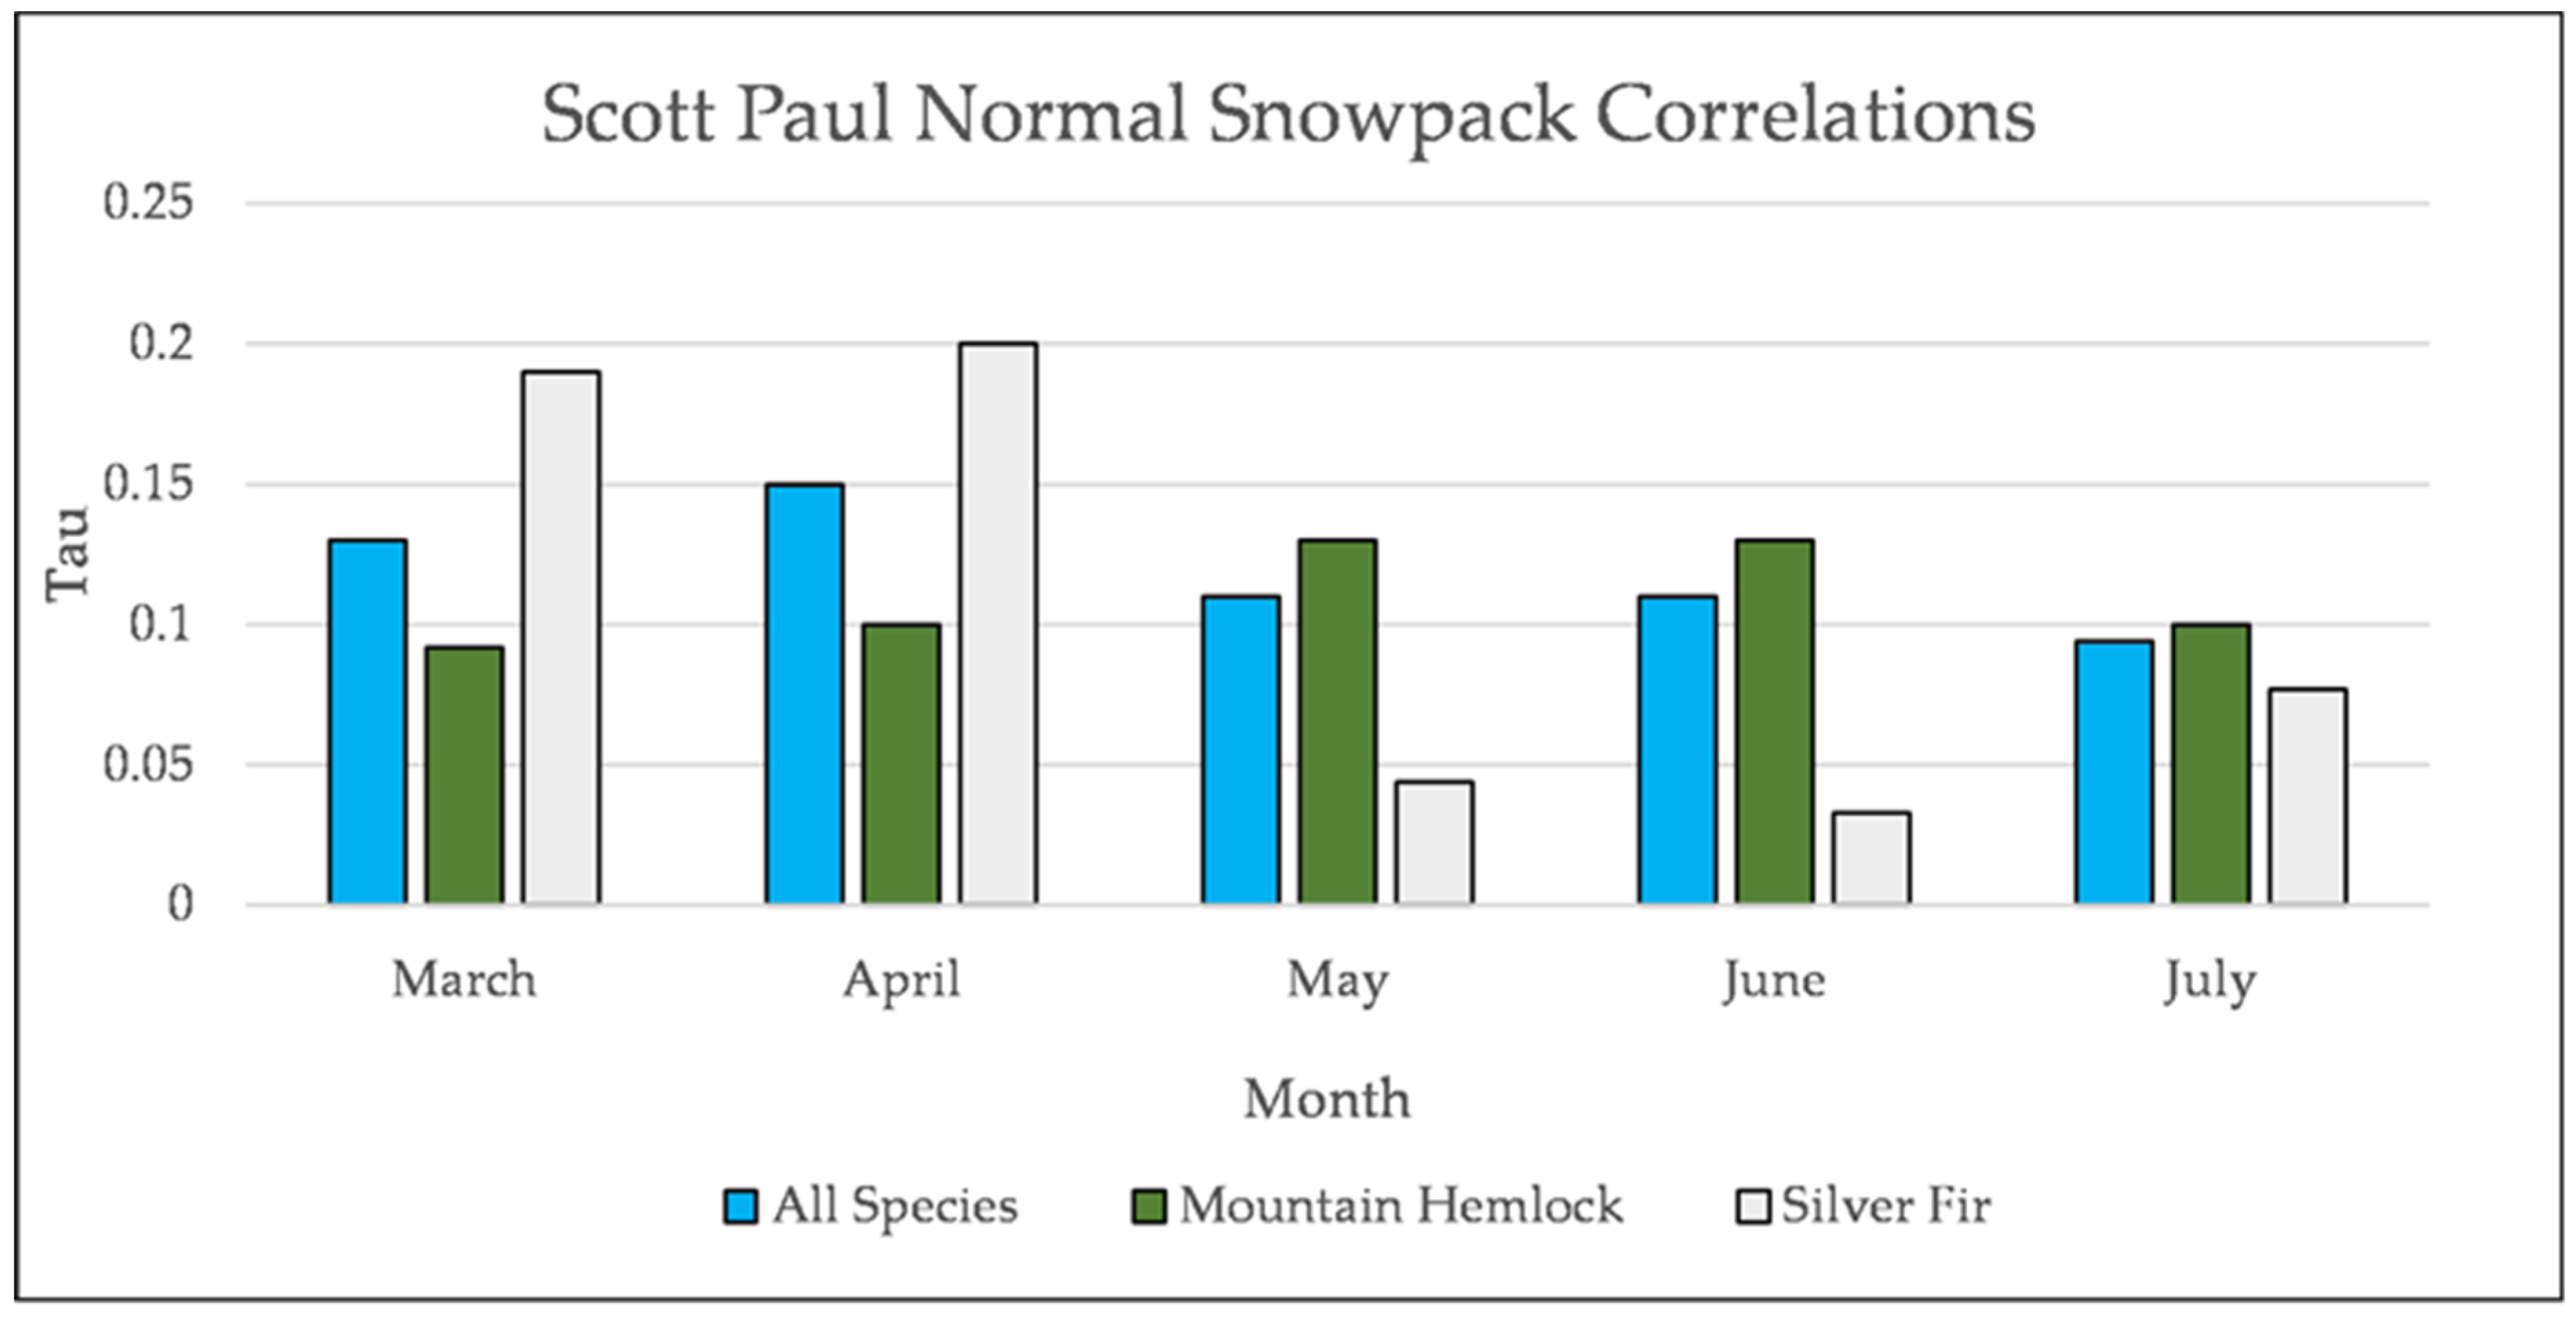
Figure A24.
Normal Kendall’s correlation controlled for temperature between mean monthly snowpack and establishment at Scott Paul. None of these correlations are significant.
Figure A24.
Normal Kendall’s correlation controlled for temperature between mean monthly snowpack and establishment at Scott Paul. None of these correlations are significant.
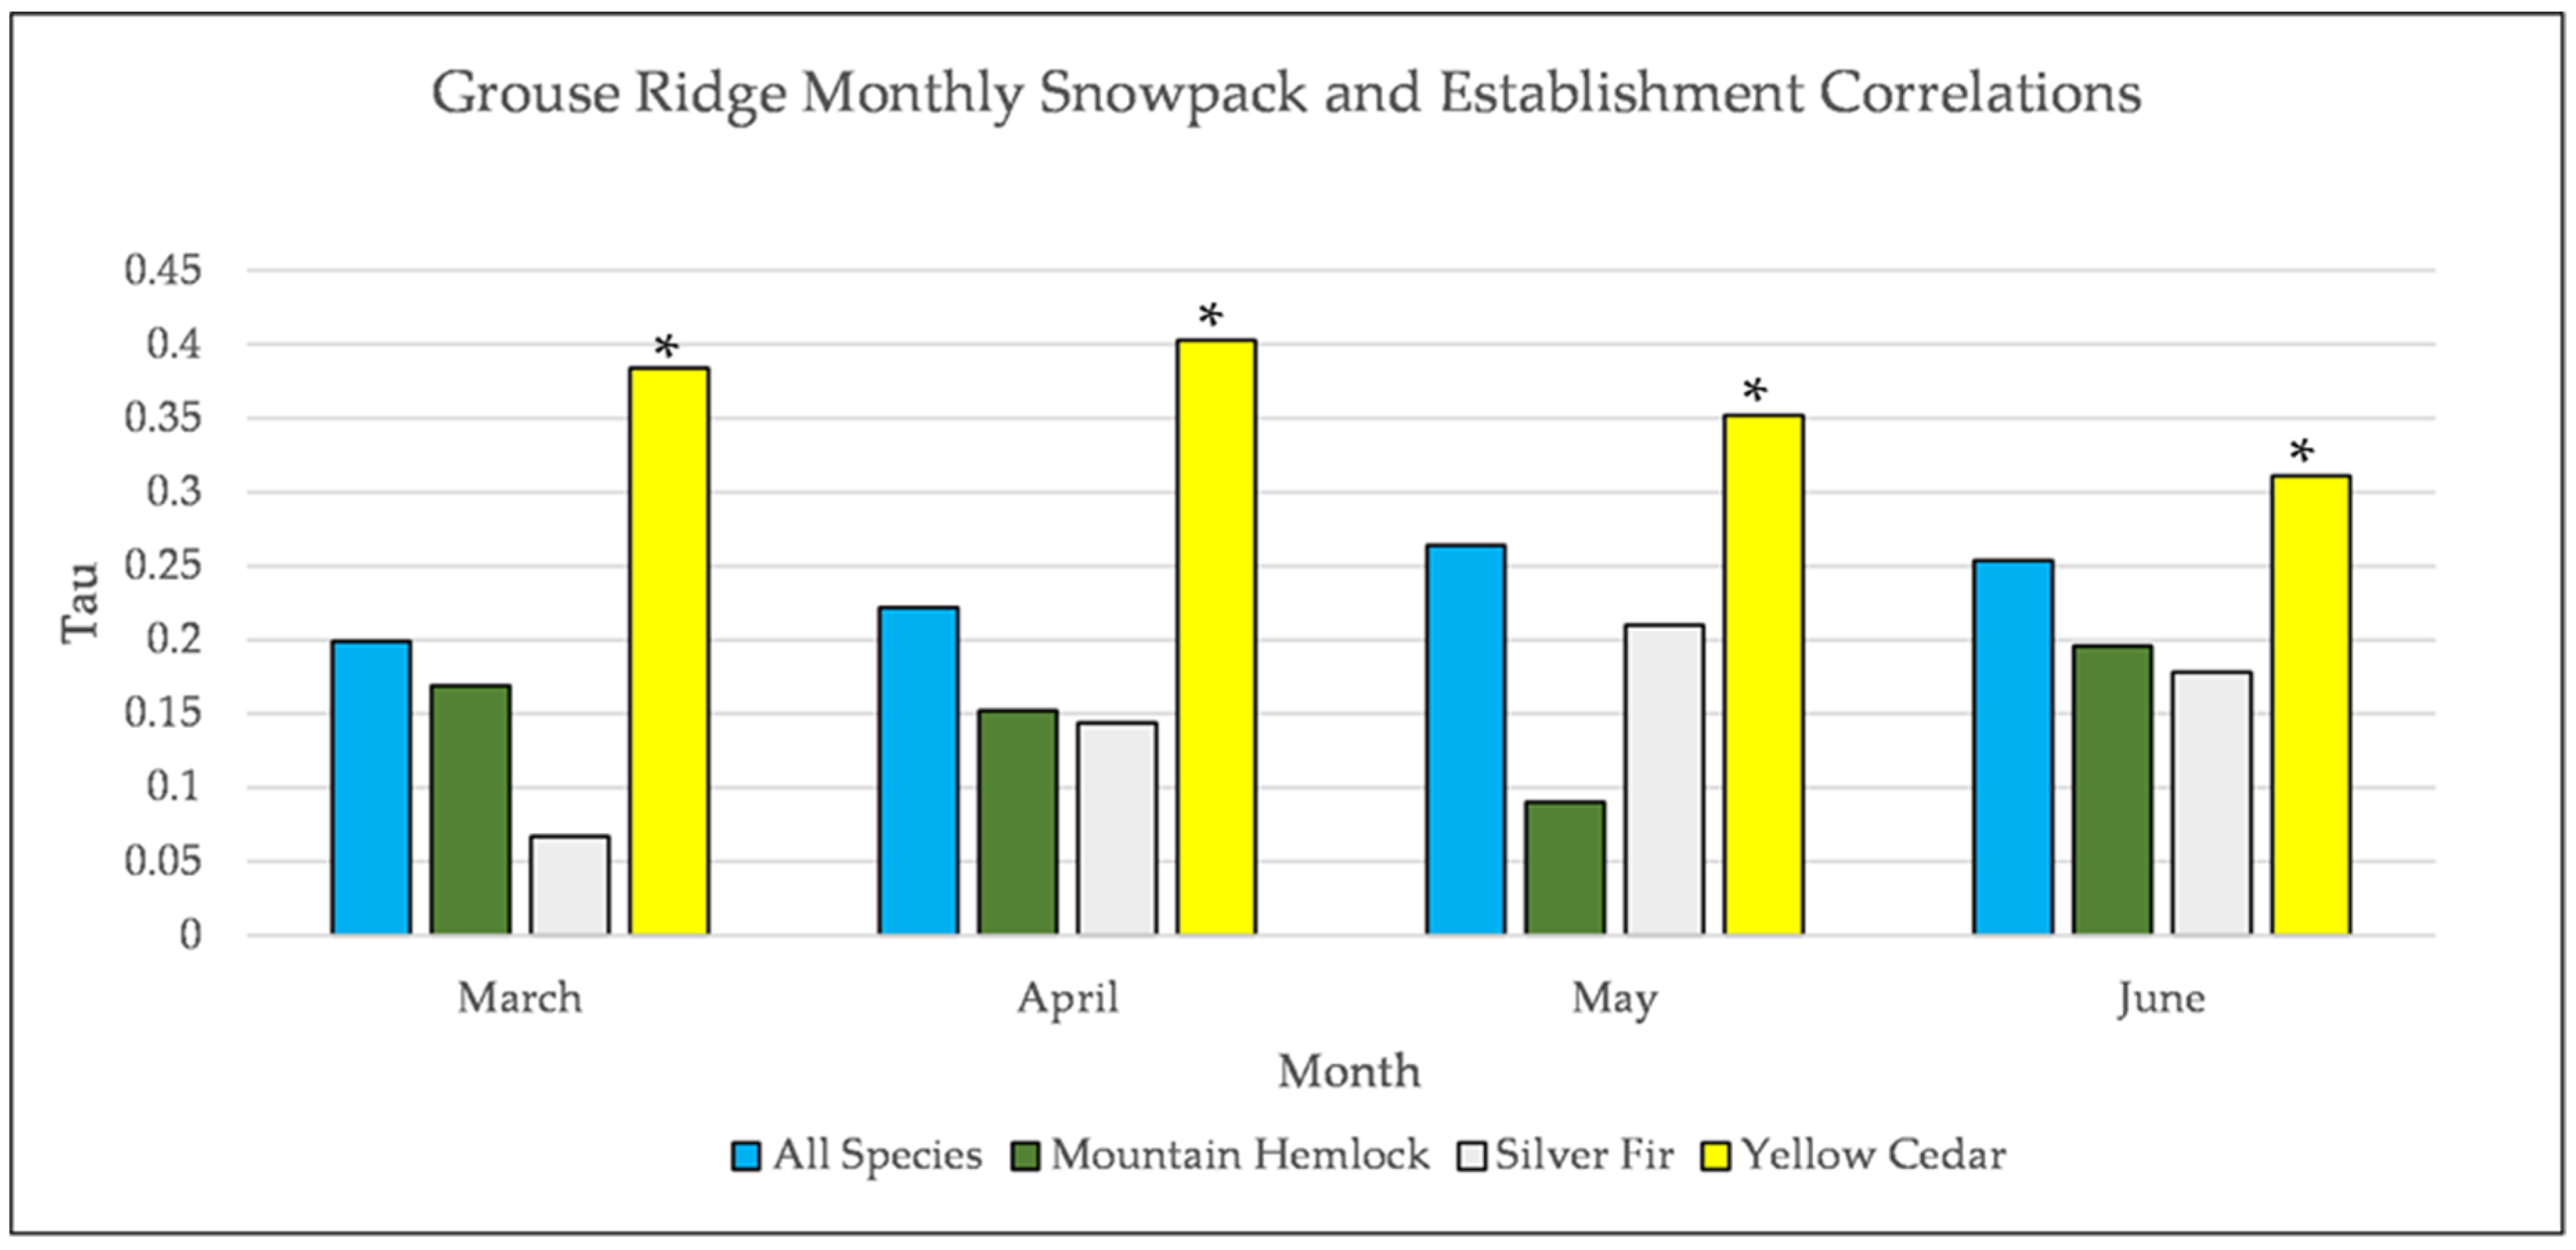
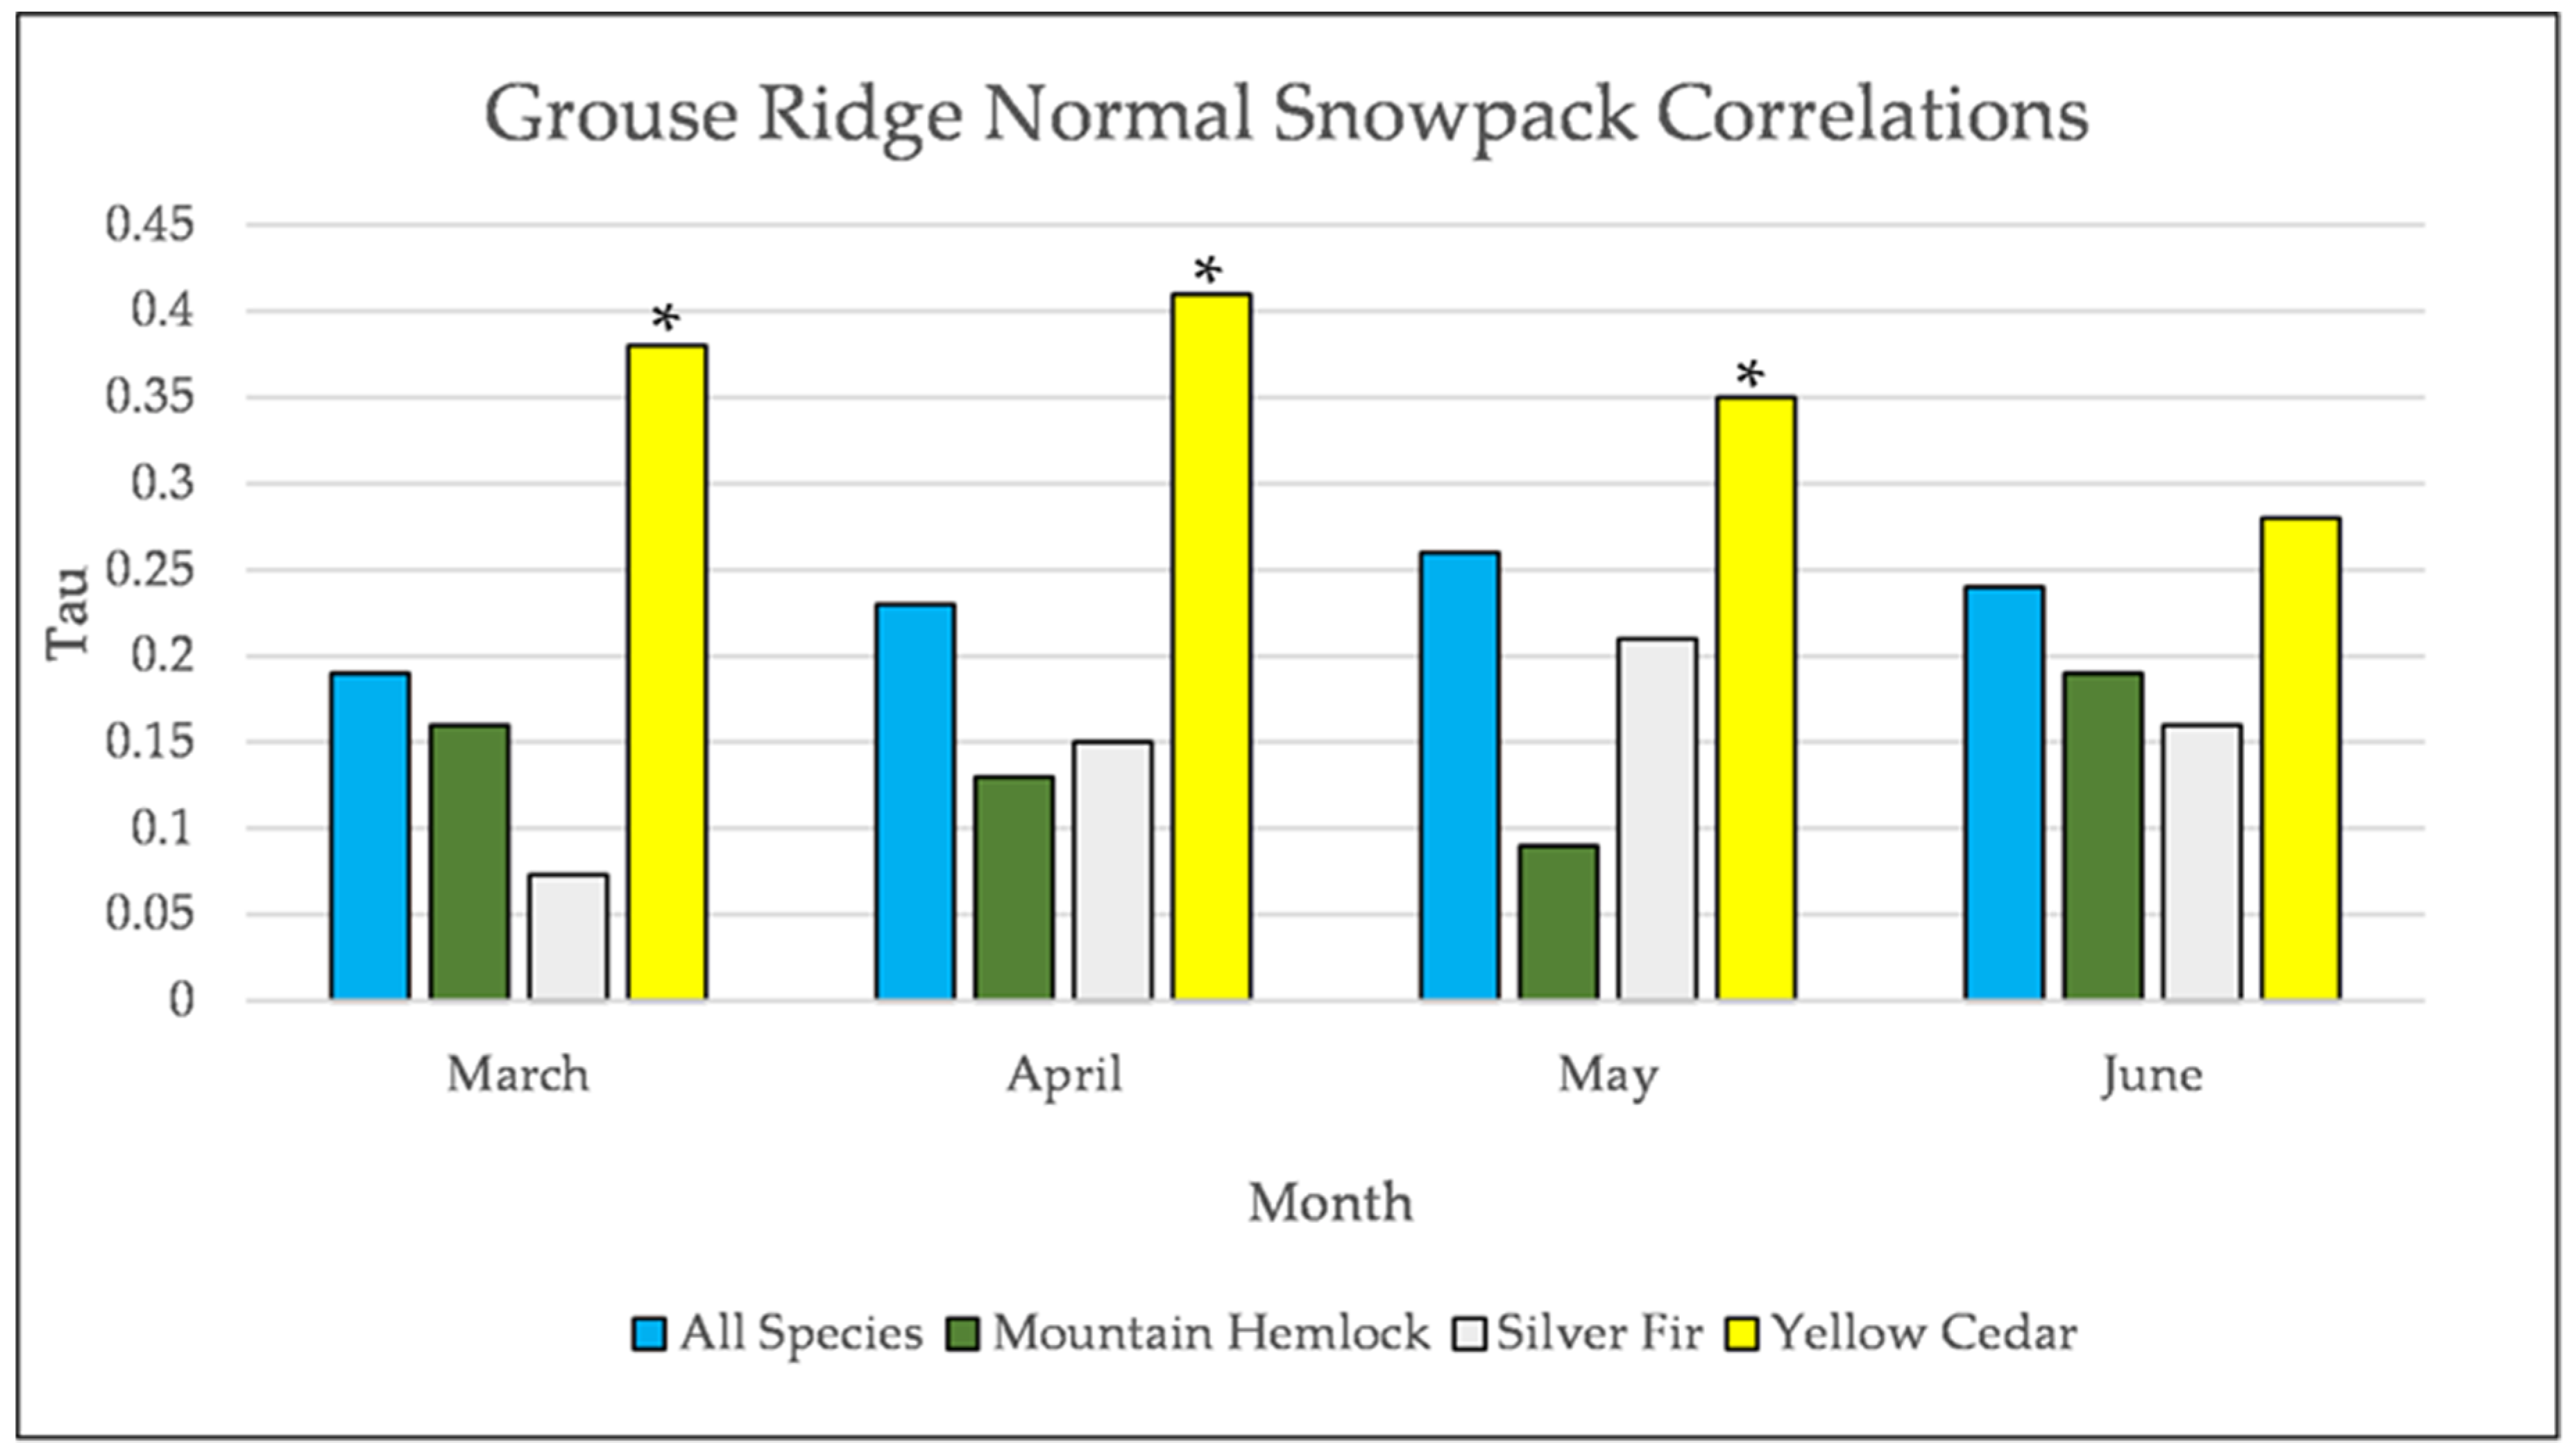
Figure A25.
Normal Kendall’s correlation controlled for temperature between snowpack and establishment at Grouse Ridge. * = p-value < 0.05. July is not included for snowpack at Grouse Ridge because there is rarely any snowpack at Grouse Ridge in July.
Figure A25.
Normal Kendall’s correlation controlled for temperature between snowpack and establishment at Grouse Ridge. * = p-value < 0.05. July is not included for snowpack at Grouse Ridge because there is rarely any snowpack at Grouse Ridge in July.
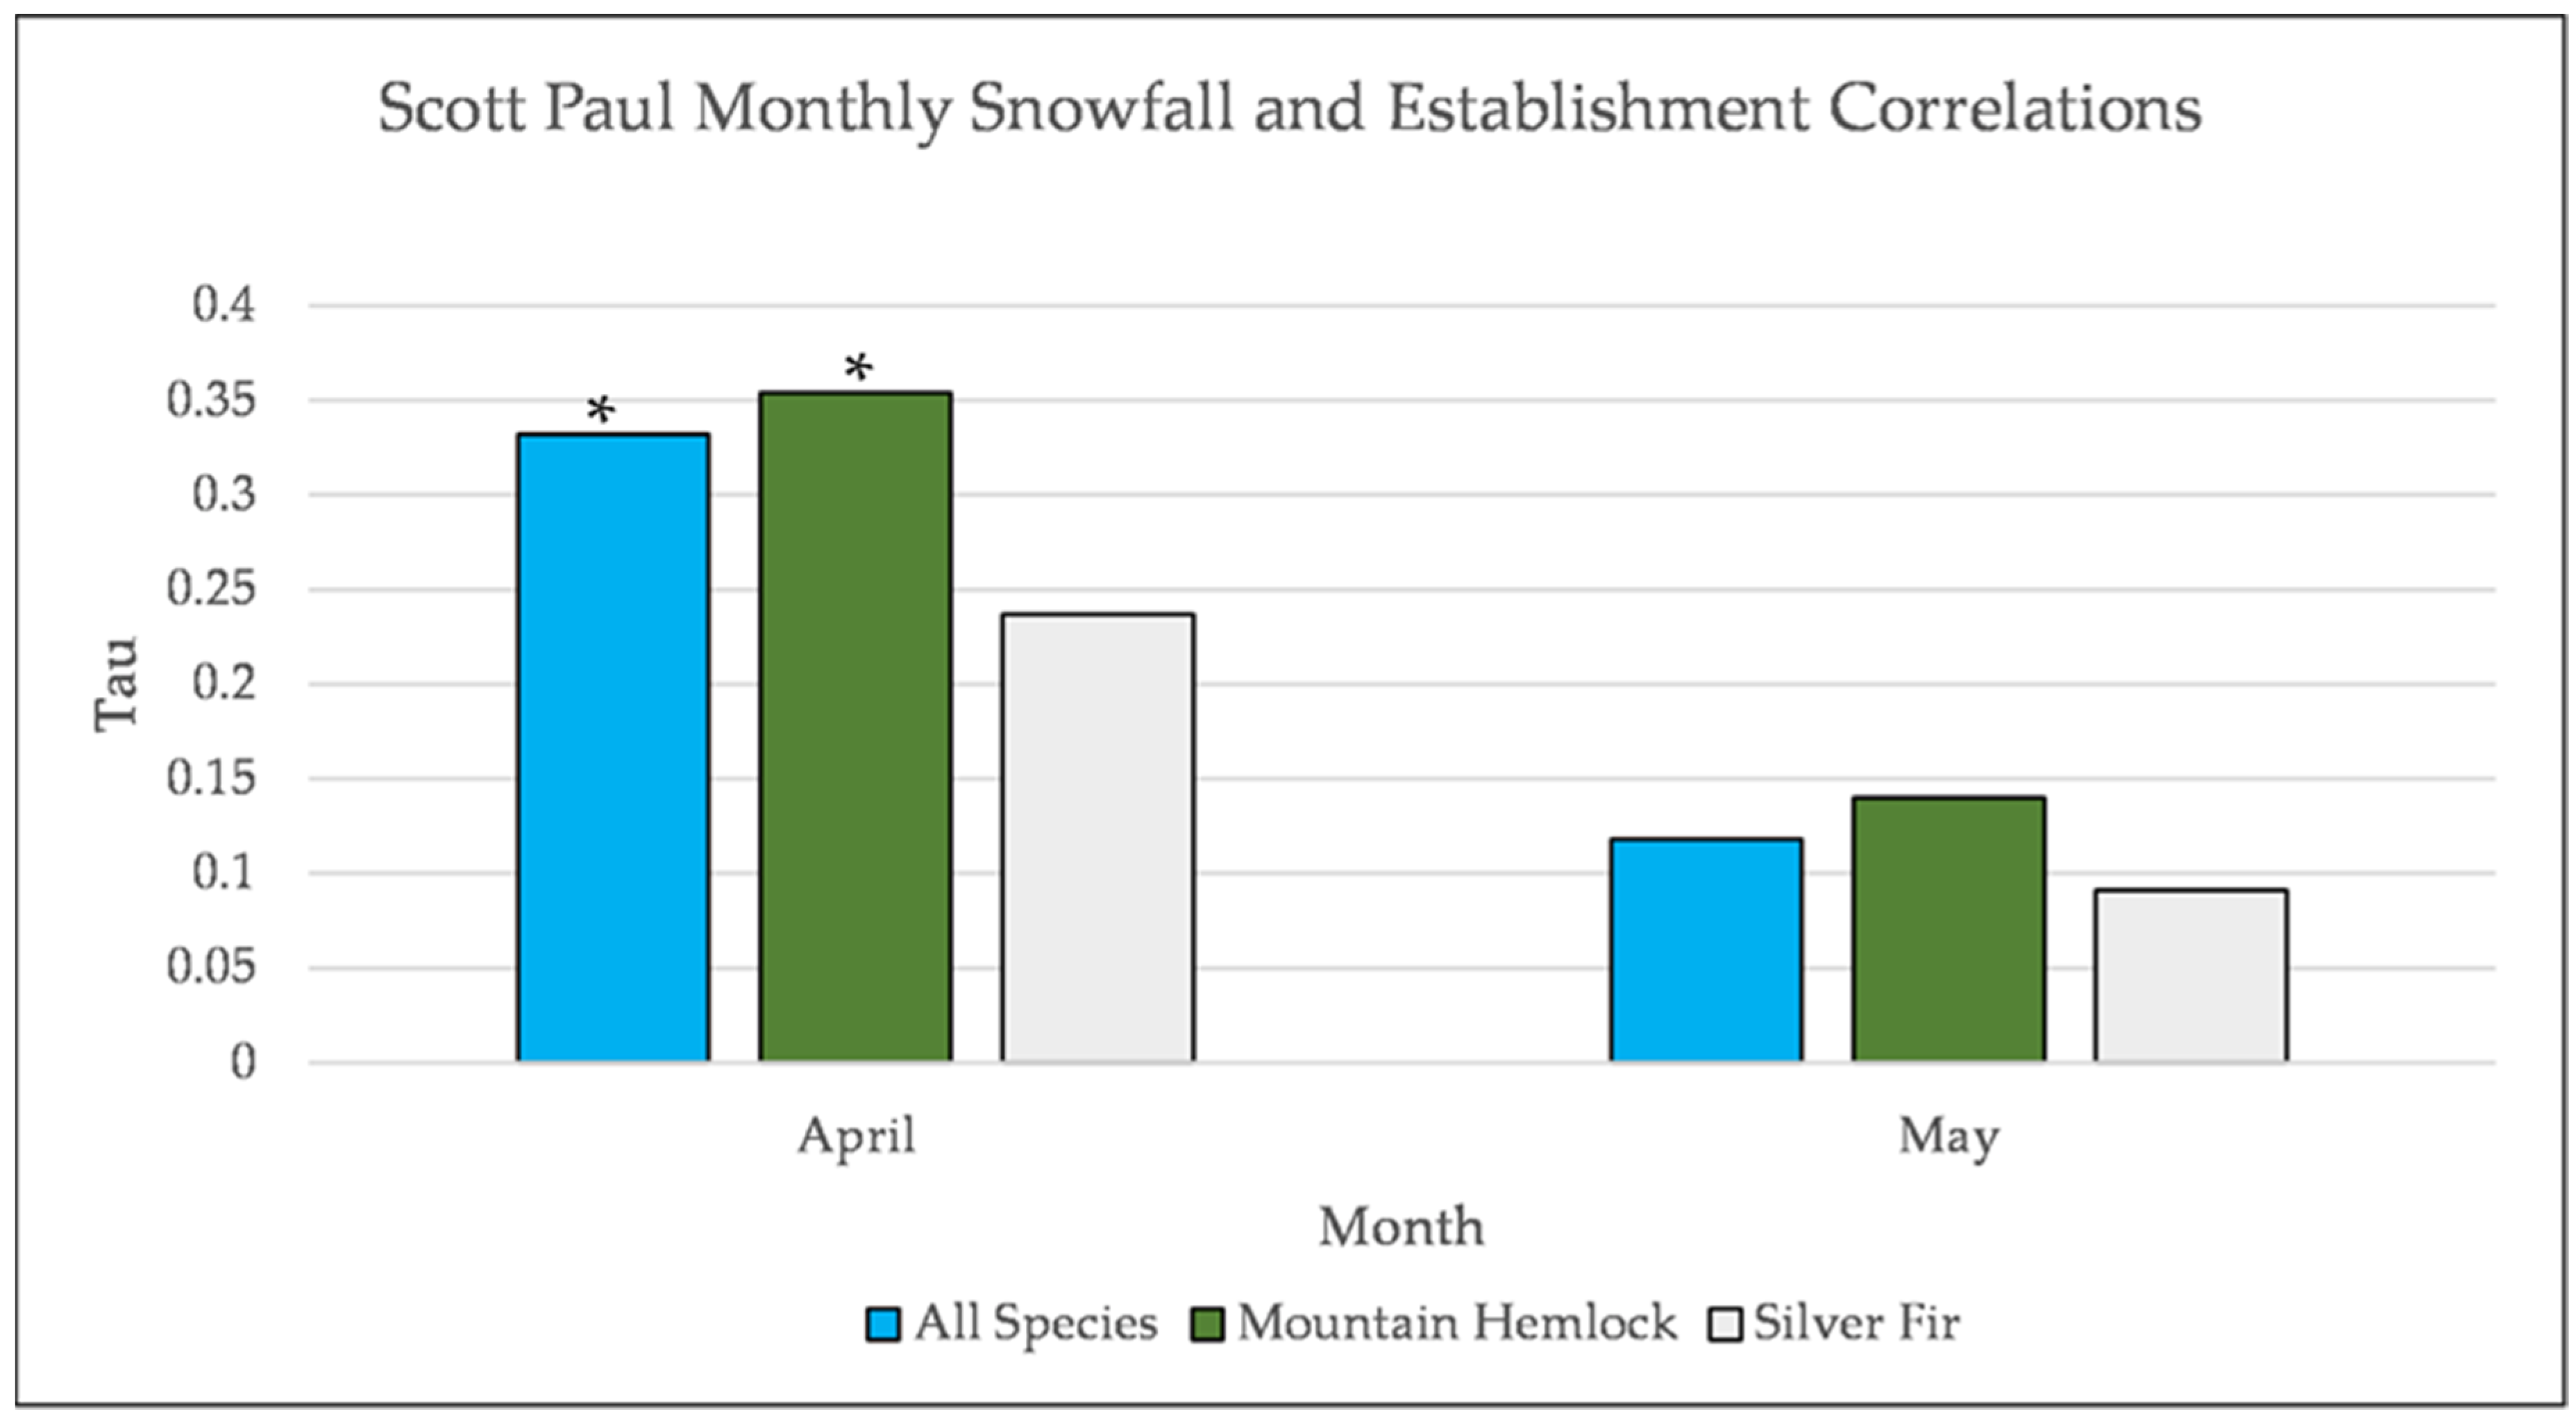
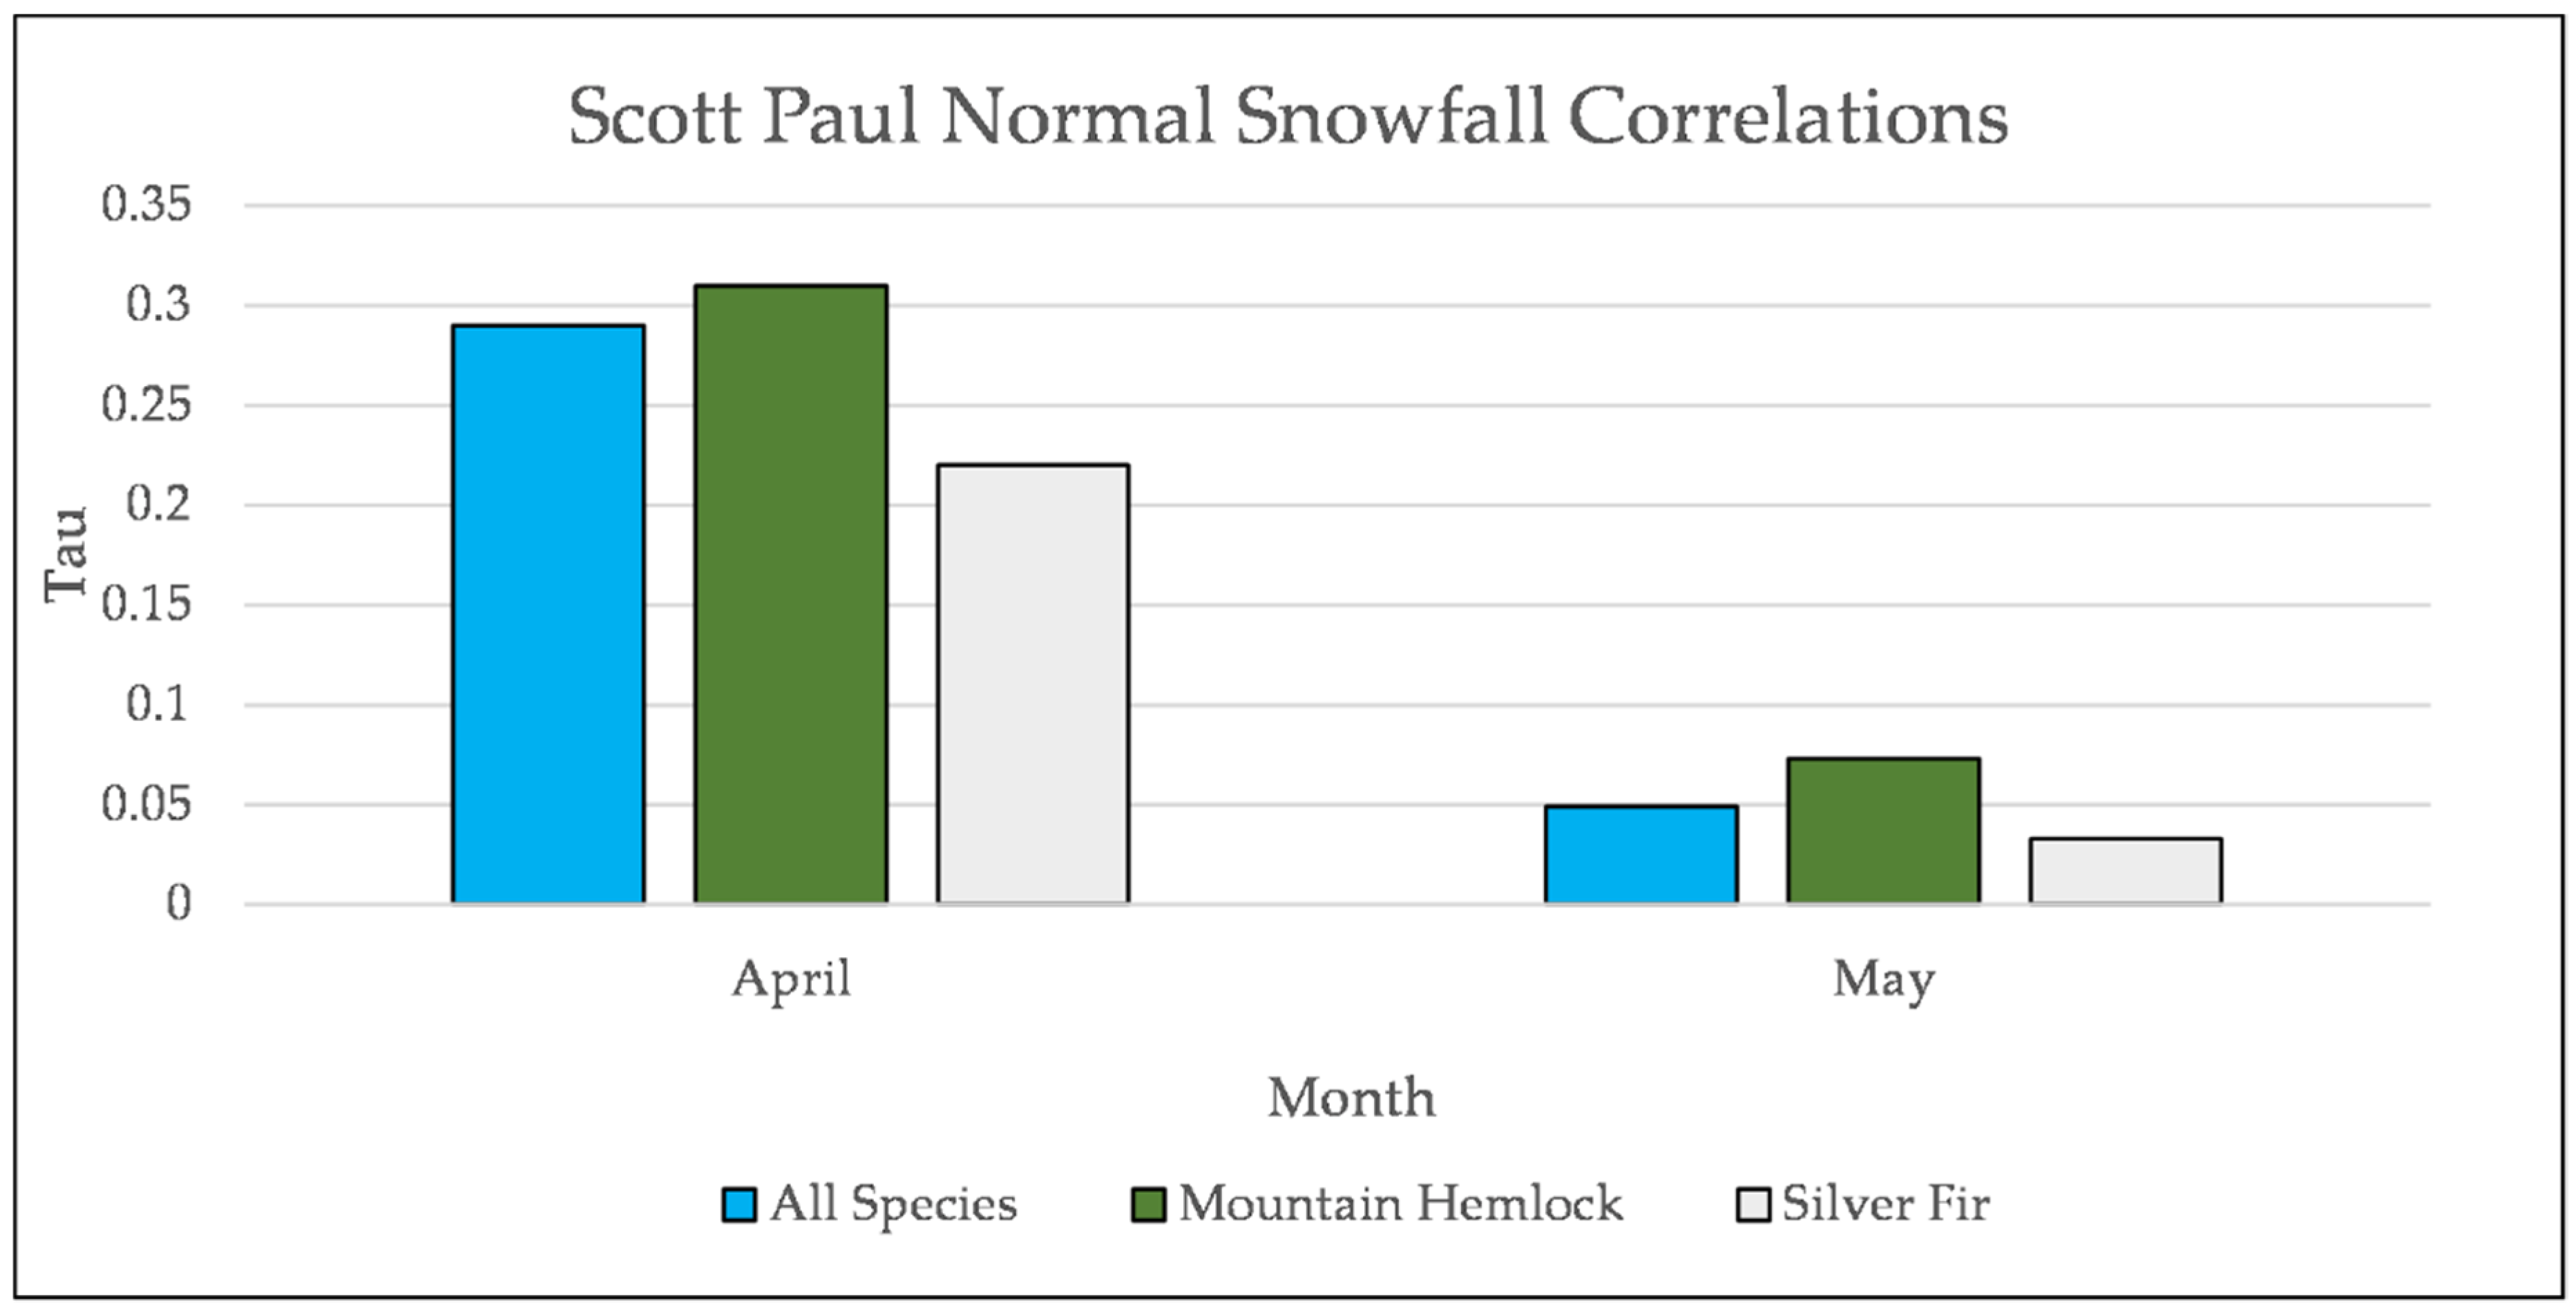
Figure A26.
Normal Kendall’s correlation controlled for temperature between snowfall and establishment at Scott Paul. * = p-value < 0.05.
Figure A26.
Normal Kendall’s correlation controlled for temperature between snowfall and establishment at Scott Paul. * = p-value < 0.05.
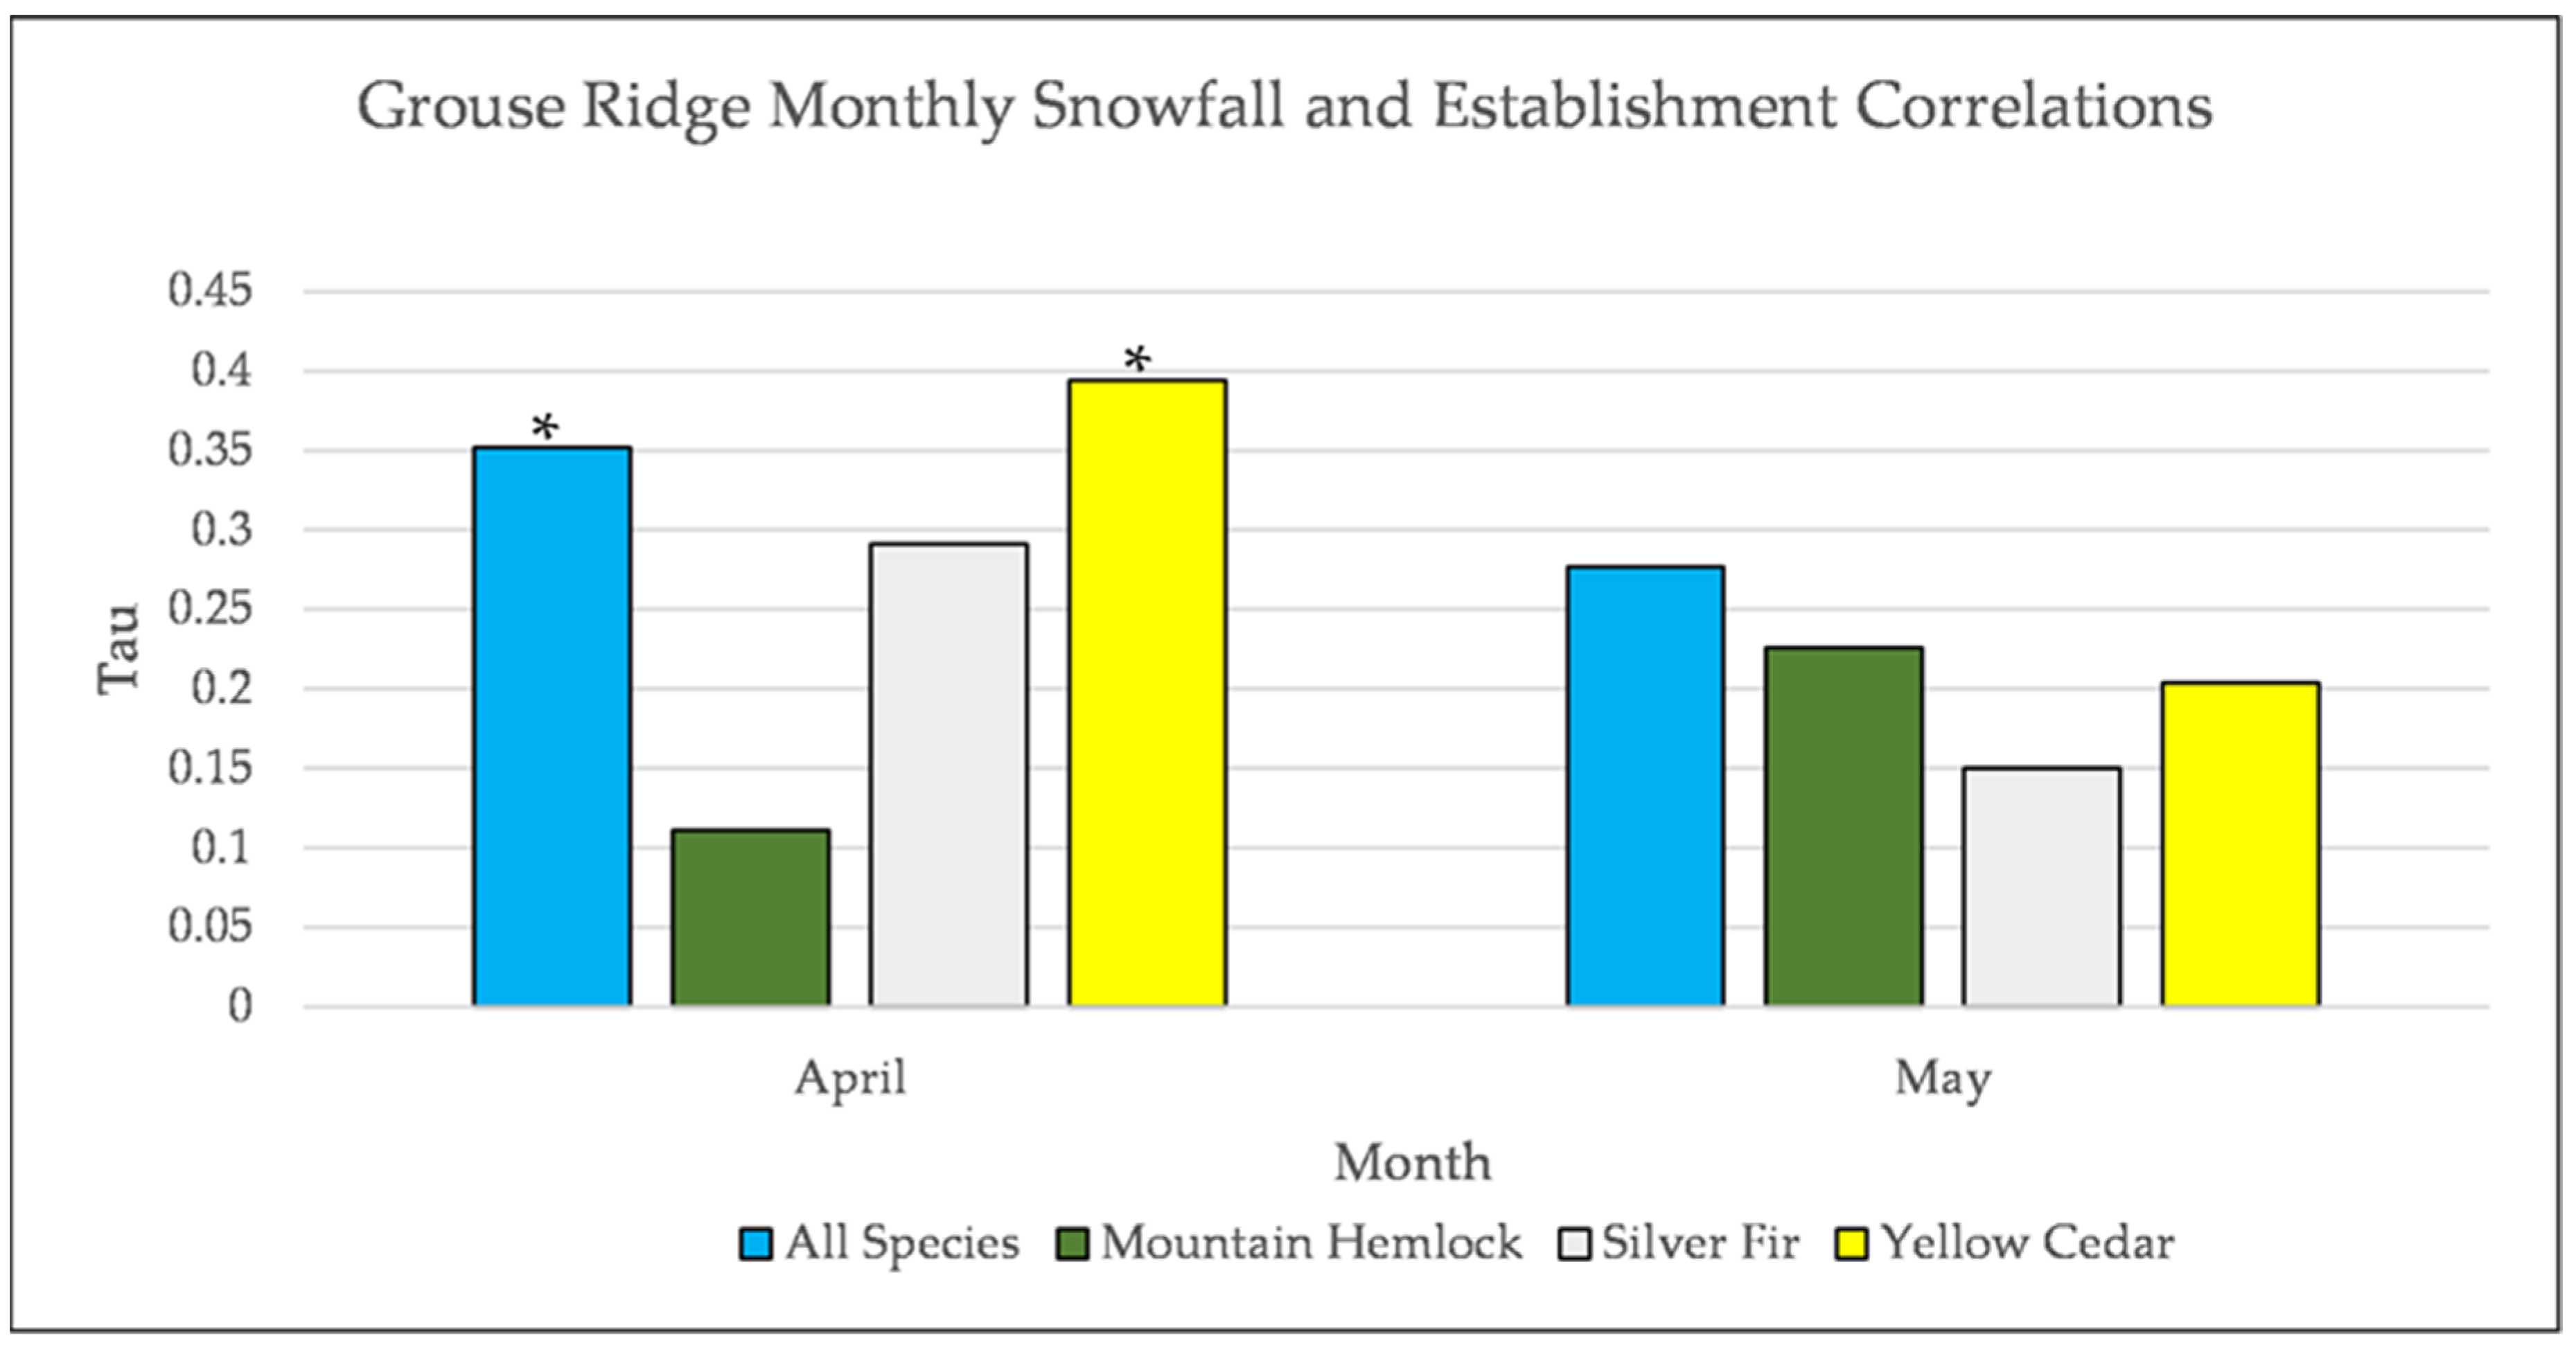
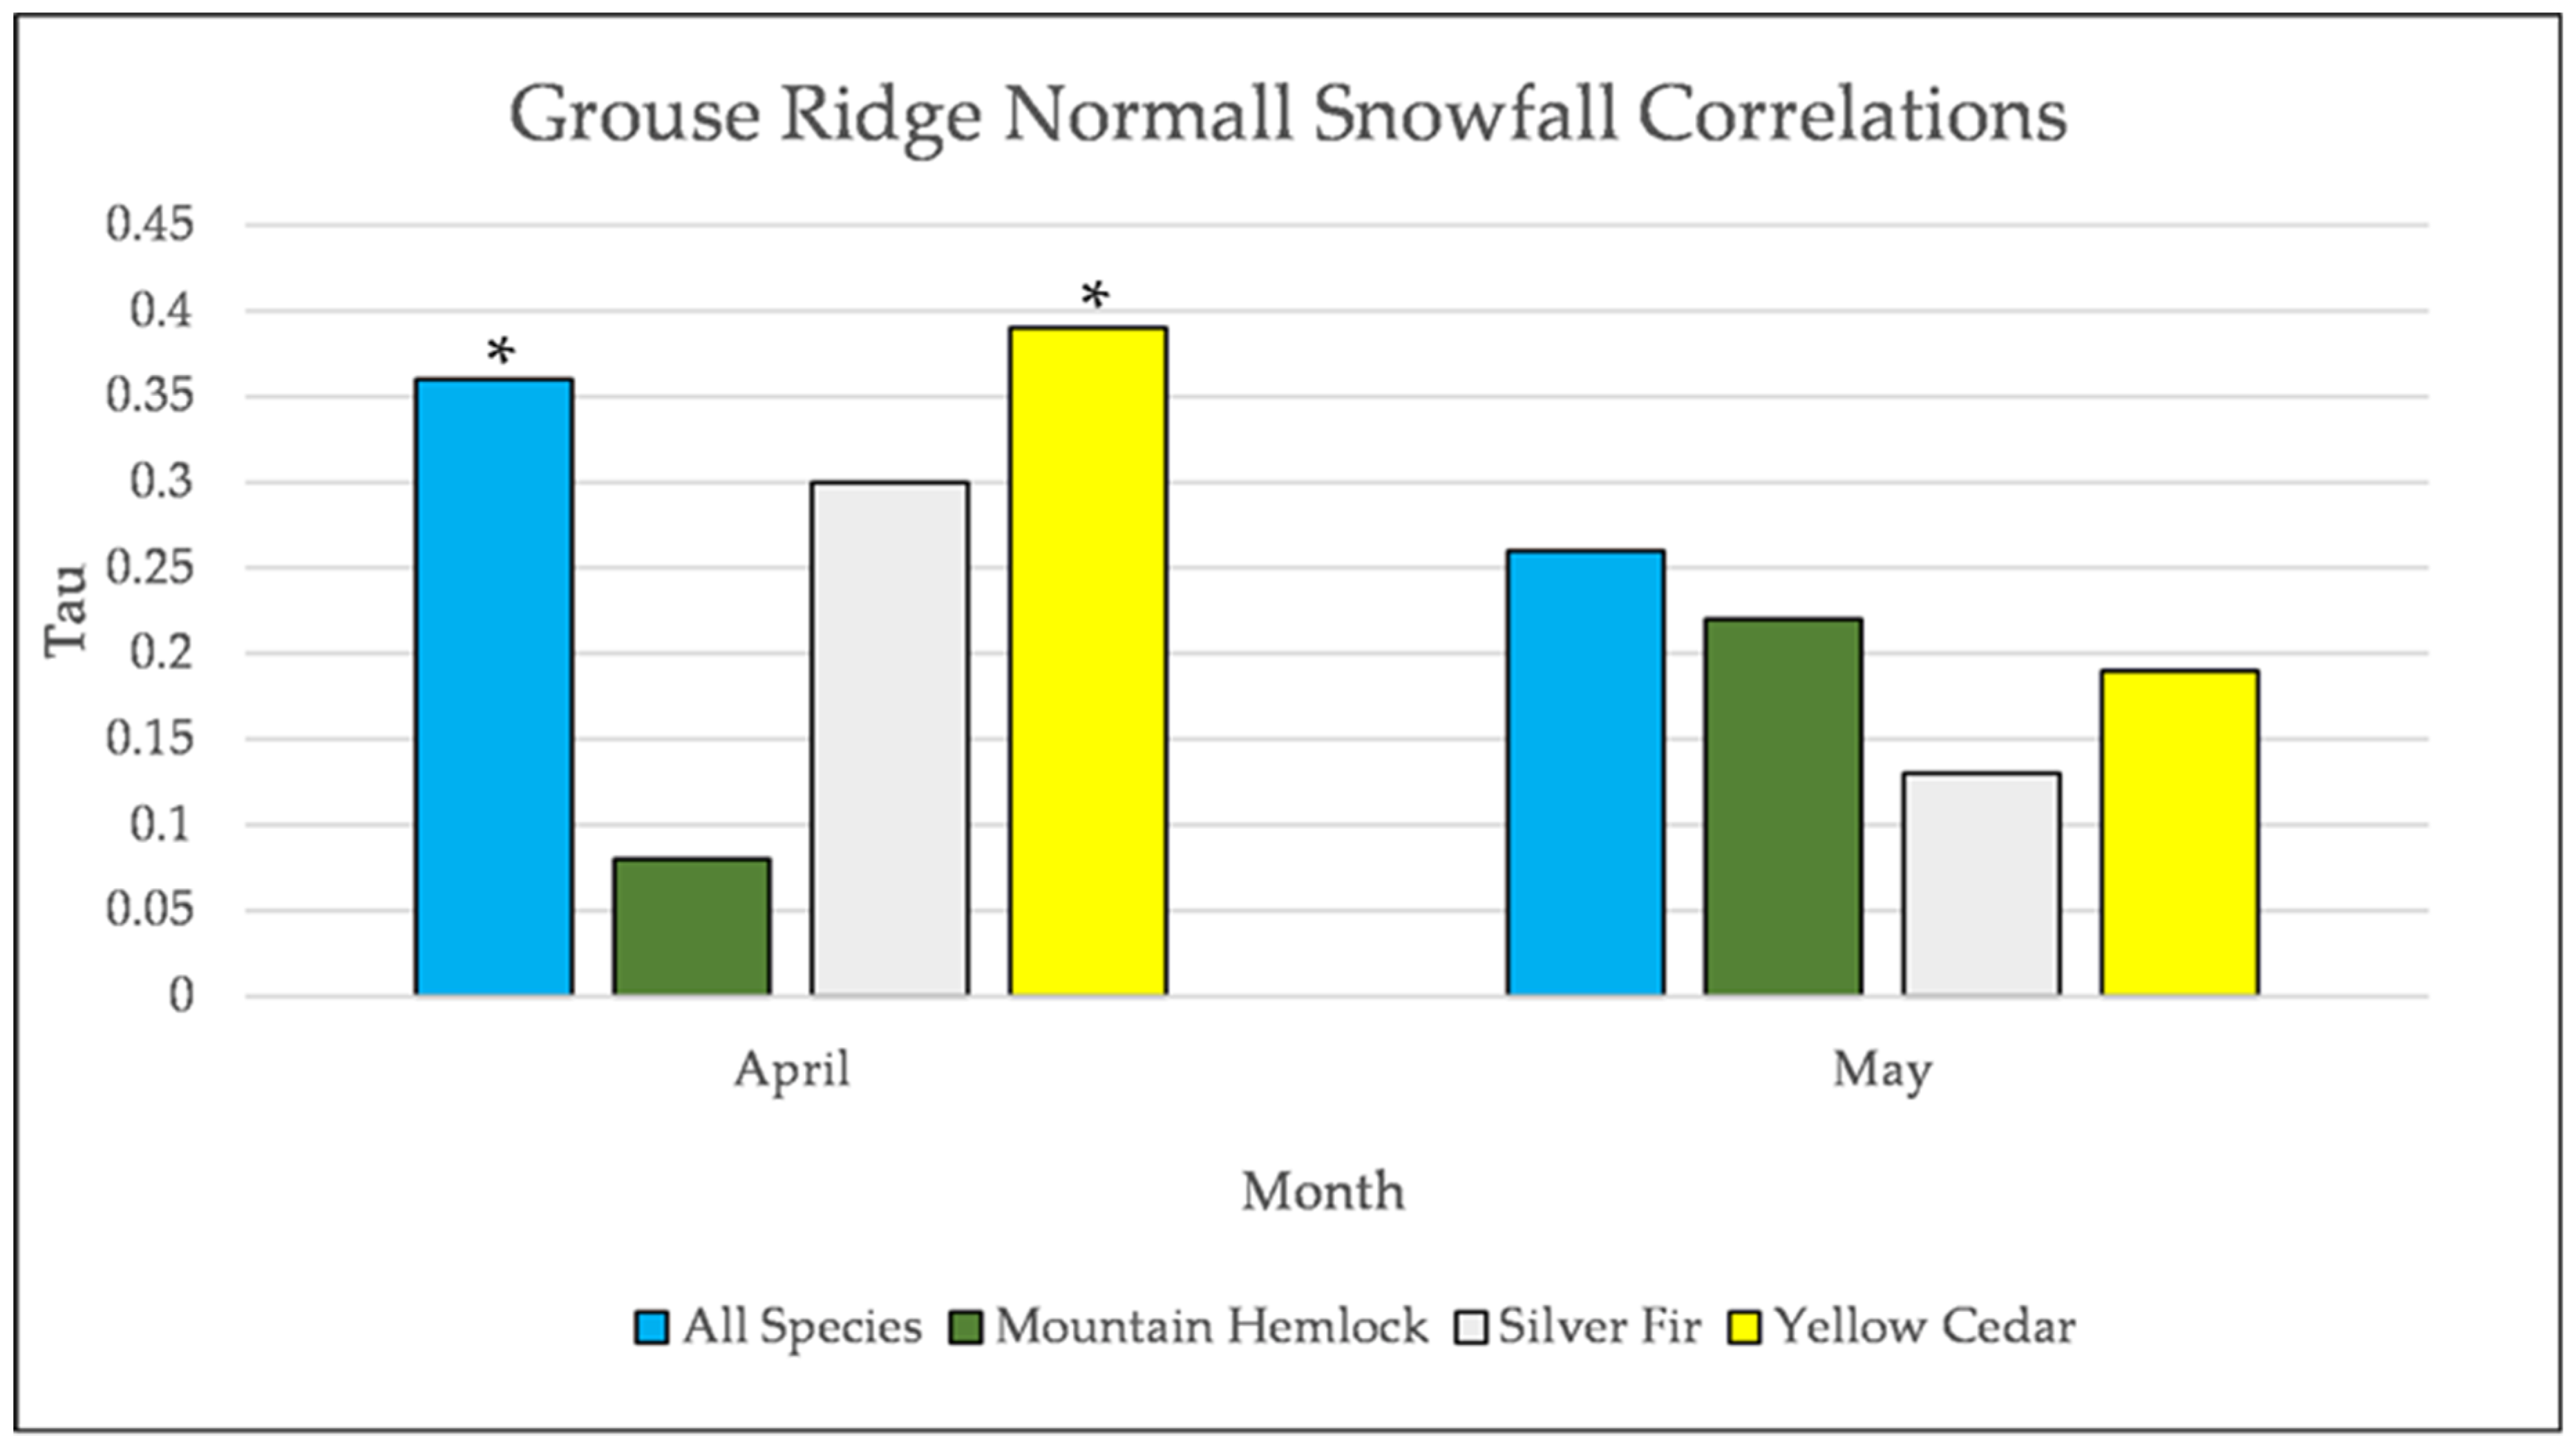
Figure A27.
Normal Kendall’s correlation controlled for temperature between snowfall and establishment at Grouse Ridge. * = p-value < 0.05.
Figure A27.
Normal Kendall’s correlation controlled for temperature between snowfall and establishment at Grouse Ridge. * = p-value < 0.05.


