Abstract
Exploring the variations in the water use efficiency (WUE) is helpful in gaining an in-depth understanding of the regional carbon and water cycles on the Chinese Loess Plateau (CLP). Here, we employed the spatial variations in the WUE and the quantitative contributions of the influencing factors, including the precipitation (P), temperature (Temp), vapor pressure deficit (VPD), sunshine duration (SD), and leaf area index (LAI), with the drought index varying over the last two decades. Results showed that the multiyear average WUE decreased significantly as the drought index increased for all of the vegetation types. Per-pixel interannual variability of WUE trend was 0.024 gC·m−2·mm−1·year−1. As the drought index increased, the WUE initially increased and then decreased for the forests, grassland, and shrubland, and their peaks occurred at drought index values of 2.60–3.10. Among the influencing factors, the WUE was predominantly controlled by the LAI, with an impact and relative contribution of 0.014 gC·m−2·mm−1·year−1 and 58.3%, respectively. The P and SD contributed the least to the trend in WUE, and impact and relative contribution of both were 0.001 gC·m−2·mm−1·year−1 and 4.17%. Our study also demonstrated that the LAI was the dominant factor affecting the WUE trends for grassland and the Yan River due to the structural parameters and geographical location. In addition, the impact and relative contribution of the residual factors on the WUE trend were 0.004 gC·m−2·mm−1·year−1 and 16.7%. Our findings suggested that comprehensive effects such as micro-geomorphic changes and nitrogen deposition could not be ignored except for vegetation and climate change. This study will clarify the spatial and temporal evolution of WUE and its influence mechanism.
1. Introduction
The ecosystem water use efficiency (WUE), which is defined as the ratio of the gross primary productivity (GPP) to the evapotranspiration (ET) [1,2], is a critical parameter that reflects the carbon assimilation through water loss [3,4]. The WUE has generally been recognized as an important integral indicator linking the carbon and water cycles of ecosystems and the atmosphere [5], which can quantify how much carbon an ecosystem gains relative to the water used per unit [3]. Therefore, it is necessary to investigate the WUE to deeply understand and simulate the ecosystem carbon–water coupling relationship [4]. In addition, it can provide useful information about the dynamic responses of ecosystems to environmental changes [6].
In the past few decades, field measurements, gas exchange, and stable isotope techniques have gradually been used to study the WUE at plant leaf and individual scales [7,8,9,10]. Field measurements and gas exchange can accurately obtain the carbon and water balance at the monitoring stations to better and more accurately study the water use efficiency at small scales [7,8,9]. Carbon isotopic composition is a useful method to determine the drought resistance, to provide insights of chemical, physical and metabolic processes involved in carbon transformation in the stressed plant that determine the water utilization and water conservation status for the forest species [10]. With the rapid development of the eddy covariance technique [11] and remote sensing technology [12,13], studies of the WUE have been extended to the ecosystem scale. Remote sensing technology has become an effective technical approach for studying the WUE of regional and global ecosystems because it has the powerful capability to make temporally and spatially continuous observations of the Earth’s surface over large areas and long time periods [14]. Currently, numerous studies have been conducted on the WUE at the regional scale using remote sensing technology products, such as GPP and ET products. Sharma and Goyal et al. revealed the characteristics of the spatial and temporal variation in the WUE at the district scale using moderate-resolution imaging spectroradiometer (MODIS) net primary productivity and ET data [15,16]. Tang et al. analyzed the characteristics of the global WUE and concluded that changes in land use were the main cause of the significant decline in the WUE using National Aeronautics and Space Administration (NASA) TERRA and AQUA MODIS-based estimates of the GPP and ET [17]. Guo et al. analyzed WUE in the Beijing–Tianjin Sand Source Region and found that the annual growth rate of WUE in this area was very high and human activities were the dominant factor for the increase of WUE based on integrating remote-sensing and the eddy covariance technique observed ET data and GPP data by using a machine learning approach [18].
The Chinese Loess Plateau (CLP), which is located in the middle reaches of the Yellow River, is the second largest plateau in China. The CLP is considered to be one of the most typical ecologically fragile areas associated with harsh environmental conditions and intensified human activities in the world [19]. In this region, the precipitation is far less than that demanded for vegetation growth, and water resource shortages are an essential limiting factor of ecological and economic development [20]. Since 1999, the Chinese government has implemented the Grain for Green (GFG) Project to alleviate serious ecological problems, which has significantly increased the vegetation cover and reversed the soil erosion trend [21]. However, it has been found that depletion of deep soil water by vegetation growth through evapotranspiration has led to an increased soil moisture deficit in recent years [22,23]. In addition, a significant streamflow reduction in the CLP has also been observed [24,25]. Therefore, studying the carbon–water coupling and its driving factors is significant for assessing the water consumption and sustainability of vegetation on the CLP [19,26].
Currently, numerous studies about the long-term WUE variation have been conducted in the whole CLP [27,28,29,30,31,32]. Cao et al. have shown that the WUE in the CLP has experienced a significant increasing trend since 1999 [33]. The results of Tian et al. have found the WUE decreased with gradients from the southeast, but with sharp rises detected in northern Shaanxi, China [32]. Zheng et al. analyzed the responses of WUE variation to regional climate and vegetation coverage changes in the CLP-based correlation coefficients and indicated that vegetation coverage change is the primary cause for the increasing ecosystem annual WUE in the CLP [31]. Zheng et al. examined spatial responses of plant canopy WUE and ecosystem WUE variations to the mean annual precipitation, mean annual air temperature, and normalized difference vegetation index gradients; results showed that normalized difference vegetation index gradients were the important factors [30]. In summary, there is a significant spatial divergence in WUE and factors such as precipitation, temperature, and vegetation coverage changes all have an impact on WUE. However, the quantitative impacts of the different influencing factors, especially the comprehensive effects with other factors (e.g., microtopographic changes, increasing carbon dioxide (CO2), and nitrogen deposition) affecting the WUE have not been discussed in detail.
Therefore, the objectives of this study were (1) to analyze the spatial variation patterns of the multiyear mean WUE and the variations in the WUE with drought index changes for different vegetation types in the CLP from 2000 to 2018; (2) to explore the spatial variation patterns of the partial correlations between the WUE and climatic and vegetation factors with the drought index change for different vegetation types in the CLP from 2000 to 2018; and (3) to quantitatively calculate the impacts of the climate, vegetation, and other factors on the WUE trends, and their spatial variations for different vegetation types and sub-basins in the CLP from 2000 to 2018.
2. Data and Methods
2.1. Study Area
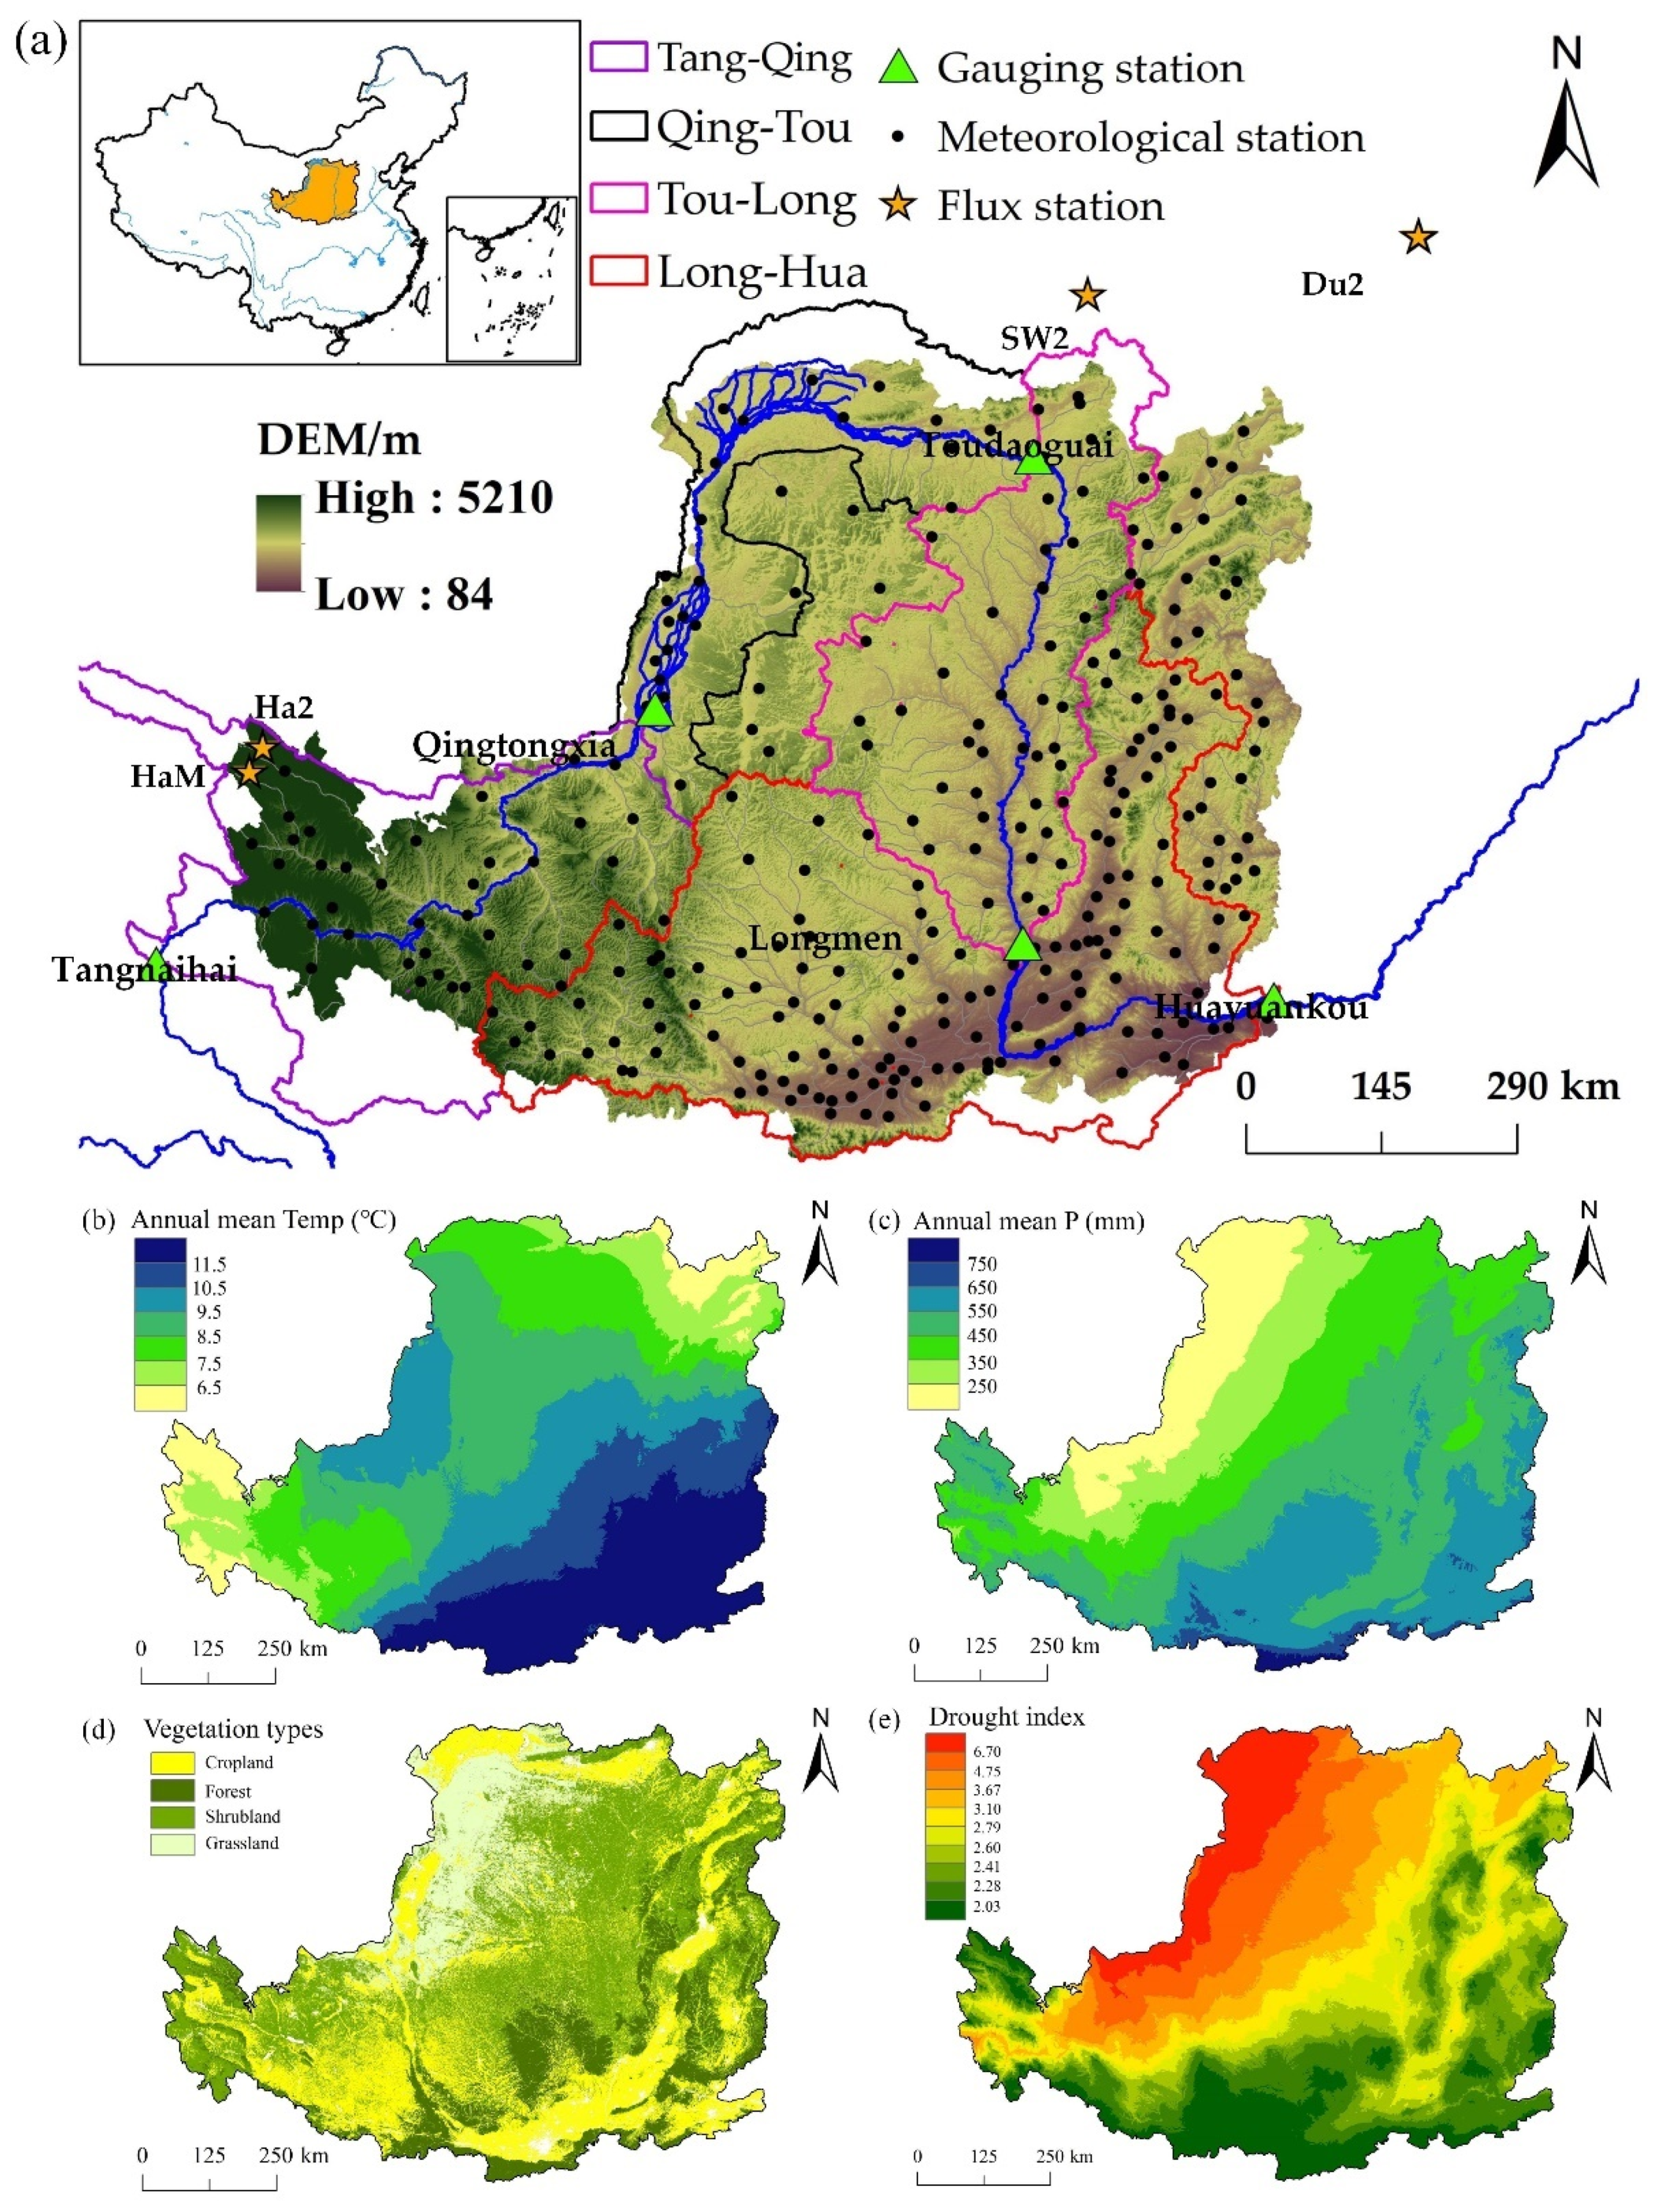
The CLP is located in northwestern China, and it covers an area of approximately 6.4 × 10⁵ km2 (100°54′–113°33′ E, 33°43′–41°16′ N; Figure 1a). The CLP is a typical arid and semi-arid area where water resources have become a bottleneck in regional social economic development and ecological growth [22]. The multiyear average annual precipitation and temperature are 300–600 mm and 4–14 °C on the CLP, respectively, (Figure 1b,c). Historically, climate change and intense human activities have led to severe degradation of the ecosystem of the CLP [19]. Since 1999, major ecological restoration projects have been implemented on the CLP. The ecological environment and the capacity of the soil and water conservation have been significantly improved as a result of dramatic changes in the underlying surface of the CLP over the past two decades [21,34].
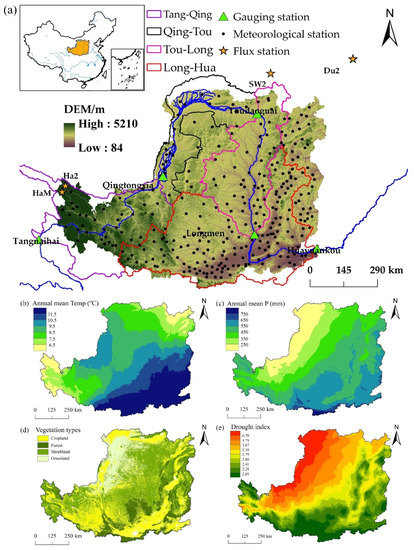
Figure 1.
(a) Location of the Chinese Loess Plateau, annual mean of (b) temperature and (c) precipitation, (d) vegetation types, and (e) drought index.
2.2. Data and Preprocessing
In this study, we selected the PML-V2 product to obtain the ET and GPP data. The terrestrial water storage anomaly (TWSA) was derived from the average of the Gravity Recovery and Climate Experiment (GRACE) Jet Propulsion Laboratory (JPL) RL06_mascon and Center for Space Research (CSR) RL06_mascon products. The Global Land Surface Satellite (GLASS) leaf area index (LAI) product was selected to characterize the vegetation structure parameter. We obtained land cover data from the GLC_FCS30, which was the first global land cover product with fine classification [35] (http://data.casearth.cn, accessed on 20 December 2020). Detailed information about these remote sensing products is provided in Table 1.

Table 1.
Remote sensing products used in this study.
The field measurements of the precipitation (P), temperature (Temp), wind speed (WS), sunshine duration (SD), and relative humidity (RH) were measured at 295 meteorological stations and were obtained from the China Meteorological Data Service Center (http://data.cma.cn/, accessed on 18 June 2020). According to the shared ET and GPP flux database published by the China Flux Observation and Research Network (ChinaFLUX) (http://www.chinaflux.org/, accessed on 1 March 2020), the observations from four flux stations (Du2, Du3, HaM, and Sw2) located near and within the CLP were collected. The annual runoff measured at five major gauging stations (Tangnaihai, Qingtongxia, Toudaoguai, Longmen, and Huayuankou) located along the main river channel were obtained from the Hydrological Bureau of the Yellow River Conservancy Commission. Detailed information about these field measurements is provided in Table 2.
Table 2.
In situ measurements from gauging stations and meteorological stations used in this study.
To match the spatial resolution of the GPP and ET products, we resampled the LAI and land cover products at a resolution of 500 m. All of the data from meteorological stations were spatially interpolated to a resolution of 500 m using the AUSPLINE software. We calculated the ET0 and VPD based on the meteorological data using the Food and Agriculture Organization (FAO) Penman Monteith method [36] and the equations proposed by Yuan et al. [37], respectively. We calculated the drought index using the ratio of the annual average potential evaporation (ET0) to the annual average precipitation (P) during 2000–2018 [38], and then divided it into 10 regions based on the histogram distribution of the drought index (Figure 1e). All of the time-series data were temporally aggregated at the annual scale for subsequent analysis.
2.3. Methods
2.3.1. Validation of GPP and ET Product Accuracy
The accuracy assessment of the PML_V2 product globally and in China showed that GPP and ET were more accurate than the other currently available global products [39,43,44]. Nevertheless, to ensure the reliability of the subsequent analysis, we assessed the GPP using the measurements from the flux stations at the annual and 8-day scales. We evaluated the ET using the flux observations at the 8-day scale, assessed the regional ET at the annual scale using the regional ET calculated using the water balance principle based on the measured P, runoff, and derived changes in the terrestrial water storage from the TWSA for the four sub-regions, including Tangnaihai-Qingtongxia (Tang-Qing), Qingtongxia-Toudaoguai (Qing-Tou), Toudaoguai-Longmen (Tou-Long), and Longmen-Huanyuankou (Long-Hua). The accuracy metrics used were the determination coefficient (R2), the root mean square error (RMSE), and the Nash–Sutcliffe efficiency coefficient (NSE).
2.3.2. Trend Slope Analysis
We assessed the trends of the WUE and influencing factors by calculating the linear slope values on an annual timescale during the study period per pixel (Equation (1)). We used the F test to examine the statistical significance of the WUE trends and considered the interannual trends to be statistically significant if the p-values were < 0.05. Additionally, the time series with missing WUE values were excluded from the temporal trend analysis in this study. The linear slope equation is as follows:
where i is the individual year, varying from 1 to19; Xi is the WUE and influencing factors in the ith year; and n is 19, representing the total number of years. When slope > 0, X is increasing; when slope < 0, X is decreasing.
2.3.3. Partial Correlation Analysis
Numerous previous studies have shown that P, Temp, VPD, SD and LAI are the key factors influencing the photosynthesis and transpiration in an ecosystem. Therefore, we used the partial correlation coefficient method to analyze the correlations between the interannual variation in the WUE and the influencing factors. The partial correlation coefficient formula is
where is the nth (n ≤ k − 2) order partial correlation coefficient between xi and xj, and k is the number of the variables. Each term on the right side of Equation (2) represents the (n −1)th order partial correlation coefficient.
2.3.4. Quantitative Attribution Method of the WUE Trend
We used multiple linear regression to quantitatively calculate the sensitivity of the WUE to the different influencing factors in the CLP, as follows:
where , , , and are the sensitivities of WUE to P, Temp, VPD, SD, and LAI, respectively. WUE, P, Temp, VPD, SD, and LAI are the annual time-series datasets during 2000–2018.
The WUE trend was assumed to be the sum of the WUE trend driven by the climatic factors (P, Temp, VPD and SD), the LAI, and other factors (e.g., microtopographic changes, increasing CO2, and nitrogen deposition). The differential form is as follows:
where is the net slope of the WUE trend, and , , , , , and are the impacts of P, Temp, VPD, SD, LAI, and others on the WUE trend, respectively.
According to the basic concept of total differentiation, the impacts of the climatic factors and LAI in Equation (4) can be decomposed via partial differentiation [14,45]:
where , , , , and are the slopes of P, Temp, VPD, SD, and LAI, respectively; , , , , and are the sensitivity coefficients derived from Equation (3); and is calculated using the residual method.
The relative impact rate of each influencing factor on the WUE trend was calculated as follows:
where is the relative impact rate of the influencing factor (P, Temp, VPD, SD, LAI, or other factors) on the WUE trends. Finally, the influencing factor that had the highest relative impact rate was defined as the factor that dominated the interannual WUE trend during 2000–2018 [46].
3. Results
3.1. Accuracy Evaluation of PML_V2 in the CLP
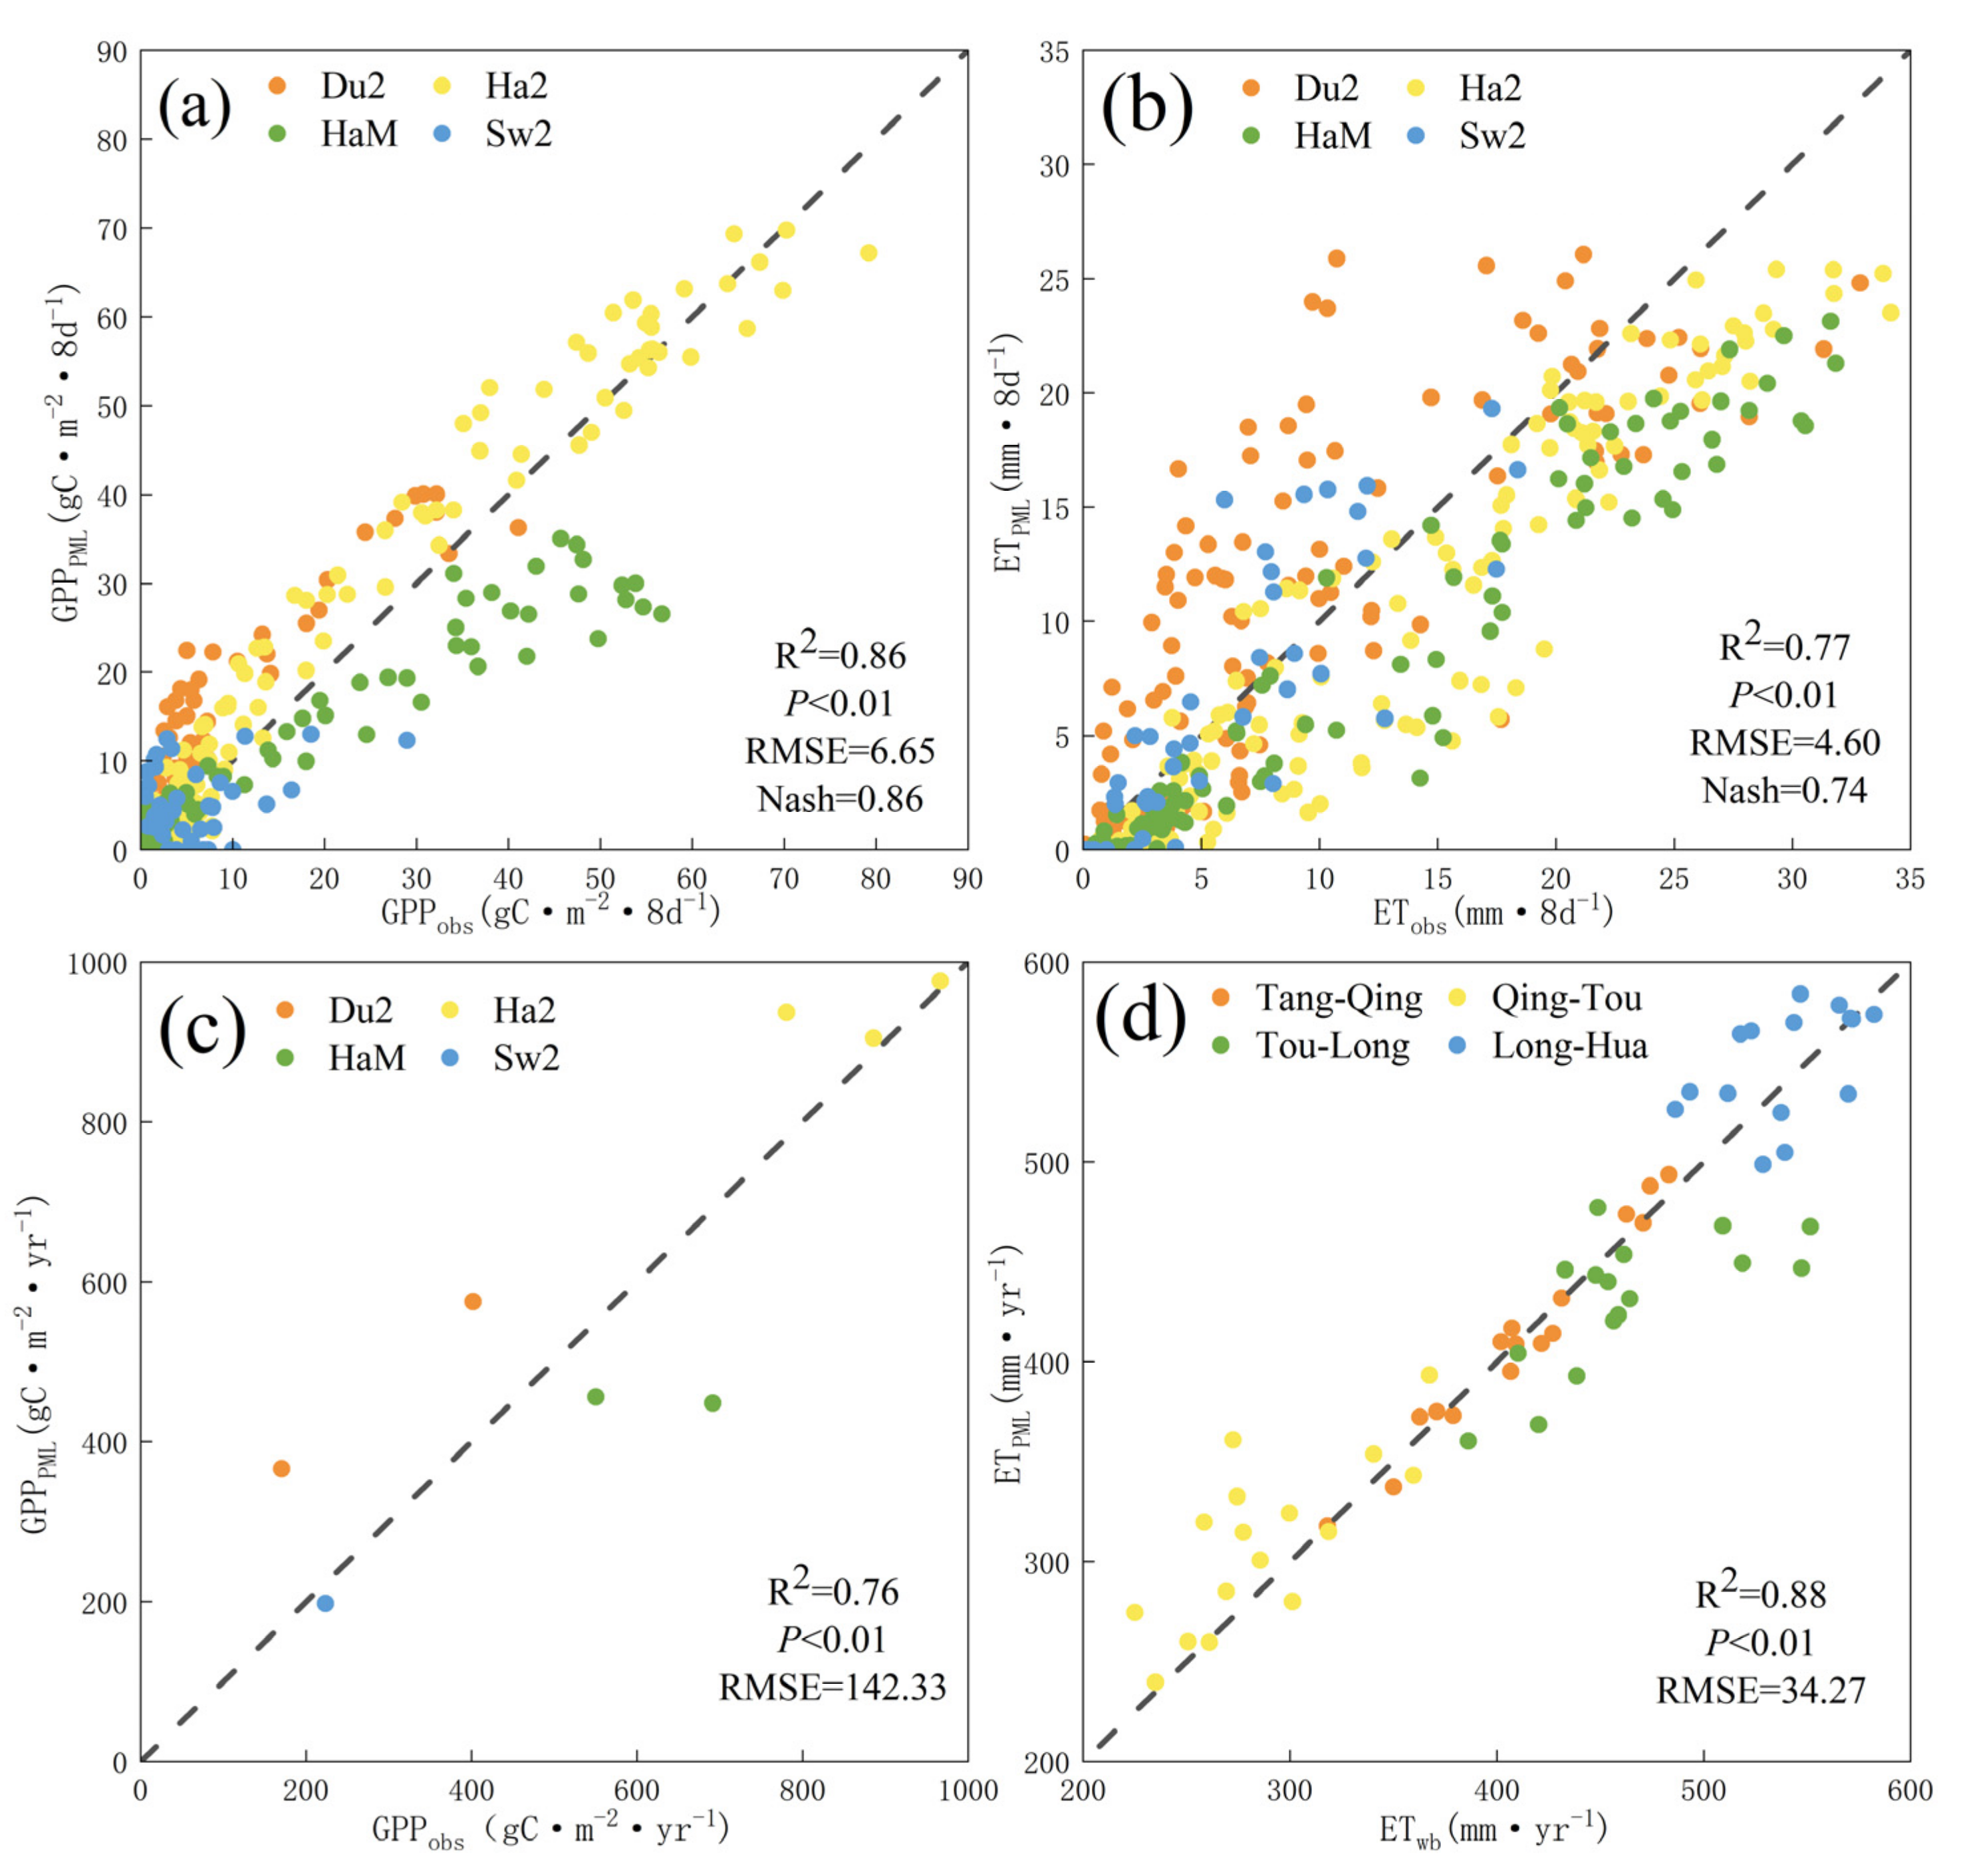
Figure 2a–c illustrates the validation accuracy of the PML_V2 product from the four flux sites. The results showed that the R2 and RMSE values of the GPPPML were 0.86 and 6.65 gC·m−2·8 d−1 and the R2 and RMSE values of the ETPML were 0.77 and 4.60 mm·8 d−1, respectively (Figure 2a,b). At the annual scale, the R2 and RMSE values of the GPPPML were 0.76 and 142.33 gC·m−2·year−1, respectively (Figure 2c). The comparisons of the simulated and water balance-based annual mean WUE for the four sub-basins from 2000 to 2018 indicate that the two are in good agreement, with R2 and RMSE values of 0.88 and 34.27 mm·year−1, respectively (Figure 2d). The validation results based on both the sites and the regional scale indicated that the PML_V2 remote sensing products generally performed well and were suitable for the analysis of the spatial-temporal pattern of the WUE and the impact mechanisms on the CLP.
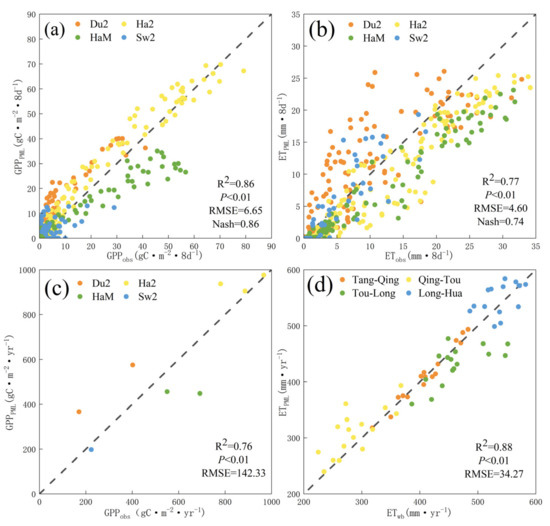
Figure 2.
(a–c) Validation of PML_V2 based on observations from four flux stations and (d) water balance over four sub-regions in the Yellow River Basin.
3.2. The spatial-temporal Variations in the WUE during 2000–2018
Spatially, the annual average WUE decreased gradually from the southeast to the northwest (Figure 3a), with an annual average of 1.242 gC·m−2·mm−1 during 2000–2018 on the CLP. Overall, the spatial pattern of the WUE was similar to that of the drought index (Figure 1e). The annual mean WUE was higher in the southeast, where the drought index was lower, and was lower in the northwest, where the drought index was higher. This result suggested that the drought index was a vital influencing factor affecting the zonal distribution of the WUE. As shown in Figure 3b, the WUE of all of the vegetation types decreased significantly with increasing drought index. Among them, the WUE of the grassland decreased the fastest with increasing drought index, which indicated that it was the most sensitive to the change in the drought index. The WUE of the shrubland decreased the slowest with increasing drought index, which indicated that it was the least sensitive to changes in the drought index. We also found that the annual mean WUE of the forests was the highest, that of the cropland was the second highest, that of the grassland was the third highest, and that of the shrubland was the lowest.
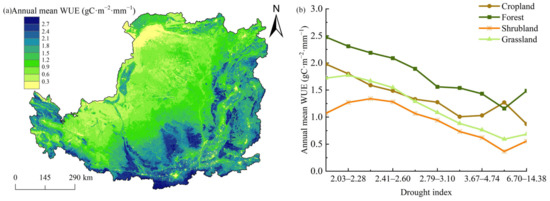
Figure 3.
(a) Spatial distribution of the WUE and (b) the annual mean WUE of the different vegetation types.
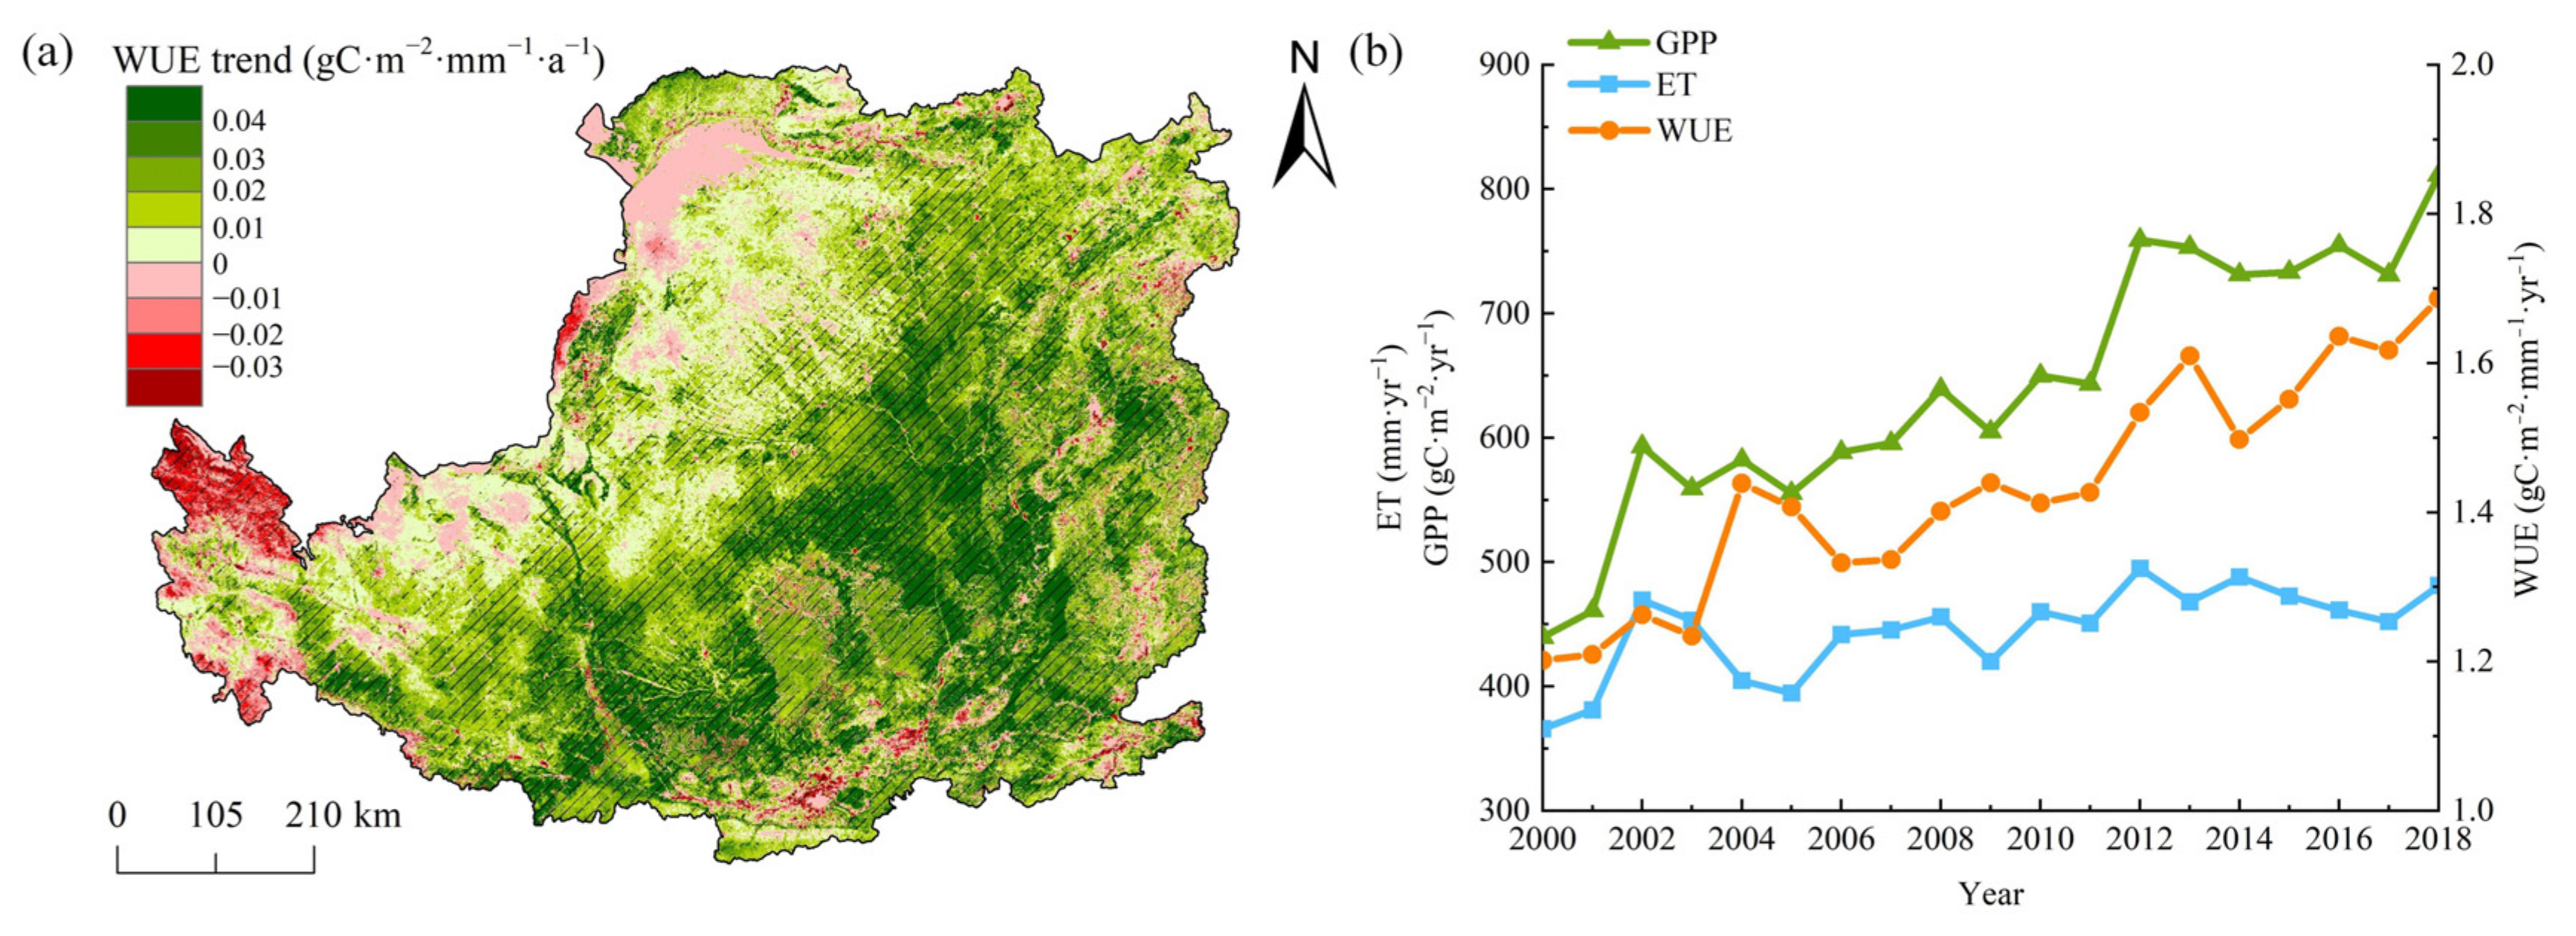
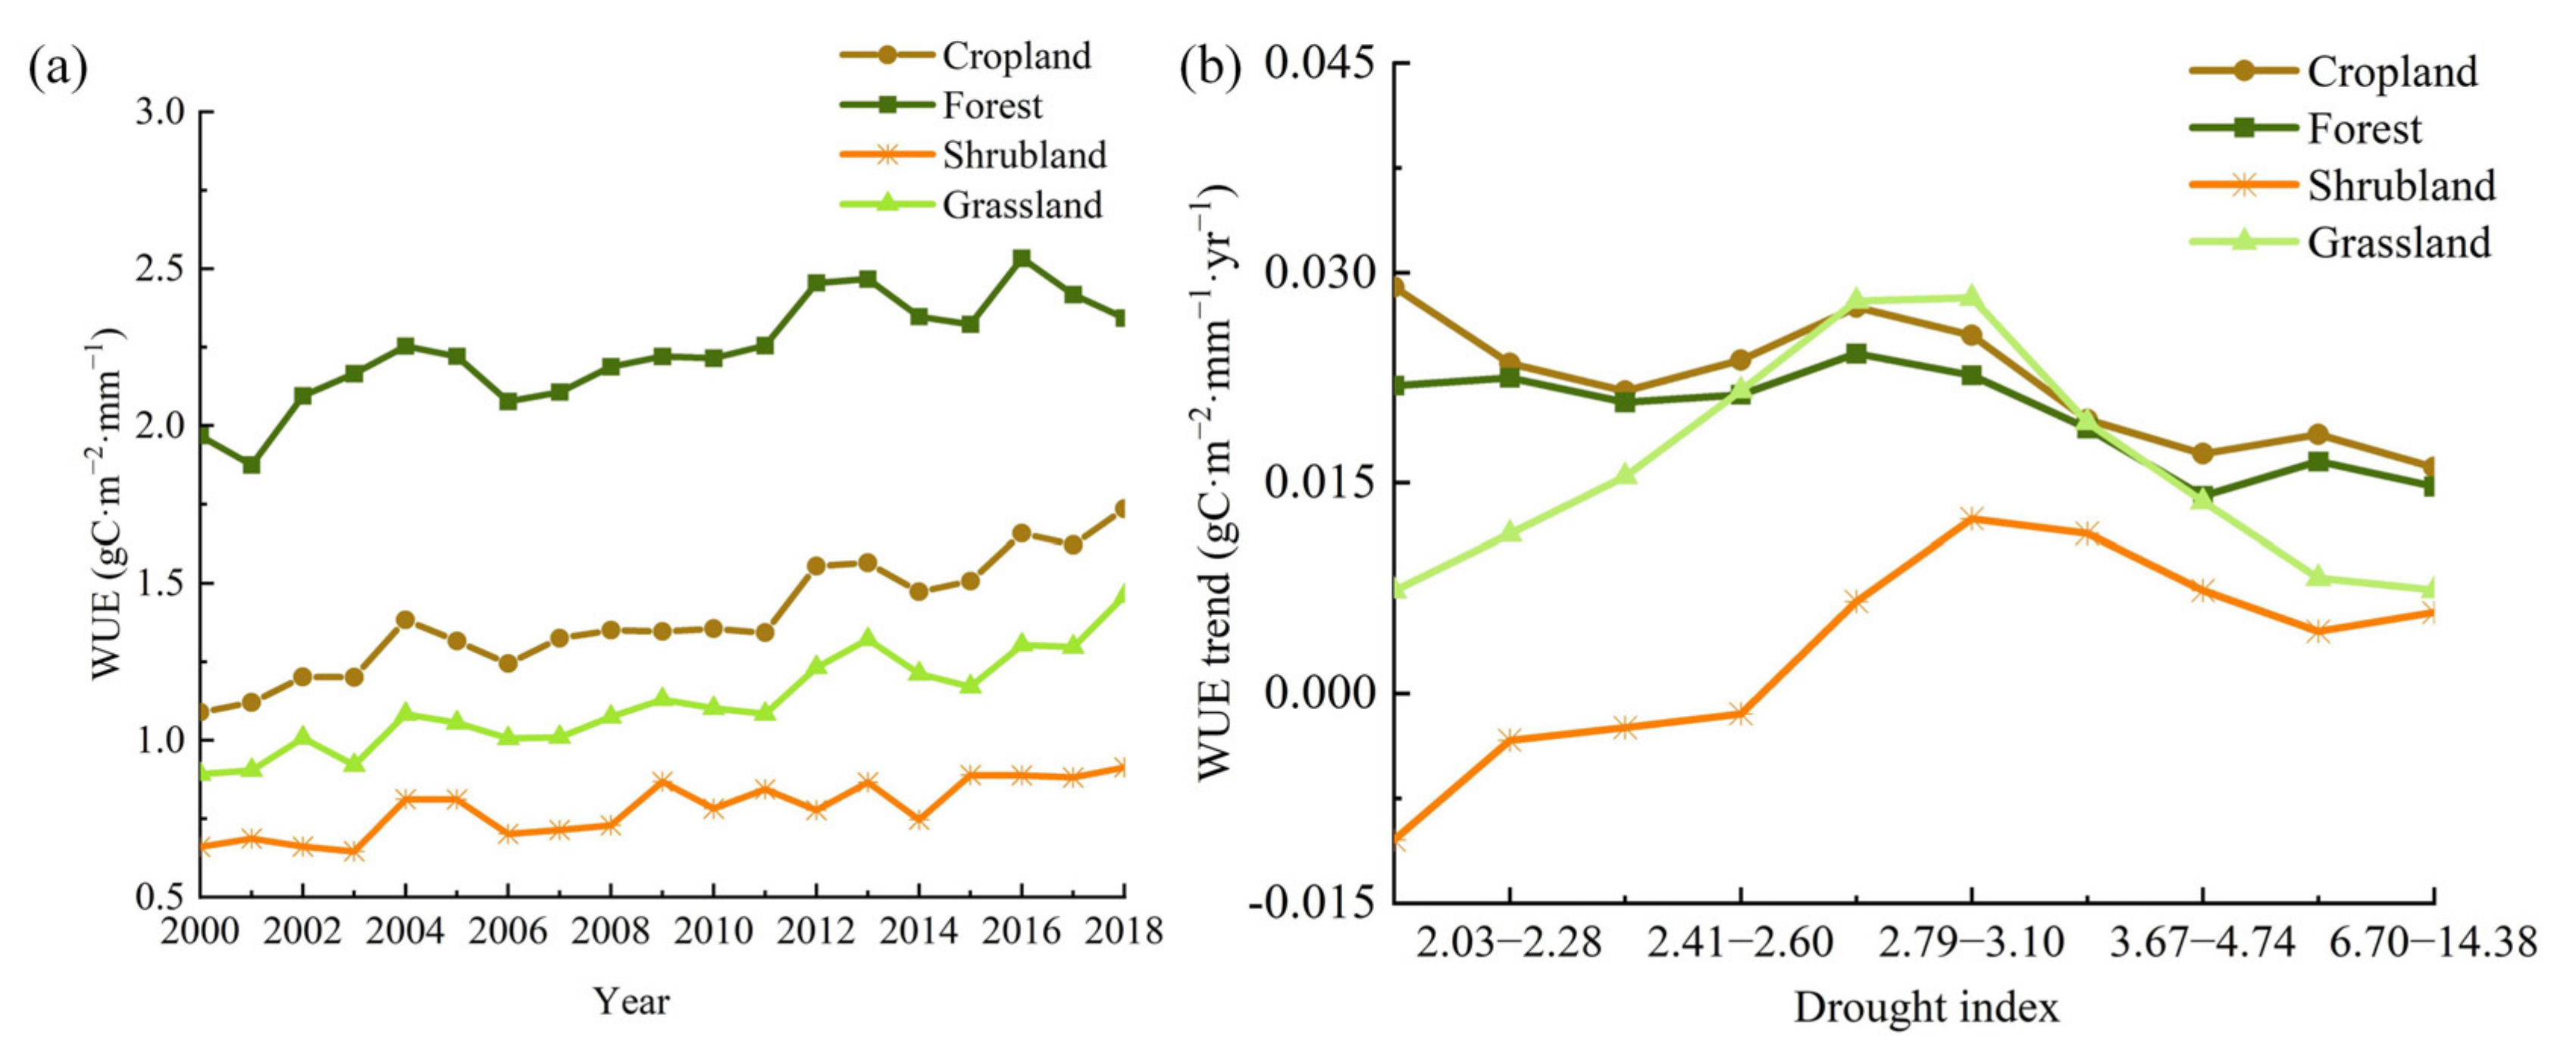
Figure 4a suggests that the WUE trend increased by about 87.32% on the CLP, and 47.36% exhibited a significant decrease during 2000–2018. In contrast, 16.11% of the study area exhibited a decreasing WUE trend, with a significant decrease in 2.92% of the areas in the western part of the CLP. The temporal variations in the annual mean values of the GPP, ET and WUE on the CLP significantly increased for both GPP and ET, and we found an insignificant positive WUE trend with a value of 0.024 gC·m−2·mm−1·year−1 (Figure 4b). The temporal variations in the WUE for different vegetation types on the CLP are shown in Figure 5a. It is evident that the interannual WUE variation characteristics of the different vegetation types from 2000 to 2018 were highly consistent, that is, they all exhibited significantly increasing trends (p < 0.01). In addition, the WUE trend of the cropland was 0.027 gC·m−2·mm−1·year−1 and was the fastest increasing trend. The WUE trend of the shrubland was only 0.013 gC·m−2·mm−1·year−1 and was the slowest increasing trend. Moreover, we calculated the WUE trends of the different vegetation types with the drought index (Figure 5b). We found that differences remained in the WUE trends with the drought index among the vegetation types, although the WUE trends for all of the vegetation types followed significantly increasing trends.

Figure 4.
(a) Trends of the WUE and (b) the temporal variations in the annual GPP, ET and WUE.
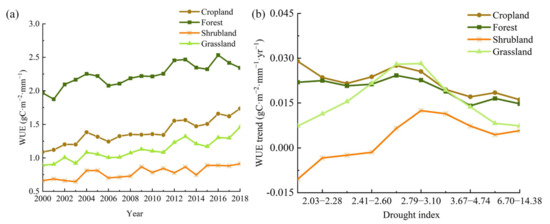
Figure 5.
(a) Temporal variations in the annual WUE and (b) the trend of the WUE with drought index for the different vegetation types.
3.3. Spatial Pattern of Correlation between WUE and Influencing Factors
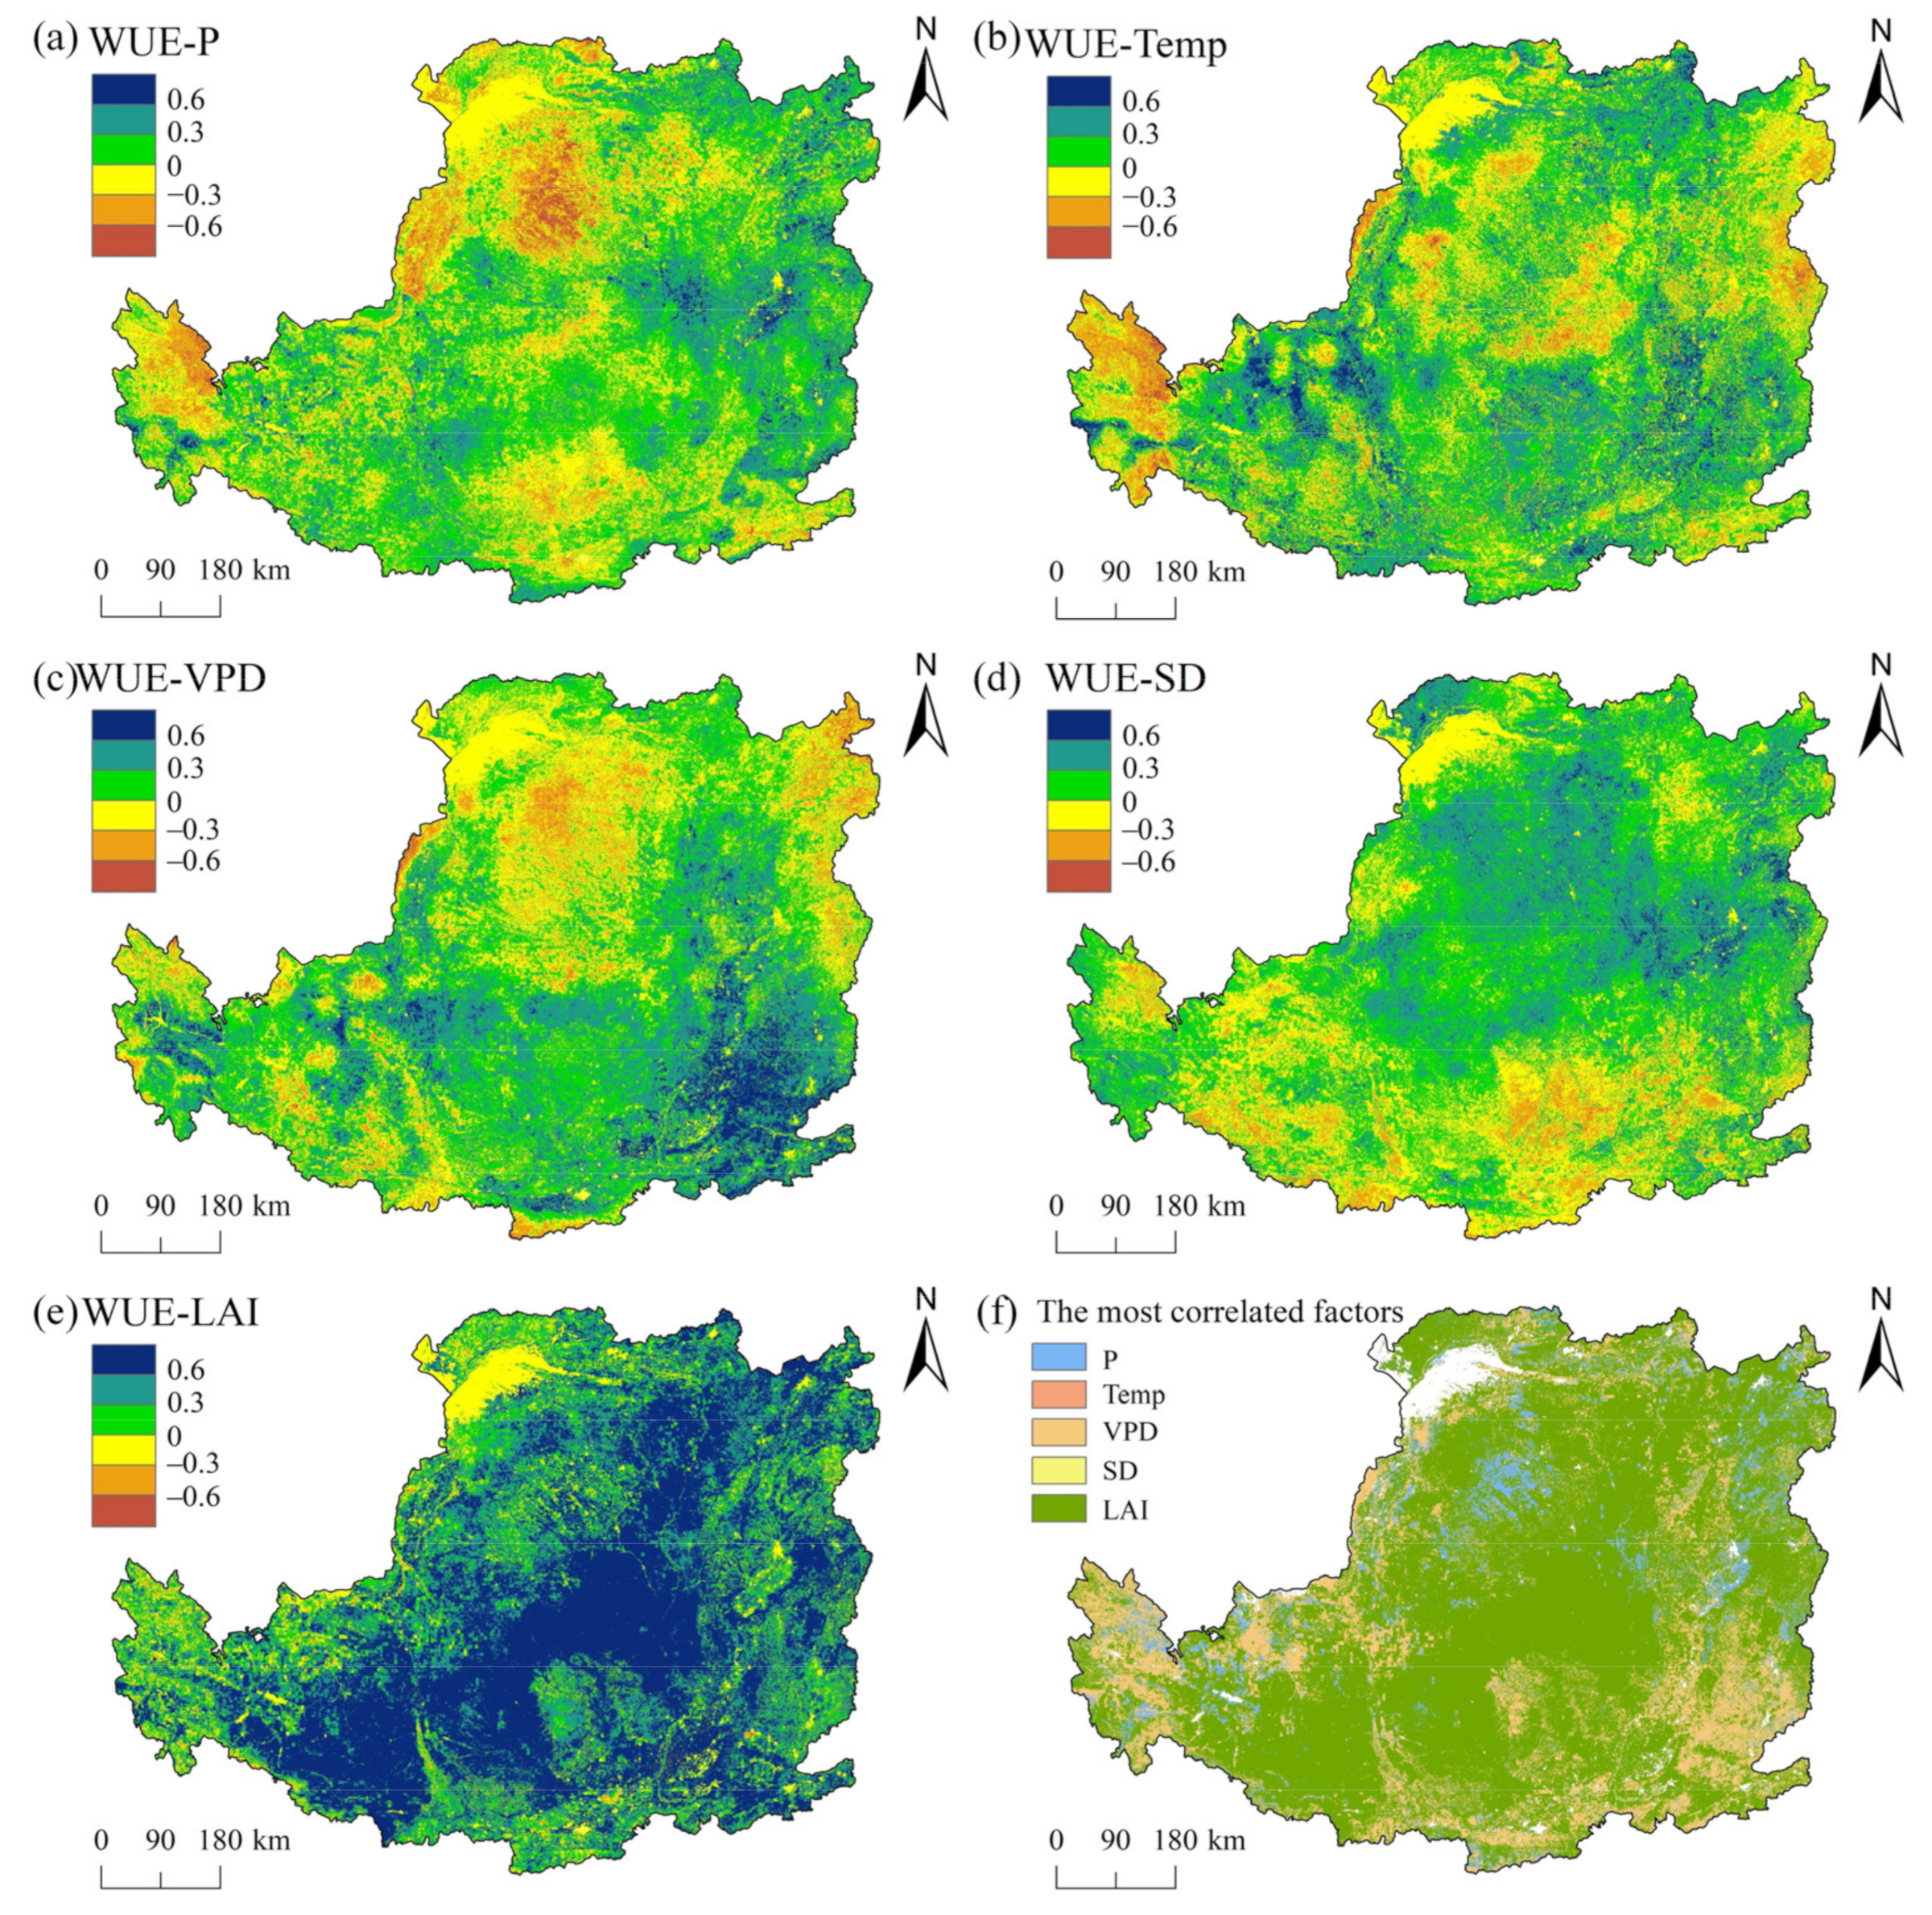
We performed partial correlation analyses to explore the relationships between the WUE and the influencing factors (P, Temp, VPD, SD and LAI) in each pixel, and the results revealed differences in the spatial patterns of the correlations between the different influencing factors and the WUE (Figure 6). The WUE was negatively correlated with P for 59.42% of the entire CLP, mainly in the northwestern region (Figure 6a). The area of the CLP where WUE was positively correlated with Temp was 63.56% (Figure 6b). A positive correlation between the WUE and VPD was observed in the southeastern part of the study area (65.8%), whereas a negative correlation was observed in the northwestern part of the study area (30.78%) (Figure 6c). Regarding the partial correlation between the WUE and SD, we found that the regions with a positive partial correlation were distributed mainly in the northern part of the CLP (Figure 6d). About 89.56% of the entire area exhibited a significant positive correlation between the WUE and LAI, and the high correlation coefficients values (R > 0.8) were distributed mainly in the southeastern part of the study area (Figure 6e). Figure 6f shows the spatial patterns of the most strongly correlated factors for each pixel. The results indicated that the regions where the most correlated factor accounted for the largest area of the entire CLP (more than 62.18%) were generally distributed in the central part of the study area. The areas where the Temp and VPD were the most correlated factors were 10.93% and 8.80%, respectively. The SD was the most correlated factor in 7.36% of the area. P was the most correlated factor over 7.31% of the area (smallest area).
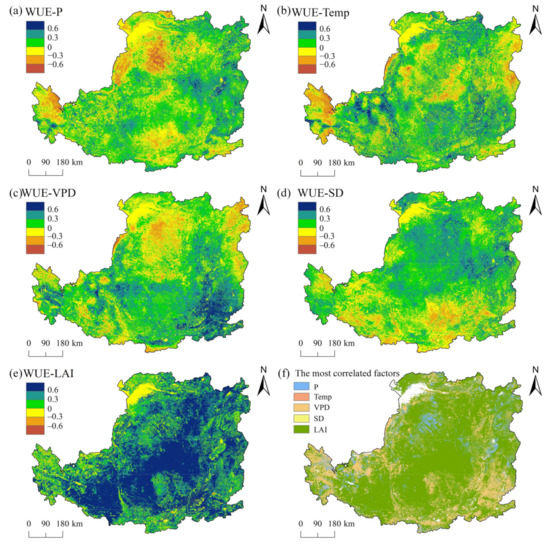
Figure 6.
Spatial distributions of the partial correlations between WUE and (a) P, (b) Temp, (c) VPD, (d) SD, and (e) LAI, and (f) the spatial patterns of the factors most strongly correlated with the WUE.
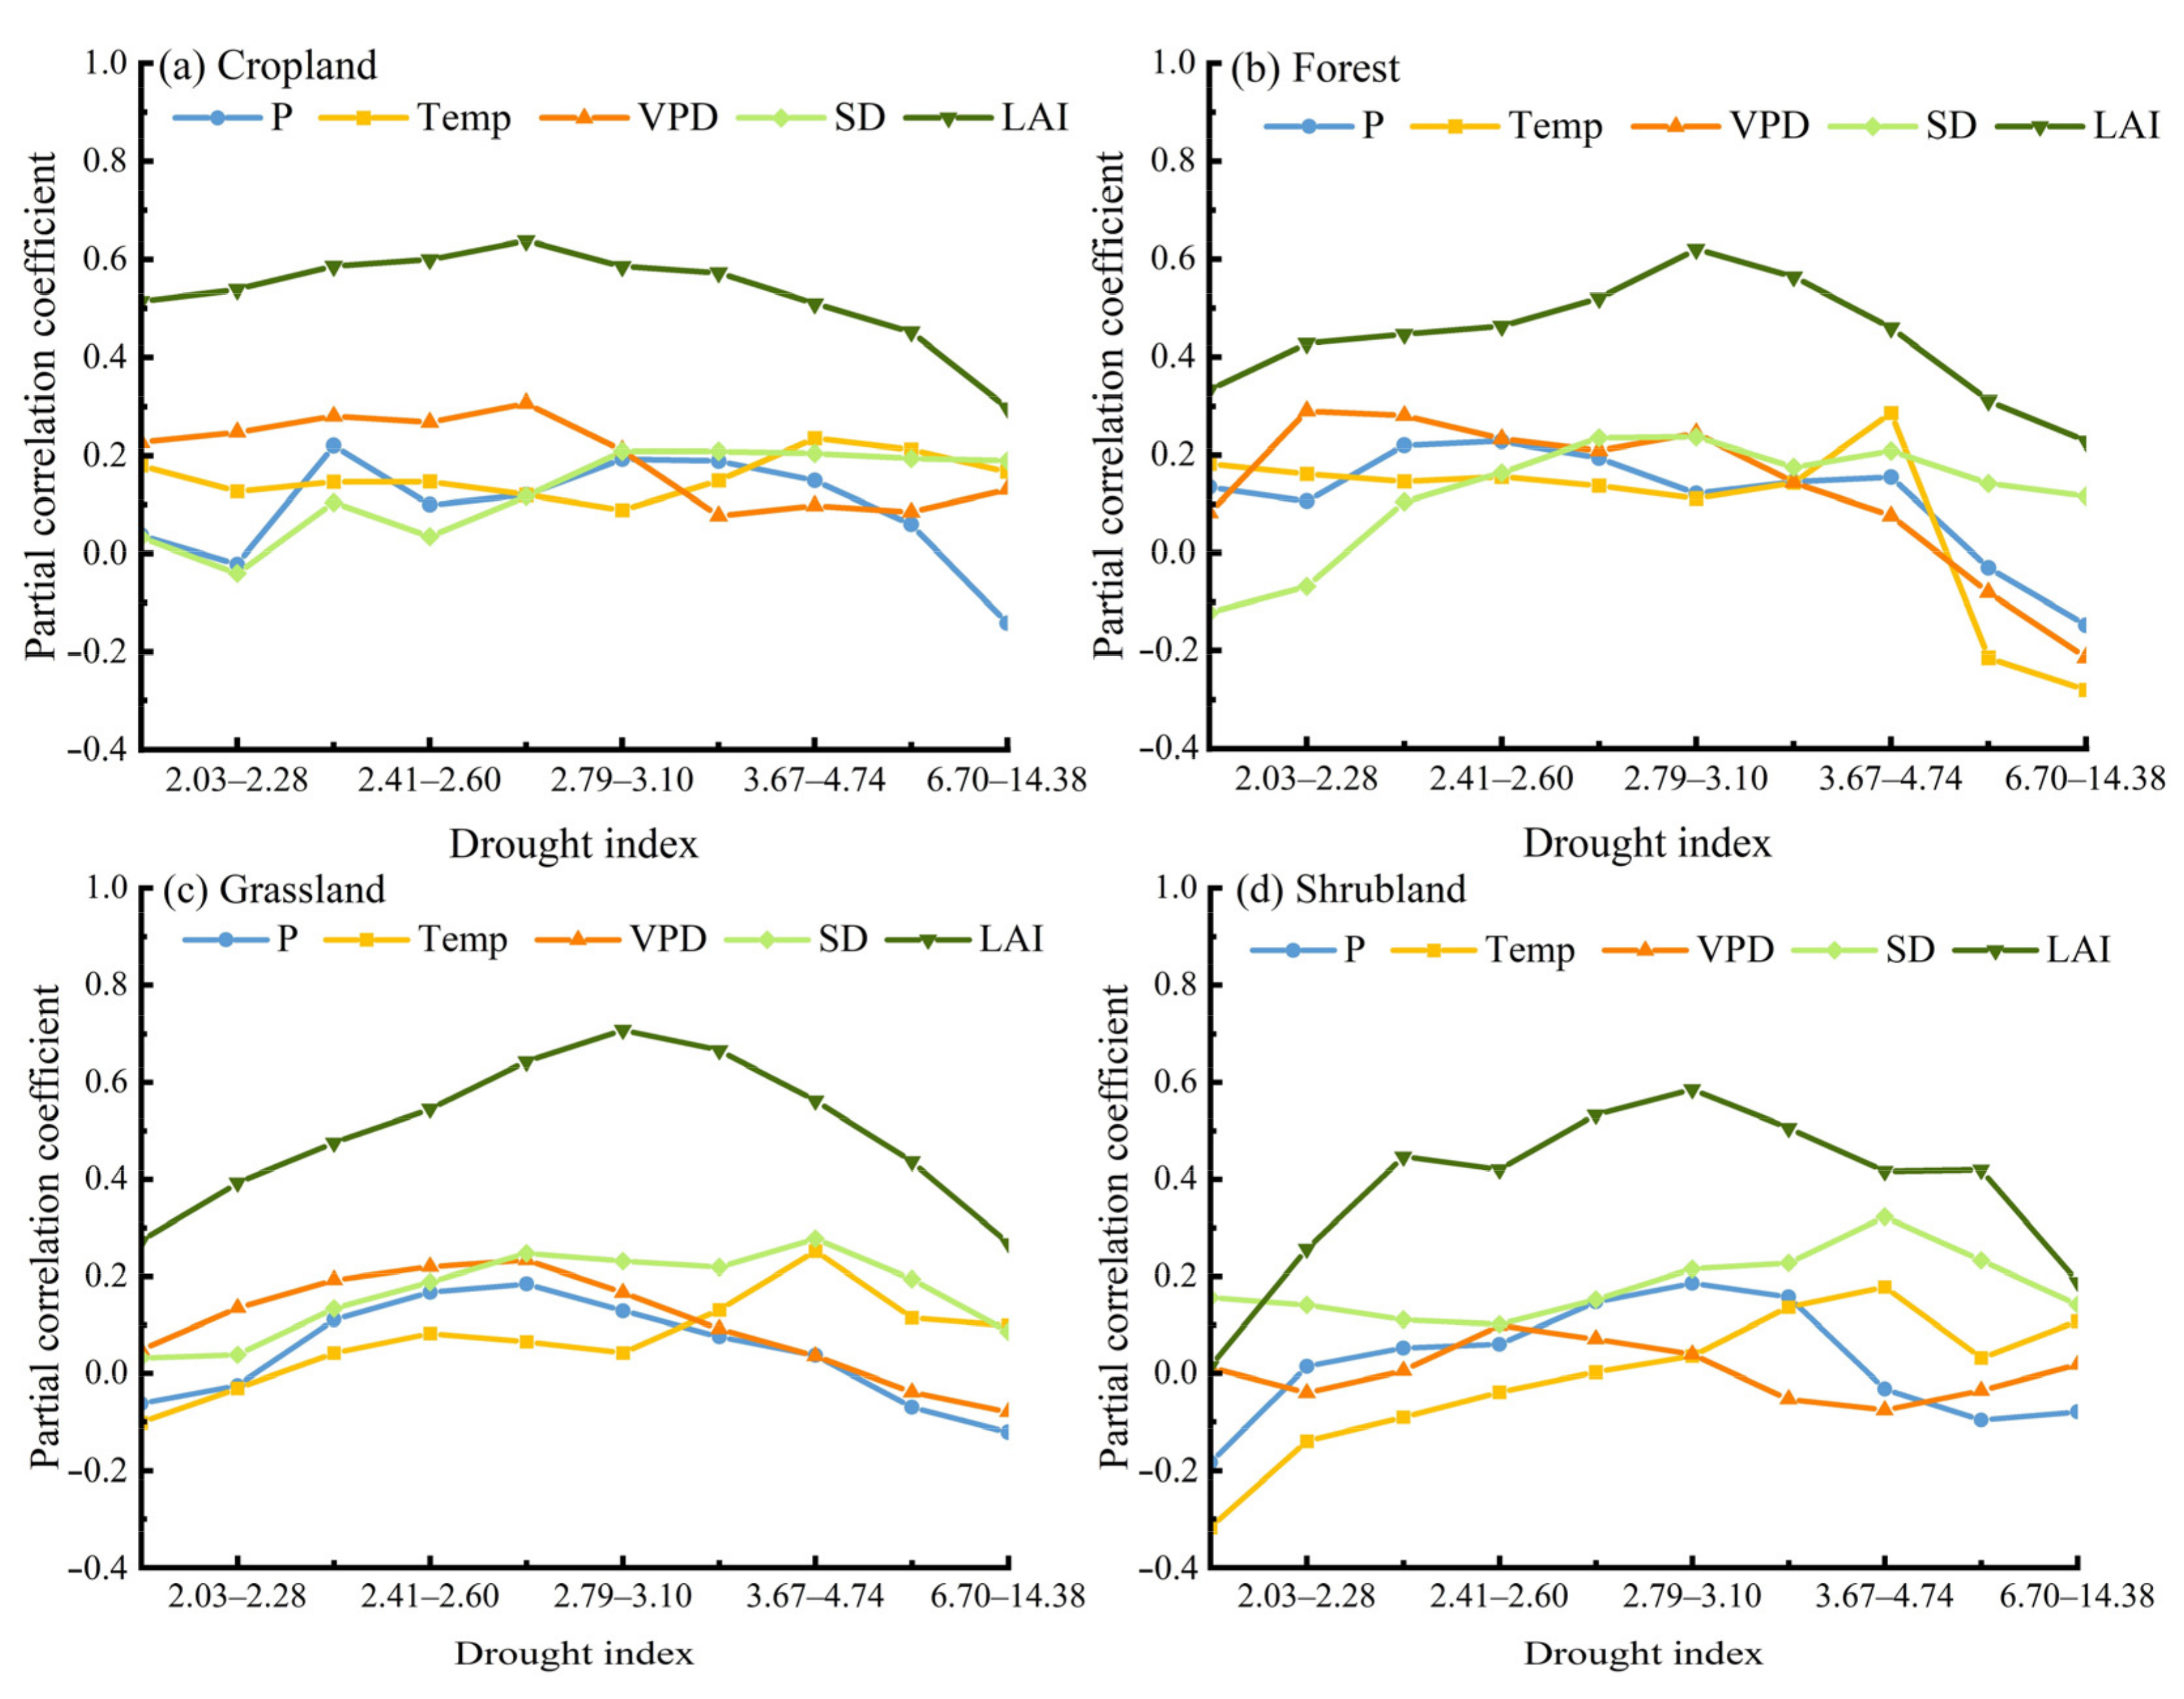
To identify the spatial divergence pattern of the WUE, we further analyzed the partial correlation coefficients of the WUE and the influencing factors (P, Temp, VPD, SD and LAI) for different vegetation types in relation to the drought index (Figure 7). We found that the partial correlation coefficients between the WUE and LAI were the highest for all of the vegetation types. The correlation between the WUE and the influencing factors for the cropland had the lowest sensitivity to the drought index (Figure 7a). The threshold effect existed in the relationship between the WUE and the LAI for the forests and grassland, which means that the correlation coefficients of both were characterized by increasing and then decreasing trends with increasing drought index, and the peak values occurred at drought index values of 2.79–3.10 (Figure 7b,c). Across the forest ecosystems, the correlations between the WUE and the meteorological factors (P, Temp, VPD and SD) were generally positive for drought indexes of 0 to 4.74, but they changed abruptly to negative correlations when the drought index was > 4.74 (Figure 7b). This result suggested that the WUE of the forests was negatively correlated with the meteorological factors under extreme drought conditions. We observed similar spatial variation characteristics of the correlations between the WUE and the influencing factors for the grassland and shrubland (Figure 7c,d). As the drought index increased, the correlation between the WUE and P changed from negative to positive and then to negative again; and that between the WUE and Temp changed from negative to positive for the grassland and shrubland. The links between the WUE and VPD for the grassland and shrubland were characterized by a trend that increased and then decreased with increasing drought indices.
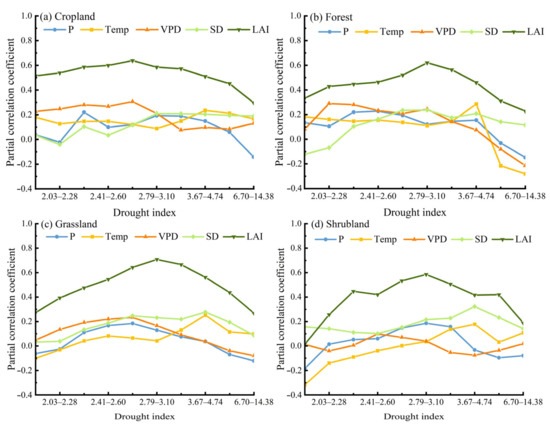
Figure 7.
Variations in the coefficients between WUE and the different influencing factors with increasing drought index for the (a) cropland, (b) forest, (c) grassland, and (d) shrubland.
3.4. Quantitative Impacts of Influencing Factors on the WUE Trend
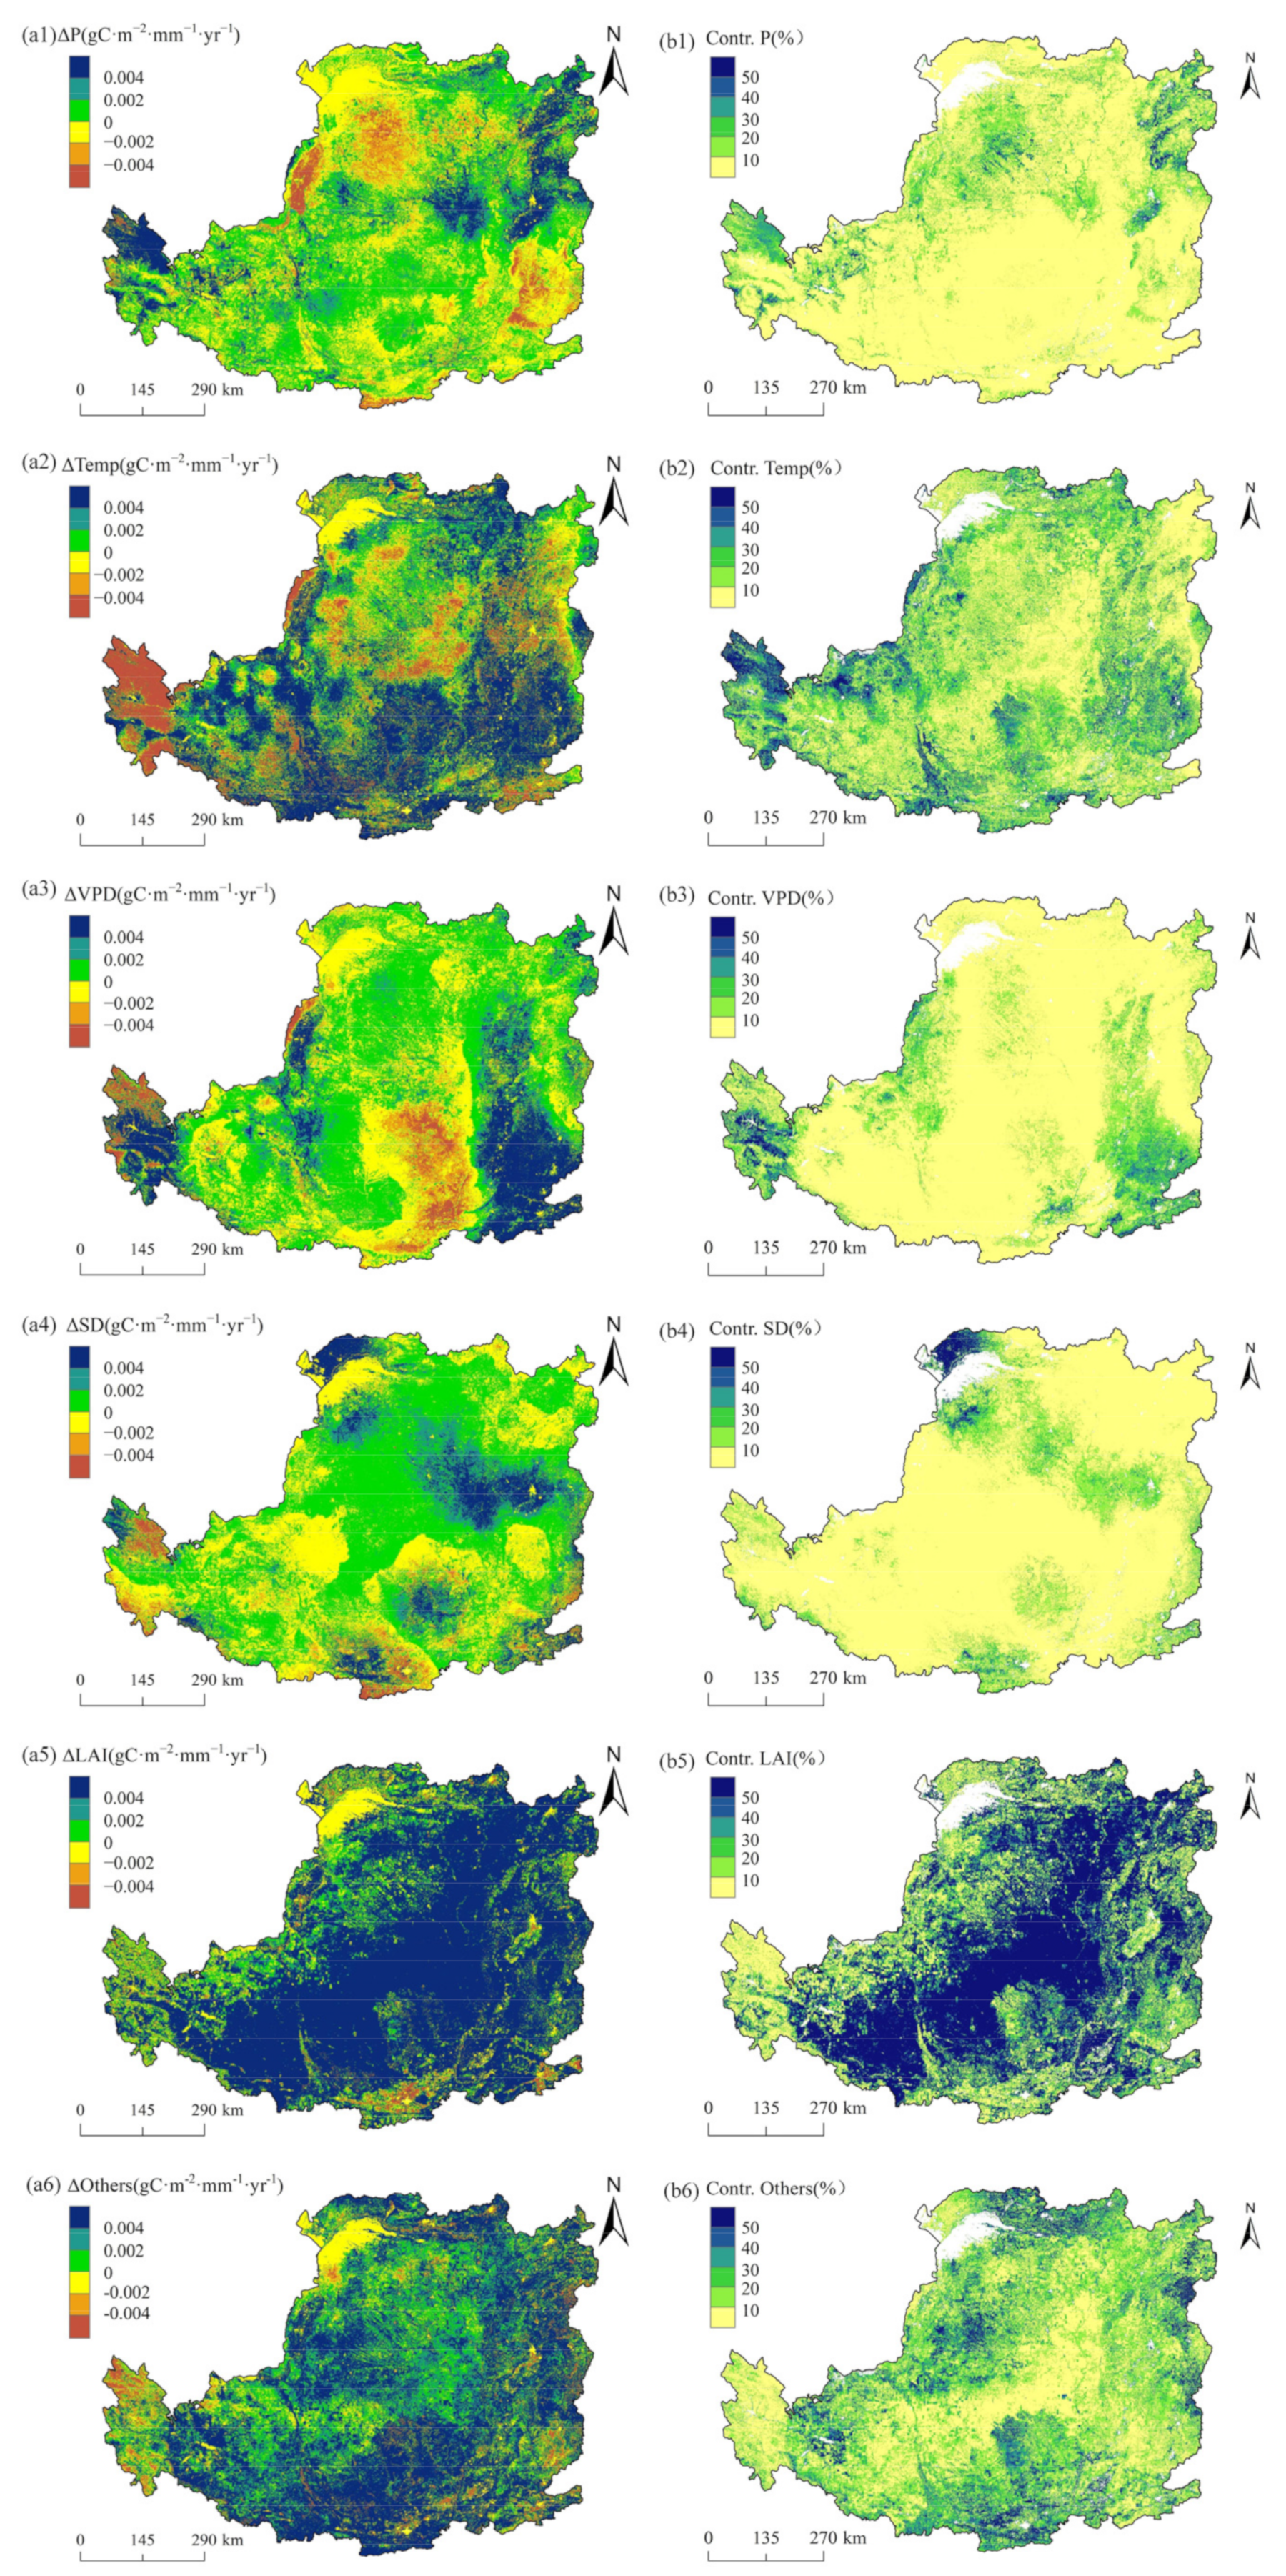
Based on Equations (2)–(4), we quantitatively calculated the impacts and relative impact rates of the different influencing factors on the WUE trends during 2000–2018. Figure 8 shows the spatial patterns of the impacts and the relative impact rates of the different influencing factors on the WUE trend over the entire CLP. The annual growth of the WUE on the CLP during 2000–2018 was 0.024 gC·m−2·mm−1·year−1. The LAI had the largest effect on the WUE trend, and the areas displaying a significant positive contribution between the LAI and WUE accounted for 86.22% of the total area of the CLP. We observed a negative contribution in 10.12% of the total area, mainly in the southern part of the study area (Figure 8(a5)). In the entire CLP, the impact and relative impact rate of the LAI on the WUE trends were 0.014 gC·m−2·mm−1·year−1 and 58.33%, respectively (Figure 8(b5)). The impacts and relative impact rates of the meteorological factors on the WUE trends are shown in Figure 8(a1–a4,b1–b4). It is evident that the negative impact of P was distributed mainly in the northwestern arid region of the CLP, which indicated that the variation in P led to the continuous decrease in the WUE trend in this region (Figure 8(a1)). In addition, the impact and relative impact rate of the P on the WUE trend were 0.001 gC·m−2·mm−1·year−1 and 4.17%, respectively (Figure 8(b1)). The Temp contributed positively to the WUE trend in 63.91% of the CLP, and the contribution was relatively large in the southeastern part of the study area (Figure 8(a2)). The increase in the WUE trend caused by the variation in Temp was 0.002 gC·m−2·mm−1·year−1 and its relative impact rate was 8.33% (Figure 8(b2)). The regions in which the WUE increased and decreased because of variations in the VPD accounted for 60.73% and 29.81% of the total area of the study area, respectively (Figure 8(a3)). In addition, the impact and relative impact rate of the VPD on the WUE trends were 0.002 gC·m−2·mm−1·year−1 and 8.33%, respectively (Figure 8(b3)). The SD made a positive contribution in the northern part of the CLP (Figure 8(a4)), and its impact and relative impact rate were 0.001 gC·m−2·mm−1·year−1 and 4.17%, respectively (Figure 8(b4)). Overall, the integrated impact and relative impact rate of the meteorological factors on WUE trend were 0.006 gC·m−2·mm−1·year−1 and 25.00%, respectively. As also can be observed from Figure 8a6, the area in which the WUE increased (82.24%) because of the other factors was much larger than that of the factors leading to a decrease in the WUE (14.22%), and its impact and relative influence rate were 0.004 gC·m−2·mm−1·year−1 and 16.67%, respectively (Figure 8(a6,b6)).

Figure 8.
Spatial patterns of the (a1–a6) impacts and (b1–b6) relative impact rates of the P, Temp, VPD, SD, LAI, and other factors on the WUE trend.
We calculated the impacts and relative impact rates of the different influencing factors on the WUE trend for different vegetation types (Figure 9). The result showed that except for the negative impact of P on the WUE in the shrubland, mainly in the arid zone, the other factors influencing the WUE trends for the different vegetation had positive impacts. By comparing and analyzing the relative impact rate of each influencing factor on the WUE for the different vegetation types, we found that the LAI was the dominant factor influencing the change in WUE for all of the vegetation types, and the magnitudes of its effect on the WUE trends of the vegetation types were in the following order: grassland > cropland > forest > shrubland. By comparing the relative impact rates of the P, Temp, SD and VPD of each vegetation type, we also concluded that the Temp had a positive effect and it was the dominant meteorological factor affecting the WUE trend (Figure 9b). Among the different vegetation types, the Temp contributed the most to the forest WUE, and its impact and relative influence rate were 0.004 gC·m−2·mm−1·year−1 and 16.46%, respectively. Compared with the integrated impact of the meteorological factors, the combined effect of the other factors was smaller.
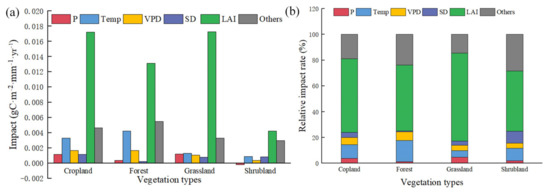
Figure 9.
(a) Impact rates of the different influencing factors on the WUE trends for different vegetation types, (b) relative impact rates of the different influencing factors on the WUE trends for different vegetation types.
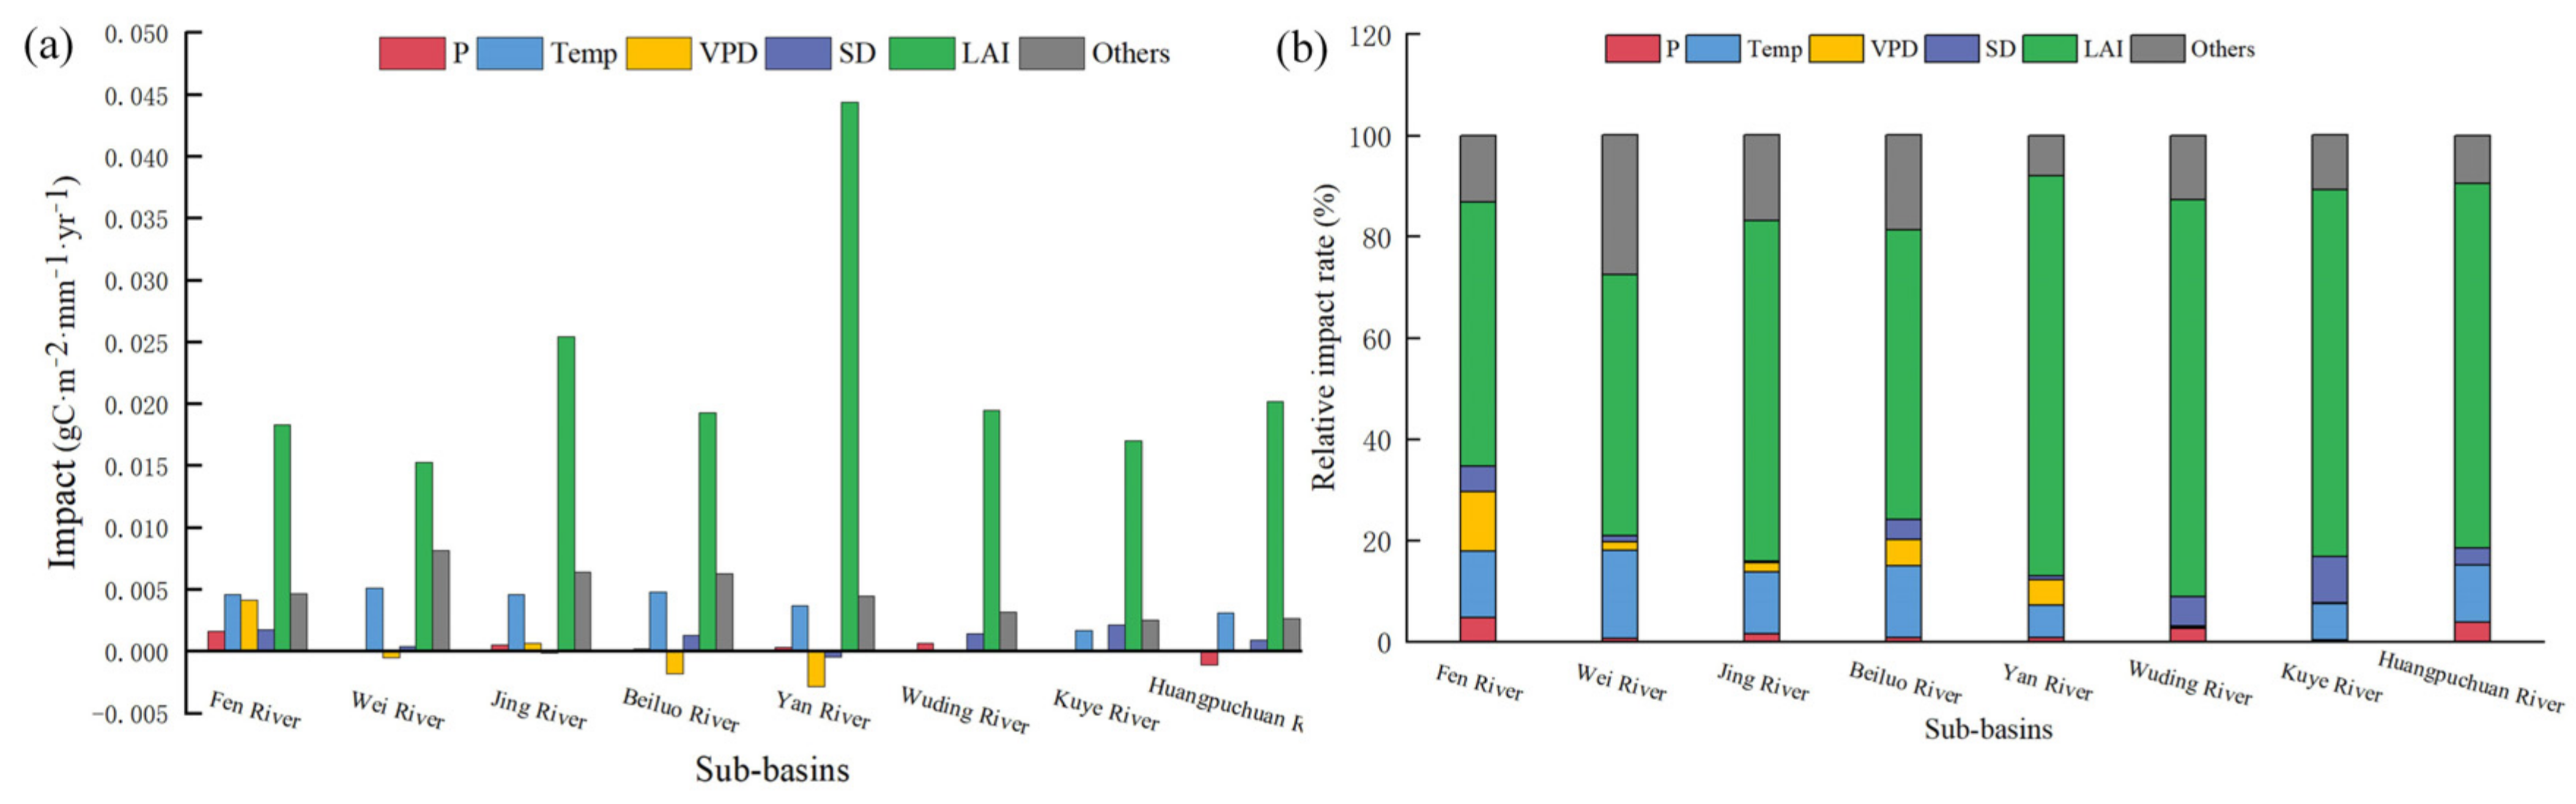
We further estimated and analyzed the effects of the influencing factors on the WUE trends in the different sub-basins in the CLP, including the Yan River, Wuding River, Jing River, Kuye River, Beiluo River, Huangpuchuan River, Wei River, and Fen River sub-basins. We found that the factors played mostly positive roles (Figure 10). Thus, we concluded that the LAI was the dominant factor influencing the WUE trends in each sub-basin, and its relative impact rates in the different sub-basins were ranked as follows: Yan River > Wuding River > Kuye River > Huangpuchuan River > Jing River > Beiluo River > Fen River > Wei River. Among the four meteorological factors, the Temp had the greatest effect on the WUE in the Fen River, Wei River, Jing River, Beiluo River, Yan River, and Huangpuchuan River sub-basins, and its relative impact rates were 13.04%, 17.35%, 12.20%, 14.23% and 6.55%, respectively (Figure 10b). The SD was the most influential meteorological factor in the Wuding River and Kuye River sub-basins, and its relative impact rates were 5.59% and 9.07%, respectively (Figure 10b). Overall, the meteorological factors had the large integrated effect on the WUE trends in the Wei River, Beiluo River, and Fen River sub-basins; however, they had a small integrated effect on the WUE trends in the Kuye River, Yan River, and Wuding River sub-basins. In contrast, we found the other factors to have a large impact on the WUE trends in the Wei River, Beiluo River, and Jing River sub-basins (Figure 10b).

Figure 10.
(a) Impact and (b) relative impact rates of the different impact factors on the WUE trend in the eight sub-basins in the Chinese Loess Plateau.
4. Discussion
4.1. Analysis of Spatial Heterogeneity of Multiyear Average WUE and WUE Trend
From 2000 to 2018, there was a significant increase in the WUE (0.024 gC·m−2·mm−1·year−1) across the CLP. This increase was mainly because the growth rate of the GPP was significantly larger than that of the ET (Figure 4b). Spatially, the WUE in the study area was characterized by a large variability (i.e., gradually decreasing from southeast to northwest), which also was reported by Han et al. [31]. This spatial distribution was basically consistent with that of the drought index, and it was caused by the sufficient precipitation supply and large LAI in the humid areas and strong vegetation photosynthesis, which resulted in a higher GPP. Simultaneously, the low precipitation, sparse vegetation, and high soil evapotranspiration in the arid areas made it difficult for water to infiltrate and be used for vegetation growth, resulting in a low WUE [47].
By investigating the spatial variation characteristics of the WUE for the different vegetation types, we found that the WUE trends of the vegetation ecosystems decreased with increasing drought index. This may have been caused by the relative abundant precipitation and low evapotranspiration in the areas with low drought indexes. Moreover, the vegetation grew well and the vigorous photosynthesis was able to convert more CO2 into organic matter in the atmosphere [48]. This, coupled with the higher vegetation cover, which shaded the soil, reduced the soil evaporation to some extent [49]. Taken together, most of the water consumption in this area was used for organic matter accumulation by the vegetation itself, resulting in a high WUE. That is, as the drought index increased, the precipitation and vegetation cover decreased and the soil evaporation increased. These reasons jointly contributed to the decrease in the total carbon sequestration and the gradual decrease in the WUE.
We also found that there were differences in the WUE among the different vegetation types. Specifically, the annual mean WUE of the forests was the highest, that of the cropland was the second highest, that of the grassland was the third highest, and that of the shrubland was the lowest. This was probably caused by the zonal differences in the vegetation, the hydrothermal conditions, and their distributions [32,50]. The forests were mostly composed of tall trees with high LAI and canopy cover values, intense photosynthesis in the leaves, and well-developed root systems of the trees. This could help the deep soil moisture to be absorbed and used for vegetation growth and to store organic matter, which is why it had the highest WUE [51]. The shrubland was the primary vegetation type planted in ecological restoration projects in arid and semi-arid areas, and the shrubland was located in areas with poor stand conditions. The insufficient soil water in these areas resulted in low vegetation coverage and LAI values, and the water was universally used for soil evaporation rather than vegetation photosynthesis. In addition, the vegetation of typical shrublands (e.g., sea-buckthorn and Caragana korshinskii) have small leaf sizes and low chlorophyll contents, making it difficult for remote sensing signals to truly reflect the vegetation cover of shorter shrubland, which resulted in a certain degree of underestimation of the GPP remote sensing products [52,53]. Consequently, the WUE of shrubland was relatively small. In previous studies, the phenomenon that forests could generate more organic matter than cropland and that the arbor WUE was higher than that of herbaceous plants were also observed by Xia et al. [54].
The growth rate of the WUE in the cropland exhibited a slightly decreasing trend as the drought index increased, whereas that of the other vegetation types exhibited increasing and then decreasing trends. Importantly, the cropland was influenced by anthropogenic irrigation activities, resulting in a more stable interannual variation in its GPP [55]. Irrigation activities in dry regions can still meet the cropland water consumption demand, so the sensitivity of the rate of cropland WUE to the drought index is low. The implementation of large-scale ecological conservation projects significantly contributed to the increase in the GPP in both the shrubland and grassland under different ecological conditions [56]. The transpiration of the vegetation was more sensitive to the soil moisture, but there was limited water available for vegetation evapotranspiration in the dry areas, and thus, the rate of increase of the ET slowed down. As a result, the rates of increase of the WUE trends in the shrubland and grassland increased.
4.2. Underlying Causes of the Effects of the Influencing Factors on the WUE Trend
The effect of the LAI on the change in the WUE was the largest for the entire Chinese Loess Plateau, the different vegetation types, and the different sub-basins from 2000 to 2018. We attributed this effect to the fact that the Chinese government has implemented ecological restoration projects on the CLP since 1999, such as planting trees and grass in the barren land, abandoning farmland and planting trees and grass, and prohibiting grazing on hills, which has led to a significant increase in the vegetation LAI [34]. The increase in the leaf area significantly increased the capacity of the vegetation to fix atmospheric CO2, and it also significantly increased the share of the vegetation transpiration and the trapped evaporation in the total evapotranspiration of the ecosystem, which led to a significant increase in the WUE.
Previous studies have concluded that in arid and semiarid areas, water is the most vital factor limiting the GPP [1]. An increasing trend in precipitation mitigates the water limitations and thus sustains the plant growth more efficiently, which improves the plant productivity and the WUE [57]. Additionally, since 2000, the precipitation in the CLP region has been relatively abundant, providing favorable climatic conditions for vegetation growth. Therefore, precipitation had a positive effect on the WUE in most areas. Nevertheless, we observed that the precipitation had a negative impact on the WUE in the northwestern part of the CLP, which was consistent with the results of previous studies [58]. We attributed this impact to the fact that the region was a severely arid region with scarce perennial precipitation. The evapotranspiration was high in the severely arid region, and soil moisture increased but evaporated rapidly after precipitation occurred, resulting in a decrease in the WUE as the total ET increased. It was difficult for the soil moisture to be used for vegetation photosynthesis. In addition, the prolonged drought stress altered the morphological, physiological, and biochemical traits to help vegetation adapt to drought [59]. As physiological responses, drought stress significantly decreased maximum photosynthesis rate and electron transfer rate [10]. The significant decrease of photosynthetic rate could make WUE decrease, and this may conform the potential efficiency of the cooling system. Because the shrubland was distributed mostly in the northwest, the increase in precipitation had a negative effect on the shrubland WUE. Meanwhile, drought could reduce the morphology of the plant, such as reduction of leaf size and vegetative growth, as well as reduce the plant vitality by reducing the photosynthesis and leaf water potential, and reduce the transpiration, vegetative growth, and leaf area of the plant. Because changes in the Temp, VPD, and SD affected the vegetation photosynthesis and transpiration by altering the leaf stomatal conductance, the mechanisms by which these three factors influenced the vegetation WUE were complex. In our study, the WUE was found to be positively correlated with temperature in most of the region. When the temperature increased, more water vapor evaporated from the bare soil into the atmosphere [1], and the transpiration was partly driven by the high VPD. This high evaporative and high VPD-driven transpiration water loss, which was decoupled from the vegetation productivity, led to a higher WUE [5]. Moreover, the moderate increase in the temperature also enhanced the activity of the enzymes required for leaf photosynthesis and thus the intensity of photosynthesis, which likewise promoted an increase in the WUE trends for the vegetation types [60]. It also had been shown that the increase in the SD allowed the vegetation to maximize the effective photosynthesis [61]. In general, the increases in Temp, VPD and SD all played roles in increasing the WUE trend of the vegetation ecosystem.
Note that the effects of the other factors (e.g., microtopographic changes, the ring-CO2, N deposition, and soil fertility enhancement) on the vegetation WUE were found to be non-negligible. To effectively suppress soil erosion on the CLP, soil and water conservation engineering measures such as the construction of terraces, silt dams, and horizontal steps were implemented on a large scale, leading to variations in the local microtopography. These variations could modify the precipitation redistribution process, making a relatively adequate water supply available for vegetation growth, which would result in a change in the vegetation WUE [8,31]. In addition, long-term accumulation of plant litter production and root development might effectively improve soil organic matter content and infiltration capacity [62]. It was also one of the essential factors affecting vegetation WUE. Numerous studies have shown that increased atmospheric CO2 concentration and nitrogen deposition contribute significantly to the increase in the vegetation GPP in China, thus increasing the vegetation WUE [4,63,64]. Future studies should further explore the effects of the influencing factors.
4.3. Uncertainties
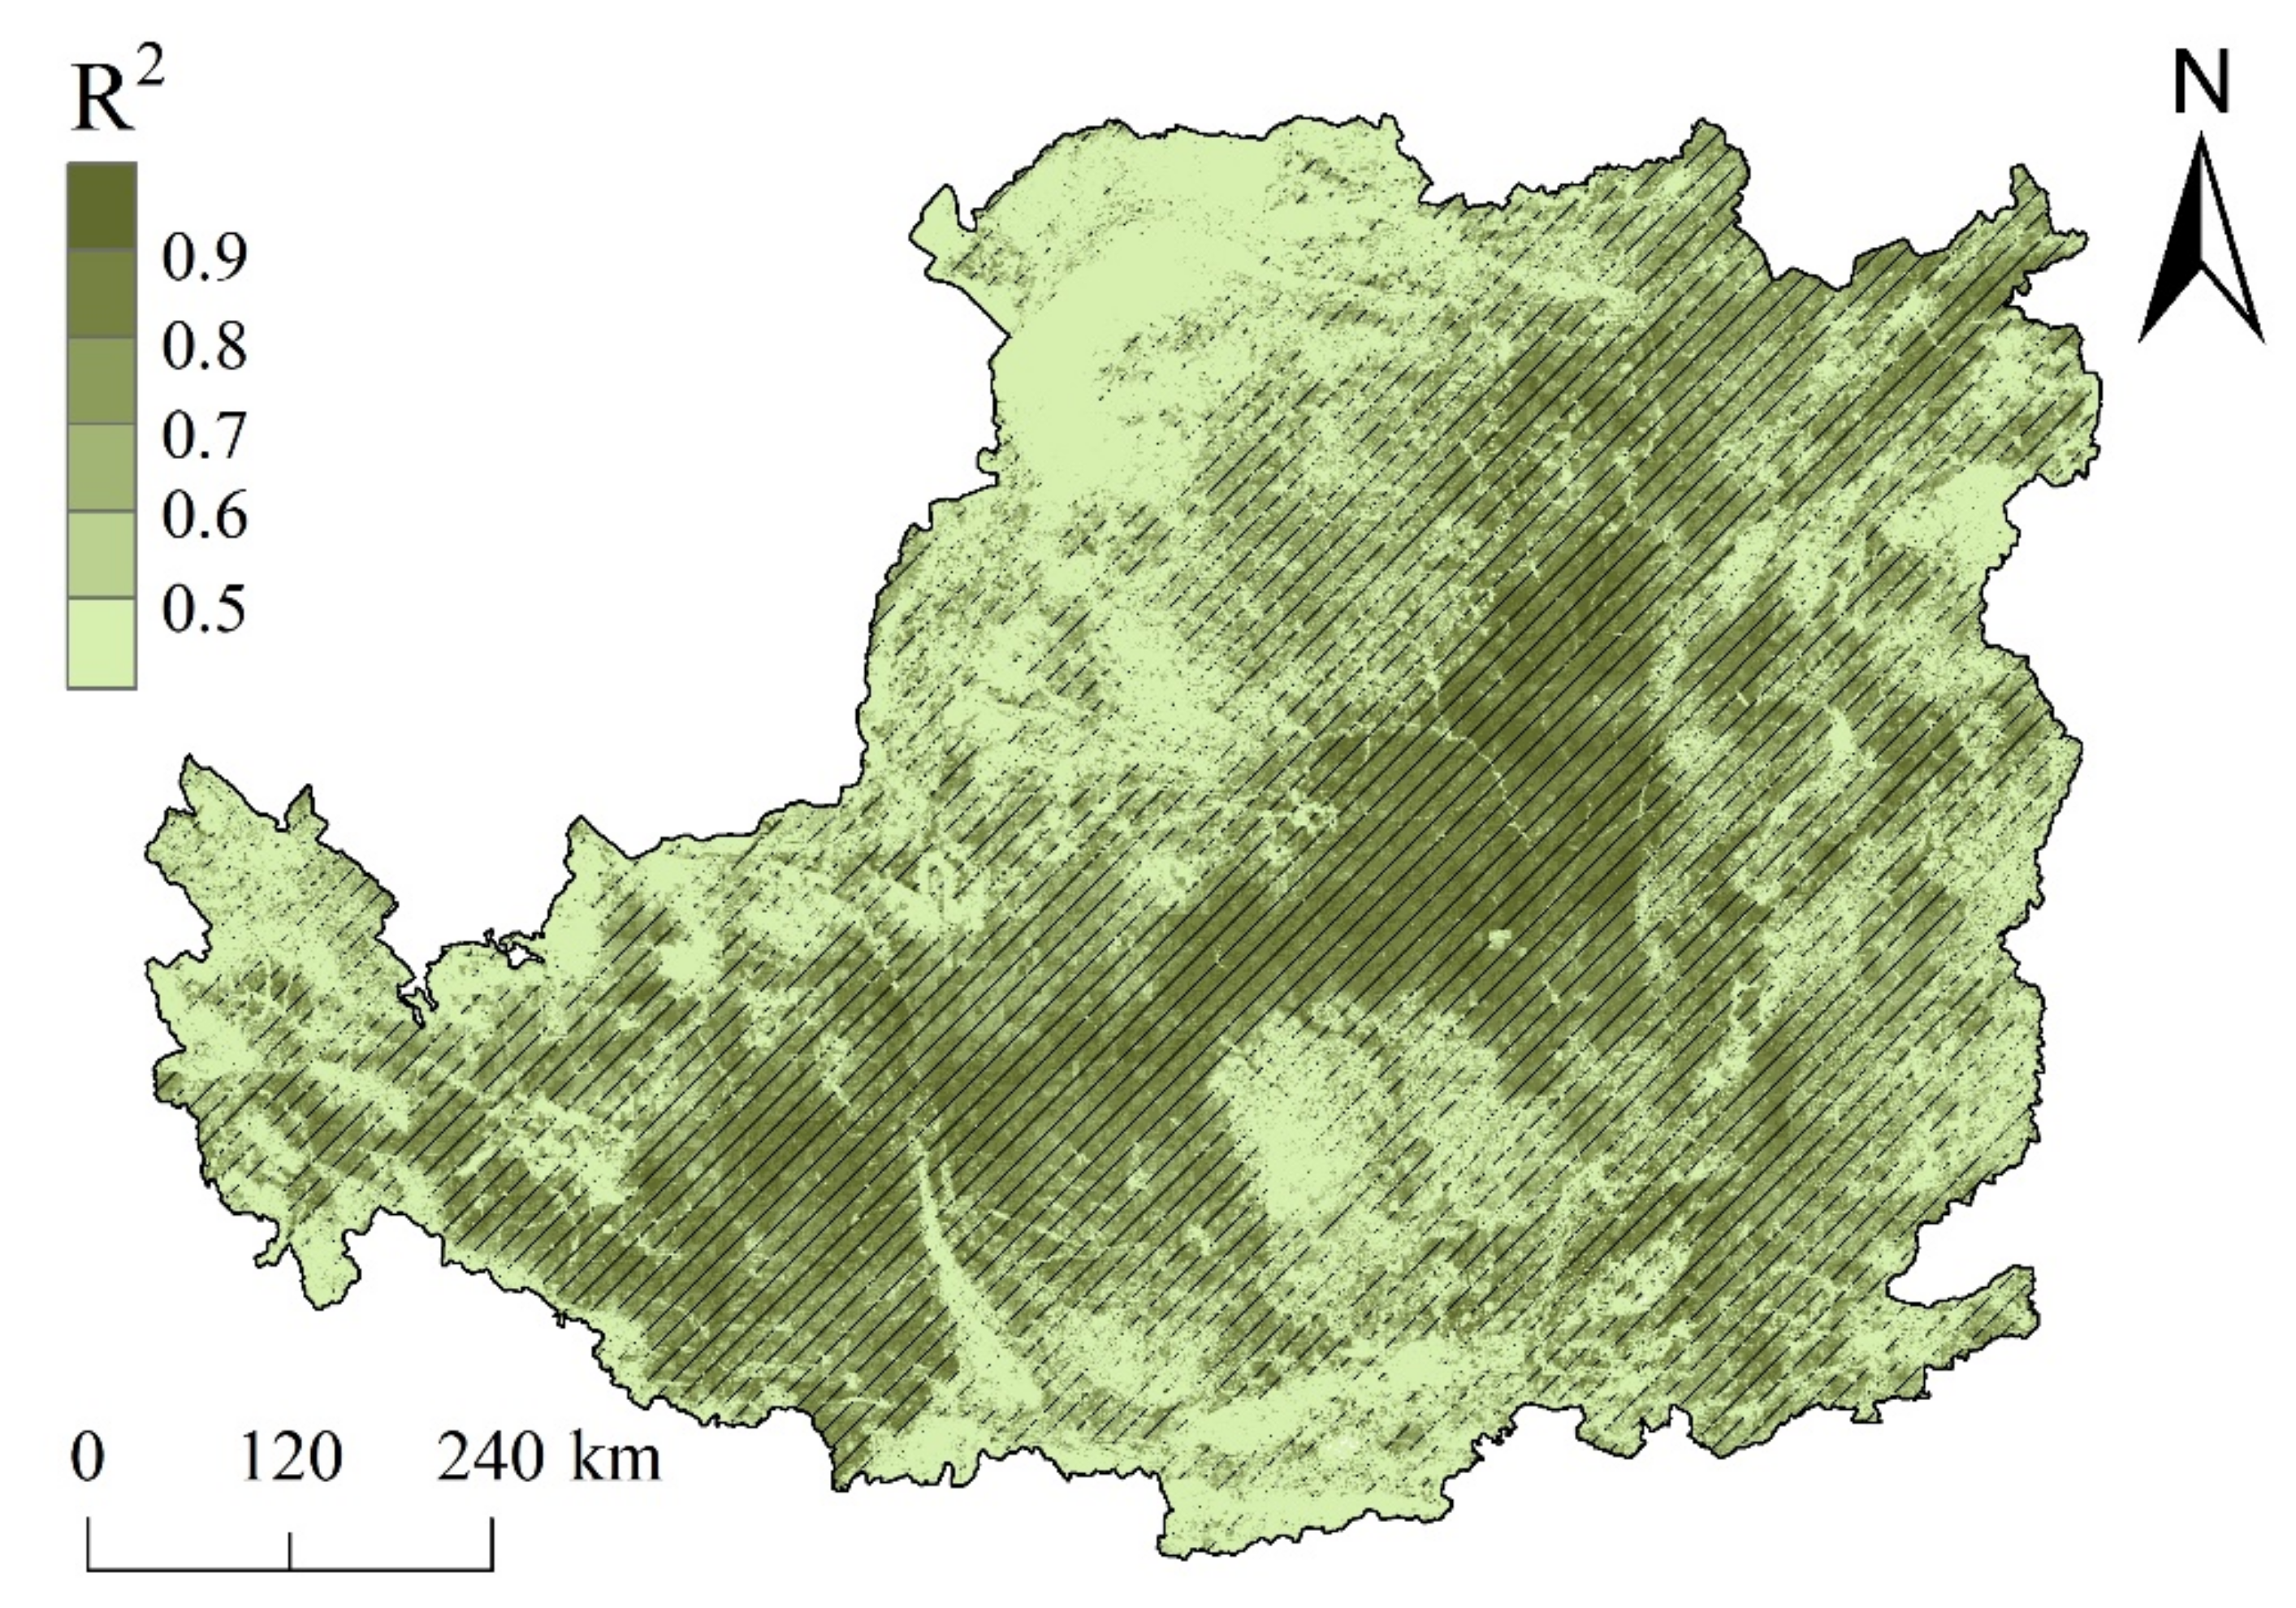
First, we validated the remote sensing products of the PML_V2 using the eddy covariance-derived data from the flux towers and compared it with the data derived from the water balance equations. Because of the site data limitations, our validation process still had inevitable uncertainties, and further comparative optimization should be performed on more sites in the future. Second, the uncertainties in the attribution analysis also should be noted. On the one hand, the meteorological data were spatially interpolated from the actual data measured at the stations. On the other hand, when calculating the effect of each factor on the WUE trends, we assumed a linear response between the influencing factors and the WUE. The results of the multiple linear regression approach, the fitting coefficient (R2), and the statistical significance are shown in Figure 11. The spatial average of the R2 values was 0.6 on the CLP, and about 64.77% of the entire CLP region performed significantly (p < 0.05). About 72.37% of the entire CLP region performed significantly (p < 0.1). Actually, the meteorological factors were not completely independent, and their interactions were so complex that it may have confused their independent contributions to the WUE trends to some extent. Therefore, we need to consider combining nonlinear statistical models, remote sensing models, hydrological models, and other methods to conduct the attribution analysis and reduce the uncertainties caused by the attribution methods in the future.

Figure 11.
R2 values and significance levels (p < 0.05) of the multiple regression models.
5. Conclusions
The investigation of the spatio–temporal variation characteristics of WUE and its influencing factors was necessary for assessing the water consumption and sustainability of vegetation on the CLP. In this study, we analyzed the spatial characteristics and temporal evolution of the WUE and the contributions of the changes in the influencing factors for different vegetation types and different sub-basins in the CLP from 2000 to 2018, using the linear slope, the partial correlation coefficient method, and the total derivative method based on multisource remote sensing datasets. The main conclusions of this study are as follows:
- (1)
- The average annual WUE was 1.242 gC·m−2·mm−1, which decreased significantly with increasing drought index. The sensitivity of the WUE to drought index for the different vegetation types is ranked as follows: grassland > forest > cropland > shrubland. The annual growth rate of interannual WUE was 0.024 gC·m−2·mm−1 year−1, with 87.32% of the study area showing an increasing trend.
- (2)
- The area in which the LAI was the most strongly correlated with the WUE accounted for 62.18% of the total area, and it was generally distributed in the central part of the study area, followed by the Temp, VPD, SD, and P. Compared with the cropland, the correlations between the WUE and the meteorological factors were more sensitive to the drought index in the forests and grassland.
- (3)
- The WUE trend was predominantly controlled by the LAI with an impact and relative impact rate of 0.014 gC·m−2·mm−1·year−1 and 58.33%, respectively. The impacts of the LAI on the WUE trends for the different vegetation types and different sub-basins were ranked as follows: grassland > cropland > forest > shrubland, and Yan River > Wuding River > Kuye River > Huangpuchuan River > Jing River > Beiluo River > Fen River > Wei River, respectively. The impacts of the meteorological factors on the WUE trends were ranked as follows: Temp > VPD > SD > P. The integrated impact and relative impact rate of the meteorological factors on the WUE trends were 0.006 gC·m−2·mm−1·year−1 and 25.00%, respectively. In addition, the comprehensive effects of the residual factors that were induced mainly by human activities on the WUE trends cannot be ignored in the CLP.
Author Contributions
Conceptualization, X.C. and Z.W.; methodology, Z.W.; validation, P.X., Z.S. and X.L.; investigation, X.C.; data curation, X.C. and Y.S.; writing—original draft preparation, X.C.; writing—review and editing, Z.W., F.W. and P.X. All authors have read and agreed to the published version of the manuscript.
Funding
This work was financially supported by the Special Research Fund of the YRIHR (HKY-JBYW-2020-09), and National Natural Science Foundation of China (41701509, 51979118).
Data Availability Statement
The data is available on request from the corresponding author.
Acknowledgments
Acknowledgement for the data support from National Earth System Science Data Center, National Science & Technology Infrastructure of China. (http://www.geodata.cn, accessed on 31 August 2021). Meanwhile, we gratefully thank the anonymous reviewers for their useful comments and constructive suggestions on the manuscript.
Conflicts of Interest
The authors declare no conflict of interest.
References
- Hu, Z.; Yu, G.; Fu, Y.; Sun, X.; Li, Y.; Shi, P.; Wang, Y.; Zheng, Z. Effects of vegetation control on ecosystem water use efficiency within and among four grassland ecosystems in China. Glob. Chang. Biol. 2008, 14, 1609–1619. [Google Scholar] [CrossRef]
- Niu, S.; Xing, X.; Zhang, Z.; Xia, J.; Zhou, X.; Song, B.; Li, L.; Wan, S. Water-use efficiency in response to climate change: From leaf to ecosystem in a temperate steppe. Glob. Chang. Biol. 2011, 17, 1073–1082. [Google Scholar] [CrossRef]
- Keenan, T.F.; Hollinger, D.Y.; Bohrer, G.; Dragoni, D.; Munger, J.W.; Schmid, H.P.; Richardson, A.D. Increase in forest water-use efficiency as atmospheric carbon dioxide concentrations rise. Nature 2013, 499, 324–327. [Google Scholar] [CrossRef] [PubMed]
- Ito, A.; Inatomi, M. Water-Use Efficiency of the Terrestrial Biosphere: A Model Analysis Focusing on Interactions between the Global Carbon and Water Cycles. J. Hydrometeorol. 2012, 13, 681–694. [Google Scholar] [CrossRef]
- Sun, Y.; Piao, S.; Huang, M.; Ciais, P.; Zeng, Z.; Cheng, L.; Li, X.; Zhang, X.; Mao, J.; Peng, S.; et al. Global patterns and climate drivers of water-use efficiency in terrestrial ecosystems deduced from satellite-based datasets and carbon cycle models. Glob. Ecol. Biogeogr. 2016, 25, 311–323. [Google Scholar] [CrossRef] [Green Version]
- Sun, S.; Song, Z.; Wu, X.; Wang, T.; Wu, Y.; Du, W.; Che, T.; Huang, C.; Zhang, X.; Ping, B.; et al. Spatio-temporal variations in water use efficiency and its drivers in China over the last three decades. Ecol. Indic. 2018, 94, 292–304. [Google Scholar] [CrossRef]
- Jiang, G.M.; Dong, M. A comparative study on photosynthesis and water use efficiency between clonal and non-clonal plant species along the Northeast China Transect (NECT). Acta Bot. Sin. 2000, 42, 855–863. [Google Scholar]
- Su, Z.; Zhang, J.; Wu, W.; Cai, D.; Lv, J.; Jiang, G.; Huang, J.; Gao, J.; Hartmann, R.; Gabriels, D. Effects of conservation tillage practices on winter wheat water-use efficiency and crop yield on the Loess Plateau, China. Agric. Water Manag. 2006, 87, 307–314. [Google Scholar] [CrossRef]
- Huang, Y.; Chen, L.; Fu, B.; Huang, Z.; Gong, J. The wheat yields and water-use efficiency in the Loess Plateau: Straw mulch and irrigation effects. Agric. Water Manag. 2004, 72, 209–222. [Google Scholar] [CrossRef]
- Bhusal, N.; Lee, M.; Han, A.R.; Han, A.; Kim, H.S. Responses to drought stress in Prunus sargentii and Larix kaempferi seedlings using morphological and physiological parameters. For. Ecol. Manag. 2020, 465, 118099. [Google Scholar] [CrossRef]
- Xiao, J.; Sun, G.; Chen, J.; Chen, H.; Chen, S.; Dong, G.; Gao, S.; Guo, H.; Guo, J.; Han, S.; et al. Carbon fluxes, evapotranspiration, and water use efficiency of terrestrial ecosystems in China. Agric. For. Meteorol. 2013, 182–183, 76–90. [Google Scholar] [CrossRef]
- Liu, Y.; Xiao, J.; Ju, W.; Zhou, Y.; Wang, S.; Wu, X. Water use efficiency of China’s terrestrial ecosystems and responses to drought. Sci. Rep. 2015, 5, 13799. [Google Scholar] [CrossRef]
- Zhu, X.-J.; Yu, G.-R.; Wang, Q.-F.; Hu, Z.-M.; Zheng, H.; Li, S.-G.; Sun, X.-M.; Zhang, Y.-P.; Yan, J.-H.; Wang, H.-M.; et al. Spatial variability of water use efficiency in China’s terrestrial ecosystems. Glob. Planet. Chang. 2015, 129, 37–44. [Google Scholar] [CrossRef]
- Wanyuan, C.; Sana, U.; Lei, Y.; Yi, L. Remote Sensing of Ecosystem Water Use Efficiency: A Review of Direct and Indirect Estimation Methods. Remote. Sens. 2021, 13, 2393. [Google Scholar]
- Sharma, A.; Goyal, M.K. Assessment of ecosystem resilience to hydroclimatic disturbances in India. Glob. Chang. Biol. 2018, 24, e432–e441. [Google Scholar] [CrossRef] [PubMed]
- Sharma, A.; Goyal, M.K. District-level assessment of the ecohydrological resilience to hydroclimatic disturbances and its controlling factors in India. J. Hydrol. 2018, 564, 1048–1057. [Google Scholar] [CrossRef]
- Tang, X.; Li, H.; Desai, A.R.; Nagy, Z.; Luo, J.; Kolb, T.E.; Olioso, A.; Xu, X.; Yao, L.; Kutsch, W. How is water-use efficiency of terrestrial ecosystems distributed and changing on Earth? Sci. Rep. 2014, 4, 7483. [Google Scholar] [CrossRef] [PubMed]
- Limai, G.; Nan, S.; Yongguang, Z.; Fubao, S.; Wenbin, L.; Zhongjie, S.; Qian, Z. Separating the effects of climate change and human activity on water use efficiency over the Beijing-Tianjin Sand Source Region of China. Sci. Total Environ. 2019, 690, 584–595. [Google Scholar]
- Feng, X.; Fu, B.; Piao, S.; Wang, S.; Ciais, P.; Zeng, Z.; Lü, Y.; Zeng, Y.; Li, Y.; Jiang, X.; et al. Revegetation in China’s Loess Plateau is approaching sustainable water resource limits. Nat. Clim. Chang. 2016, 6, 1019–1022. [Google Scholar] [CrossRef]
- Bojie, F.; Shuai, W.; Yu, L.; Jianbo, L.; Wei, L.; Chiyuan, M. Hydrogeomorphic Ecosystem Responses to Natural and Anthropogenic Changes in the Loess Plateau of China. Annu. Rev. Earth Planet. Sci. 2017, 45, 223–243. [Google Scholar]
- Yuan; Li; Liang; Cui; Dong; Liu; Xia; Chen; Liu; Zhu. Characterization of locations and extents of afforestation from the Grain for Green Project in China. Remote. Sens. Lett. 2014, 5, 221–229. [Google Scholar] [CrossRef]
- Wang, Y.; Shao, M.a.; Zhu, Y.; Liu, Z. Impacts of land use and plant characteristics on dried soil layers in different climatic regions on the Loess Plateau of China. Agric. For. Meteorol. 2010, 151, 437–448. [Google Scholar] [CrossRef]
- Cao, S.; Li, C.; Shankman, D.; Wang, C.; Wang, X.; Hong, Z. Excessive reliance on afforestation in China’s arid and semi-arid regions: Lessons in ecological restoration. Earth Sci. Rev. 2011, 104, 240–245. [Google Scholar] [CrossRef]
- Liang, W.; Bai, D.; Wang, F.; Fu, B.; Yan, J.; Wang, S.; Yang, Y.; Long, D.; Feng, M. Quantifying the impacts of climate change and ecological restoration on streamflow changes based on a Budyko hydrological model in China’s Loess Plateau. Water Resour. Res. 2015, 51, 6500–6519. [Google Scholar] [CrossRef]
- Zhang, S.; Yang, D. Excessive afforestation and soil drying on China’s Loess Plateau. J. Geophys. Res. Biogeosci. 2018, 123, 7. [Google Scholar] [CrossRef]
- Jia, X.; Shao, M.a.; Zhu, Y.; Luo, Y. Soil moisture decline due to afforestation across the Loess Plateau, China. J. Hydrol. 2017, 546, 113–122. [Google Scholar] [CrossRef]
- Zhang, B.; Wu, P.; Zhao, X.; Gao, X. Spatiotemporal analysis of climate variability (1971–2010) in spring and summer on the Loess Plateau, China. Hydrol. Process. 2013, 28, 1689–1702. [Google Scholar] [CrossRef]
- Wang, L.F.; Shangguan, Z.P. Water-use efficiency of dryland wheat in response to mulching and tillage practices on the Loess Plateau. Sci. Rep. 2015, 5, 12225. [Google Scholar] [CrossRef] [PubMed]
- Jin, N.; Ren, W.; Tao, B.; He, L.; Ren, Q.; Li, S.; Yu, Q. Effects of water stress on water use efficiency of irrigated and rainfed wheat in the Loess Plateau, China. Sci. Total. Environ. 2018, 642, 1–11. [Google Scholar] [CrossRef]
- Zheng, H.; Lin, H.; Zhu, X.-J.; Jin, Z.; Bao, H. Divergent spatial responses of plant and ecosystem water-use efficiency to climate and vegetation gradients in the Chinese Loess Plateau. Glob. Planet. Chang. 2019, 181, 102995. [Google Scholar] [CrossRef]
- Zheng, H.; Lin, H.; Zhou, W.; Bao, H.; Zhu, X.; Jin, Z.; Song, Y.; Wang, Y.; Liu, W.; Tang, Y. Revegetation has increased ecosystem water-use efficiency during 2000-2014 in the Chinese Loess Plateau: Evidence from satellite data. Ecol. Indic. 2019, 102, 507–518. [Google Scholar] [CrossRef]
- Tian, Z.; Jian, P.; Wei, L.; Yang, Y.; Liu, Y. spatial-temporal patterns of water use efficiency and climate controls in China’s Loess Plateau during 2000–2010. Sci. Total Environ. 2016, 565, 105–122. [Google Scholar]
- Cao, Z.; Li, Y.; Liu, Y.; Chen, Y.; Wang, Y. When and where did the Loess Plateau turn “green”? Analysis of the tendency and breakpoints of the normalized difference vegetation index. Land Degrad. Dev. 2017, 29, 162–175. [Google Scholar] [CrossRef]
- Li, J.; Peng, S.; Li, Z. Detecting and attributing vegetation changes on China’s Loess Plateau. Agric. For. Meteorol. 2017, 247, 260–270. [Google Scholar] [CrossRef]
- Zhang, X.; Liu, L.; Chen, X.; Gao, Y.; Xie, S.; Mi, J. GLC_FCS30: Global land-cover product with fine classification system at 30 m using time-series Landsat imagery. Earth Syst. Sci. Data Discuss. 2020, 2020, 1–31. [Google Scholar]
- FAO. Crop evapotranspiration Guidelines for computing crop water requirements. In FAO IRRIGATION AND DRAINAGE PAPER; FAO: Rome, Italy, 1998; Volume 56. [Google Scholar]
- Yuan, W.; Zheng, Y.; Piao, S.; Ciais, P.; Lombardozzi, D.; Wang, Y.; Ryu, Y.; Chen, G.; Dong, W.; Hu, Z.; et al. Increased atmospheric vapor pressure deficit reduces global vegetation growth. Sci. Adv. 2019, 5, eaax1396. [Google Scholar] [CrossRef] [Green Version]
- Yu, X.X. Hydrology and Water Resources, 2rd ed.; China Forestry Publishing House: Beijing, China, 2010. (In Chinese) [Google Scholar]
- Zhang, Y.; Kong, D.; Gan, R.; Chiew, F.; McVicar, T.; Zhang, Q.; Yang, Y. Coupled estimation of 500 m and 8-day resolution global evapotranspiration and gross primary production in 2002-2017. Remote. Sens. Environ. 2019, 222, 165–182. [Google Scholar] [CrossRef]
- Liang, S.; Zhao, X.; Liu, S.; Yuan, W.; Cheng, X.; Xiao, Z.; Zhang, X.; Liu, Q.; Cheng, J.; Tang, H.; et al. A long-term Global LAnd Surface Satellite (GLASS) data-set for environmental studies. Int. J. Digit. Earth 2013, 6, 5–33. [Google Scholar] [CrossRef]
- Watkins, M.M.; Wiese, D.N.; Yuan, D.N.; Boening, C.; Landerer, F.W. Improved methods for observing Earth\”s time variable mass distribution with GRACE using spherical cap mascons. J. Geophys. Res. Solid Earth 2015, 120, 2648–2671. [Google Scholar] [CrossRef]
- Save, H.; Bettadpur, S.; Tapley, B.D. High-resolution CSR GRACE RL05 mascons. J. Geophys. Res. Solid Earth 2016, 121, 7547–7569. [Google Scholar] [CrossRef]
- Zhang, Y.; Peña-Arancibia, J.L.; McVicar, T.R.; Chiew, F.H.S.; Vaze, J.; Liu, C.; Lu, X.; Zheng, H.; Wang, Y.; Liu, Y.Y.; et al. Multi-decadal trends in global terrestrial evapotranspiration and its components. Sci. Rep. 2016, 6, 19124. [Google Scholar] [CrossRef] [Green Version]
- Li, C.; Zhang, Y.; Shen, Y.; Yu, Q. Decadal water storage decrease driven by vegetation changes in the Yellow River Basin. Sci. Bull. 2020, 65, 1859–1861. [Google Scholar] [CrossRef]
- Li, G.; Zhang, F.; Jing, Y.; Liu, Y.; Sun, G. Response of evapotranspiration to changes in land use and land cover and climate in China during 2001–2013. Sci. Total. Environ. 2017, 596–597, 256–265. [Google Scholar] [CrossRef] [PubMed]
- Bai, M.; Mo, X.; Liu, S.; Hu, S. Contributions of climate change and vegetation greening to evapotranspiration trend in a typical hilly-gully basin on the Loess Plateau, China. Sci. Total Environ. 2019, 657, 325–339. [Google Scholar] [CrossRef]
- Water, P.; Leavitt, S.W.; Betancourt, J.L. Leaf δ13C variability with elevation, slope aspect, and precipitation in the southwest United States. Oecologia 2002, 132, 332–343. [Google Scholar] [CrossRef] [PubMed]
- Liu, Y.; Zhou, Y.; Ju, W.; Wang, S.; Wu, X.; He, M.; Zhu, G. Impacts of droughts on carbon sequestration by China’s terrestrial ecosystems from 2000 to 2011. Biogeosciences 2014, 11, 2583–2599. [Google Scholar] [CrossRef] [Green Version]
- Ogaya, R.; Peuelas, J. Comparative field study of Quercus ilex and Phillyrea latifolia: Photosynthetic response to experimental drought conditions. Environ. Exp. Bot. 2003, 50, 137–148. [Google Scholar] [CrossRef]
- Feng, X.; Fu, B.; Lu, N.; Zeng, Y.; Wu, B. How ecological restoration alters ecosystem services: An analysis of carbon sequestration in China’s Loess Plateau. Sci. Rep. 2013, 3, 2846. [Google Scholar] [CrossRef] [PubMed]
- Chou, K.B. Estimating Regional Vegetation Gross Primary Productivity (GPP), Evapotranspiration (ET), Water Use Efficiency (WUE) and Their Spatial and Temporal Distribution across China. Ph.D. Thesis, Beijing Forestry University, Beijing, China, 2015. (In Chinese). [Google Scholar]
- Zhang, Z.; Jiang, H.; Liu, J.X.; Zhou, G.M.; Liu, S.R.; Zhang, X.Y. Assessment on water use efficiency under climate change and heterogeneous carbon dioxide in China terrestrial ecosystems. Procedia Environ. Sci. 2012, 13, 2031–2044. [Google Scholar] [CrossRef] [Green Version]
- Zhang, L.; Tian, J.; He, H.; Ren, X.; Sun, X.; Yu, G.; Lu, Q.; Lv, L. Evaluation of Water Use Efficiency Derived from MODIS Products against Eddy Variance Measurements in China. Remote. Sens. 2015, 7, 11183–11201. [Google Scholar] [CrossRef] [Green Version]
- Xia, L.; Wang, F.; Mu, X.; Jin, K.; Sun, W.; Gao, P.; Zhao, G. Water use efficiency of net primary production in global terrestrial ecosystems. J. Earth Syst. Sci. 2015, 124, 921–931. [Google Scholar] [CrossRef]
- Tian, H.; Lu, C.; Chen, G.; Xu, X.; Liu, M.; Ren, W.; Tao, B.; Sun, G.; Pan, S.; Liu, J. Climate and land use controls over terrestrial water use efficiency in monsoon Asia. Ecohydrology 2011, 4, 322–340. [Google Scholar] [CrossRef]
- Liu, Z.; Wang, J.; Wang, X.; Wang, Y. Understanding the impacts of ‘Grain for Green’ land management practice on land greening dynamics over the Loess Plateau of China. Land Use Policy 2020, 99, 105084. [Google Scholar] [CrossRef]
- Muhammad, K.; Ahmed, E.N.; Lars, R.; Karl, S. Spatio-temporal variations in climate, primary productivity and efficiency of water and carbon use of the land cover types in Sudan and Ethiopia. Sci. Total Environ. 2018, 624, 790–806. [Google Scholar] [CrossRef]
- Yang, Y.; Guan, H.; Batelaan, O.; McVicar, T.R.; Long, D.; Piao, S.; Liang, W.; Liu, B.; Jin, Z.; Simmons, C.T. Contrasting responses of water use efficiency to drought across global terrestrial ecosystems. Sci. Rep. 2016, 6, 23284. [Google Scholar] [CrossRef] [PubMed] [Green Version]
- Bhusal, N.; Lee, M.; Lee, H.; Adhikari, A.; Han, A.R.; Han, A.; Kim, H.S. Evaluation of morphological, physiological, and biochemical traits for assessing drought resistance in eleven tree species. Sci. Total Environ. 2021, 779, 146466. [Google Scholar] [CrossRef] [PubMed]
- Zhou, M.; Zhou, S.; Wang, J.; Zhang, Z.; Yang, J. Research Advance on Influencing Factors of Crop Water Use Efficiency. Ecol. Biogeogr. 2016, 25, 311–323. [Google Scholar]
- Xue, B.-L.; Guo, Q.; Otto, A.; Xiao, J.; Tao, S.; Li, L. Global patterns, trends, and drivers of water use efficiency from 2000 to 2013. Ecosphere 2015, 6, art174. [Google Scholar] [CrossRef]
- Bihang, F.; Li, G.; Ning, L.; Jin, C.; Henry, L.; Xiaoyang, Z.; Miaogen, S.; Yuhan, R.; Cong, W.; Lei, M. Earlier vegetation green-up has reduced spring dust storms. Sci. Rep. 2014, 4, 6749. [Google Scholar]
- Lessin, R.C.; Ghini, R. Efeito do aumento da concentrao de CO2 atmosférico sobre o oídio e o crescimento de plantas de soja. Trop. Plant Pathol. 2009, 34, 385–392. [Google Scholar] [CrossRef]
- Pei, F.; Li, X.; Liu, X.; Wang, S.; He, Z. Assessing the differences in net primary productivity between pre- and post-urban land development in China. Agric. For. Meteorol. 2013, 171–172, 174–186. [Google Scholar] [CrossRef]


Publisher’s Note: MDPI stays neutral with regard to jurisdictional claims in published maps and institutional affiliations. |
© 2021 by the authors. Licensee MDPI, Basel, Switzerland. This article is an open access article distributed under the terms and conditions of the Creative Commons Attribution (CC BY) license (https://creativecommons.org/licenses/by/4.0/).