Abstract
To promote the conservation and utilization of Catalpa fargesii f. duclouxii (Huangxinzimu) germplasm resources, a total of 252 accessions were used to construct a preliminary core collection according to phenotypic traits and single nucleotide polymorphism (SNP) markers. In this study, 24 phenotypic traits, namely, 9 quantitative traits and 15 qualitative traits, were investigated. The core collection of C. fargesii f. duclouxii (Huangxinzimu) was constructed to remove redundant samples from the collected materials. First, the phenotypic core collection, with a sample proportion of 30, consisting of 24 clones, was constructed according to two genetic distances (Euclidean distance and Mahalanobis), four system clustering methods (the unweighted pair-group average method, Ward’s method, the complete linkage method, and the single linkage method), and three sampling methods (random sampling, deviation sampling, and preferred sampling). The best construction strategies were selected for further comparison. Three core collections (D2C3S3-30, D2C3S3-50, and D2C3S3-70) were constructed according to the optimal construction strategy at three sampling proportions. The core collection D2C3S3-30 with the best parameters was evaluated by using six parameters: the mean difference percentage (MD), variance difference percentage (VD), periodic rate of range (CR), changeable rate of the coefficient of variation (VR), minimum rate of change (CRMIN), and maximum rate of change (CRMAX). Three core collections (M-30, M-50, and M-70) were constructed by molecular markers, and the optimal core collection M-30 was selected by using five parameters, namely, Ho, He, PIC, MAF, and loci. The combination of D2C3S3-30 and M-30 was used to construct the final core collection DM-45, 45 samples representing the complete range of phenotypic and genetic variability. In this study, phenotypic traits combined with molecular markers were used to construct core collections to effectively capture the entire range of trait variation, effectively representing the original germplasm and providing a basis for the conservation and utilization of C. fargesii f. duclouxii (Huangxinzimu).
1. Introduction
Core collections have been widely used in the conservation and utilization of germplasm resources, which represents the genetic diversity of original germplasm resources with minimum redundancy [1]. The differences in phenotypic traits directly reflect the genetic diversity of germplasm resources [2]. In addition, phenotypic traits are widely used in constructing core collections, such as those of Cynodon dactylon [3], Erythrophleum fordii [2], Populus deltoides [4], Eucalyptus urophylla [5], Prunus armeniac L. [6] and other species because of their relatively easy measurement [7]. Using phenotypic traits to construct core collections is a relatively mature method that can greatly reduce the workload. However, phenotypic traits are easily affected by environmental factors and cannot accurately reflect the differences at the gene level [8]. Molecular markers are a rapid and efficient research tool that have the advantages of high polymorphism [9], not being easily affected by the environment, and ease of comparison and analysis [10]. In recent years, molecular markers have been widely used in the construction of core collections, such as those of Castanea mollissima Blume [11], Prunus persica (L.) [12], soybean [13], P. armeniac L. [14], Flemingia macrophylla [15], and P. deltoides [16]. However, molecular markers are not genes and can only reflect the partial polymorphism of DNA fragments in a limited number of cases. The use of molecular markers alone in the construction of core collections may result in the loss of the genetic diversity that controls the mutant traits [17]. The use of genotypic or phenotypic information alone for the establishment of core collections may not efficiently capture the entire genetic diversity of species [18]. Therefore, molecular markers are increasingly being used in combination with phenotypic traits for core collection construction [19]. The combination of phenotypic traits and molecular markers can effectively avoid the loss of important germplasms and increase the accuracy and reliability of core collections [20].
Catalpa fargesii f. duclouxii is an important deciduous species that belongs to the family Bignoniaceae [21]. It is a common and valuable native timber species that is mainly distributed in Southwest China [22]. It grows rapidly and is suitable for warm and humid climates. The C. fargesii f. duclouxii (Huangxinzimu) material used in this study is a special type of C. fargesii f. duclouxii, which is distributed only in parts of Qiannan and Qiandongnan Prefectures in Guizhou Province. These plantings are often mixed with C. fargesii f. duclouxii. Because its growth rate is slightly slower than that of C. fargesii f. duclouxii, its wood is yellow and of excellent quality. Therefore, it is becoming increasingly popular and often used locally to make high-end furniture and decorative materials, and as a greening tree species in gardens [23]. However, in recent years, the genetic resources of C. fargesii f. duclouxii (Huangxinzimu) have decreased sharply due to overutilization. Since 2008, C. fargesii f. duclouxii (Huangxinzimu) resources have plummeted, and the regional stock is less than one-fifth of its original level. In this study, phenotypic traits and molecular markers were used to construct a core collection of C. fargesii f. duclouxii (Huangxinzimu), providing a theoretical basis for more effective preservation and utilization of these germplasm resources and effectively preventing their loss.
2. Materials and Methods
2.1. Experimental Materials
The experimental site was located in Xiangpu Village, Wolong District, Nanyang City, Henan Province. This area marks the transition from a subtropical zone to a warm temperate zone and is subject to a subhumid continental monsoon climate. The soil is of the yellow brown soil type, with medium natural fertility, which is suitable for growing C. fargesii f. duclouxii (Huangxinzimu). The annual average temperature is 14.4~15.8 °C, and the maximum and minimum temperatures are 42.6 °C and −13.2 °C, respectively. The annual average sunshine duration is 2121 h, the annual average frost-free period is 225~240 days, and the annual precipitation is approximately 800 mm.
A total of 252 clones were collected in Qiannan and Qiandongnan Prefectures, Guizhou Province, and planted in Wancheng District, Nanyang City on March 20, 2019.
One-year-old grafted seedlings, with a height of 2.0~3.0 m and a basal diameter of 1.5~3.0 cm, were planted using a randomized complete block design with 4 blocks and 2 trees per block, with a 3.0 × 3.0 m spacing. The seedlings were stubbed 5 days after planting to increase the survival rate.
2.2. Measurement of Phenotypic Traits
A total of 24 phenotypic traits, namely, 9 quantitative traits and 15 qualitative traits, were investigated. Leaf traits were investigated in August 2019, and growth traits were measured in October 2019. The quantitative traits included tree height, diameter at breast height, leaf length, leaf width, ratio of leaf length to width, leaf mass, leaf area, number of lenticels, and leaf mass per unit area. The quality traits included leaf shape, leaf base, leaf tip, lenticel shape, whether the lenticule is raised, whether the upper surface of the terminal young leaf is hairy, whether the lower surface of the terminal young leaf is hairy, whether the upper surface of the mature leaf is hairy, whether the lower surface of the mature leaf is hairy, whether the petiole of the terminal young leaf is hairy, whether the petiole of the mature leaf is hairy, whether the current branch is hairy, whether there are glandular spots on the lower surface of the mature leaf, the color of the upper surface of the terminal young leaf, and the terminal young leaf color of the underside of the leaf. Quantitative traits were divided into 10 levels according to the mean () and standard deviation (δ), < 2δ and < + 2δ increased from level 1 to level 10, with a 0.5δ difference between each level [24]. Moreover, the classification and assignment of quality traits were performed according to the criteria [25] (Table S1).
2.3. Construction of the Core Collection Based on Phenotypic Traits
Cluster analysis was performed using the stepwise clustering method [26], according to two genetic distances, the Euclidean distance and Mahalanobis distance, and combining four types of hierarchical clustering methods, namely, the unweighted pair-group average method, Ward’ s method, the complete linkage method, and the single linkage method. Additionally, three sampling methods (random sampling, deviation sampling, and preferred sampling) were used in this study [27].
Using different systematic clustering and sampling methods, 3 core collections were selected according to different sampling ratios (30, 50, and 70). The best sampling size was selected according to the respective genetic diversity retention.
2.4. Construction of the Core Collection Based on Molecular Traits
A few young leaves were taken during the growth period, and their genomic DNA was extracted by the CTAB method [28]. After the DNA was extracted and tested, it was sent to Genedenovo Biotechnology Co., Ltd. (Guangzhou, China) for SNP typing. First, according to the number of marker loci, the p-distance was calculated by using VCF2Dis software to obtain the genetic distances between each sample. According to the obtained genetic distance matrix, we used the sampleCore() function of Core-Hunter3 to screen the core collection, and the size was set to 30, 50, and 70 to obtain the corresponding screening results.
2.5. Evaluation of the Core Collections
In this study, four core collection evaluation parameters were selected [29,30] to evaluate the representativeness of core collections, namely, the mean difference percentage (MD), variance difference percentage (VD), periodic rate of range (CR), and changeable rate of the coefficient of variation (VR). The formulas for each parameter were as follows:
where St is the number of traits with a significant mean difference (α = 0.05) between the core collection and original population by t-test, and n is the total number of traits.
where SF is the number of traits with a significant mean difference (α = 0.05) between the core collection and original population by t-test, and n is the total number of traits.
where RC(i) is the extreme difference of the ith trait in the core collection, RI(i) is the extreme difference of the ith trait in the original population, and n is the total number of traits.
where CVC(i) is the coefficient of variation of the ith trait in the core collection, CVI(i) is the coefficient of variation of the ith trait in the original population, and n is the total number of traits.
If the MD was less than 20%, and the CR was greater than 80%, the core collection could be considered to represent the genetic diversity of the original germplasm resources. Moreover, the smaller MD is, the greater VD, CR, and VR are, and the better the core collection could represent the genetic diversity of the original population [31].
Using molecular markers, according to the ratio of 30, 50, and 70 copies, three core collections were selected, denoted as M-30, M-50, and M-70, respectively. Several parameters, such as minor allele frequency (MAF), polymorphism information content (PIC), expected heterozygosity (He), observed heterozygosity (Ho), and loci (loci), were analyzed.
where Xi is the number of minor alleles detected at a point, and is the total number of genotypes detected at a point.
where n is the number of alleles, and Pi and Pj are the frequencies of the ith and jth alleles, respectively.
where Pi is the frequency of the ith allele.
where b is the number of heterozygous genotypes detected at a point, and n is the total number of genotypes detected at a point.
The greater these parameters are, the greater the level of genetic diversity of the core collection [5].
2.6. Data Analysis
Data standardization and statistical analyses were carried out using R software and SPSS 25.0. When the core collection was constructed according to molecular markers, VCF2dis was used to calculate the genetic distance, and Core Hunter3 was used to screen the core collection.
3. Results
3.1. The Construction Method of the Core Collection Based on Phenotypic Traits
3.1.1. Comparison of the Genetic Distances, Clustering Methods, and Sampling Methods
D1 and D2 represent the Euclidean distance and Mahalanobis distance, respectively, and C1, C2, C3, and C4 represent the unweighted pair-group average method, Ward’ s method, complete linkage method, and single linkage method used in the hierarchical clustering, respectively. S1, S2, and S3 were used to represent the random sampling method, deviation sampling method, and preferred sampling method, respectively. Different combinations of these methods were used to sample 24 core collections at a sampling size of 30 (Figure 1).
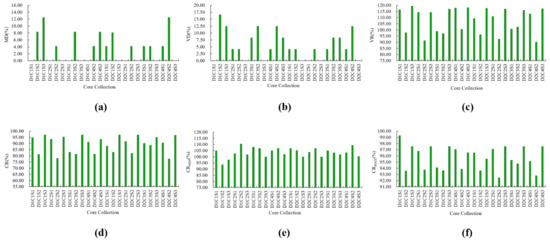
Figure 1.
Percentage of trait differences between the core collections and the initial collection. (a–f) represent the percentages of the mean difference percentage (MD), variance difference percentage (VD), periodic rate of range (CR), and changeable rate of the coefficient of variation (VR) of different core collection, respectively.
At the sampling size of 30, among the 24 core collections constructed by the combination of 2 genetic distances, 4 clustering methods, and 3 sampling methods, the MD of 22 core collections was less than 20% of the original population, and the CR was more than 80% of the original population, indicating that these 22 core collections could represent the genetic diversity of the original population.
Comparing the two genetic distances, it was found that seven core collections were constructed using Euclidean distance according to CR > 85%, while nine were constructed using the Mahalanobis distance. Eight core collections were constructed using Euclidean distance according to VR > 100%, while nine were constructed using the Mahalanobis distance. Seven of the core collections were constructed using the Euclidean distance according to CRMAX > 95%, and eight of them were constructed using the Mahalanobis distance. The above analysis shows that the Mahalanobis distance was better than the Euclidean distance for the construction of the core collection of C. fargesii f. duclouxii (Huangxinzimu).
For the Mahalanobis distance (D2), at a sampling ratio of 30%, the comparison results of 12 core collections constructed by 4 clustering methods combined with 3 sampling methods show that there was no difference in MD between the 5 core collections and the original population. Moreover, according to VD, VR, CRMAX, and CRMIN, the core collection constructed by the complete linkage method combined with the preferred sampling method could provide a good clustering effect.
3.1.2. Determination of Sampling Proportion
Using Mahalanobis distance, clustering using the complete linkage method, combined with the preferred sampling method, according to the 30, 50, and 70 sizes, three core collections were selected, denoted as D2C3S3-30, D2C3S3-50, and D2C3S3-70 (Table 1).

Table 1.
Percentage of the trait differences between the three core collections and the initial collection.
The MD of each core collection was less than 20%, and the CR was more than 80%, indicating that the three core collections preserved the genetic variation of the original population well. At the same time, it was found that the core collection (D2C3S3-30) had the highest VR (116.06%) and the lowest MD (0%), while those of the other collections were only lower than the other two core collections. Therefore, the core collection (D2C3S3-30) maintained the genetic diversity of the original population; that is, 30 samples was the appropriate sampling proportion for the construction of the core collection of C. fargesii f. duclouxii (Huangxinzimu). D2C3S3-30 could be used as the core collection, which included clones 17, 25, 235, 245, 226, 231, 191, 198, 135, 146, 159, 167, 172, 177, 204, 118, 125, 43, 46, 61, 62, 95, 98, 108, 76, 93, 9, 132, 219, and 247.
3.2. The Construction Method of the Core Collection Based on Molecular Traits
Compared with the original collection, the values of each parameter were increased, indicating that the three core collections were very representative of the original collection and had high genetic diversity. As the number of samples increased, the Ho, He, PIC, and MAF decreased (Table 2). M-30 could be used as the core collection, which included the clones 17, 25, 38, 43, 61, 80, 92, 93, 95, 97, 102, 103, 119, 121, 125, 128, 131, 132, 135, 175, 191, 194, 198, 204, 211, 219, 226, 227, 235, and 245.
Table 2.
Parameters between original collection and three core collections.
3.3. Construction of Core Collections Based on Phenotypic and Molecular Traits
The repetition rate of the core collection constructed based on phenotypic traits (D2C3S3-30) and the core collection constructed based on molecular traits (M-30) was 50% (Table 3). Combining M-30 and D2C3S3-30 as the final core collection (FM-45), 44 materials were selected, namely, 9, 17, 25, 38, 43, 46, 61, 62, 76, 80, 92, 93, 95, 97, 98, 102, 103, 108, 119, 121, 125, 128, 131, 132, 135, 146, 159, 167, 172, 175, 177, 191, 194, 198, 204, 211, 219, 226, 227, 231, 235, 245, and 247.
Table 3.
Final core collection and original collection percentage difference between traits.
The MD of F45 was less than 20%, and the CR was greater than 80%. The core collection could be considered to represent the genetic diversity of the original germplasm resources. The CR and CRMAX of F45 were greater than those of D2C3S3-30. Therefore, FM-45 was also very representative.
4. Discussion
4.1. The Mahalanobis Distance and the Complete Linkage Method Combined with the Preferred Sampling Method Were the Most Suitable Strategies for Constructing Core Collections of C. fargesii f. duclouxii (Huangxinzimu)
The Euclidean distance and Mahalanobis distance are currently the most commonly used methods for calculating genetic distance in core collection construction [31,32,33]. The Euclidean distance does not consider the correlation between traits in the calculation process and is easily affected by the inconsistency of the dimension units of each trait, while the Mahalanobis distance is not affected by the dimensions [19,34]. Since biological traits are generally correlated to different degrees, Wei Z [35] used the Mahalanobis distance to calculate the genetic distance between families to construct a Betula platyphylla core collection. Ma Y [33] reported that the variation difference percentage and variation coefficient change rate of the core collection of wild chestnut constructed by Mahalanobis distance were higher than those of collections constructed by Euclidian distance. Research on annual crops by Xu H [36] showed that core collections constructed with Mahalanobis distance had greater variance and coefficients of variation than those constructed by Euclidean distance, with the former preserving more genetic variation of traits, and, thus, the core collections of crops could be constructed. The quality of the Mahalanobis distance was better than that of the Euclidean distance. In this study, it was also found that the Mahalanobis distance was more suitable for the construction of the core collection of C. fargesii f. duclouxii (Huangxinzimu) than the Euclidean distance.
There are many systematic clustering methods, and the clustering results produced are also different. The unweighted pair-group average method is the most widely used method and is more objective. The single linkage and the complete linkage methods are simpler, and Ward’s method is the most traditional. The preferred sampling method preserves the maximum and minimum trait values as well as the genetic variation structure of the original germplasm. Deviation sampling retains the maximum genetic variation of the original germplasm, while random sampling maintains the inheritance of the diversified forms of the original germplasm. Each technique has its own advantages [29]. Xu H [36] used cotton germplasm resources as an example to construct core collections. The results showed that both the preferred sampling method and deviation sampling method could significantly improve the variance of the core collections, and the former was slightly better than the latter. The core collection constructed by the single linkage method could significantly increase the variance of traits and maximize the coefficient of variation of the core collection. It was a better systematic clustering method to construct core collections. The analysis of the core collection of Betula platyphylla reported by Wei Z [35] showed that the core collection constructed by multiple clustering preferred sampling methods was the most representative when combined with the Mahalanobis distance and unweighted clustering. Guo Y [37] found that the Mahalanobis distance combined with the longest distance method for clustering was the best strategy when constructing the core collection of Bermuda grass. In this study, the Mahalanobis distance and the complete linkage method combined with the preferred sampling method were the most suitable strategies for constructing core collections of C. fargesii f. duclouxii (Huangxinzimu).
Determining a reasonable sampling ratio is an important part of constructing the core collection of crop germplasm resources. At present, there is no fixed sampling ratio for the construction of core collections. The sampling ratio is often adjusted according to the size of the original population. In the construction of core collections of different plants, the proportion of core collections was 5% to 30% of all collections of the species and is generally approximately 10% [38]. Van Raamsdonk [39] compared tulip core collections with sampling ratios of 10%, 15%, and 20%, and concluded that 20% was the best sampling ratio. Li X [9] established the core collection of Catalpa fargesii Bureau with the proportional method, accounting for 23.6% of the original collection. In this study, the use of 30 materials achieved the best core collections, accounting for 17.75% of the original collections.
4.2. Core Collections of C. fargesii f. duclouxii (Huangxinzimu) Constructed Using Molecular Traits Have High Allele Richness
In recent years, considerable advances in molecular markers have enabled their utilization for the development of core collections [19,40,41]. In this study, minimum allelic frequency (MAF), polymorphism information content (PIC), expected heterozygosity (He), observed heterozygosity (Ho), and loci (loci) were used to evaluate the core collections. The larger the PIC value, the higher the polymorphism information, indicating that the core collection contains extremely rich genetic diversity and has a high representativeness [42]. The use of a diversity index, especially the expected heterozygosity (He), seems to be more effective in maximizing allele richness [43,44]. Based on the genome-wide GBS-SNP typing results of 57 Olea europaea L. germplasm resources, Zhu S [45] carried out core SNP locus screening. The results showed that the higher the MAF and PIC values were, the greater the representativeness and good reproductivity of these SNP loci, which indicated that the core collection had good representativeness. Razieh Mahmoodi [18] constructed Iranian walnut germplasms using molecular markers and phenotypic traits and found that the average PIC value was higher than that of the original germplasm, indicating great variation among these walnut genotypes. Based on EST-SSRS, Fang J [46] constructed a core collection of Hevea brasiliensis Weakhan germplasm, and the study showed that the polymorphism information content, heterozygosity, and genetic diversity index of the core collection were all higher than those of the original population. In this study, the PIC, MAF, and He values of the M-30 core collection were all higher than those of the original germplasm and the other core collections constructed with molecular traits (Table 2).
4.3. There Is Overlap in the Core Collections of C. fargesii f. duclouxii (Huangxinzimu) Constructed Using Phenotypic and Molecular Traits
In previous research on core collection construction, core collections were mainly constructed by phenotype values [47,48]. The phenotypic traits of germplasm materials are mostly quantitative traits, which are easily affected by environmental factors and experimental errors. In addition, genotype by environment interactive effects exist [29] in the observed phenotype values. Therefore, both genetic classification and genetic diversity assessment based on phenotype value might be inaccurate [49]. Kumar [40] suggested that to capture the maximum range of allelic diversity in a core set and to prevent trade-offs between two data types, it is better to combine phenotypic and molecular variability. Previously, the combination of phenotypic values with molecular marker data was typically used to construct a core collection, while most previous studies employed a two-phase mode. Namely, a primary core collection is initially constructed through phenotypic traits, which are then verified and further screened via molecular markers to obtain the core collection. Mahmoodi [18] constructed three core collections based on different types of data, merged the three core collections, and named the composite core collection. These studies were the first attempt in walnut, in which molecular diversity was used in conjunction with phenotypic traits to develop a core collection. Therefore, we also combined genetic traits with phenotypic traits to construct a core collection of C. fargesii f. duclouxii (Huangxinzimu). In our study, the two core collections (D2C3S3-30 and M-30) efficiently captured the entire range of trait variability. Many accessions were common between different core collections. For instance, 15 accessions were common between D2C3S3-30 and M-30. Only 15 accessions were unique to D2C3S3-30 and 15 to M-30. The presence of common clones between core sets constructed using different types of data suggests overlap in genetic and phenotypic components. The core collection (FM-45) was highly diverse at both the molecular and phenotypic levels.
5. Conclusions
The core collection D2C3S3-30 was constructed by phenotypic traits, and the core collection M-30 was constructed by molecular markers. The combination of D2C3S3-30 and M-30 was used to construct the final core collection DM-45, which included 45 samples representing the complete range of phenotypic and genetic variability. This study is the first report describing the development of a core collection in C. fargesii f. duclouxii (Huangxinzimu) using molecular marker data in combination with phenotypic values. It effectively captures the entire range of trait variation, which could effectively represent the original germplasm, and provides a basis for the conservation and utilization of C. fargesii f. duclouxii (Huangxinzimu). The study also demonstrates an effective way to prevent the loss of genes.
Supplementary Materials
The following are available online at https://www.mdpi.com/article/10.3390/f12111518/s1, Table S1: The raw data of quantitative and quality traits.
Author Contributions
This study was carried out with collaboration among all authors. J.W., X.Z. and W.M. conceived and designed the experiments; X.Y., P.F., W.Z., B.L., J.L. and S.Z. performed the experiments; X.Y. and P.F. carried out data correction; N.L. and W.M. carried out manuscript revision; and H.X. wrote the paper. All authors have read and agreed to the published version of the manuscript.
Funding
This research was funded by Fundamental Research Funds of the Chinese Academy of Forestry (CAFYBB2020SZ003).
Institutional Review Board Statement
Not applicable.
Informed Consent Statement
Not applicable.
Data Availability Statement
The data are included in the article or Supplemental Materials.
Conflicts of Interest
The authors declare no conflict of interest.
References
- Frankel, O.H. Genetic perspectives of germplasm conservation. In Genetic Manipulation Impact on Man & Society; Cambridge University Press: Cambridge, UK, 1984. [Google Scholar]
- Li, H.; Chen, D.; Lao, Q.; Ma, Y.; Chen, J.; Wei, J. Preliminary construction of core collection of Erythrophleum fordii based on phenotypic traits. Mol. Plant Breed. 2019, 17, 6881–6890. [Google Scholar]
- Zheng, Y.; Guo, Y.; Fang, S.; Xu, Y.; Chen, J.; Liu, J. Constructing pre-core collection of Cynodon dactylon based on phenotypic data. Acta Pratacult. Sin. 2014, 23, 49–60. [Google Scholar]
- Chen, C.; Ding, C.; Zhang, J.; Li, B.; Chu, Y.; Su, X.; Huang, Q. Population structure analysis and core collection construction of Populus deltoides. Sci. Silvae Sin. 2020, 56, 67–76. [Google Scholar]
- Liu, D.; Zhang, W.; Zhang, F. Preliminary construction of core collection of Eucalyptus urophylla germplasm. J. South China Agric. Un. 2014, 35, 89–93. [Google Scholar]
- Zhang, Q.; Liu, W.; Liu, N.; Zhang, Y.; Yu, X.; Sun, M.; Xu, M. Establishment and evaluation of primary core collection of apricot (Armeniaca vulgaris) germplasm. J. Fruit Sci. 2009, 26, 819–825. [Google Scholar]
- Chen, C.; Ding, C.; Huang, Q.; Li, Z.; Zhang, J.; Liu, N.; Li, B.; Su, X. Construction of phenotypic core collection of Populus deltoides. Forest Res. 2021, 34, 1–11. [Google Scholar] [CrossRef]
- Zheng, F.; Wang, X.; Li, G.; Li, H.; Zhou, P.; Wang, L.; Bai, S.; Liu, P.; Zhang, X.; Hu, X.; et al. Core collection construction of Ningxia tomato germplasm resources based on phenotypic traits. J. Zhejiang Un. (Agric. Life Sci.) 2021, 47, 171–181. [Google Scholar]
- Li, X.; Jia, J.; Wang, J.; Ma, W.; Ma, J.; Zhao, Q. Morphological diversity analysis and preliminary construction of core collection of Catalpa fargesii Bureau. J. Plant Genet. Resour. 2013, 14, 243–248. [Google Scholar]
- Xie, X. Construction of Pyropia haitanensis core germplasm repositories. Master’s Thesis, Jimei University, Xiamen, China, 2014. [Google Scholar]
- Nie, X.-H.; Wang, Z.-H.; Liu, N.-W.; Song, L.; Yan, B.-Q.; Xing, Y.; Zhang, Q.; Fang, K.-F.; Zhao, Y.-L.; Chen, X.; et al. Fingerprinting 146 Chinese chestnut (Castanea mollissima Blume) accessions and selecting a core collection using SSR markers. J. Integr. Agric. 2021, 20, 1277–1286. [Google Scholar] [CrossRef]
- Wünsch, A.; Carrera, M.; Hormaza, I. Molecular characterization of local Spanish peach [Prunus persica (L.) Batsch] germplasm. Genet. Resour. Crop. Evol. 2005, 53, 925–932. [Google Scholar] [CrossRef]
- Satyawan, D.; Tasma, I.M. Identification of prospective soybean accessions for the creation of a genebank core collection based on high density DNA marker data. In Proceedings of the IOP Conference Series: Earth and Environmental Science, Cibinong, Indonesia, 18–20 November 2020; IOP Publishing: Bristol, UK, 2021; Volume 762, p. 762. [Google Scholar]
- Bourguiba, H.; Batnini, M.; Krichen, L.; Trifi-Farah, M.; Audergon, J. Population structure and core collection construction of apricot (Prunus armeniaca L.) in North Africa based on microsatellite markers. Plant Genet. Resour. 2015, 15, 21–28. [Google Scholar] [CrossRef]
- Andersson, M.S.; Peters, M.; Schultze-Kraft, R.; Gallego, G.; Duque, M.C. Molecular characterization of a collection of the tropical multipurpose shrub legume Flemingia macrophylla. Agrofor. Syst. 2006, 68, 231–245. [Google Scholar] [CrossRef]
- Peng, C.; Fan, X.; Su, X.; Long, K.; Zhang, X. Construction of core collection in southern type of Populus deltoides using SSR markers. Acta Bot. Boreali-Occident. Sin. 2019, 39, 250–257. [Google Scholar]
- Gao, X.; Zhou, Y.; Song, D.; Li, J.; Chen, W.; Li, S.; Su, Y. Construction of core collection of Chinese Aegilops tauschii germplasm resource based on spike morphological traits and molecular markers. J. Plant Genet. Resour. 2021, 22, 361–370. [Google Scholar]
- Mahmoodi, R.; Dadpour, M.R.; Hassani, D.; Zeinalabedini, M.; Vendramin, E.; Leslie, C.A. Composite core set construction and diversity analysis of Iranian walnut germplasm using molecular markers and phenotypic traits. PLoS ONE 2021, 16, e0248623. [Google Scholar] [CrossRef]
- Belaj, A.; del Carmen Dominguez-García, M.; Atienza, S.G.; Urdíroz, N.M.; De la Rosa, R.; Satovic, Z.; Martín, A.; Kilian, A.; Trujillo, I.; Valpuesta, V.; et al. Developing a core collection of olive (Olea europaea L.) based on molecular markers (DArTs, SSRs, SNPs) and agronomic traits. Tree Genet. Genomes 2012, 8, 365–378. [Google Scholar] [CrossRef]
- Ma, Q.; Ning, X.; Li, J.; Chen, H.; Yu, Y.; Lin, H. Mining elite sea-island cotton germplasm based on phenotyping and SSR markers. Cotton Sci. 2020, 32, 91–101. [Google Scholar]
- Zhang, X.; Li, Z.; Zhang, Y.; Huang, G.; Chen, W. Early stage selection of fine clones of Catalpa fargesii f. duclouxii in Hubei province. Chin. Agric. Sci. Bull. 2016, 32, 24–29. [Google Scholar]
- Xiao, Y.; Yao, S.; Yang, G.; Zhang, M.; Ouyang, F.; Wang, J.; Ma, W. Early variations of wood property of Catalpa fargesii f. duclouxii clone and their evaluation. Forest Res. 2019, 32, 79–87. [Google Scholar]
- Xiao, Y.; Ma, W.; Yi, F.; Yang, G.; Wang, Q.; Wang, P.; Wang, J. Genetic variation of growth traits and genetic diversity of phenotypic traits in Catalpa fargesii f. duclouxii germplasm. Bull Bot Res. 2018, 38, 843–851. [Google Scholar]
- Lei, G.; Zhou, K.; Fang, R.; Wu, Y.; Chen, X. Studies on the constructing of pepper core collection based on phenotypic data. Acta Bot. Boreali-Occident. Sin. 2016, 36, 804–810. [Google Scholar]
- State Forestry Bureau. Guidelines for the Conduct of Tests for Distinctness, Uniformity and Stability (DUS)—Catalpa Scop; State Forestry Bureau: Beijing, China, 2014. [Google Scholar]
- Bai, R. Studies on genetic diversity and core collection construction of Ziziphus jujuba germsplasm resources using AFLP and SRAP markers. Ph.D. Thesis, Agricultural University of Hebei, Baoding, China, 2008. [Google Scholar]
- Liu, J.; Liao, K.; Cao, Q.; Sun, Q.; Liu, H.; Jia, Y. Establishment of wild apricot core collection based on phenotypic characters. J. Fruit Sci. 2015, 32, 787–796. [Google Scholar]
- Fulton, T.M.; Chunwongse, J.; Tanksley, S.D. Microprep protocol for extraction of DNA from tomato and other herbaceous plants. Plant Mol. Biol. Rep. 1995, 13, 207–209. [Google Scholar] [CrossRef]
- Hu, J.; Zhu, J.; Xu, H.M. Methods of constructing core collections by stepwise clustering with three sampling strategies based on the genotypic values of crops. Theor. Appl. Genet. 2000, 101, 264–268. [Google Scholar] [CrossRef]
- Wang, J.; Hu, J.; Zhang, C.; Xu, H.; Zhang, S. Evaluating parameters of rice core collections based on genotypic values and molecular marker information. Chin. J. Rice Sci. 2007, 1, 51–58. [Google Scholar]
- Liu, Z.; Zhang, C.; Zhang, Y.; Zhang, X.; Wu, C.; Wang, H.; Shi, J.; Chen, X. Study on method of constructing core collection of Malus sieversii based on quantitative traits. Sci. Agric. Sin. 2010, 43, 358–370. [Google Scholar]
- Zhang, C. Population genetic structure and method of constructing core collection for Malus sieversii. Ph.D. Thesis, Shandong Agricultural University, Tai’an, China, 2008. [Google Scholar]
- Ma, Y. Population Genetic Structure and Method of Constructing Core Collection for Castanea mollissima Blume. Ph.D. Thesis, Shandong Agricultural University, Tai’an, China, 2009. [Google Scholar]
- Mahalanobis, P.C. On the Generalized Distance in Statistics; National Institute of Science of India: Bhubaneswar, India, 1936; Volume 2, pp. 49–55. [Google Scholar]
- Wei, Z.; Gao, Y.; Yang, C. Sampling method for contracting germplasm core collections of Betula platyphylla. J. Northeast For. Univ. 2009, 37, 1–4. [Google Scholar]
- Xu, H.; Qiu, Y.; Hu, J.; Wang, J. Mothods of constructing core collection of crop germplasm by comparing different genetic distances, cluster methods and sampling strategies. Acta Agron. Sin. 2004, 30, 932–936. [Google Scholar]
- Guo, Y. Study on Phenotypic Diversity and Construction Core Collection of Bermudagrass. Master’s Thesis, Henan University of Science and Technology, Luoyang, China, 2015. [Google Scholar]
- Li, Z.; Zhang, H.; Cao, Y.; Qiu, Z.; Wei, X.; Tang, S.; Yu, P.; Wang, X. Studies on the sampling strategy for primary core collection of Chinese ingenious rice. Acta Agron. Sin. 2003, 29, 20–24. [Google Scholar]
- Raamsdonk, L.; Wijnker, J. The development of a new approach for establishing a core collection using multivariate analyses with tulip as case. Genet. Resour. Crop Evol. 2000, 47, 403–416. [Google Scholar] [CrossRef]
- Kumar, S.; Ambreen, H.; Variath, M.T.; Rao, A.R.; Agarwal, M.; Kumar, A.; Goel, S.; Jagannath, A. Utilization of molecular, phenotypic, and geographical diversity to develop compact composite core collection in the oilseed crop, safflower (Carthamus tinctorius L.) through maximization strategy. Front. Plant Sci. 2016, 7, 1554. [Google Scholar] [CrossRef]
- Bakkali, A.E.; Haouane, H.; Moukhli, A.; Costes, E.; Damme, P.V.; Khadari, B. Construction of core collections suitable for association mapping to optimize use of Mediterranean olive (Olea europaea L.) genetic resources. PLoS ONE 2013, 8, e61265. [Google Scholar] [CrossRef][Green Version]
- Zhang, J.; Tian, R.; Chen, Q.; Yang, X.; Fan, J.; Hu, H. Construction of standard SSR fingerprint of Pyrus pyrifolia core collection. Hubei Agric. Sci. 2015, 54, 6284–6290. [Google Scholar]
- Franco, J.; Crossa, J.; Warburton, M.L.; Taba, S. Sampling strategies for conserving maize diversity when forming core subsets using genetic markers. Crop. Sci. 2006, 46, 854–864. [Google Scholar] [CrossRef]
- Thachuk, C.; Crossa, J.; Franco, J.; Dreisigacker, S.; Warburton, M.; Davenport, G.F. Core Hunter: An algorithm for sampling genetic resources based on multiple genetic measures. BMC Bioinform. 2009, 10, 243. [Google Scholar] [CrossRef]
- Zhu, S.; Niu, E.; Wang, W.; Shi, A. Identification and evaluation of SNP core loci for olive germplasm (Olea europaea L.). Mol. Plant Breed. 2020, 18, 1548–1557. [Google Scholar]
- Fang, J.; Long, Q.; Hua, Y.; Huang, H. Establishment of a Hevea brasiliensis germplasm core collection based on EST-SSRs. Chin. J. Trop. Crops 2013, 34, 1013–1017. [Google Scholar]
- Upadhyaya, H.D.; Ortiz, R. A mini core subset for capturing diversity and promoting utilization of chickpea genetic resources in crop improvement. Theor. Appl. Genet. 2001, 102, 1292–1298. [Google Scholar] [CrossRef]
- Okpul, T.; Gunua, T.; Wagih, M. Assessment of diversity using agro-morphological traits for selecting a core sample of Papua New Guinea taro (Colocasia esculenta (L.) Schott) collection. Genet. Resour. Crop. Evol. 2004, 51, 671–678. [Google Scholar] [CrossRef]
- Tanksley, S.D.; McCouch, S.R. Seed banks and molecular maps: Unlocking genetic potential from the wild. Science 1997, 277, 1063–1066. [Google Scholar] [CrossRef]

Publisher’s Note: MDPI stays neutral with regard to jurisdictional claims in published maps and institutional affiliations. |
© 2021 by the authors. Licensee MDPI, Basel, Switzerland. This article is an open access article distributed under the terms and conditions of the Creative Commons Attribution (CC BY) license (https://creativecommons.org/licenses/by/4.0/).