Article

Investigating Masking Effects of Age Trends on the Correlations among Tree Ring Proxies

by
Tito Arosio
1,2,*,
Malin Michelle Ziehmer-Wenz
1,2,3,
Kurt Nicolussi
4,
Christian Schlüchter
2,5 and
Markus Christian Leuenberger
1,2
1
Climate and Environmental Physics, Physics Institute, University of Bern, 3012 Bern, Switzerland
2
Oeschger Centre for Climate Change Research, University of Bern, 3012 Bern, Switzerland
3
Swiss Tropical and Public Health Institute, 4051 Basel, Switzerland
4
Institute of Geography, University of Innsbruck, 6020 Innsbruck, Austria
5
Institute of Geological Sciences, University of Bern, 3012 Bern, Switzerland
*
Author to whom correspondence should be addressed.
Forests 2021, 12(11), 1523; https://doi.org/10.3390/f12111523
Submission received: 9 October 2021 / Revised: 29 October 2021 / Accepted: 2 November 2021 / Published: 4 November 2021
(This article belongs to the Special Issue Stable Isotopes in Dendroecology)

Abstract

:
Age-related trends are present in tree-ring widths (TRW), but their presence in tree rings isotope is debated. It is unclear how cambial age influences the relationships between TRW and isotopes. Tree-ring isotopes of alpine larch and cembran-pine trees showed only trends in the juvenile period (>100 years), which might mask the inter-relations between tree-ring proxies during cambial age. This work tries to unmask the age-trend influences by examining the correlations in TRW—stable isotopes with and without age-trend correction. The non-detrended and linear-detrended values of TRW, of δD and δ18O showed significant correlations for ages up to 100 years, but not afterward. However, the correlation values, after spline or first-difference time-series detrending, were not age-related. Thus, detrending methods affect the correlations in the juvenile phase and may affect climate-related interpretations. The correlations between TRW and δ13C were not age-related, while those among the isotopes were significant throughout the ages. The correlation between δ13C and δD was the exception, as it became significant only after age > 100 years, suggesting a different use of reserves in the juvenile phase. In conclusion, the relationships among the tree-ring parameters are stable in all the different detrend scenarios after the juvenile phase, and they can be used together in multi-proxy paleoclimatic studies. The data of the juvenile phase can be used after spline-detrending or first-difference time-series calculation, depending on the purpose of the analysis to remove age-related trends. The work also provides clues on the possible causes of juvenile age trends.

1. Introduction

Tree ring widths (TRW) are widely used for paleoclimatic study due to having the great advantage of annual resolution and accurate dating on the calendar timescale [1,2,3]. The cellulose of such tree-ring samples and its stable isotopes can provide complementary proxies for paleoclimate and tree physiology [4,5]. TRW and the stable isotopes of hydrogen, oxygen and carbon are used independently in paleoclimatic studies, but multi-proxy approaches that try combining different tree parameters have been recently proposed with some success [4,6,7,8]. A common problem of these records for paleoclimatic studies is the possible presence of age-related trends, and how to correct them. For TRW, age-related trends have been extensively characterized, and the procedure for removing them has been established by applying adequate detrending algorithms [2]. For tree-ring isotopes, the presence of age-related trends is still debated, with contrasting results [1,9,10,11]. The normal procedure for detecting such trends is to align the data on the cambial age (ring number from the pith) to verify if there are consistent modifications with age [10]. This procedure is efficient, but does not give clues for the interpretation of the presence or absence of the trends. In fact, they may be caused by factors external to the trees, such as canopy effect, precipitation, water source, or internal factors linked to changes in metabolic activity. These factors may be approached by verifying if and how the values of the stable isotopes and of TRW change with age in a robust manner, and how they are influenced by tree species and localization. Several studies were done to detect age-related trends for TRW and isotopes, without verifying whether the relationships between isotope and TRW change with age [10,12], possibly due to metabolic variations [13]. The access to a large number of samples with these parameters should allow us to explore which of the possible detrending methods are useful for paleoclimatic studies. We have been analyzing the large Alpine Holocene Tree Ring Dataset for their isotope signals. The dataset covers the last 9000 years and is based on almost 200 trees of two conifer species, the larch (Larix decidua Mill.) and cembran pine (Pinus cembra L.) at tree-line and with cambial ages ranging from 1 to 700 years. Our recent work on the samples of this database detected age-related trends of the values of hydrogen, oxygen and carbon isotopes only in the first 100 years, with differences between Larch and Cembran pine [14]. For ages greater than 100 years, our results proved the absence of any age-related effect in the δD, δ18O, and δ13C time series for both the evergreen and deciduous conifer species, the only exception being larch δD. However, for ages <100 years we found trends that differ for each isotope and species. For example, the mean δ13C values in larch do not vary with age and can be used without detrending, whereas those in cembran pine show a juvenile effect. The δ18O values present two distinct age phases for both species, complicating the detrending. Similarly, δD values in larch change in the first 50 years, whereas cembran pine change between 50 and 100 years. The results were interpreted by a change in the metabolic activity before and after around 100 years of age. It was concluded that values of δD and δ18O of these two periods of age should be used with caution in climate reconstructions.
With further analyses of this dataset, we aim to study the relationships between TRW and isotopes as a function of cambial age. Therefore, we tested different scenarios for their potential use, such as non-detrended Z-score data, linear-detrended, spline-detrended and first-difference time-series. We hypothesize that the correlation analyses of the parameters would allow us to investigate the causes for the observed contrasting stable isotope trends during the juvenile phase (the first 100 years approximately), their possible physiological mechanisms, and their effects on climate responses, which are still unclear. Linkages between parameters are known; for example, oxygen and hydrogen isotopes share the water source [15], and carbon isotope and TRW are both influenced by the carbon allocation strategies [16].
Only a few studies have analyzed the correlations between TRW values and stable isotope fractionation with somewhat contrasting results, and some of them have used this relationship to extract climatic and physiological information [7,17,18,19]. Moreover, combinations of the different isotopes have been used for paleoclimatic studies [11,20]. Most of these publications used detrended TRW values and the calculated values of the correlation coefficient r were generally positive in the range 0.2–0.3 [18,21,22,23,24], but one work found correlations to be non-significant [25]. However, none of the studies considered how the age of isotope samples can affect such correlation values. To fill this gap, we reanalyzed our database and divided the samples in classes of age, with attention to the juvenile phase, i.e., the first approximately 100 years. Then, we studied the correlations between TRW and cellulose stable isotopes in different scenarios: non-detrended data, two detrended methods, and in the short run, difference in the first-difference time series.

2. Materials and Methods

The tree-ring database used in this work and the analysis and the estimation of the cambial age were described before [14]. Briefly, the samples come from the Eastern Alpine Conifer Chronology (EACC) [26] and include only two species: the deciduous larch (Larix decidua Mill.) and the evergreen cembran pine (Pinus cembra L.). The wood material has been collected at 29 sites in different parts of the European Alps (Switzerland, Italy and Austria) at or near the local tree line, respectively, at an elevation range of 1930 to 2400 m asl and covering a SW–NE transect (Figure 1). At 11 of the sites, specimens of both species were collected, at 15 sites only cembran pine, and at 3 sites only larch specimens. Only 17 trees contain tree-rings formed after the Industrial Revolution, i.e., after ca. 1850 CE. The majority of specimens come from subfossil wood found on the glacier foreland, at peat bogs and in small lakes which were supplemented with slices taken from dry-dead logs, while the most recent period is represented by cores extracted from living trees [26,27].
All wood samples used for isotope analysis combine tree-rings of 5 consecutive years of individual trees and they were prepared and analyzed for stable isotope ratios as recently described [14,28]. The procedure of cellulose extraction was done as in [29] and the calculation of the cellulose content (cellulose dry weight/wood dry weight) as in [28]. The triple-isotope analysis is described in [14,30,31]. In short, we used conventional Isotope Ratio Mass Spectrometry (Isoprime 100, Elementar Analysensysteme GmbH, Langenselbold, Germany) coupled to a pyrolysis unit (HEKAtech GmbH, Wegberg, Germany), which is similar to the previously used TC/EA (for technical details, see [32]). This approach was extended to measurements of non-exchangeable hydrogen of alpha-cellulose using the on-line equilibration method [30,31]. The results are reported in per mil (‰) relative to the Vienna Pee Dee Belemnite (VPDB) for carbon and to Vienna Standard Mean Ocean Water (VSMOW) for hydrogen and oxygen [33]. The precision of the measurement is ±3.0‰ for hydrogen, ±0.3‰ for oxygen and ±0.15‰ for carbon [31].

2.1. Detrending

In addition to the analyses on not trend correct values, we applied three different detrending methods to TRW and isotope values in comparison to recognize and evaluate correlation results driven by the age-related trends common to some tree-ring parameters:
ND: non-detrended, raw values for TRW and Z-score for isotopes;
LD: linear detrending applied to each age class of the different species; and
SD: spline detrending function applied to each whole tree with 5-year resolution, to For TRW and isotopes we utilized the R library dplR with the default settings (using 67% of total series length and frequency response of 50%) [34]. To apply this function, we interpolated the values of the missing years with a running mean (maximum of two consecutive missing samples in 15 trees). The spline detrending function of the R packet DPLR removes the mean age trend and also scales the variance, so that it remains the same for the entire life-span of the tree [2].
FD: first-difference time-series, we subtracted the value of each year to that of the following year.
A visual representation of the data for the three different scenarios is given in the supplementary information (Figure S1).

2.2. Correlation Analysis

All the tree-ring and cellulose isotope data were divided into 7 classes of age (1–25, 26–50, 51–75, 76–100, 101–200, 201–300, >300 year) for the two species. Table 1 displays the number of samples and the number of trees for each class.
Then, the correlations between TRW and the three isotopes in the two species were calculated in the four scenarios of non-detrend data (ND), linear-detrend (LD), spline-detrend (SD) and first-difference time-series (FD), and the results are shown in Figure 2 and Figure S4. They were calculated using the Spearman’s rank correlation coefficient for each age class and also for the total data of each species (indicated by the blue boxes in the graphs). We chose the Spearman method [35] because it is widely used when comparing data with non-normal distribution (e.g., TRW data) with normal distributed data (e.g., the isotope values). To avoid a possible geographical effect that could lead to artificial trends, we scaled the isotope values of each tree, transforming the value in the Z-score by subtracting the tree mean and dividing by the standard deviation. The threshold for the correlation coefficient was chosen to be p < 0.05. To identify influences driven by common trends, we calculated the correlations in four different scenarios: (i) by using the non-detrended values of the isotopes and non-detrended TRW; (ii) by using linear-detrended isotope and linear-detrended TRW values for each age class as a function of age; (iii) by using spline-detrended isotope and spline detrended TRW values; and (iv) by using the first-difference time-series values of isotopes and first-difference time-series values of TRW and isotopes. For further confirmation on the stability and robustness of the Spearman correlation coefficient, we ran a Monte Carlo simulation with random subsamplings of half of the total sample population and calculated the Spearman’s correlation factor in a loop of 5000 cycles. The results were then compared with the calculated Spearman correlation results for the total population. All data analysis was performed in R using the basic function and packet Dplr [34] and packet Tidyverse [36].

3. Results

The correlations between the non-detrended (ND) values of TRW and δD (Figure 2a) are significant and negative in both species up to approximately 50 years of age, then they tend to decrease and become non-significant after approximately 100 years of age, and for larch the values become even positive. The r values and trends of the correlations for the age classes do not show evident change after linear detrending (LD) of the individual classes (Figure 2d). Similarly, TRW and δ18O show positive and significant correlations in the first 50 years followed by a loss of significant correlation after approximately 100 years (Figure 2b,e). In both cases the correlations TRW-δD and TRW-δ18O of the two youngest age classes present absolute r values that are much higher than those using the values of all ages shown in the blue box. The correlations between the TRW and δ13C (Figure 2c,f) show non-significant r values in most age classes including the class of all values, but the pattern for the spline-detrended values (Figure 2i) does not show negative r values, in contrast to Figure 2c,f.
The correlation factors change after applying the SD spline-detrending (Figure 2g,h). The correlations between TRW and larch deuterium become non-significant after 25 years, while it remains significant for cembran pine. The correlations between TRW and oxygen remain mostly significant in both trees even after approximately 100 years. The correlations TRW–δ13C remain non-significant throughout all ages (Figure 2i). In the FD first-difference time-series scenario, the correlations become non-significant in most of the age classes (Figure 2j–l).
We applied the same approach to study the correlations between the isotopes themselves, using first the non-detrended ND data (Figure 3a–c) and then LD linear-detrended (Figure 3d–f), SD spline-detrended (Figure 3g–i) and FD first-difference time-series data to each class (Figure 3j–l). The correlations between δD and δ18O show different behaviors in the two species. For the non-detrended and LD data, the youngest age class for cembran pine shows negative and significant r values; after 75 years, they are non-significant or close to zero. An opposite trend is evident for larch, where the younger classes have low and non-significant r values, followed by classes with increased and significant r values. The plots of the non-detrended and LD data do not show major differences (Figure 3a,d). The correlations between δ13C and δ18O and between δ13C and δD are significant and do not show any evident trend with age.
SD spline detrending increased the correlation r values between δD and δ18O in larch, and the loss of negative correlation in the juvenile phase in cembran pines (Figure 3g). Altogether, the correlation values after spline detrending show no obvious dependence with age (Figure 3h,i). In the FD first-difference time-series scenario, the correlations change with age, mainly those between δD and δ13C, where r values become significant only after approximately 75 years in larch, and approximately 100 years in cembran pine. After that, the correlations remain significant and stable. The correlations δD vs. δ18O and δ18O vs. δ13C are significant in both species without evident age-trends.
Representative examples of Monte Carlo simulations of non-detrended data for each age class of the two species are shown in the supplementary material (Figures S2 and S3). The frequency of the correlation coefficients for randomly selected samples from half of the total population always has a normal distribution around the observed correlation value. This proves the robustness of correlations in relation to possible random sub-sampling for this case. We observe that the decrease in sample size may spread the range of correlation coefficient frequency and lead to a non-normal distribution. Based on these calculations, we found a threshold of ~30 samples. Above it, the correlation strength is close to that of the total population.

4. Discussion

The aim of the work was to use a statistical correlation analysis to check whether or not the relationships between the tree ring parameters (TRW and stable isotopes) are influenced by age even after correcting for age trend. To better understand this relationship, we used different detrending methods and compared them to the raw values: linear detrend, spline detrend, and first-time difference. Furthermore, to validate the suitability of the database, we ran a Monte Carlo simulation. The result confirmed that correlations were robust and stable and that a population of at least 30 samples is necessary to draw conclusions; below 30 samples, the correlations may not be representative.

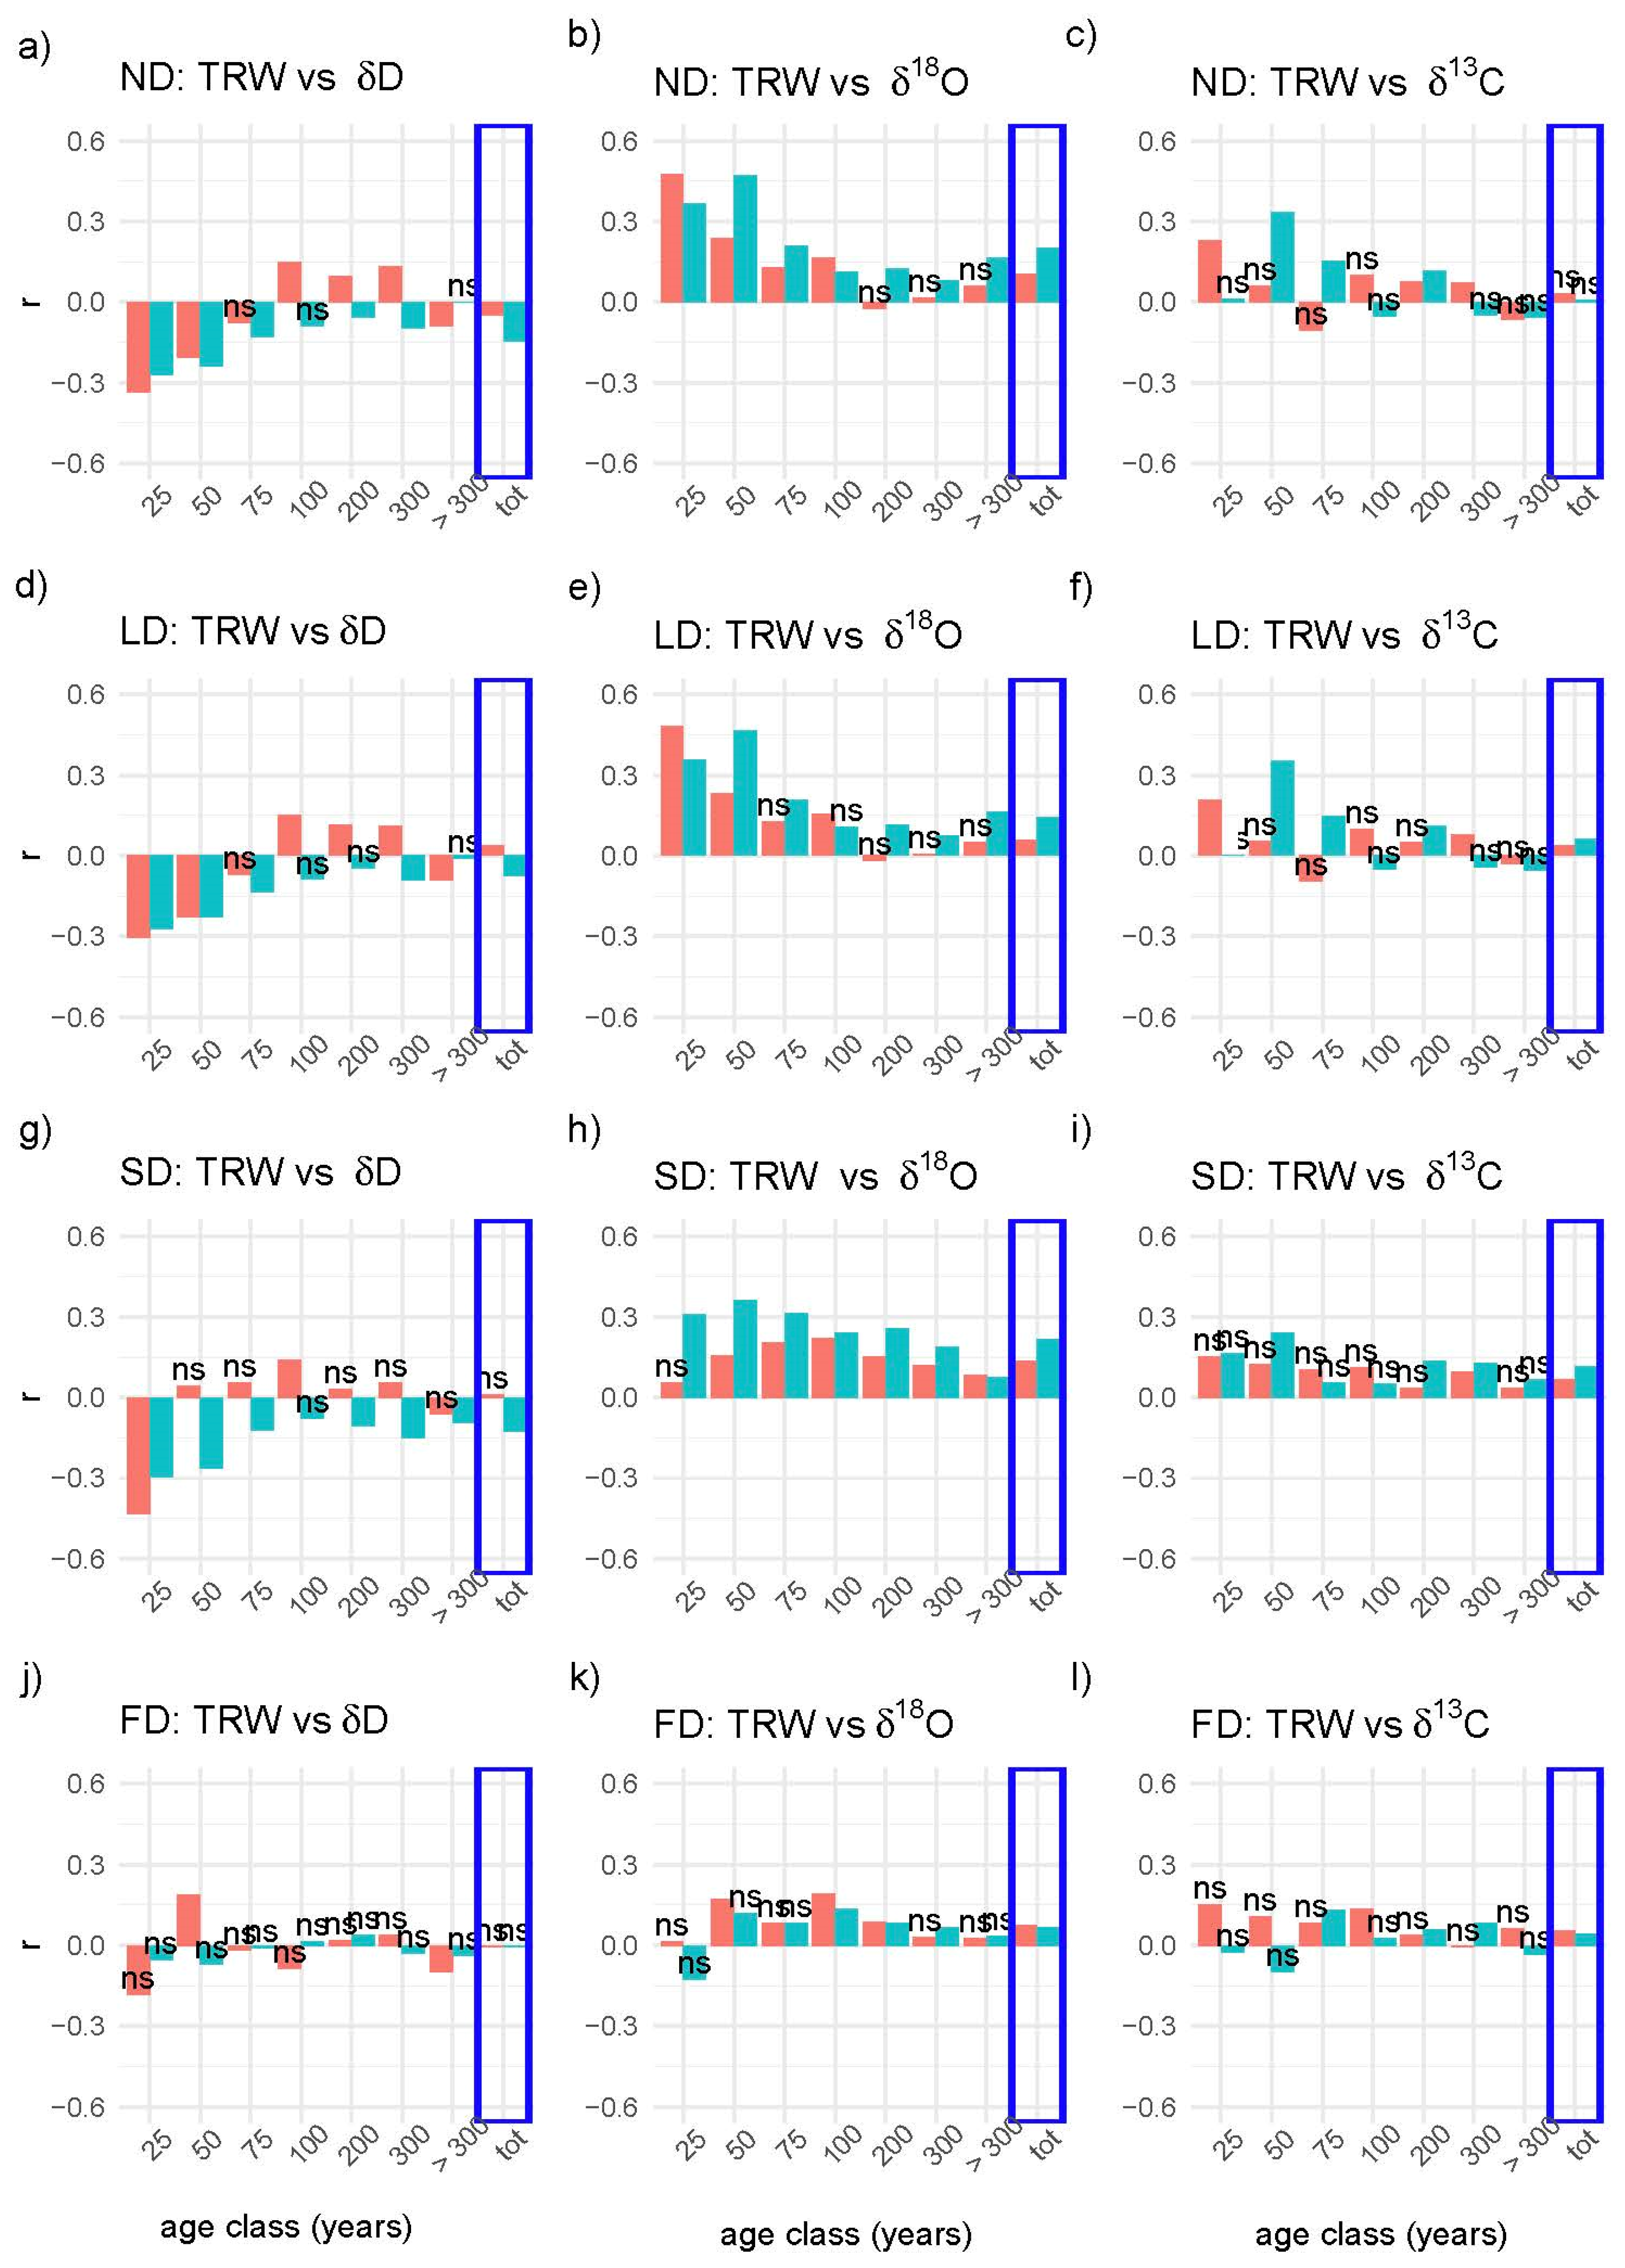
4.1. Correlations between TRW and Isotopes in the Three Scenarios

The initial analysis was the non-detrend scenario that showed a moderate but significant correlation between TRW and water isotopes (negative for δD, positive for δ18O) only in the youngest age classes, with similar behaviors and values in larch and in cembran pine. This indicates that these trends are not species-specific (Figure 2) and possibly respond to the same causes, even if the δD age-related trends are species-specific [37]. The observation that TRW vs. δ18O correlates significantly only in the juvenile period may partially explains previous contradictory reports [18,21,23,24,25,34] since their tree ages were not given and different configurations of data were used; mostly detrended TRW and non-detrended isotope values.
The significant correlations between TRW and water isotopes in the juvenile trees may be due to biological processes that change during aging. For example, in the juvenile phase <100 years, wood formation (xylogenesis) is faster, occurs over a longer period of the year and is characterized by wider tree-rings [38,39], with a maximum width around an age of 30 years, followed by a negative exponential decrease [40]. The correlation with δD and δ18O in this phase may be attributed to a reduced exchange rate of the δ18O of glucose with non-enriched xylem water [41,42] due to a higher photosynthetic activity with a rapid production of glucose that is readily transformed into sucrose and used for cellulose synthesis [13]. Alternatively, these correlations may be due to the simple fact that δD, δ18O and TRW all show an age trend in the juvenile period [14].
The lack of significant correlation between TRW and δ13C in all the different detrending scenarios can be interpreted by the observation that the two components are driven by different climatic factors. At tree-line, the temperature is the major driver of TRW [43] while the drivers of carbon isotope are summer moisture stress and precipitation [44,45]. Moreover, the influence of the use of starch reserves for tree growth on δ13C is limited and obviously too weak to infer a correlation with TRW.
Thus, we used detrending methods that remove age-related trends. Spline detrending is often used to remove the strong age effect of TRW [2], and we applied it to TRW and isotopes. This changed the correlations between TRW and δ18O that became more homogeneous among the different age classes. In particular, the r values remained significant at all ages, and the age trend was lost. This change of behavior is probably due to the fact that the spline detrending method removes not only the time-trend, but also scales the variance, making it constant over time [2], an effect that is particularly important for TRW, the variance of which decreases with age. After spline-detrending, the correlations between TRW vs. δD became non-significant in the larch, except in the class 1–25 years, while they remained significant in cembran pine and lasted up to approximately 100 years. The TRW vs. δ13C correlations remained non-significant also in this scenario. Noteworthy, spline-detrending caused little variations of the correlation values after approximately 100 years compared to those of the non-detrended or linear-detrended values. Therefore, after approximately 100 years, the type of detrending method does not seem to be relevant, with the only exception being the first difference time series. The most plausible reason for this finding is that the juvenile trends end at approximately 100 years.
The first-difference time-series detrending not only removed the age-relate trend, but it also highlighted short term variations between the 5-year blocks. Thus, the loss of significant correlations between TRW and δD and between TRW and δ18O in the juvenile phase suggests that the processes that drive the correlation in this phase are longer than five years, and the short-term trends of δ18O and δ13C are derived by metabolic activity [46]. Altogether, the presence of age trends in δD and δ18O of non-detrended data does not seem sufficient to fully justify the correlations between TRWs and isotopes for the non-detrended and linear-detrended records as a change in correlation also occurs for spline detrended values.
The correlations between TRW and δ13C were non-significant during the complete tree lifespan, in the two species and in all three scenarios. This may indicate that reserves (which would lead to an increase in δ13C, [47,48] are not significantly used to increase TRW and therefore growth but may only be used for biotic or abiotic stresses.

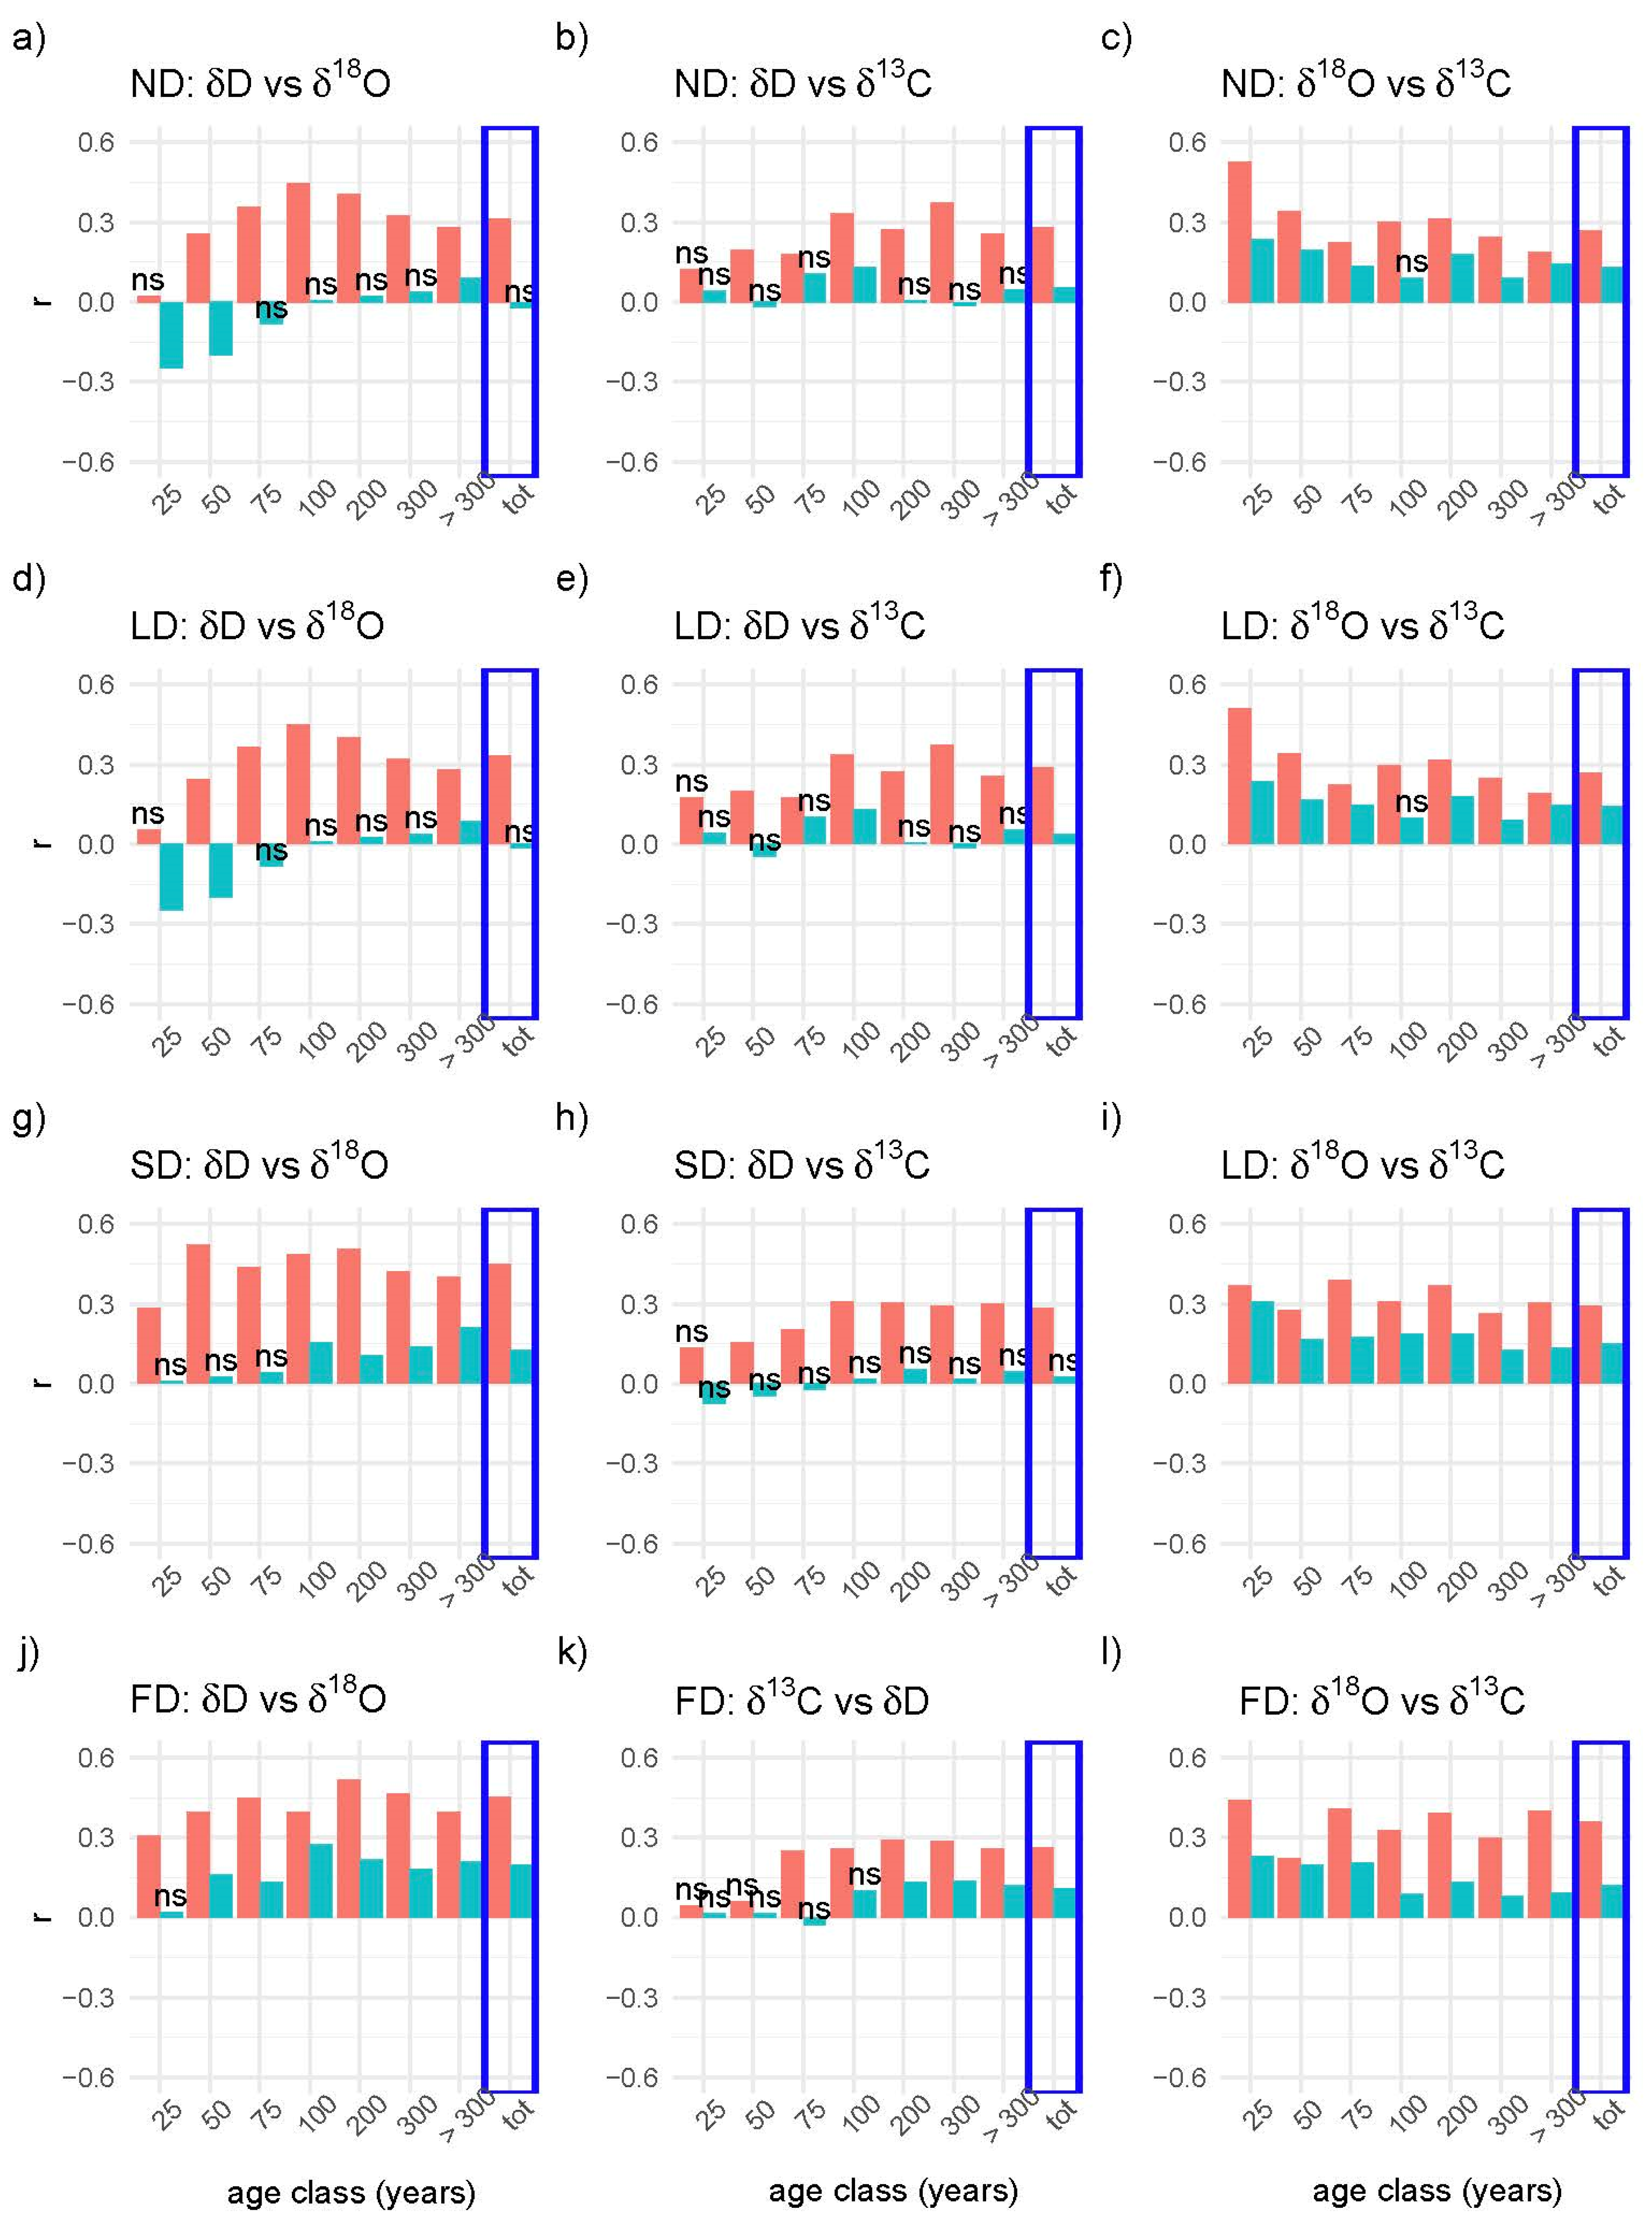
4.2. Correlations between the Isotopes in the Four Scenarios

Using both the non-detrended and linear-detrended data, the correlations between δD and δ18O were different in the two species: in larch they were significant and positive after 50 years, while in cembran pine they were significant and negative before approximately 100 years (Figure 3). The observation that the correlations between δD and δ18O change during the juvenile phase in both species is novel and currently difficult to interpret, especially due to the lack of understanding of the biological fractionation of hydrogen in larch. After spline-detrending, the correlations between the isotopes lost any age-trend in the juvenile period, as expected, the only minor exception was the correlations between δD and δ18O in cembran pine that were non-significant before 75 years, and then became significant. The correlations are rather high for larch and low for cembran pine. Also, the first-difference time-series detrending method removed the juvenile age-trend, as expected, but it also increased the statistical significance of the correlations between the isotopes in cembran pine, pointing to a common driver for the short run differences.
The generally high correlation values in all different scenarios between the water isotopes of larch are consistent with the earlier assumption that this deciduous conifer has a lower post-photosynthetic fractionation due to the lower exchange of glucose with the surrounding water after photosynthesis, which preserves most of the leaf water signature [37]. Instead, the cembran pine correlations between water isotopes have lower values and are more influenced by the age, with a generally lower correlation in the juvenile phase. This behavior can be interpreted as a higher post-photosynthetic hydrogen exchange with surrounding water in leaf and in cambium, leading to a different signal in the two water isotopes.
The correlations δD vs. δ13C are generally significant for larch and less so for cembran pine. The two isotopes are linked through the use of starch, a process that enriches them both [48,49]. The unstable link between the two can be attributed to a reduced use of the reserve in approximately the first 100 years, but this is in contrast with the result from the correlation of TRW vs. δ13C. Alternatively, it may be due to a stronger biological fractionation for deuterium in the juvenile phase due to the higher metabolism. Future studies are required to shed light on these issues.

5. Conclusions

This statistical study on the correlations between the tree ring components (TRW and cellulose isotopes) shows that the age trends of these proxies affect most of their relationships, particularly in the juvenile phase. These results give advice on the use of isotope combinations or their correlations as paleoclimate proxies: (i) Isotope combinations can be safely used after approximately 100 years of age, since their relationships are little affected by the type of detrending method; (ii) however, if the juvenile phase has to be used, we suggest using the spline-detrend method or the first-difference time-series method, depending on the purpose of the analysis; (iii) the finding that carbon isotope does not present any age influence in correlations with TRW indicates that reserves are not linked to the fast growth of TRW during the juvenile period; and (iv) larch and cembran pine show a clear difference in the use of reserves, as shown in particular by the correlations between δD and δ13C, and their time dependence additionally indicates an increasing formation of reserves during the juvenile period.

Supplementary Materials

The following are available online at https://www.mdpi.com/article/10.3390/f12111523/s1, Figure S1: Cambial-age aligned and averaged tree-ring parameters (TRW, δ18O, δD, δ13C);without/after detrending. The upper panels show non-detrended (ND) data of TRW (a), δ18O (b) δ13C (c); δD (d); the panels below show linear detrended (LD) (e–h); then the panels show linear spline detrended data (SD) (i–l), the lowermost panels show time-series of the first-differences (FD) (m, n, o, p). The values of larch trees are in red, those of cembran pine are in turquoise. The thick line represents the average, the two thinner lines are for the standard deviations, Figure S2: Monte Carlo simulation tests between TRW and isotopes. First a random sub-sampling covering half of the populations was made, then the correlations were recalculated in a loop of 5000 iterations to obtain the frequency of the correlations. The histograms show the distribution of the frequency values around the correlation values for each age class and for the two species. The vertical red lines indicate the correlation factors of Figure 1. Panel A: Monte Carlo simulation for the correlations between TRW and δ13C for the two species (larch and cembran pine) and for the 7 age classes and total number of samples. Panel B: as above, for the correlations between TRW and δD. All the plots show a normal distribution around the observed r values, confirming the results shown in Figure 2, Figure S3: Monte Carlo simulation to retrieve a minimal threshold value to be representative of the complete population. A Monte Carlo simulation was run to study the influence of the population size on the correlation test, to establish the minimum threshold of sample number to be used. We gradually decreased the population of random sub-samples used as indicated in the plots. Panel A: Monte Carlo simulation for the correlation between TRW and oxygen isotope in the age class 50 for both species. Panel B: Monte Carlo simulation for the correlation between TRW and oxygen isotope in the age class 25. The plots maintain a normal distribution only for a population size of 30 or above, Figure S4: Visual representation of the data of the correlations show in Figure 2. The plots show the data for each cambial age class of larch (red) and cembran pine (blue), between TRW (x-axis) and: δ13C (Figure S4.1), δD (Figure S4.2) and δ18O (Figure S4.3) on the y-axis. The linear regression line is shown as bold line with the confidence interval as colored shading.

Author Contributions

T.A. and M.M.Z.-W. performed the stable-isotope analyses. T.A. drafted the first version of the manuscript. K.N. was responsible for collecting, analyzing and crossdating of the wood material. M.C.L. contributed to the evaluation of the results. M.C.L., K.N. and C.S. conceived of the presented idea. All authors have read and agreed to the published version of the manuscript.

Funding

This research has been supported by the Swiss National Science Foundation (grant nos. SNF 200021L_144255 and SNF 200020_172550) and the Austrian Science Fund (grant no. I-1183-N19).

Institutional Review Board Statement

Not applicable.

Informed Consent Statement

Not applicable.

Data Availability Statement

At present, data can be obtained upon request. As agreed upon among the project participants, datasets will be made available to the public after the official completion of the Alpine Holocene Tree Ring Isotope Records (AHTRIR) project.

Acknowledgments

We are grateful to Peter Nyfeler for the precious assistance during stable isotope measurements, to Andrea Thurner and Andreas Österreicher for the preparation of the isotope samples from Alpine sites and the civil service collaborators: Lars Herrmann, Giacomo Ruggia, Jonathan Lamprecht, Yannick Rohrer, Rafael Zuber, Andrea Weibel, Rafael Ottersberg. This work was supported by the Swiss National Science Foundation projects (SNSF, 2000212_144255, 200020_172550) as well as by the Austrian Science Fund (FWF, grant I-1183-N19) and is supported by the Oeschger Center for Climate Change Research, University of Bern, Bern, Switzerland (OCCR).

Conflicts of Interest

The authors declare no conflict of interest.

References

  1. Büntgen, U.; Kolář, T.; Rybníček, M.; Koňasová, E.; Trnka, M.; Ač, A.; Krusic, P.J.; Esper, J.; Treydte, K.; Reinig, F.; et al. No Age Trends in Oak Stable Isotopes. Paleoceanogr. Paleoclimatology 2020, 35, e2019PA003831. [Google Scholar] [CrossRef]
  2. Fritz, H. Tree Rings: Basics and Applications of Dendrochronology; Springer Science & Business Media: Berlin, Germany, 1976. [Google Scholar]
  3. Loader, N.J.; Young, G.H.F.; McCarroll, D.; Davies, D.; Miles, D.; Bronk Ramsey, C. Summer Precipitation for the England and Wales Region, 1201–2000 CE, from Stable Oxygen Isotopes in Oak Tree Rings. J. Quat. Sci. 2020, 35, 731–736. [Google Scholar] [CrossRef]
  4. Cherubini, P.; Battipaglia, G.; Innes, J.L. Tree vitality and forest health: Can tree-ring stable isotopes be used as indicators? Curr. For. Rep. 2021, 7, 69–80. [Google Scholar]
  5. McCarroll, D.; Loader, N.J. Stable isotopes in tree rings. Quat. Sci. Rev. 2004, 23, 771–801. [Google Scholar] [CrossRef]
  6. Grießinger, J.; Bräuning, A.; Helle, G.; Schleser, G.H.; Hochreuther, P.; Meier, W.J.-H.; Zhu, H. A Dual Stable Isotope Approach Unravels Common Climate Signals and Species-Specific Responses to Environmental Change Stored in Multi-Century Tree-Ring Series from the Tibetan Plateau. Geosciences 2019, 9, 151. [Google Scholar] [CrossRef] [Green Version]
  7. Lehmann, M.M.; Vitali, V.; Schuler, P.; Leuenberger, M.; Saurer, M. More than Climate: Hydrogen Isotope Ratios in Tree Rings as Novel Plant Physiological Indicator for Stress Conditions. Dendrochronologia 2021, 65, 125788. [Google Scholar] [CrossRef]
  8. Xu, G.; Liu, X.; Qin, D.; Chen, T.; Sun, W.; An, W.; Wang, W.; Wu, G.; Zeng, X.; Ren, J. Drought History Inferred from Tree Ring δ13C and δ18O in the Central Tianshan Mountains of China and Linkage with the North Atlantic Oscillation. Theor. Appl. Climatol. 2014, 116, 385–401. [Google Scholar] [CrossRef]
  9. Esper, J.; Frank, D.C.; Battipaglia, G.; Büntgen, U.; Holert, C.; Treydte, K.; Siegwolf, R.; Saurer, M. Low-Frequency Noise in δ13 C and δ18O Tree Ring Data: A Case Study of Pinus Uncinata in the Spanish Pyrenees: Noise in δ13C and δ18O data. Global Biogeochem. Cycles 2010, 24, 1–11. [Google Scholar] [CrossRef] [Green Version]
  10. Helama, S.; Arppe, L.; Timonen, M.; Mielikäinen, K.; Oinonen, M. Age-Related Trends in Subfossil Tree-Ring Δ13C Data. Chem. Geol. 2015, 416, 28–35. [Google Scholar] [CrossRef]
  11. Xu, G.; Wu, G.; Liu, X.; Chen, T.; Wang, B.; Hudson, A.; Trouet, V. Age-Related Climate Response of Tree-Ring Δ13C and Δ18O from Spruce in Northwestern China, with Implications for Relative Humidity Reconstructions. J. Geophys. Res. Biogeosci. 2020, 125, e2019JG005513. [Google Scholar] [CrossRef]
  12. Duffy, J.E.; McCarroll, D.; Loader, N.J.; Young, G.H.; Davies, D.; Miles, D.; Bronk Ramsey, C. Absence of Age-Related Trends in Stable Oxygen Isotope Ratios from Oak Tree Rings. Glob. Biogeochem. Cycles 2019, 33, 841–848. [Google Scholar] [CrossRef] [Green Version]
  13. Szejner, P.; Clute, T.; Anderson, E.; Evans, M.N.; Hu, J. Reduction in Lumen Area Is Associated with the Δ18O Exchange between Sugars and Source Water during Cellulose Synthesis. New Phytol. 2020, 226, 1583–1593. [Google Scholar] [CrossRef]
  14. Arosio, T.; Ziehmer, M.M.; Nicolussi, K.; Schlüchter, C.; Leuenberger, M. Alpine Holocene Tree-Ring Dataset: Age-Related Trends in the Stable Isotopes of Cellulose Show Species-Specific Patterns. Biogeosciences 2020, 17, 4871–4882. [Google Scholar] [CrossRef]
  15. Roden, J.S.; Lin, G.; Ehleringer, J.R. A Mechanistic Model for Interpretation of Hydrogen and Oxygen Isotope Ratios in Tree-Ring Cellulose. Geochim. Cosmochim. Acta 2000, 64, 21–35. [Google Scholar] [CrossRef]
  16. Sidorova, O.V.; Saurer, M.; Guillet, S.; Corona, C.; Fonti, P.; Myglan, V.S.; Kirdyanov, A.V.; Naumova, O.V.; Ovchinnikov, D.V.; Shashkin, A.V. Siberian Tree-Ring and Stable Isotope Proxies as Indicators of Temperature and Moisture Changes after Major Stratospheric Volcanic Eruptions. Clim. Past 2019, 15, 685–700. [Google Scholar]
  17. Deshpande, A.G.; Boutton, T.W.; Hyodo, A.; Lafon, C.W.; Moore, G.W. Bottomland Hardwood Forest Growth and Stress Response to Hydroclimatic Variation: Evidence from Dendrochronology and Tree Ring Δ13C Values. Biogeosciences 2020, 17, 5639–5653. [Google Scholar] [CrossRef]
  18. Shestakova, T.A.; Voltas, J.; Saurer, M.; Berninger, F.; Esper, J.; Andreu-Hayles, L.; Daux, V.; Helle, G.; Leuenberger, M.; Loader, N.J. Spatio-Temporal Patterns of Tree Growth as Related to Carbon Isotope Fractionation in European Forests under Changing Climate. Glob. Ecol. Biogeogr. 2019, 28, 1295–1309. [Google Scholar] [CrossRef]
  19. Shestakova, T.A.; Camarero, J.J.; Ferrio, J.P.; Knorre, A.A.; Gutiérrez, E.; Voltas, J. Increasing Drought Effects on Five European Pines Modulate Δ13C-Growth Coupling along a Mediterranean Altitudinal Gradient. Funct. Ecol. 2017, 31, 1359–1370. [Google Scholar] [CrossRef] [Green Version]
  20. Nakatsuka, T.; Sano, M.; Li, Z.; Xu, C.; Tsushima, A.; Shigeoka, Y.; Sho, K.; Ohnishi, K.; Sakamoto, M.; Ozaki, H. A 2600-Year Summer Climate Reconstruction in Central Japan by Integrating Tree-Ring Stable Oxygen and Hydrogen Isotopes. Clim. Past 2020, 16, 2153–2172. [Google Scholar] [CrossRef]
  21. Hafner, P.; Robertson, I.; McCarroll, D.; Loader, N.J.; Gagen, M.; Bale, R.J.; Jungner, H.; Sonninen, E.; Hilasvuori, E.; Levanič, T. Climate Signals in the Ring Widths and Stable Carbon, Hydrogen and Oxygen Isotopic Composition of Larix Decidua Growing at the Forest Limit in the Southeastern European Alps. Trees 2011, 25, 1141–1154. [Google Scholar] [CrossRef]
  22. Kirdyanov, A.V.; Vaganov, E.A.; Hughes, M.K. Separating the Climatic Signal from Tree-Ring Width and Maximum Latewood Density Records. Trees 2007, 21, 37–44. [Google Scholar] [CrossRef]
  23. Schollaen, K.; Heinrich, I.; Neuwirth, B.; Krusic, P.J.; D’Arrigo, R.D.; Karyanto, O.; Helle, G. Multiple Tree-Ring Chronologies (Ring Width, Δ13C and Δ18O) Reveal Dry and Rainy Season Signals of Rainfall in Indonesia. Quat. Sci. Rev. 2013, 73, 170–181. [Google Scholar] [CrossRef] [Green Version]
  24. Weigl, M.; Grabner, M.; Helle, G.; Schleser, G.H.; Wimmer, R. Variability of Latewood-Widths and-Stable Isotope Ratios in a Sessile Oak Tree (Quercus Petraea (Matt.) Liebl.). Dendrochronologia 2007, 24, 117–122. [Google Scholar] [CrossRef]
  25. Sidorova, O.V.; Siegwolf, R.T.; Saurer, M.; Naurzbaev, M.M.; Shashkin, A.V.; Vaganov, E.A. Spatial Patterns of Climatic Changes in the Eurasian North Reflected in Siberian Larch Tree-Ring Parameters and Stable Isotopes. Glob. Chang. Biol. 2010, 16, 1003–1018. [Google Scholar] [CrossRef] [Green Version]
  26. Nicolussi, K.; Kaufmann, M.; Melvin, T.M.; Van Der Plicht, J.; Schießling, P.; Thurner, A. A 9111 Year Long Conifer Tree-Ring Chronology for the European Alps: A Base for Environmental and Climatic Investigations. Holocene 2009, 19, 909–920. [Google Scholar] [CrossRef] [Green Version]
  27. Nicolussi, K.; Bortenschlager, S.; Körner, C. Increase in Tree-Ring Width in Subalpine Pinus Cembra from the Central Alps That May Be CO2-Related. Trees 1995, 9, 181–189. [Google Scholar] [CrossRef]
  28. Ziehmer, M.M.; Nicolussi, K.; Schlüchter, C.; Leuenberger, M. Preliminary Evaluation of the Potential of Tree-Ring Cellulose Content as a Novel Supplementary Proxy in Dendroclimatology. Biogeosciences 2018, 15, 1047–1064. [Google Scholar] [CrossRef] [Green Version]
  29. Boettger, T.; Haupt, M.; Knöller, K.; Weise, S.M.; Waterhouse, J.S.; Rinne, K.T.; Loader, N.J.; Sonninen, E.; Jungner, H.; Masson-Delmotte, V. Wood Cellulose Preparation Methods and Mass Spectrometric Analyses of Δ13C, Δ18O, and Nonexchangeable Δ2H Values in Cellulose, Sugar, and Starch: An Interlaboratory Comparison. Anal. Chem. 2007, 79, 4603–4612. [Google Scholar] [CrossRef]
  30. Filot, M.S.; Leuenberger, M.; Pazdur, A.; Boettger, T. Rapid Online Equilibration Method to Determine the D/H Ratios of Non-Exchangeable Hydrogen in Cellulose. Rapid Commun. Mass Spectrom. Int. J. Devoted Rapid Dissem. Up Minute Res. Mass Spectrom. 2006, 20, 3337–3344. [Google Scholar] [CrossRef]
  31. Loader, N.J.; Street-Perrott, F.A.; Daley, T.J.; Hughes, P.D.M.; Kimak, A.; Levanic, T.; Mallon, G.; Mauquoy, D.; Robertson, I.; Roland, T.P. Simultaneous Determination of Stable Carbon, Oxygen, and Hydrogen Isotopes in Cellulose. Anal. Chem. 2015, 87, 376–380. [Google Scholar] [CrossRef]
  32. Leuenberger, M. To What Extent Can Ice Core Data Contribute to the Understanding of Plant Ecological Developments of the Past? Terr. Ecol. 2007, 1, 211–233. [Google Scholar]
  33. Coplen, T.B. Reporting of Stable Hydrogen, Carbon, and Oxygen Isotopic Abundances (Technical Report). Pure Appl. Chem. 1994, 66, 273–276. [Google Scholar] [CrossRef]
  34. Bunn, A.G. A Dendrochronology Program Library in R (DplR). Dendrochronologia 2008, 26, 115–124. [Google Scholar] [CrossRef]
  35. Zar, J.H. Significance Testing of the Spearman Rank Correlation Coefficient. J. Am. Stat. Assoc. 1972, 67, 578–580. [Google Scholar] [CrossRef]
  36. Wickham, H.; Averick, M.; Bryan, J.; Chang, W.; McGowan, L.D.; François, R.; Grolemund, G.; Hayes, A.; Henry, L.; Hester, J. Welcome to the Tidyverse. J. Open Source Softw. 2019, 4, 1686. [Google Scholar] [CrossRef]
  37. Arosio, T.; Ziehmer-Wenz, M.M.; Nicolussi, K.; Schlüchter, C.; Leuenberger, M. Larch Cellulose Shows Significantly Depleted Hydrogen Isotope Values with Respect to Evergreen Conifers in Contrast to Oxygen and Carbon Isotopes. Front. Earth Sci. 2020, 8, 579. [Google Scholar] [CrossRef]
  38. Li, M.; Zhu, J.; Zhang, M. Foliar Carbon Isotope Discrimination and Related Traits along Light Gradients in Two Different Functional-Type Tree Species. Eur. J. For. Res. 2013, 132, 815–824. [Google Scholar] [CrossRef]
  39. Rossi, S.; Deslauriers, A.; Anfodillo, T.; Carrer, M. Age-Dependent Xylogenesis in Timberline Conifers. New Phytol. 2008, 177, 199–208. [Google Scholar] [CrossRef]
  40. Bräker, O.-U. Der Alterstrend Bei Jahrringdichten Und Jahrringbreiten von Nadelhoebyzern und Sein Ausgleich; Mitteilungen der Forstlichen Bundesversuchsanstalt: Vienna, Austria, 1981. [Google Scholar]
  41. Farquhar, G.D.; Lloyd, J. Carbon and oxygen isotope effects in the exchange of carbon dioxide between terrestrial plants and the atmosphere. In Stable Isotopes and Plant Carbon-Water Relations; Elsevier: Amsterdam, The Netherlands, 1993; pp. 47–70. [Google Scholar]
  42. Sternberg, L.D.S.L.O. Oxygen Stable Isotope Ratios of Tree-Ring Cellulose: The next Phase of Understanding. New Phytol. 2009, 181, 553–562. [Google Scholar] [CrossRef]
  43. Tranquillini, W. Climatic resistance and damage of trees at timberline. In Physiological Ecology of the Alpine Timberline; Springer: Berlin/Heidelberg, Germany, 1979; pp. 91–111. [Google Scholar]
  44. Gagen, M.; McCarroll, D.; Edouard, J.-L. Combining Ring Width, Density and Stable Carbon Isotope Proxies to Enhance the Climate Signal in Tree-Rings: An Example from the Southern French Alps. Clim. Chang. 2006, 78, 363–379. [Google Scholar] [CrossRef]
  45. Treydte, K.; Schleser, G.H.; Schweingruber, F.H.; Winiger, M. The Climatic Significance of δ13C in Subalpine Spruces (Lötschental, Swiss Alps): A Case Study with Respect to Altitude, Exposure and Soil Moisture. Tellus B Chem. Phys. Meteorol. 2001, 53, 593–611. [Google Scholar] [CrossRef]
  46. Gessler, A.; Ferrio, J.P.; Hommel, R.; Treydte, K.; Werner, R.A.; Monson, R.K. Stable Isotopes in Tree Rings: Towards a Mechanistic Understanding of Isotope Fractionation and Mixing Processes from the Leaves to the Wood. Tree Physiol. 2014, 34, 796–818. [Google Scholar] [CrossRef] [PubMed] [Green Version]
  47. Kimak, A.; Kern, Z.; Leuenberger, M. Qualitative Distinction of Autotrophic and Heterotrophic Processes at the Leaf Level by Means of Triple Stable Isotope (C–O–H) Patterns. Front. Plant Sci. 2015, 6, 1008. [Google Scholar] [CrossRef] [PubMed] [Green Version]
  48. Tcherkez, G.; Mahé, A.; Hodges, M. 12C/13C Fractionations in Plant Primary Metabolism. Trends Plant Sci. 2011, 16, 499–506. [Google Scholar] [CrossRef] [PubMed]
  49. Cormier, M.-A.; Werner, R.A.; Leuenberger, M.C.; Kahmen, A. 2 H-Enrichment of Cellulose and n-Alkanes in Heterotrophic Plants. Oecologia 2019, 189, 365–373. [Google Scholar] [CrossRef] [PubMed]
Figure 1. Map showing the localization of the tree collection sites. The sites are in the Swiss, the Austrian and the Italian alps (©Google Maps 2021): The information on each site are presented in Table 1. In green the site with only cembran pine (Pinus cembra L.), in red the site with only larch (Larix decidua Mill.), in blue with both species.
Forests 12 01523 g001
Figure 2. Correlations between TRW and stable isotopes. The correlation values were calculated using the Spearman method in each age class (1–25, 26–50, 51–75, 76–100, 101–200, 201–300, >300 years) and with the total data of each species (blue box). Larch values are red and those of cembran pine are turquoise. The correlation r values are displayed as histograms. The symbol “ns” on the column indicates that the correlation is non-significant (p-value > 0.05). The upper plots titled ND show the correlations between the non-detrended values of isotopes and TRW (ac), below are the LD plots that show the correlations between the TRW and the isotopes values that underwent linear detrending (df). Then, the SD plots showing the correlations of the TRW and isotope values detrended with a spline function are shown (gi). The lowest FD plots show the correlations between the TRW and isotope values after first-difference time-series detrending (panels jl).
Forests 12 01523 g002
Figure 3. Correlations between the stable isotopes. The correlations were calculated using the Spearman method in larch (red) and cembran pine (turquoise) in each age class (1–25, 26–50, 51–75, 76–100, 101–200, 201–300, >300 years) and also with the total data of each species (blue box). Correlation r values are displayed as histograms and “ns” on the column indicates non-significant correlation (p-value > 0.05). The values of larch trees are in red, those of cembran pine are in turquoise. The plots are presented in the same order of Figure 2. The upper ND shows the correlations of non-detrended values (ac), the LD below are those of linear detrended values (df), then are the SD plots of spline detrended (gi), and the lowest FD plots are those after first-difference time-series detrending (jl).
Forests 12 01523 g003
Table 1. Number of trees and wood samples. Trees and wood samples analyzed for each age class and in total. TRW and the three cellulose isotopes were measured in all samples. PICE (Pinus cembra L.), LADE (Larix decidua Mill.).
N SamplesN Trees
Age ClassPICELADEPICELADE
1–25124783525
26–502251715440
51–753232307050
76–1003342647357
101–200132910488568
201–3008967766857
>3008018303334
total4133347110884
Publisher’s Note: MDPI stays neutral with regard to jurisdictional claims in published maps and institutional affiliations.

