Article

Cellular and Metabolite Changes in the Secondary Phloem of Chinese Fir (Cuninghamia lanceolata (Lamb.) Hook.) during Dormancy Release

Department of Wood Science and Engineering, College of Materials Science and Engineering, Nanjing Forestry University, Nanjing 210037, China
*
Author to whom correspondence should be addressed.
Forests 2021, 12(11), 1552; https://doi.org/10.3390/f12111552
Submission received: 29 September 2021 / Revised: 8 November 2021 / Accepted: 9 November 2021 / Published: 10 November 2021
(This article belongs to the Section Forest Ecophysiology and Biology)

Abstract

:
Wood in the cold temperate zone is the product of the alternation of the growing season and the dormant period of trees, but our knowledge of the process of dormancy release in trees remains limited. Chinese fir (Cuninghamia lanceolata (Lamb.) Hook.) was used to investigate cellular and metabolite changes in the secondary phloem tissue during dormancy release. The sampling dates were 2 March, 28 March, and 13 April. The microsections of wood-forming tissue were prepared using the paraffin embedding technique to observe the formation of cambium cells; metabolites in secondary phloem cells were extracted using a methanol/chloroform organic solvent system. The results showed that the secondary phloem consists of phloem fibers, sieve cells and phloem parenchyma. The cells were regularly arranged in continuous tangential bands and were in the order of Phloem fiber-Sieve cell-Phloem parenchyma-Sieve cell-Phloem parenchyma-Sieve cell-Phloem parenchyma-Sieve cell-Sieve cell-Phloem parenchyma-. The Chinese fir cambium was in dormancy on 2 March and 28 March, while on 13 April, it was already in the active stage and two layers of xylem cells with several layers of phloem cells were newly formed. The width of the cambium zone increased from 18.7 ± 5.7 μm to 76.5 ± 3.0 μm and the average radial diameter of sieve cells expanded from 15.4 ± 7.5 μm to 21.5 ± 7.4 μm after dormancy release. The cambium zone width and the average radial diameter of sieve cells before and after dormancy release were significantly different (p < 0.01). The phloem parenchyma cells without resin were squeezed and deformed by the sieve cells, and the width of the phloem during the active period was 197.0 ± 8.5 μm, which was larger than that during the dormant period. Ultra-performance liquid chromatography-tandem mass spectrometry (UPLC-MS/MS)-based metabolomics was employed to analyze the secondary phloem of Chinese fir on 28 March and 13 April. Thirty-nine differential metabolites during dormancy release were detected. The results showed that the composition of Chinese fir metabolites was different before and after dormancy release. The relative increase in pyruvic acid and ascorbic acid contents proved that the rate of energy metabolism in Chinese fir increased substantially after dormancy release. Changes in cell development and the composition of metabolites revealed that the dormancy release of Chinese fir was at early April and the formation period of phloem tissue is earlier than xylem tissue.

1. Introduction

In contrast to animals, trees cannot migrate to a favorable environment when they are under stress or invasion but must adapt to the habitat in which they live. This adaptation occurs at the cell physiological level and requires plastic development designed by genetic programming [1]. For example, wood cells respond to the changing seasons of spring, summer, autumn, and winter by alternating earlywood and latewood. With the advent of winter, the duration of sunshine gradually decreases, and the temperature drops; thus, the environment is not suitable for the growth and development of trees, and tree metabolism gradually weakens and enters dormancy. Trees come to life from the dormancy stage in spring, resume a series of life activities, and new wood cells divide.
Vascular cambium is the secondary meristematic tissue between the xylem and phloem of trees with the ability to divide periodically [2]. Vascular cambium consists of fusiform initials and ray initials and produces secondary xylem and secondary phloem inwards and outwards, respectively [3]. Cambium activity is periodic in the cold temperate zone and cambium dormancy and activity are influenced by a variety of factors, such as temperature [4], photoperiod [5], and moisture [6]. The periodic activities of cambium are often accompanied by changes in various morphological and physiological characteristics. Therefore, cambium activity can be studied by observing the changes in anatomical characteristics.
Intermediary metabolites are substances produced or consumed through metabolic processes, excluding biomacromolecules, whose precursors and degradation products are true metabolites. Metabolites that are directly related to life activities, such as carbohydrates, proteins, and fat, are called primary metabolites, while secondary metabolites are compounds derived from organic substances, such as flavonoids, phenols, and nitrogen compounds [7]. A large number of secondary metabolites are found in plants and are closely related to their phenotype. Some scholars have conducted relevant research on metabolites in trees. Morris et al. counted the metabolites in wood-forming tissues of different genotypes of loblolly pine (Pinus taeda) and discovered a close relationship between the metabolites and cellulose content [8]. Abreu et al. performed a high spatial resolution metabolomics study of the wood-forming zone of Populus tremula and determined that metabolites within the wood-forming zone have specific patterns, following the differentiation process from cell division to cell death [9]. However, there is limited knowledge of the changes in metabolites during dormancy release in trees. Studying the difference in the composition and content of secondary metabolites between the xylem and secondary phloem from dormancy to recovery of activities in early spring provides a theoretical basis for revealing the growth rhythm of tree cambium.

2. Materials and Methods

2.1. Tree and Sample Collection

Samples were obtained from seven Chinese fir trees (age, approximately 20 years; height, approximately 15–17 m; average diameter of the stems at breast height, 33 cm). These trees were growing in the “Bei Da Shan” forest farm of the Nanjing Forestry University in Nanjing, China (32°04′N, 118°49′E). The seven trees were tagged for following sampling, and we selected 2 March 2019, 28 March 2019, and 13 April 2019 as the sampling dates. The average temperature during the previous 15 days before sampling were 5.5 °C, 13.2 °C and 15.6 °C, respectively. The temperature data were obtained from the Internet (https://weather.cma.cn/, accessed on 13 April 2019). Samples were obtained in the morning, between 9 a.m. and 11 a.m. A height of 100 cm above the ground was the first sampling position, and the spiral sampling method was used to determine the subsequent sampling position. The latter sampling position was 10 cm above the 45° slope of the previous position. We used the “Hui” shape sampling method [10]. The bark was cut to the xylem with a utility knife, and a horizontal double line was drawn on the top and bottom half of the target area. A vertical double line was drawn on the left and right sides, the surrounding bark was peeled, and the exposed xylem formed a “Hui” shape. A hammer and chisel were used to remove the whole pieces of tissue that the xylem and bark were closely connected to, the tissues were wrapped in tinfoil, packed in liquid nitrogen, and taken back to the laboratory for storage at −80 °C. An appropriate amount of frozen immature phloem tissue was placed in a pre-cooled mortar and fully ground in liquid nitrogen to keep the tissues in a frozen state during grinding. The ground tissue was stored at −80 °C as the test sample. A portion of the sample was stored in formaldehyde-acetic acid-ethanol (90 mL of 70% ethanol, 5 mL of 35% formaldehyde solution, and 5 mL of glacial acetic acid mixed evenly) to prepare the microsections.

2.2. Anatomical Observations

The intact wood blocks (xylem and bark are closely connected) were removed from the formaldehyde-acetic acid-ethanol fixative, rinsed in distilled water, and soaked in 70% ethanol overnight. The samples were trimmed to embedding size and then dehydrated through an ethanol gradient (70%, 85%, and 100%) for 3 h each. The following procedures were performed in sequence: Anhydrous ethanol: n-butanol = 1:1 for 3 h; absolute n-butanol for 3 h to transparency; paraffin wax: n-butanol = 1:2 at 80 °C for 6 h; paraffin wax: n-butanol = 2:1 at 80 °C for 6 h, and paraffin wax at 80 °C for 6 h. The embedded samples were prepared for slicing [11]. Tissue sections were cut to 11 μm thickness using a sliding microtome and soaked in xylene for 20 min to remove the paraffin wax. This process was repeated three times. The sections were rehydrated by soaking them in a solution of xylene: ethanol = 1:1, followed by 100%, 85%, 70%, 50%, and 30% ethanol for 10 min each, respectively. The sections were soaked in distilled water for 10 min to return the water content to 100%, and then stained with 1% Safranin O solution for 10 min. The sections were soaked in 30% ethanol for 10 min to wash off the unfixed dyes and then stained with 0.5% Alcian Blue solution for 2 min followed by a wash in distilled water. The sections were mounted in glycerin [12], observed, and photographed using an Olympus BX51 optical microscope (Tokyo, Japan).

2.3. Extraction of Metabolites

Methanol and chloroform were precooled at −20 °C and double-distilled water was chilled to 4 °C before the experiment. A 50 mg aliquot of the frozen powder sample mix was added to a 1.5 mL Eppendorf tube and labeled, after which 1000 μL of methanol was added to each tube and shaken for 10 s. Then 45 μL of ribitol solution with a mass concentration of 2 mg·mL−1 was added as an internal standard to the tubes and shaken for 10 s. The tubes were placed in a thermomixer and incubated for 15 min at 70 °C with 800 r·min−1 shaking. The tubes were centrifuged at 12,000 r·min−1 for 10 min at room temperature. A 500 μL aliquot of the supernatant was added to a new Eppendorf tube and labeled. A 500 μL aliquot of chloroform (precooled at −20 °C) was added to the new tube and incubated in a thermomixer for 10 min at 37 °C with 800 r·min−1 shaking. To this mixture was added 500 μL of double-distilled water (precooled at 4 °C), followed by a 15-s incubation at 37 °C with 950 r·min−1 shaking. The tubes were centrifuged at 400 r·min−1 for 15 min at room temperature. A 200 μL aliquot of the supernatant (polar phase: Methanol/water) was added to a new Eppendorf tube and labeled. An extra copy was reserved, and all samples were stored at −20 °C for processing.
Derivatization process: 200 μL of the supernatant was frozen in liquid nitrogen, then placed in an Eyela FDU-2110 freeze dryer (Bohemia, NY, USA) and dried under vacuum at −60 °C for 4 h until the solution was completely dried. Solution A (50 μL; methoxyamine hydrochloride dissolved in pyridine at a mass concentration of 20 mg·mL−1) was added to the tube and incubated for 2 h at 37 °C with 800 r·min−1 shaking. Solution B (80 μL; alkanes dissolved in MSTFA at 20 μL·mL−1) was added and incubated with shaking for 30 min under the same conditions. The tubes were allowed to stand overnight at room temperature for testing.

2.4. Ultra-High Performance Liquid Chromatography (UHPLC)

A Vanquish UHPLC system coupled to a Thermo Scientific Q Extractive plus HRMS (Thermo Fisher Scientific, Bremen, Germany) equipped with a heated electrospray (HESI II) source was used to analyze the metabolites and obtain accurate mass measurements. Reverse phase liquid chromatography (RPLC) was performed with the ACQUITY UPLC HSS T3 column (100 × 2.1 mm, 1.8 μm, Waters Corp., Milford, MA, USA) at a temperature of 40 °C. Water and acetonitrile, both containing 0.1% formic acid, were used as mobile phases A and B, respectively. The linear gradient was 5–100% B at 0.4 mL·min−1. The injection volume was 5 μL. High-resolution mass spectra were acquired in positive and negative ionization mode for RPLC and hydrophilic interaction chromatography, respectively. Full scan mass spectra were acquired from 90 to 1300 m·z−1 in profile mode, and data-dependent tandem mass spectrometry (MS/MS) experiments were performed during the whole sequence in the “Top5” data-dependent mode.

2.5. Statistical Analysis

Database matching of different metabolites was conducted using Progenesis QI (Waters Corp.) and the HMDB-serum (contains information on more than 4500 basal metabolites, including substances related to carbohydrate metabolism, amino acid metabolism, and nucleotide metabolism), LIPID MAPS (contains information on more than 35,000 lipid substances, as well as lipid-soluble organic matter from plants, fungi, and bacteria), and the METLINTM MS/MS Library databases (contains information on more than 240,000 metabolites: ~13,900 MS/MS, ~220,000 in silico MS/MS data). Partial data analyses were performed using SPSS software (SPSS Statistics 20.0, IBM, New York, NY, USA). Significant differences among dates were tested with analysis of variance (ANOVA). Duncan’s Multiple Range Test was applied to identify specific differences between dates.

3. Results and Discussion

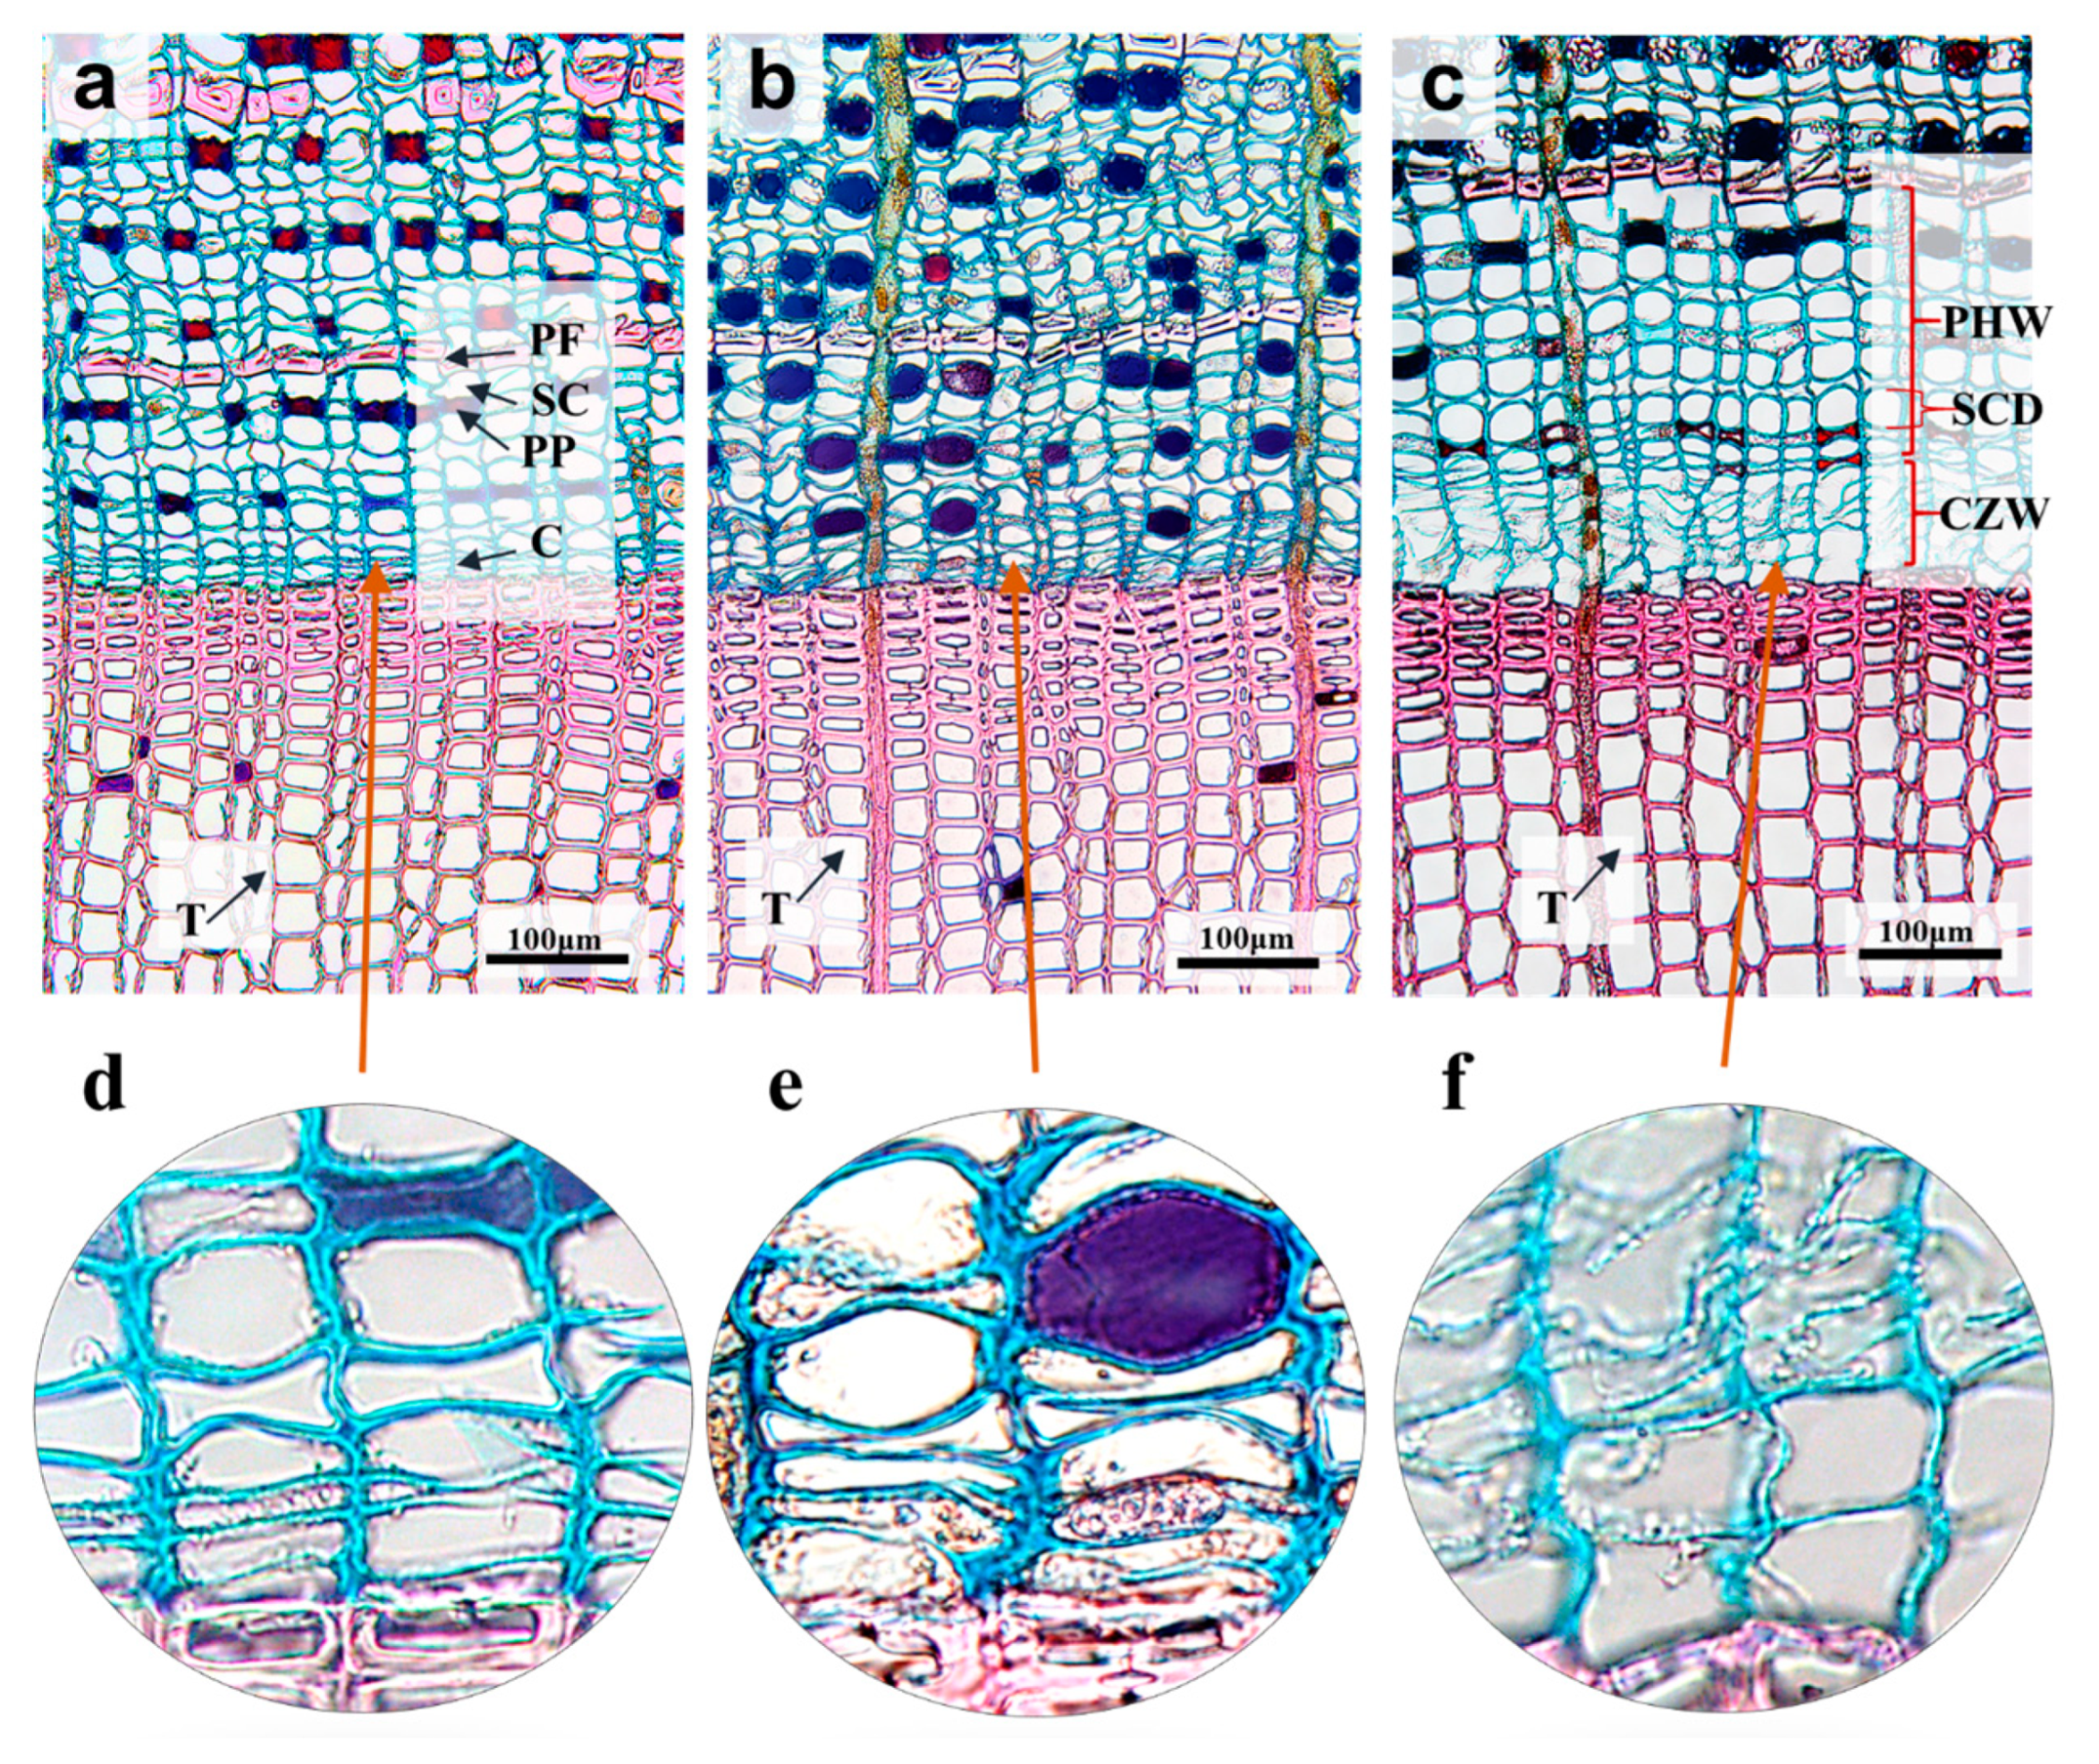
3.1. Cell Structural Characteristics

Figure 1a–c are cross-sectional micrographs of Chinese fir secondary tissue sampled on 2 March, 28 March, and 13 April, respectively, while d–f are local enlargements thereof. The figures showed that the secondary phloem consists of phloem fibers, sieve cells and phloem parenchyma. The cells were regularly arranged in continuous tangential bands and were in the order of Phloem fiber-Sieve cell-Phloem parenchyma-Sieve cell-Phloem parenchyma-Sieve cell-Phloem parenchyma-Sieve cell-Sieve cell-Phloem parenchyma- (“PF-SC-PP-SC-PP-SC-PP-SC-SC-PP-”). (Figure 1a–c). The cambium of Chinese fir was still dormant on 2 March and there were 2–3 layers of cambium cells. The cell wall was thick and no divisions were observed. The edge cells in the cambium zone were elliptical, while the cambial initial was strip shipped or invaginated in the middle of the cambium zone (Figure 1d). There were no newly formed xylem cells observed in the sections from 28 March (Figure 1e). We observed the new formation of two layers of xylem cells and several layers of phloem cells in the sections sampled on 13 April (Figure 1f). In addition, the cell wall of the cambium zone was significantly thinner. Cambium activity ceases and enters dormancy in autumn and winter. Dormancy consists of “rest” and “quiescent” stages [13]. During the resting stage, the cambium cells cannot divide even under suitable conditions of temperature, moisture, light, and hormones [14,15]. The cambium can only divide when exposed to the appropriate environmental conditions during the quiescent stage [16]. The production of new xylem cells indicated the end of the resting stage so that the Chinese fir forming tissue in this experiment was already in the active stage on April 13. Combined with the forming tissue observed on 28 March, we speculate that dormancy release occurred in early April.
The shape of the sieve cells on the inside and outside of the phloem fibrous zone closest to the cambium was quite different in the 13 April section. The sieve cells on the outside were elliptical or invaginated, while they were round or expanded on the inside (Figure 1c). This observation indicates that the inside sieve cells were more active and capable of translocating photosynthates. We determined the width of the cambium zone, the width of the phloem (PHW), and the radial diameter of the sieve cells three times (2 March, 28 March, and 13 April), as shown in Table 1. No significant differences (p > 0.05) in PHW, cambium zone width, or radial diameter of sieve cells were observed between 2 March and 28 March. On 13 April, the cambium was dividing into new xylem cells and the width of the cambium zone was 76.5 ± 3.0 μm, which was three to four times that of 2 March and 28 March. The PHW was 197.0 ± 8.5 μm, which was significantly larger than 124.1 ± 13.5 μm on 2 March and 138.9 ± 6.9 μm on 28 March.
The radial diameters of Chinese fir sieve cells on 2 March and 28 March were 16.0 ± 7.9 μm and 15.4 ± 7.5 μm, respectively, during the dormant period and expanded to 21.5 ± 7.4 μm after dormancy release. The radial diameter of the sieve cells was significantly different (p < 0.01) before and after dormancy release. The sieve cells are the main channel for gymnosperms to transport organic nutrients necessary for growth and development [17]. The cambium requires a large amount of material and energy during the active period, which makes the sieve cells expand, and the phloem parenchymal cells without resin are squeezed and deformed by the sieve cells. As a result, the PHW during the active period was larger than that during the dormant period.

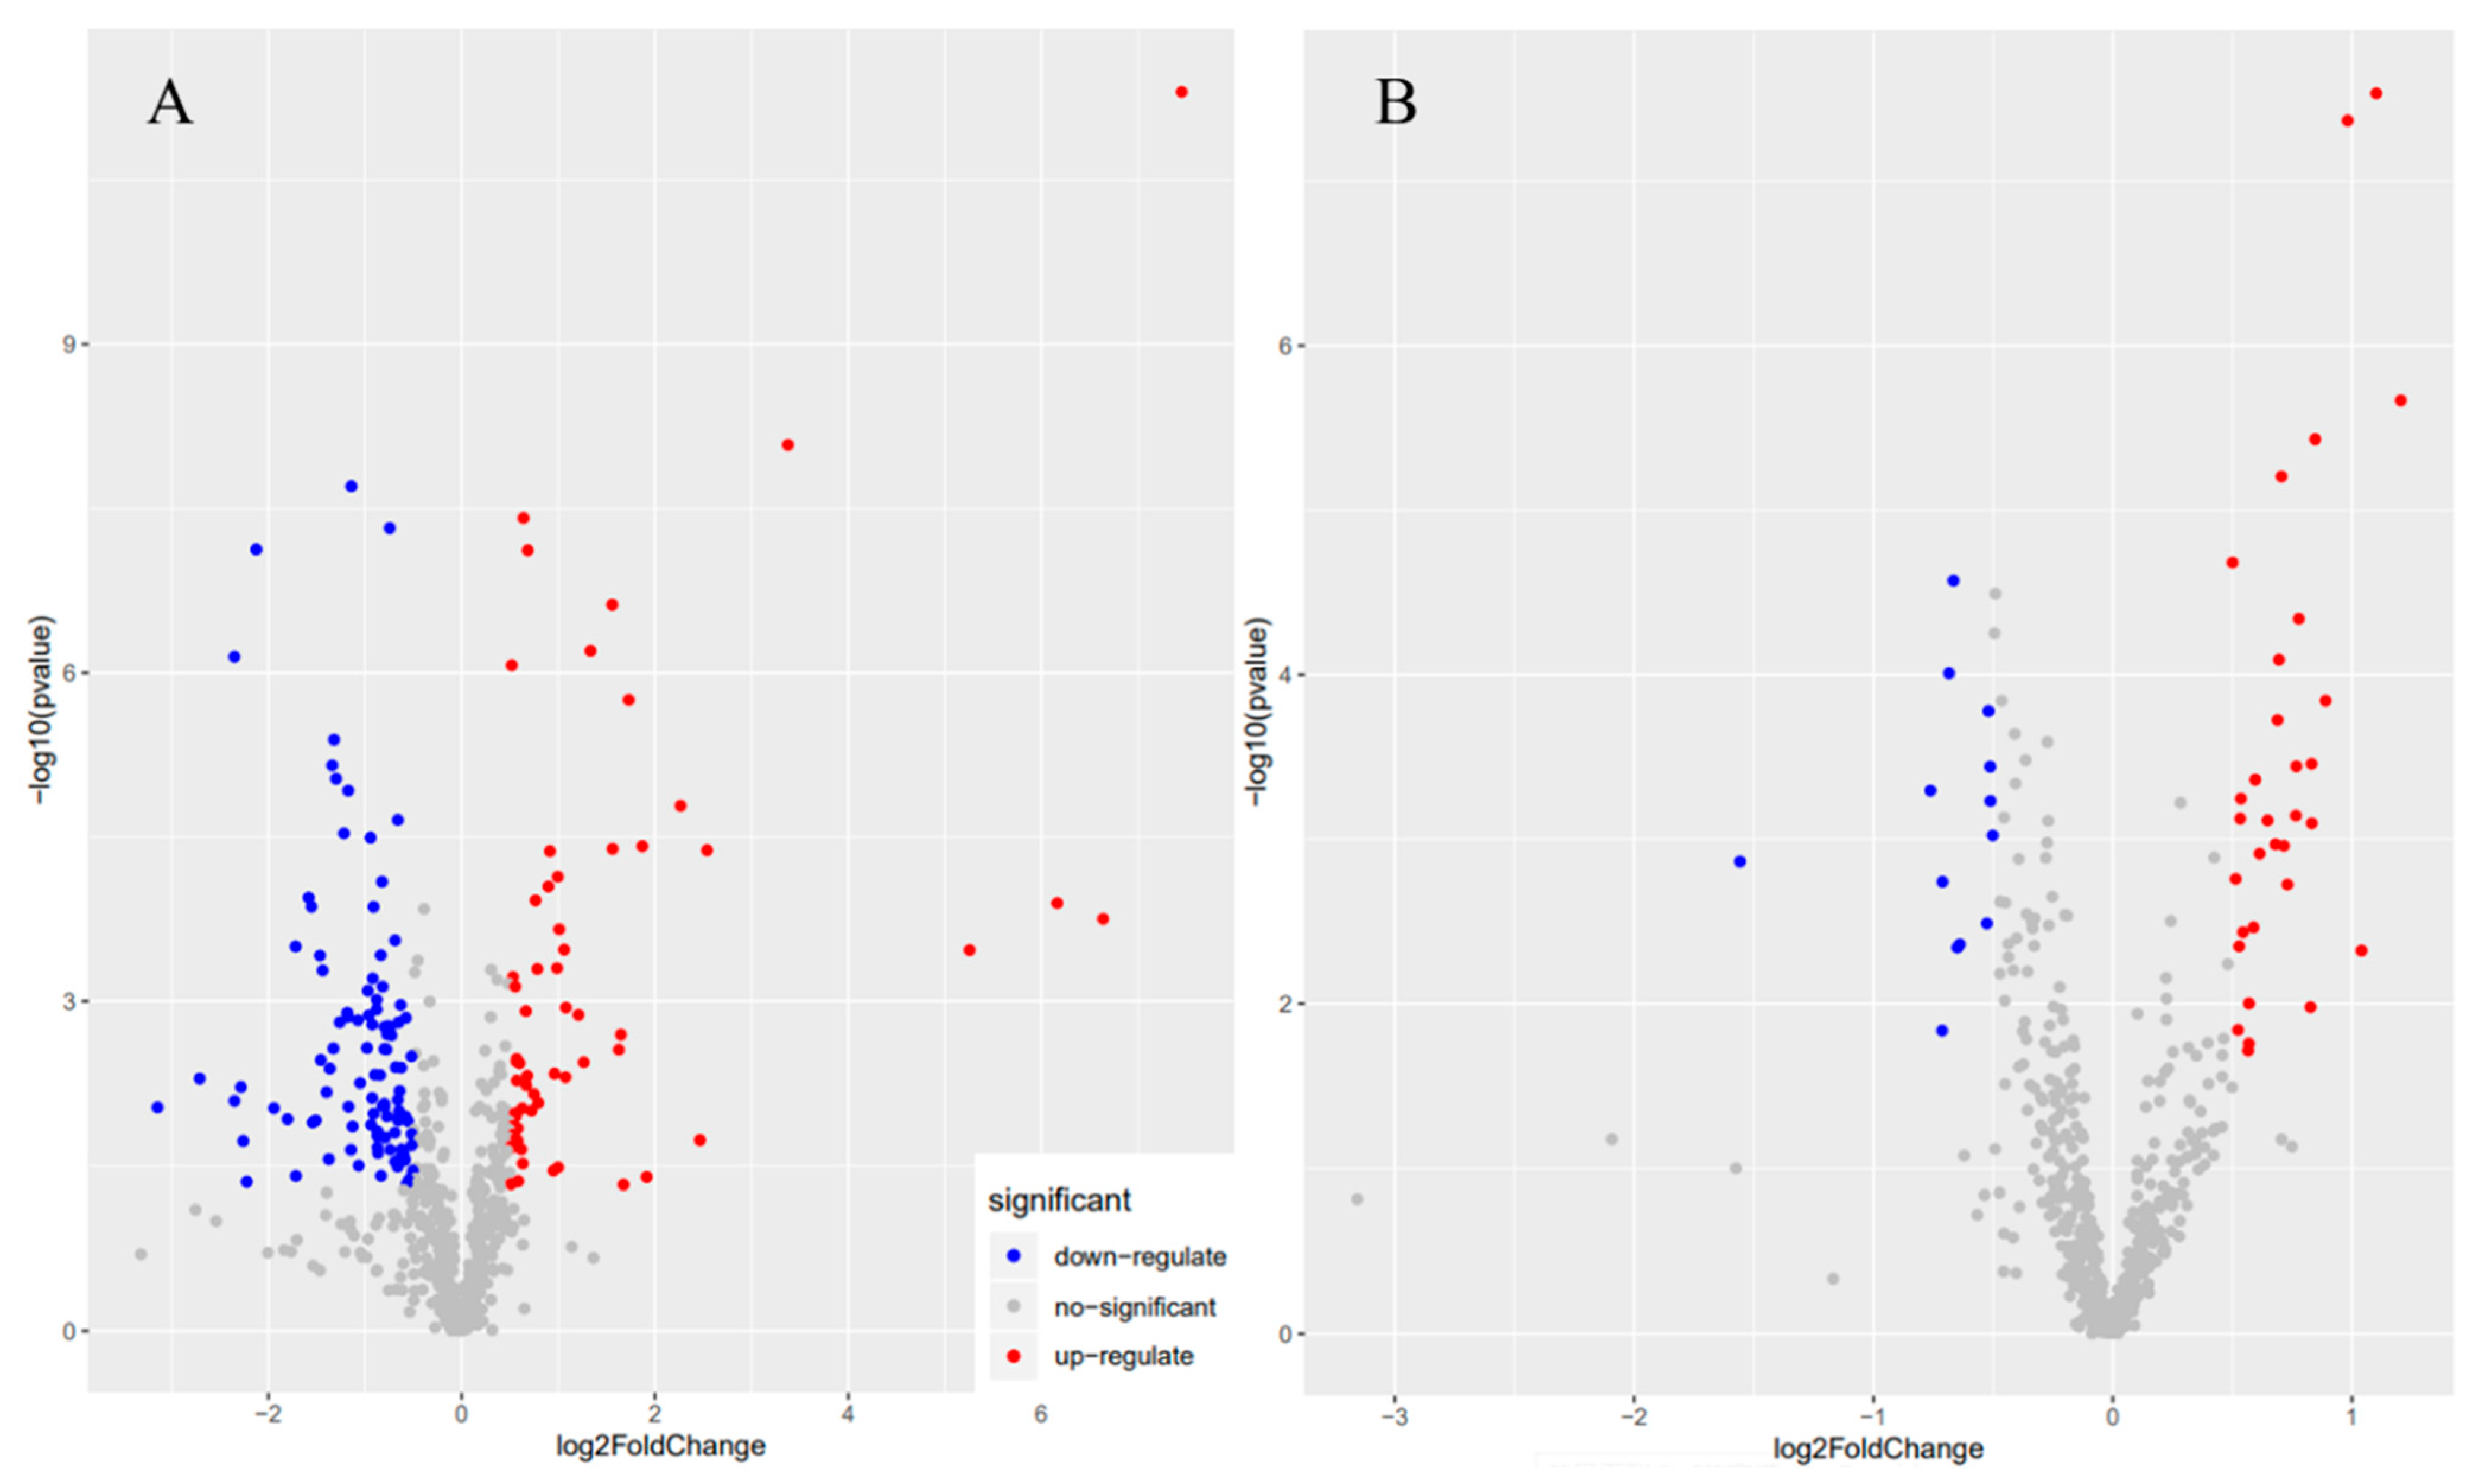
3.2. Orthogonal Partial Least Squares Discriminant Analysis (OPLS-DA)

OPLS-DA was used to screen and analyze the metabolite data. OPLS-DA is a supervised method of pattern recognition. According to the corresponding variable importance in projection (VIP) given by the OPLS-DA model to the data, we screened out the possible metabolites that contributed greatly to the clustering of the model. A total of 3844 variables were detected in the positive ion mode using UPLC-MS/MS, with the noise level accounting for 5%, and a total of 572 variables were detected in the negative ion mode, with the noise level accounting for 6%. OPLS-DA was used to analyze the test results, as shown in Figure 2. The abscissa indicates the principal component scores in the orthogonal signal correction process, and the ordinate indicates the orthogonal component scores during the process. Each point represents a sample score. The black and red points were distinctly separated on the X-axis, indicating that the composition of Chinese fir secondary metabolites was different before and after dormancy release, while the separation on the Y-axis shows the within-group variation.
The abscissa of the S-plot indicates the correlation coefficient between the principal component and the metabolite, while the ordinate of the S-plot indicates the correlation coefficient between the principal component and the metabolite, as shown in Figure 3. Metabolites with VIP values >1 are generally considered different metabolites. In the S-plot, the closer the points at both ends of the “S-curve”, the more significant the difference, as shown by the black points with boxes in Figure 3A. The boxed black points in the first quadrant represent all of the different variables that exhibited a significant increase after dormancy release, while the boxed black points in the third quadrant represent the different variables that significant decreased.
The volcanic plot is a single-dimensional statistical method that uses the analysis of variance (ANOVA) p-value and fold-change (FC) as an index to identify different metabolites. The ordinate is a Log10p-value, and the abscissa is a Log2Fold-change value. Metabolites with ANOVA p-values < 0.05 and FC > 1.5 or <0.67 are generally considered to be different metabolites. By that standard, the red points in the positive direction of the X-axis in Figure 4 represent all variables that increased significantly after dormancy release, while the blue points in the negative direction of the X-axis represent all variables that decreased. We screened information on 39 different variables and compared them with the database to obtain a total of 35 metabolites and four unknown metabolites.

3.3. Metabolite Composition

The metabolite composition of the Chinese fir secondary phloem before and after dormancy release (28 March and 13 April) changed significantly. We normalized the different metabolites using the Internal standard method which is the peak area of the metabolites in a sample is divided by the peak area of the corresponding ribitol in that sample, then screened by OPLS-DA and classified them, as shown in Table 2. There were nine kinds of carbohydrates, one amino alcohol, six amino acids, seven organic acids, ten fatty acids, one terpenoid, and four unknown substances before and after dormancy release. The relative contents of the different carbohydrate metabolites accounted for 43.65% and 48.24% of the total different metabolite relative contents before and after dormancy release, respectively. The relative content of seven carbohydrates was significantly upregulated after dormancy release, ranging from 1.6–3.5 times that during the dormant period, while the relative content of fructose 6-phosphate was slightly downregulated and the relative content of L-arabitol remained unchanged. Budzinski et al. reported that the greater abundance of organic compounds during the growing season compared to the dormant period was the result of an active TCA cycle producing more energy and carbohydrates through metabolism [18].
Organic acids are involved as important intermediates in a variety of biological and chemical processes in plants [19]. Five organic acids were upregulated after dormancy release, accounting for 71.43% of the organic acids. Four amino acid metabolites were upregulated after dormancy release. Amino acids have an irreplaceable role in plants, such as leucine, which is a growth promoter that regulates photosynthesis, and phenylalanine, which is involved in the disease resistance responses [20]. Recent studies document the differences in phloem metabolites between trees with injected and non-injected phytoplasma, and found changes in the composition of metabolites, with increased content of Phenylalanine [21]. In plants, tissues with high metabolic activity do become hypoxic [22]. Additionally, previous studies found that falling oxygen led to a progressive increase in amino acids content in the plant phloem [23]. In this study, the relative content of Leucine, isoleucine and phenylalanine were upregulated after dormancy release. We therefore hypothesize that the metabolic activity of the secondary phloem increased during dormancy release in Chinese fir. The relative amount of pyruvic acid after dormancy release was (2.08 ± 0.43) %, which was 1.8 times that of the amount determined for the dormant period. The aerobic oxidation and anaerobic glycolysis of sugars have a common pathway from glucose to pyruvic acid. Under aerobic conditions and catalysis of the pyruvate dehydrogenase complex, pyruvic acid is oxidatively decarboxylated to acetyl-CoA, which is then oxidized to H2O and CO2 by the TCA cycle. Pyruvic acid is an intermediate product of respiration and the increase in content indicates that respiration has become active. The relative amount of ascorbic acid after dormancy release was (1.93 ± 0.64)%, which was 1.9 times that of the amount determined for the dormant period. L-ascorbic acid is an important antioxidant involved in defense against oxidative stress. L-ascorbic acid scavenges reactive oxygen species produced by photosynthesis and various stressors [24,25]. The relative increase in pyruvic acid and ascorbic acid contents in the cambium zone of Chinese fir is effective proof of the substantial increase in activity and metabolic rate after dormancy release.
The relative content of raffinose was upregulated from (55.93 ± 8.92)% to (91.61 ± 28.11)% after dormancy release. Raffinose is an oligosaccharide with an energy storage function, which enhances stress resistance by stabilizing the photosynthetic system [26], and it also can scavenge hydroxyl radicals [27]. The amount of raffinose in plants is second only to saccharose. The synthesis of raffinose in plants involves the formation of inositol, which is an important osmotic protective substance that plays an important role in the formation of cell walls [28]. The increase in raffinose content is an indication of accelerated inositol formation [29]. D-galactose and L-arabinose are constituents of hemicellulose, which is one of the main components of the cell wall. The relative content of D-galactose was upregulated to (106.69 ± 85.93)% and that of L-arabinose was downregulated from (118.30 ± 17.22)% to (104.98 ± 14.67)% after dormancy release. These content changes infer that the rapidly formation of cell wall and in accordance with the previous observed of begins of cell division. Sphingosine is a phospholipid and the main component of biological membranes [30]. The relative content of sphingosine was downregulated from (26.53 ± 16.52)% to (0.22 ± 0.08)% after dormancy release. We speculate that the downregulation of sphingosine and L-arabinose is associated with their consumption during cell division. Changes in the relative contents of raffinose, D-galactose, L-arabinose, and sphingosine indicate accelerated metabolism within the cambium zone after dormancy release in Chinese fir.

4. Conclusions

Cellular and metabolite changes in the secondary phloem of Chinese fir during dormancy release was investigated by anatomical method and metabolic fingerprinting analytical technique. From 28 March and 13 April, new secondary phloem cells generated by cambium activity in Chinese fir. The newly formed phloem mainly consisted of Sieve cell which has a thinner cell wall. A small amount of parenchyma and fiber cells were observed. Furthermore, two layers of xylem cells were newly formed in the developing tissue on 13 April proving again that dormancy release occurred in early April. The difference in cell amount between newly formed phloem and xylem suggested that phloem generation period is earlier than xylem in Chinese fir.
Metabolites in immature phloem tissue of Chinese fir are first reported and a total of 4416 fragments were scanned in samples from 28 March and 13 April. As results, 39 differential metabolites were screened out using a combination of OPLS-DA and database comparisons. The increased relative contents of pyruvic acid and ascorbic acid suggest more photosynthate conversion by glycolytic pathway during dormancy release period. Changes in cellular and metabolite reveal that dormancy release in Chinese fir occur in early April. In the course of dormancy release, the metabolism of secondary phloem is mainly related to respiration.

Author Contributions

Conceptualization, J.S.; methodology, J.P. and C.X.; software, X.L.; validation, J.P. and J.S.; formal analysis, C.X.; investigation, J.P. and C.X.; resources, J.S. and B.P.; data curation, X.L. and C.X.; writing—original draft preparation, J.P. and C.X.; writing—review and editing, J.S. and B.P.; funding acquisition, J.S. All authors have read and agreed to the published version of the manuscript.

Funding

This research was funded by the National Natural Science Foundation of China (31971585).

Data Availability Statement

The data presented in this study are available on request from the corresponding author.

Conflicts of Interest

The authors declare no conflict of interest.

References

  1. Taiz, L.; Zeiger, E. Plant Physiology, 5th ed.; Oxford University Press: New York, NY, USA, 2010; ISBN 9780878938667. [Google Scholar]
  2. Wilson, B.F.; Wodzicki, T.J.; Zahner, R. Differentiation of Cambial Derivatives: Proposed Terminology. For. Sci. 1966, 12, 438–440. [Google Scholar] [CrossRef]
  3. Prislan, P.; Cufar, K.; Koch, G.; Schmitt, U.; Gricar, J. Review of cellular and subcellular changes in the cambium. IAWA J. 2013, 34, 391–407. [Google Scholar] [CrossRef] [Green Version]
  4. Delpierre, N.; Lireux, S.; Hartig, F.; Camarero, J.J.; Cheaib, A.; Cufar, K.; Cuny, H.; Deslauriers, A.; Fonti, P.; Gricar, J.; et al. Chilling and forcing temperatures interact to predict the onset of wood formation in northern hemisphere conifers. Glob. Chang. Biol. 2019, 25, 1089–1105. [Google Scholar] [CrossRef] [PubMed]
  5. Huang, J.G.; Ma, Q.Q.; Rossi, S.; Biondi, F.; Deslauriers, A.; Fonti, P.; Liang, E.Y.; Makinen, H.; Oberhuber, W.; Rathgeber, C.B.K.; et al. Photoperiod and temperature as dominant environmental drivers triggering secondary growth resumption in northern hemisphere conifers. Proc. Natl. Acad. Sci. USA 2020, 117, 20645–20652. [Google Scholar] [CrossRef] [PubMed]
  6. Vieira, J.; Carvalho, A.; Campelo, F. Xylogenesis in the early life stages of maritime pine. For. Ecol. Manag. 2018, 424, 71–77. [Google Scholar] [CrossRef]
  7. Qi, X.Q.; Wang, Y.L.; Chen, X.Y. (Eds.) Plant Metabolomics: Methods and Application; Chemical Industry Press: Beijing, China, 2011; ISBN 978-7-122-10587-5. [Google Scholar]
  8. Morris, C.R.; Scott, J.T.; Chang, H.M.; Sederoff, R.R.; O’Malley, D.; Kadla, J.F. Metabolic profiling:  a new tool in the study of wood formation. J. Agric. Food Chem. 2004, 52, 1427–1434. [Google Scholar] [CrossRef]
  9. Abreu, I.N.; Johansson, A.I.; Sokolowska, K.; Niittyla, T.; Sundberg, B.; Hvidsten, T.R.; Street, N.R.; Moritz, T. A metabolite roadmap of the wood-forming tissue in Populus tremula. New Phytol. 2020, 228, 1559–1572. [Google Scholar] [CrossRef]
  10. Wang, N.W. Comparative Studies on Secondary Phloem in Coniferous Species. Master’s Thesis, Nanjing Forestry University, Nanjing, China, 2014. [Google Scholar]
  11. Shi, J.T.; Liu, H.C.; Peng, J.Y.; Luo, J.Y. Seasonal Changes of Cell Types and Morphology in Secondary Phloem of Broussonetia papyrifera. J. Northwest For. Univ. 2019, 34, 202–207. [Google Scholar] [CrossRef]
  12. Peng, J.Y.; Lin, Q.; Shi, J.T. Histochemical staining of Pinus sylvestris wood. J. Cent. South. Univ. For. Technol. 2020, 40, 88–94. [Google Scholar] [CrossRef]
  13. Rensing, K.H.; Samuels, A.L. Cellular changes associated with rest and quiescence in winter-dormant vascular cambium of Pinus contorta. Trees 2004, 18, 373–380. [Google Scholar] [CrossRef]
  14. Little, C.H.A.; Bonga, J.M. Rest in the cambium of Abies balsamea. Can. J. Bot. 1974, 52, 1723–1730. [Google Scholar] [CrossRef]
  15. Sundberg, B.; Little, C.H.A.; Riding, R.T.; Sandberg, G. Levels of endogenous indole-3-acetic-acid in the vascular cambium region of Abies balsamea trees during the activity-rest-quiescence transition. Physiol. Plant. 1987, 71, 163–170. [Google Scholar] [CrossRef]
  16. Begum, S.; Nakaba, S.; Oribe, Y.; Kubo, T.; Funada, R. Induction of cambial reactivation by localized heating in a deciduous hardwood hybrid poplar (Populus sieboldii × P. grandidentata). Ann. Bot. 2007, 100, 439–447. [Google Scholar] [CrossRef] [PubMed]
  17. Peng, Z.; Fan, R.W.; Huang, J.S.; Gan, X.H.; Fang, Y.M. Ultrastructure change during the development sieve cell of secondary phloem in Cunninghamia lanceolata. J. Nanjing For. Univ. Nat. Sci. Ed. 2008, 32, 47–51. [Google Scholar]
  18. Budzinski, I.G.F.; Moon, D.; Linden, P.; Moritz, T.; Labate, C.A. Seasonal Variation of Carbon Metabolism in the Cambial Zone of Eucalyptus grandis. Front. Plant Sci. 2016, 7, 932. [Google Scholar] [CrossRef] [Green Version]
  19. Lopez-Bucio, J.; Nieto-Jacobo, M.F.; Ramirez-Rodriguez, V.V.; Herrera-Estrella, L. Organic acid metabolism in plants: From adaptive physiology to transgenic varieties for cultivation in extreme soils. Plant Sci. Int. J. Exp. Plant Biol. 2000, 160, 1–13. [Google Scholar] [CrossRef]
  20. Dixon, R.A.; Harrison, M.J.; Lamb, C.J. Early events in the activation of plant defense responses. Annu. Rev. Phytopathol. 1994, 32, 479–501. [Google Scholar] [CrossRef]
  21. Gallinger, J.; Gross, J. Phloem Metabolites of Prunus Sp. Rather than Infection with Candidatus Phytoplasma Prunorum Influence Feeding Behavior of Cacopsylla pruni Nymphs. J. Chem. Ecol. 2020, 46, 756–770. [Google Scholar] [CrossRef] [Green Version]
  22. Porterfield, D.M.; Kuang, A.; Smith, P.J.; Crispi, M.L.; Musgrave, M.E. Oxygen-depleted zones inside reproductive structures of Brassicaceae: Implications for oxygen control of seed development. Can. J. Bot. 1999, 77, 1439–1446. [Google Scholar] [CrossRef]
  23. van Dongen, J.T.; Schurr, U.; Pfister, M.; Geigenberger, P. Phloem metabolism and function have to cope with low internal oxygen. Plant Physiol. 2003, 131, 1529–1543. [Google Scholar] [CrossRef] [Green Version]
  24. Arora, A.; Sairam, R.K.; Srivastava, G.C. Oxidative stress and antioxidative system in plants. Curr. Sci. 2002, 82, 1227–1238. [Google Scholar] [CrossRef] [Green Version]
  25. Baxter, A.; Mittler, R.; Suzuki, N. Ros as key players in plant stress signalling. J. Exp. Bot. 2014, 65, 1229–1240. [Google Scholar] [CrossRef] [PubMed]
  26. Schneider, T.; Keller, F. Raffinose in chloroplasts is synthesized in the cytosol and transported across the chloroplast envelope. Plant Cell Physiol. 2009, 50, 2174–2182. [Google Scholar] [CrossRef] [PubMed] [Green Version]
  27. Nishizawa, A.; Yabuta, Y.; Shigeoka, S. Galactinol and raffinose constitute a novel function to protect plants from oxidative damage. Plant Physiol. 2008, 147, 1251–1263. [Google Scholar] [CrossRef] [PubMed] [Green Version]
  28. Zhao, M.L. Physiological Characteristics and Metabolomics Reveal the Tolerance Mechanism to Low Nitrogen in Glycine soja Sieb.et Zucc. Seedling Leaves. Master’s Thesis, Northeast Normal University, Changchun, China, 2020. [Google Scholar]
  29. Abid, G.; Silue, S.; Muhovski, Y.; Jacquemin, J.M.; Toussaint, A.; Baudoin, J.P. Role of myo-inositol phosphate synthase and sucrose synthase genes in plant seed development. Gene 2009, 439, 1–10. [Google Scholar] [CrossRef]
  30. Fan, Y.D. Study on Serum Metabonomics of Early Colorectal Cancer Based on Liquid Chromatography-Mass Spectrometry. Master’s Thesis, Jilin University, Changchun, China, 2020. [Google Scholar]
Figure 1. 2 March (a); 28 March (b); 13 April (c); 2 March cambium enlargement (d); 28 March cambium enlargement (e); and 13 April cambium enlargement (f). T: Tracheid; PF: Phloem fiber; SC: Sieve cell; PP: Phloem parenchyma; C: Cambium; PHW: Phloem width; SCD: Sieve cell inside diameter; CZW: Cambium zone width.
Forests 12 01552 g001
Figure 2. Scores Comp [1] (28 March) vs. Comp [2] (13 April) colored by Condition (time). (A): Positive ion mass spectrum; (B): Negative ion mass spectrum. Each point represents a sample score, black points: sample of 28 March; red points: sample of 13 April.
Forests 12 01552 g002
Figure 3. S-Plot (28 March and 13 April). (A): S-plot of positive ion mass spectrum; (B): S-plot of negative ion mass spectrum. Each circle point represents a variable (metabolite), while the red boxed black points represent all of the different variables that exhibited a significant increase or decrease after dormancy release (28 March and 13 April).
Forests 12 01552 g003
Figure 4. Volcano plot (28 March and 13 April). (A): Positive ion mass spectrum; (B): Negative ion mass spectrum. Each circle point represents a variable (metabolite), the red circle points represent all variables that increased significantly after dormancy release, the blue circle points represent all variables that decreased significantly after dormancy release, and the grey circle points represent variables with no significant difference (28 March and 13 April).
Forests 12 01552 g004
Table 1. Statistics on the Chinese fir cambium zone data. CZW: Cambium zone width; PHW: Phloem width; SCD: Sieve cell inside diameter.
2 March (μm)28 March (μm)13 April (μm)
CZW23.3 ± 2.5 B18.7 ± 5.7 B76.5 ± 3.0 A
PHW124.1 ± 13.5 B138.9 ± 6.9 B197.0 ± 8.5 A
SCD16.0 ± 7.9 B15.4 ± 7.5 B21.5 ± 7.4 A
In the table, the same letter in the same row indicates that the difference is not significant (p > 0.05), and different letters indicate that the difference is significant (p < 0.01). The values are shown as mean values ±standard deviation.
Table 2. Identified metabolites and their relative amount of metabolites in immature phloem-tissue.
MetabolitesMolecular FormulaRetention Time (min)m/zIons ModeRelative Amount (%)
28 March13 April
CarbohydratesSedoheptuloseC7H14O70.7225209.0666pos11.81 ± 2.8724.35 ± 12.10
L-ArabitolC5H12O50.6882153.0757neg118.30 ± 17.22104.98 ± 14.67
1-KestoseC18H32O160.9513527.1579neg105.52 ± 17.70174.45 ± 41.79
Fructose 6-phosphateC6H13O9P0.7401261.0367neg6.35 ± 2.415.44 ± 2.36
MaltotetraoseC24H42O210.9801689.2101neg42.10 ± 19.1682.43 ± 23.94
RaffinoseC18H32O160.7528522.2025neg55.93 ± 8.9291.61 ± 28.11
D-GalactoseC6H12O60.6752203.0524neg47.07 ± 18.54106.69 ± 85.93
AdenosineC10H13N5O41.3227268.1037neg11.72 ± 2.8129.61 ± 12.25
GuanosineC10H13N5O51.3799284.0986neg0.92 ± 0.363.23 ± 1.43
Organic acidAscorbic acidC6H8O60.9340175.0247pos1.02 ± 0.201.93 ± 0.64
Isocitric acidC6H8O70.7631191.0197pos26.87 ± 3.7529.02 ± 12.10
Oxoglutaric acidC5H6O50.7488145.0141pos0.65 ± 0.121.46 ± 12.10
Vanillic acidC8H8O42.6059167.0349pos1.12 ± 0.192.56 ± 12.10
2-Hydroxycinnamic acidC9H8O31.1800182.0812neg4.95 ± 1.9318.62 ± 12.10
Homogentisic acidC8H8O40.6752191.0315neg10.10 ± 1.978.43 ± 12.10
Imidazoleacetic acidC5H6N2O20.7266127.0501neg18.66 ± 18.068.64 ± 12.10
Amino AcidsOrnithineC5H12N2O20.6841131.0825pos6.17 ± 1.125.51 ± 1.49
CitrullineC6H13N3O30.6841174.0883pos33.70 ± 6.4927.67 ± 9.58
L-GlutamateC5H9NO40.6882148.0603neg81.70 ± 6.16133.13 ± 38.65
L-leucineC6H13NO21.4368132.1019neg4.67 ± 0.8218.64 ± 29.93
L-IsoleucineC6H13NO21.5941132.1019neg5.14 ± 1.2219.68 ± 43.20
L-PhenylalanineC9H11NO22.8120166.0862neg25.48 ± 12.1768.08 ± 30.72
Fatty acid2-Methylcitric acidC7H10O71.1351205.0353pos1.58 ± 0.333.17 ± 0.76
(S)-dihydrolipoic acidC8H16O2S20.6841207.051pos60.27 ± 26.5467.06 ± 14.35
(S)-3,4-Dihydroxybutyric acidC4H8O40.6970239.0773pos28.31 ± 9.6249.27 ± 7.55
Pyruvic acidC3H4O30.7358175.0247pos1.14 ± 0.382.08 ± 0.43
6,7-dihydroxy-4-oxo-2-heptenoic acidC7H10O50.8907173.0454pos30.48 ± 6.3159.65 ± 12.40
5-oxo-pentanoic acidC5H8O30.6882117.0545neg75.96 ± 10.5169.57 ± 9.97
Butyric acidC4H8O20.6752106.0861neg2.35 ± 1.041.16 ± 0.86
beta-vinyl acrylic acidC5H6O20.700899.04397neg35.39 ± 4.6735.34 ± 6.38
Juniperic acidC16H32O39.4623290.2686neg15.44 ± 13.981.88 ± 0.63
(S)-dihydrolipoic acidC8H16O2S20.9369226.0919neg17.45 ± 3.1231.20 ± 6.18
Amino AlcoholsSphingosineC18H37NO29.7053300.2893neg26.53 ± 16.520.22 ± 0.08
TerpenoidLimonene-1,2-diolC10H18O25.9842171.1379neg0.84 ± 0.294.33 ± 6.44
Unknow4-Hydroxy-6-methyl-2-pyroneC6H6O30.7266127.0389neg147.33 ± 26.44243.62 ± 58.50
EpicatechinC15H14O64.6759291.086neg104.28 ± 36.95345.20 ± 271.99
2-Amino-2-methyl-1-propanolC4H11NO5.035390.0913neg7.44 ± 2.937.31 ± 2.86
EmbelinC17H26O48.7993293.1768pos3.10 ± 0.992.45 ± 037
The relative amount values represent means ± standard deviation (n = 7). The peak area of the metabolites in a sample is divided by the peak area of the corresponding ribitol (internal standard substance) in that sample to obtain a relative amount value.
Publisher’s Note: MDPI stays neutral with regard to jurisdictional claims in published maps and institutional affiliations.

