Abstract
The biomass, nutrient content and decomposition rate of shoot sheaths remain unexplored in the study of Moso bamboo forests. The rapid growth of shoots means many bamboo sheaths are produced each year, and therefore should not be neglected in the study of the Moso bamboo ecosystem. In our study, we selected 160 bamboo shoots of different sizes in Yixing forest farm, Jiangsu Province. Our analysis was based on the allometric growth equation, using diameter at breast height (DBH), internode length of bamboo at breast height (IL), and bamboo height (H) as independent variables to establish the biomass model of shoot sheaths using all samples. In addition, we also measured the nutrient content of shoots and estimated the decomposition rate of shoots by setting up litter decomposition bags. Our results found that logarithmic regression should be used to fit the biomass model of shoot sheaths. From the perspective of practical application, model W3 fitting DBH and IL was determined. The order of the nutrient elements in the shoot sheath is C > N > K > P. Decomposition tests showed that it took 0.47 years for 50% of sheaths to decompose, and 3.15 years for all sheaths to decompose.
1. Introduction
China has about 6.41 million ha of bamboo forests, belonging to more than 534 species in 34 genera, which accounts for 20% of the world’s bamboo forest area [1]. Among them, Moso bamboo (Phyllostachys edulis (Carrière) J. Houz.) forest covers 4.67 million ha, accounting for 72.96% of the total bamboo forest area in China [2]. The Moso bamboo forest is characterized by high biomass productivity and a short rotation period [3]. As a result, it has become an economically important tree species in China that is widely used in various fields [4]. However, its long-term management, particularly whole tree removal, may decline growth due to nutrient depletion [5]. Thus, there are some concerns that long-term management practices may reduce forest productivity [6].
Nutrient cycling and balance affect the productivity, stability, and sustainability of ecosystems [7]. The exchange of materials and energy through interaction with the environment is the basis for the survival and development of all organisms [7]. The study of nutrient cycling not only elucidates the mechanism of ecosystem material cycling but also plays an important role in guiding production practice, improving ecosystem limiting factors, and enhancing ecosystem productivity [8]. However, studies on bamboo ecosystem productivity and sustainable management have ignored the nutrient return of shoot sheaths. Thus, including the shoot sheath when quantifying nutrient flow is crucial for the sustainable and intensive management of bamboo forests. It is well known that factors including biomass, nutrient content, and decomposition rate are prerequisites for the study of nutrient cycling [9]. In traditional bamboo forest management, the economic benefits of bamboo sheaths are often ignored. In recent years, wheat straw, wood chips, hay, and miscanthus have been widely studied as potential biomass materials that can provide energy [10]. Bamboo sheaths may also be a potential biomass material. Shoot sheaths grow together with internode development. They dry up, begin to shed, and completely fall off when the sprout of the twig grows [11]. Moso bamboo undergoes a two-year vegetative cycle which includes ‘on-years’ and ‘off-years’ [12]. The bamboo forest produces many shoots during the on-years and only a few shoots during the off-years [13]. Shoot sheaths produced in the on-years turn into trees. Leaf litter is collected by setting litter traps. However, a shoot sheath differs from a leaf. Owing to the uncertain location of bamboo shoots and the density of adult bamboo, the method of litter traps is not suitable for investigating the biomass of shoot sheaths. Thus, the high annual growth efficiency of bamboo trees means that the shoot sheaths should not be ignored. At present, the biomass model estimation method is commonly used to estimate forest biomass, which can use easy-to-measure factors to calculate the standing biomass [14]. Biomass estimation models of Moso bamboo forests have made progress over the past decades [15,16,17,18]. Many studies have found a good linear relationship between aboveground biomass and diameter at breast height, tree height, and age [3,15,16,17,18]. Owing to the complexity of the biomass investigation of shoot sheaths, establishing a biomass model is the best approach [18].
The content of nutrients in litters directly affects the quality and rate of return of nutrients, and indirectly affects the uptake of plant roots [19,20,21]. Previous studies have found that the N, P, and K content of shoot sheaths were higher than that in adult organic materials (including leaves, branches, culms, and rhizomes) [10,22]. Moreover, the return of nutrients to the soil through litter decomposition is an important ecological process. However, research on litter decomposition in Moso bamboo forest has mainly focused on the understory vegetation [20] and leaves [19,23], whereas studies on the decomposition of the bamboo sheath have not been reported.
The practice of precision forestry puts forward higher requirements for the dynamic determination of forest nutrients. Nonetheless, research on the biomass, nutrient content, and decomposition rate of shoot sheaths has been ignored. The purpose of our study is (1) to use bamboo height (H), diameter at breast height (DBH), and internode length of bamboo at breast height (IL) as the variables to establish the biomass model of shoot sheaths, (2) to measure the nutrient content and investigate the decomposition rate of shoot sheaths, (3) to provide a theoretical basis for the evaluation of bamboo ecosystem and site conditions.
2. Methods
2.1. Study Site
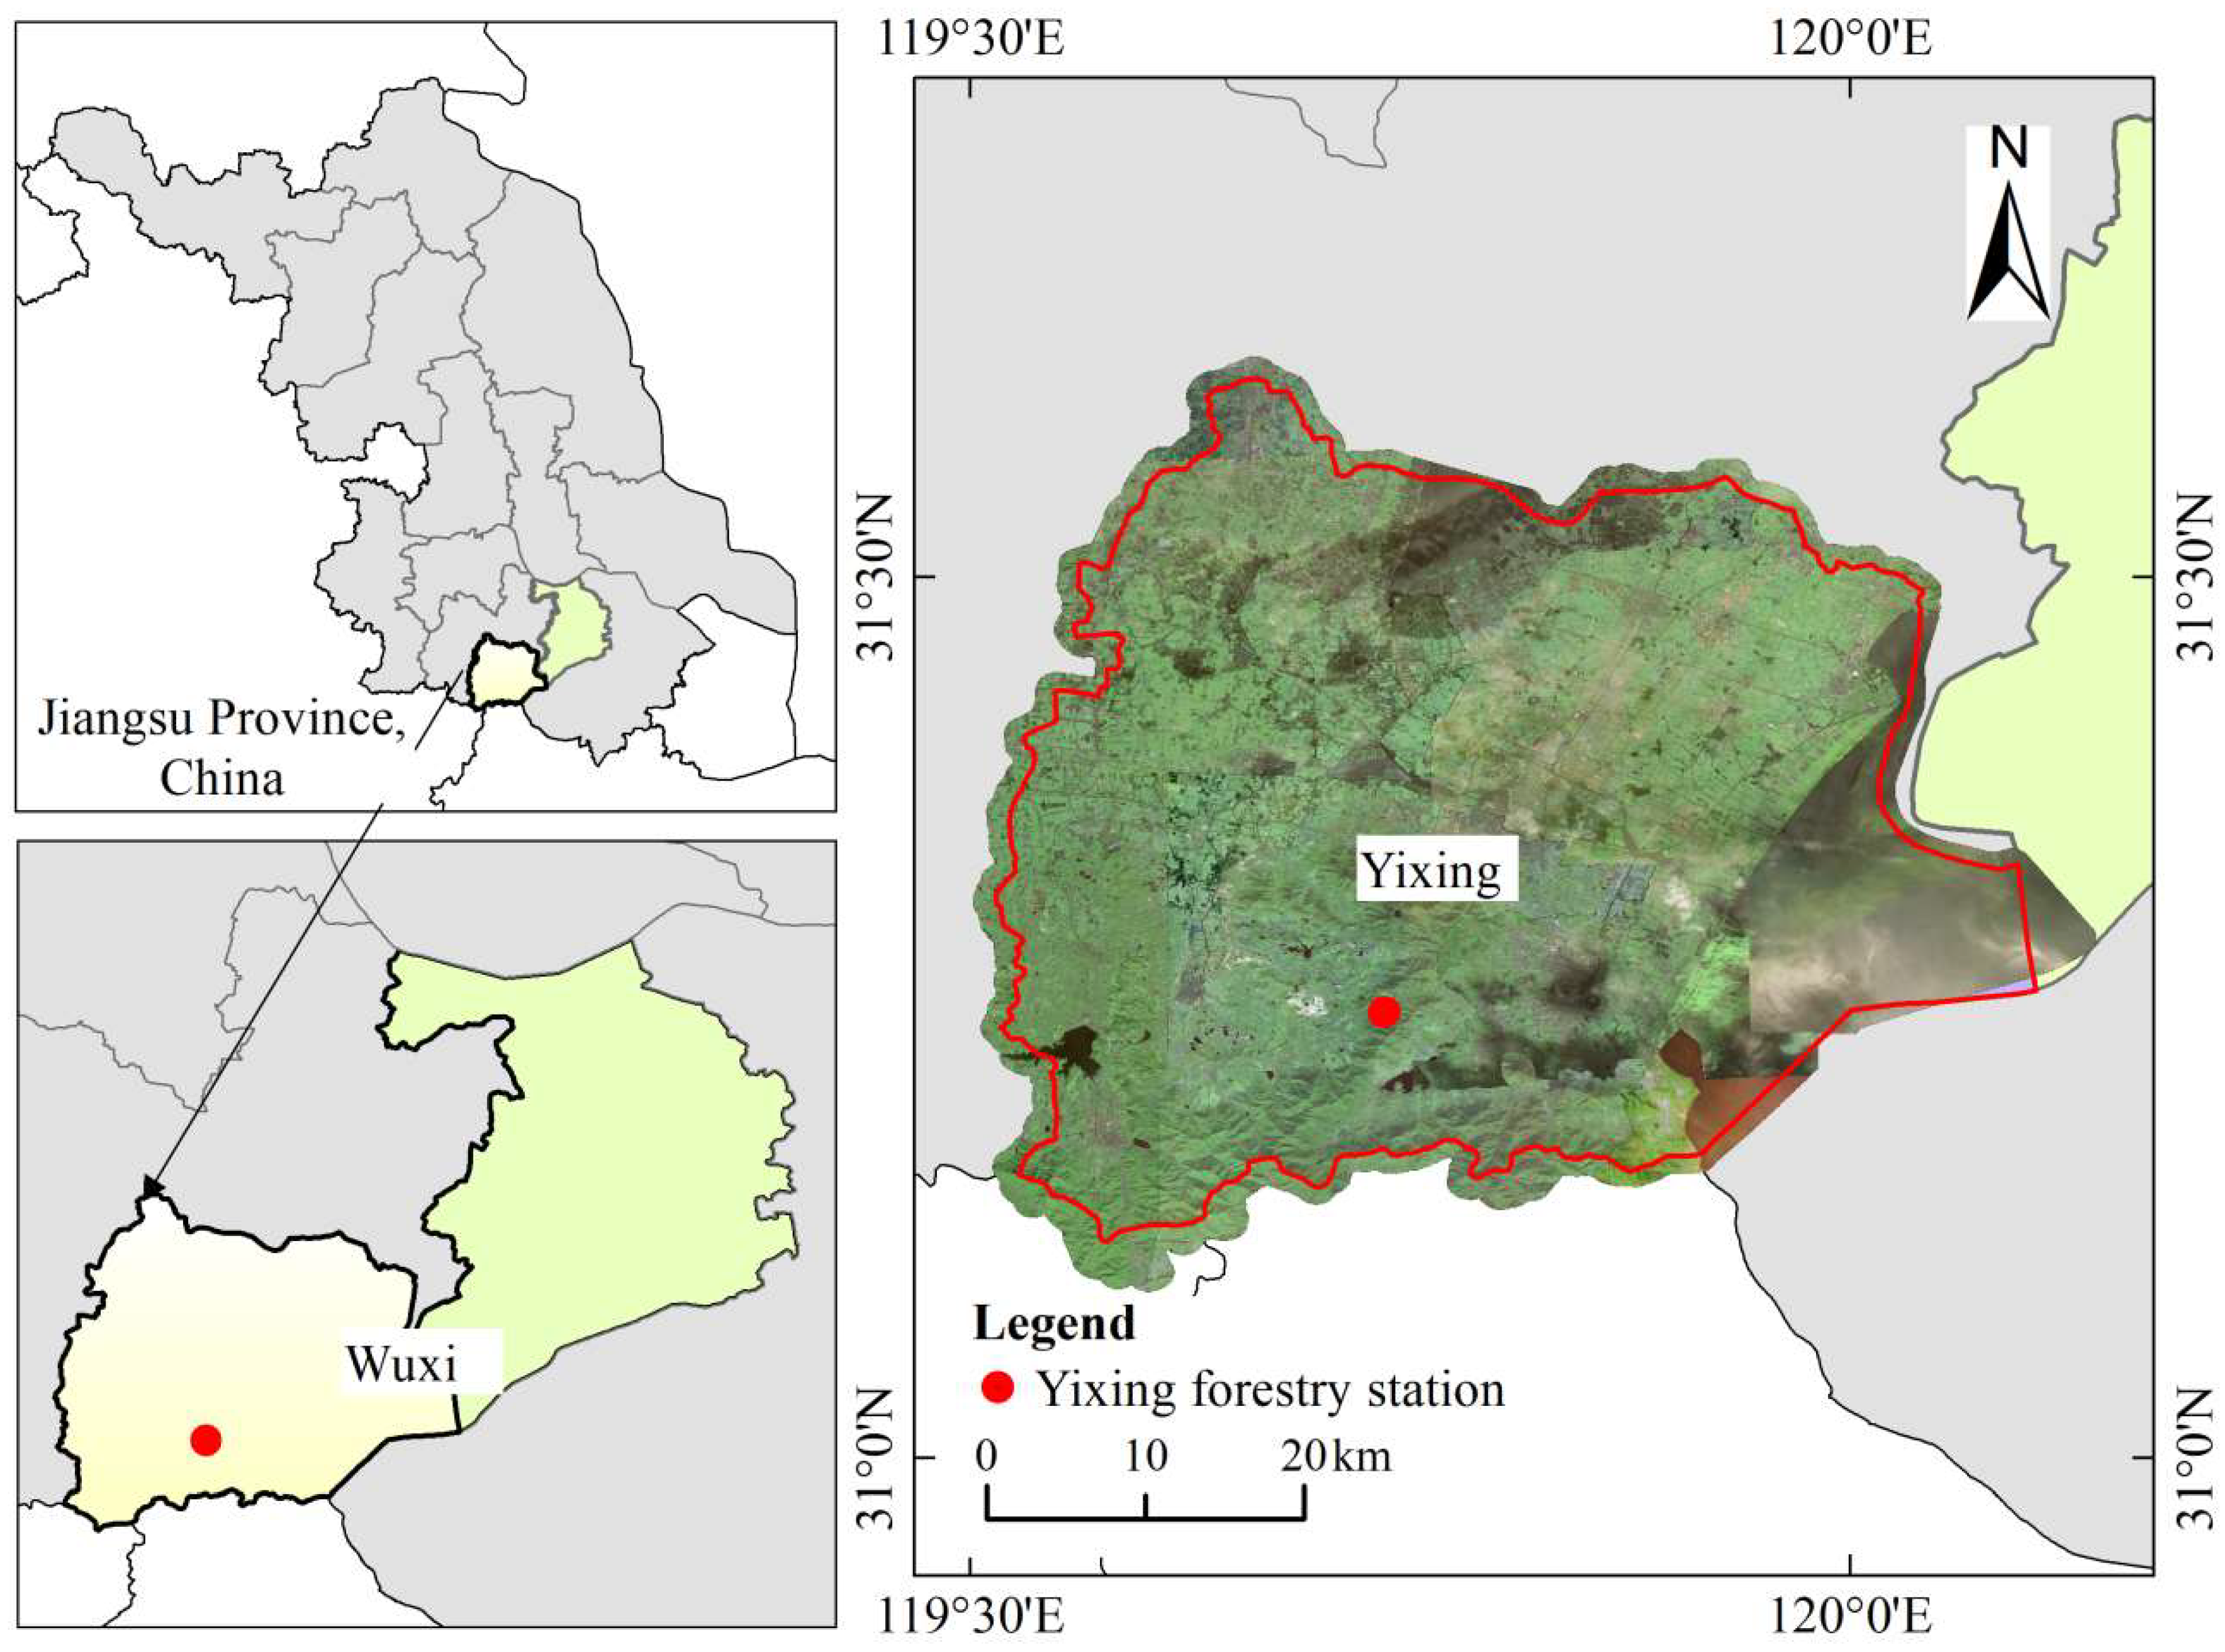
The study was carried out in Yixing forest farm (31°15′1″–31°15′12″ N, 119°44′2″–119°44′8″ E), located in southern Jiangsu Province, China (Figure 1). It is the northeast marginal area of Moso bamboo distribution in China, which is typical and representative with obvious regional advantages [13]. The region is characterized by a marine monsoon climate with average precipitation and temperature of 1167 mm and 15.7 °C per year, respectively. The dominant tree species include Phyllostachys edulis, Cunninghamia lanceolata, Pinus thunbergii, Pinus massoniana, and Quercus acutissima. The farm was established in March 1950 and has 120 ha of Moso bamboo pure forest. The average DBH and bamboo heights are 8.13 cm and 13.37 m, and the average tree density is 3375 stems ha−1. The management of Moso bamboo forest includes cutting trees older than 6 years, digging out all bamboo shoots in the off-year, and selecting and digging out the shoots that cannot become trees in the on-year. Therefore, it is necessary to distinguish the on-year and off-year. The prominent understory species include Salvia prionitis, Oxalis corniculata, Carex breviculmis, Paederia cruddasiana, and Hedyotis chrysotricha.

Figure 1.
Location of the study area.
2.2. Experiment Design
Biomass Collection
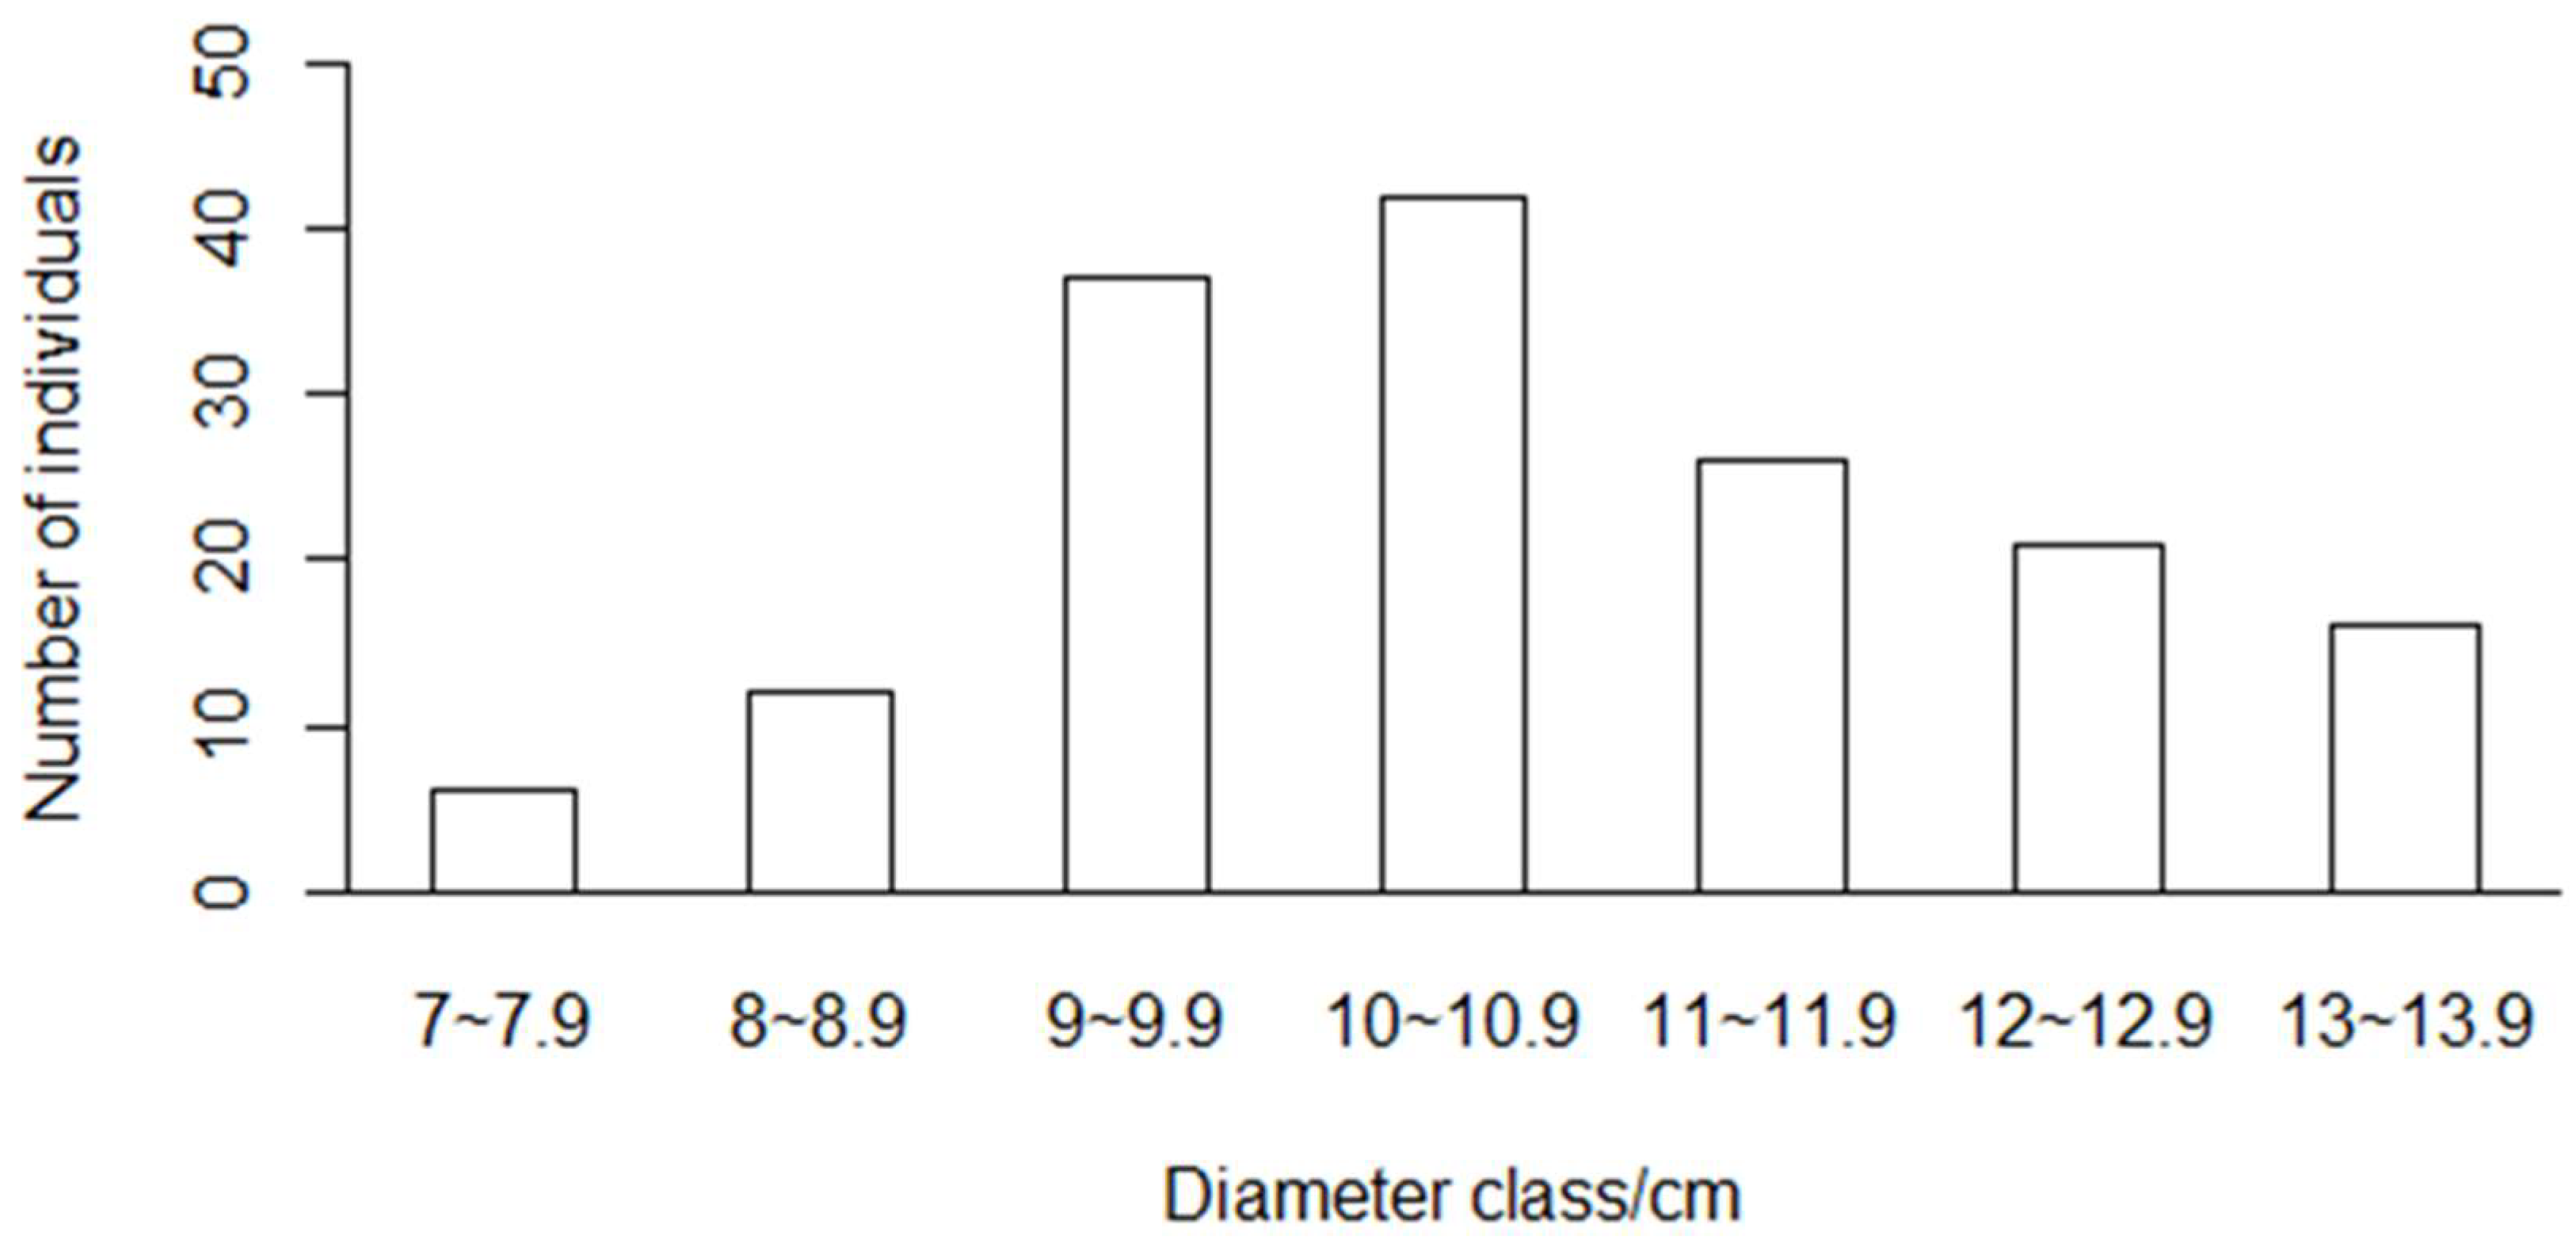
We chose the strong bamboo shoots without nearby shoot growth to avoid confusion between different bamboo shoot sheaths. We randomly selected and numbered 216 bamboo shoots with different diameters in Yixing forest farm and collected shedded sheaths daily. The sheaths of the same bamboo shoot were clamped together with clamps and labeled accordingly to record the numbering of the bamboo sheaths. The collected culm sheaths were brought back to the laboratory, dried to constant weight at 80 °C, and weighed and recorded with an electronic scale. The total biomass of the bamboo sheath of the same tree was calculated by Equation (1). Culm sheaths begin to shed from the bottom, falling off completely at about 40−50 days. However, the culm tips of some bamboo were broken by strong winds, and the shoot sheath biomass of 160 new trees was collected. The DBH, H, and IL were measured after the sheath was exfoliated. Multicollinearity among independent variables was verified by applying the variance inflation factor (VIF) test, and no multicollinearity was found among the independent variables included (VIF < 5). The distribution of new bamboo trees in DBH is provided in Figure 2, and the descriptive statistics of Moso bamboo shoot sheath biomass modeling variables are listed in Table 1.
where W is the total dry weight of shoot sheath biomass of a single bamboo tree, and is the dry weight of shoot sheath collected on day i; i = 1, 2, 3, 4…n.
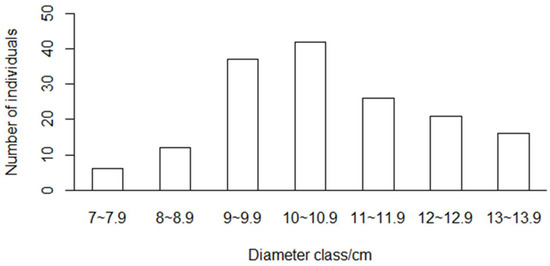
Figure 2.
Distribution of diameter classes of new bamboo trees.

Table 1.
The descriptive statistics of Moso bamboo shoot sheath biomass modeling samples.
2.3. Analysis Methods
2.3.1. Selection of Biomass Model
As a form of the allometric growth equation, the power function is often used to estimate biomass. The unary model used DBH as the variable (W1). Binary models (W2)~(W5) and ternary model (W6) used DBH, H, and IL as the variables.
where and are the regression parameters of the model.
These models generally have heteroscedasticity; therefore, logarithmic transformation or weighted regression is usually used to eliminate the influence of heteroscedasticity when solving model parameters [24,25]. Many correction factors have been proposed in logarithmic regression models [24,26]. The correction factor adopted in this study used (where s is the standard deviation of regression estimation), which is based on the characteristics of logarithmic transformation [27]. The estimated biomass model can be expressed as:
where .
2.3.2. Error Structure Analysis
Xiao et al. [28] proposed the use of likelihood analysis to test the error structure of power functions. The likelihood value of the nonlinear additive error structure is shown in Equation (14).
where xi is the independent variable (including DBH, H, IL), yi is the dependent variable, and a, b, and are the regression parameters of the model. In a log-transformed linear model, the correction factor is introduced into the logarithmic transformation implicit model [29]. The likelihood value of the logarithmic transformation linear multiplication error structure is shown in Equation (15).
Since the log-converted data is not on the same scale as the original data, the likelihood value of log-converted data must be divided by y [29], and the likelihood value is calculated by Equation (16).
The Akaike information criterion (AICc) [30] of each model was calculated according to Equation (17).
where n is the number of samples, k is the number of parameters, and L is the likelihood function for each equation. Akaike’s information criterion of the linear regression model with logarithmic transformation is given as . Akaike’s information criterion of the nonlinear regression model is . If , it indicates that the error term of the power function is favored additive, and the result from Equations (2)–(7) should be processed. If , it indicates that the error term of the power function is favored multiplicative, and the result from Equations (8)–(13) should be processed.
2.3.3. Model Evaluation and Validation
In this study, we used all samples to fit biomass equations. The five statistics of each equation were used to evaluate the fitting performance (the adjusted coefficient of determination (R2adj) and root mean square error (RMSE)) and the predictive performance (mean prediction error (MPE), mean absolute percent error (MAPE), and average system error (ASE)). The formulae are as follows:
2.4. Nutrient Measurement
We blended all the sheaths shed by a tree; the sheaths were dried, crushed, and sieved through a 100-mesh sieve. Five trees were selected from each diameter class to test nutrient elements, and 35 samples were tested in this study. The total carbon (TC) and total nitrogen (TN) were determined using an elemental analyzer (Costech ECS 4024 CHNSO, Picarro, Italy). Total phosphorus (TP) content was determined following the molybdenum–antimony resistance colorimetric method (concentrated H2SO4-HClO4) using an automatic chemical analyzer (Smartchem 300, AMS, Italy). Total potassium (TK) content was determined by a flame photometer (M410, Sherwood, UK).
2.5. Decomposition Feature Calculation
In May 2020, 40 litter bags with an aperture of 2 mm were randomly placed on the surface of the survey area. One sheath was placed in each decomposition bag and the dried weight was recorded as the initial value. Simultaneously, we placed a section of PVC pipe in the bag and assigned a number. Every three months, 10 bags were recycled by washing and then oven drying at 80 °C to maintain constant weight in order to obtain the remaining dry mass. The Olson litter decomposition index model was adopted to calculate the decomposition rate [31].
where M0 is the initial dry mass of litters, Mt is the remaining dry mass decomposed at time t, a is a fitting parameter, k is the litter decomposition coefficient, and t0.5 and t0.99 represent the time required to decompose 50% and 99%, respectively [21].
3. Results
3.1. Biomass Estimation
Models (2)~(7) and (8)~(13) were fitted using linear and nonlinear regression in R, respectively, and the parameter estimation and of each model were obtained. Based on Equations (14) and (16), the likelihood values ( and ) of nonlinear additive error structures and logarithmic transformation linear multiplication error structures were respectively calculated. The AICc of each model was calculated according to Equation (17), and the results are shown in Table 2, where the AICcnorm for shoot sheath biomass was higher than AICclgn, and the of six models was >2. Therefore, it could be considered that the error structure of the Moso bamboo sheath biomass model was multiplicative, and that logarithmic transformation linear regression should be used for fitting analysis.
Table 2.
Statistics of likelihood analysis for the error structure of shoot sheath biomass models of Moso bamboo.
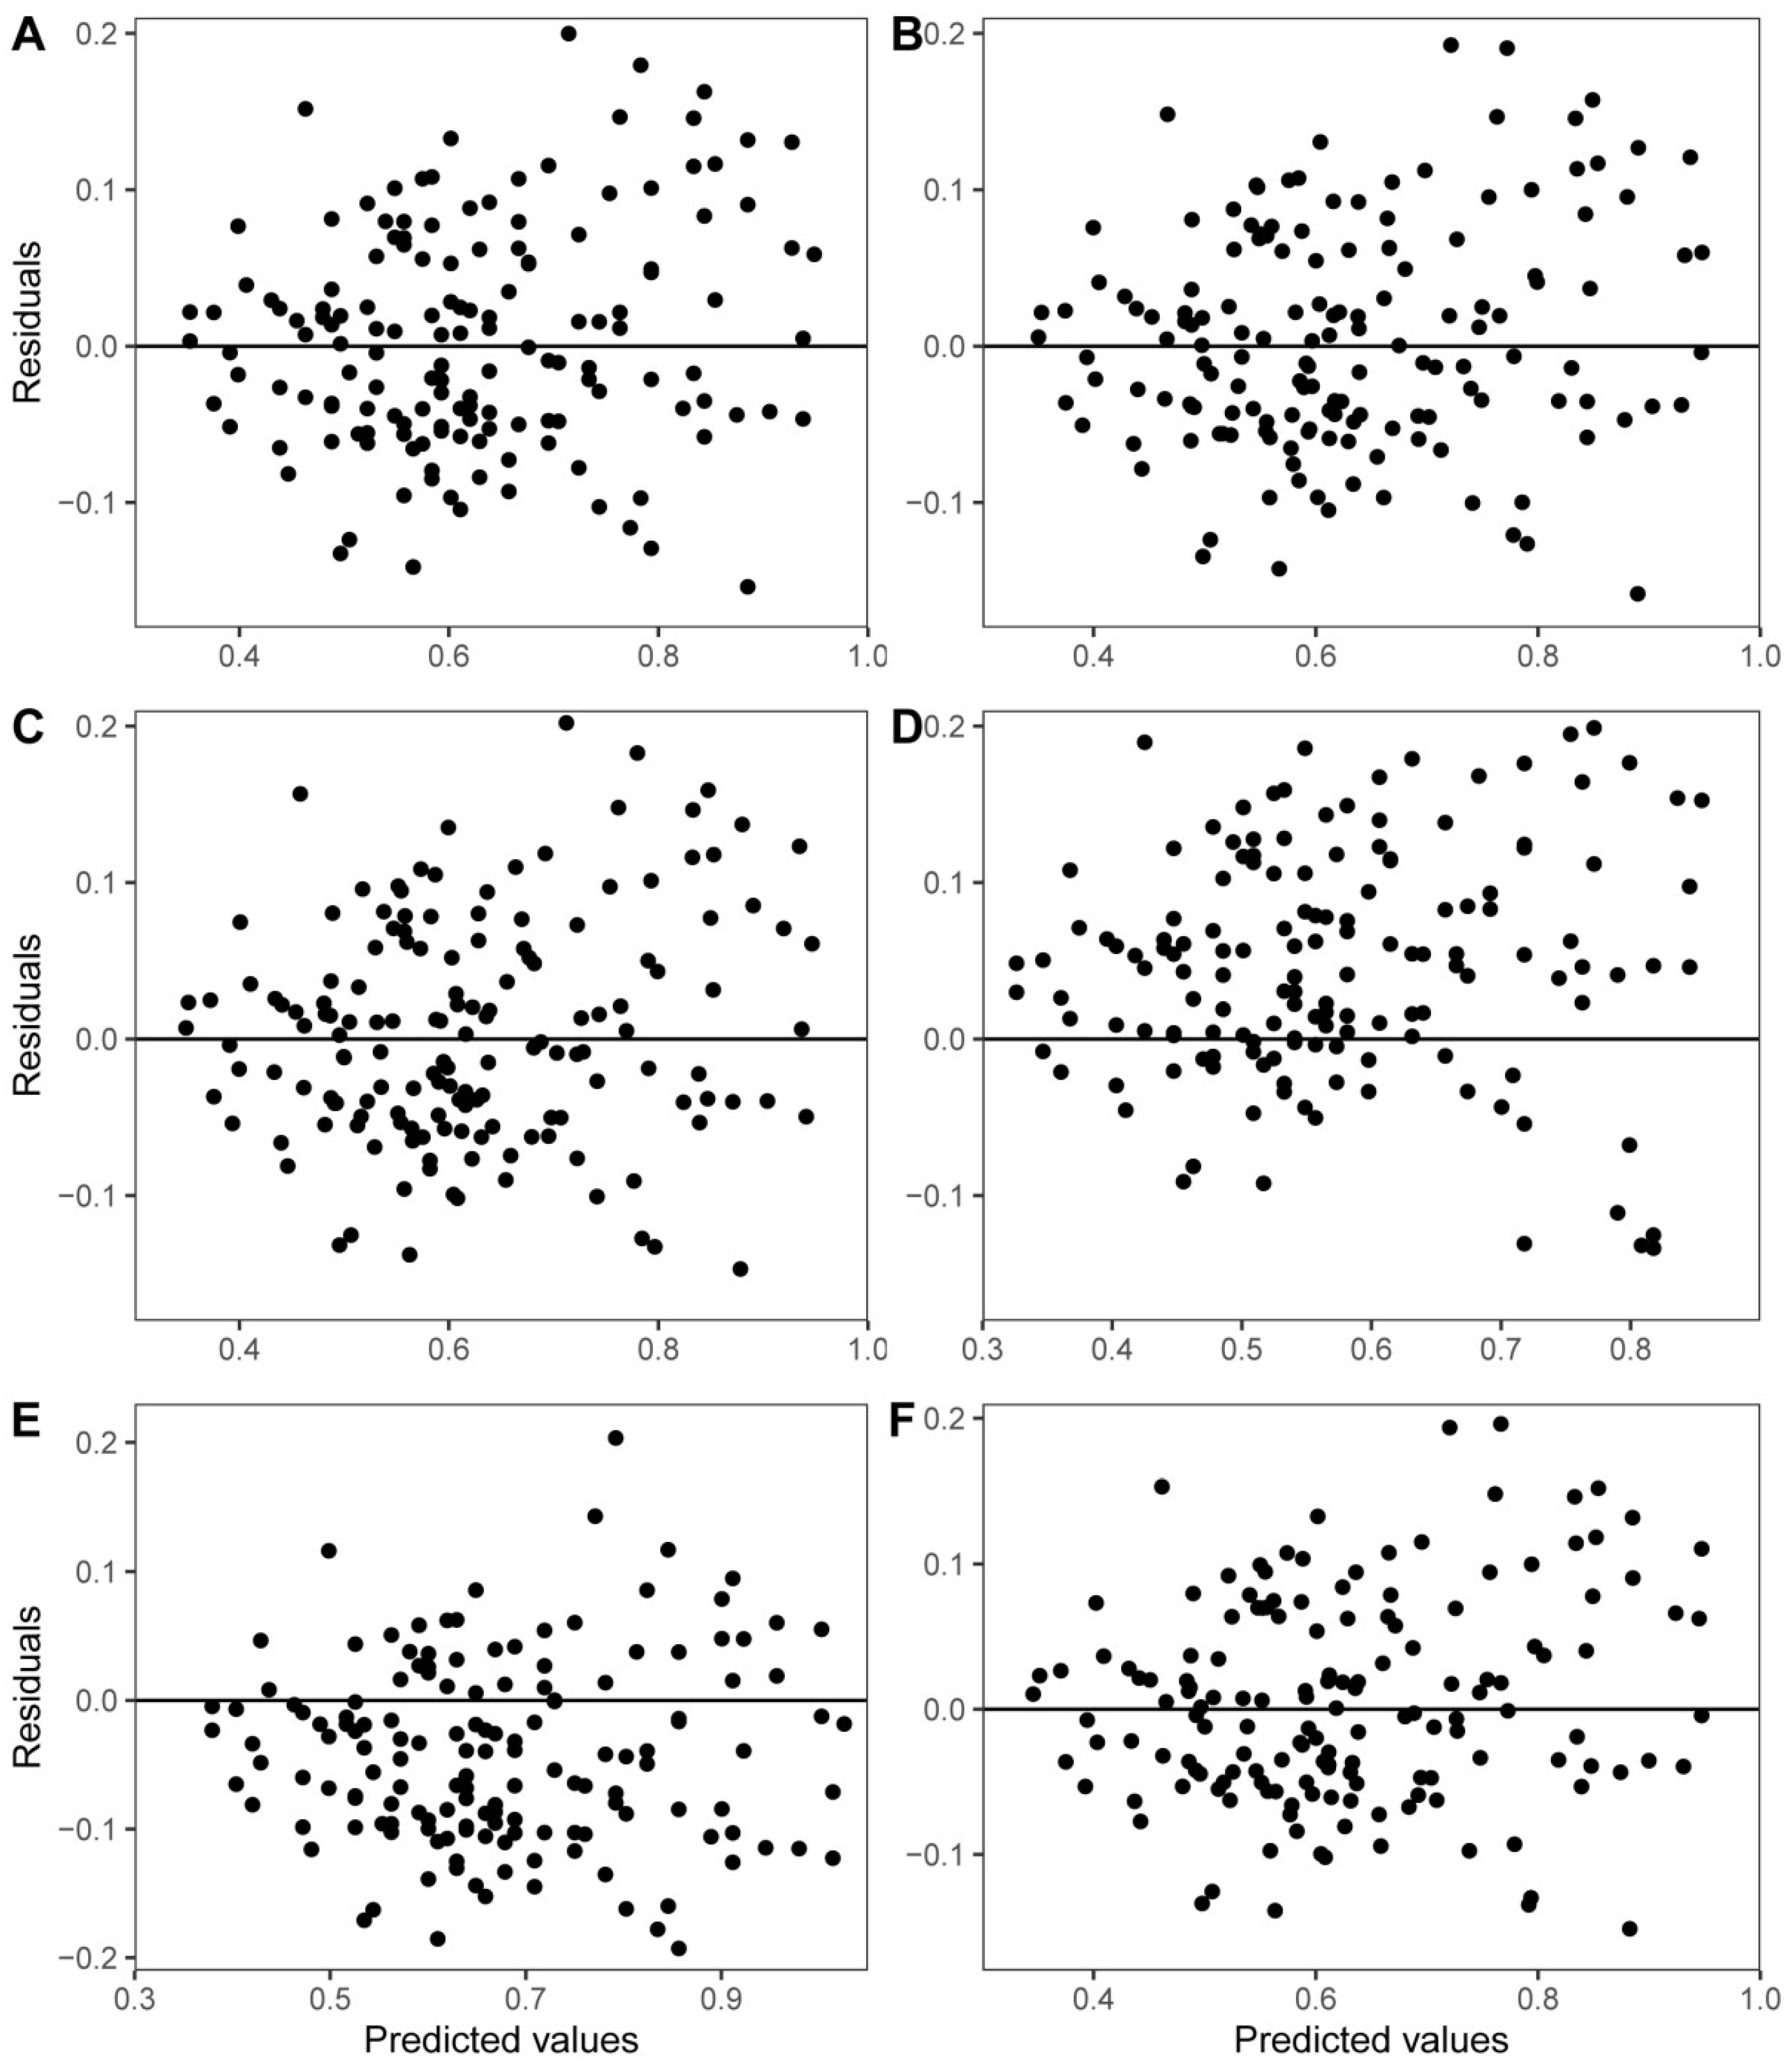
The fitting parameters and statistical test results of each model are shown in Table 3. The results show that the absolute t-test values of the fitting parameters of the six models were >2, indicating that the fitting parameters were stable. The adjusted coefficient of determination of all biomass models was >0.75. By comparing the R2adj of each model, model W6 was the best, followed by model W3. The ASE was within 2%, indicating a good fitting effect. In addition, Figure 3 shows that the residual distribution was approximately random.
Table 3.
Fitting parameter estimates and statistics for log-transformed regression model of shoot sheath biomass.
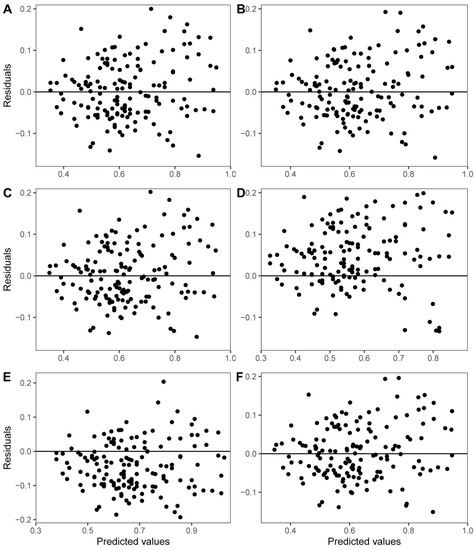
Figure 3.
Residuals plots of W1 (A), W2 (B), W3 (C), W4 (D), W5 (E), and W6 (F) of Moso bamboo shoot sheaths.
3.2. Shoot Sheath Nutrients
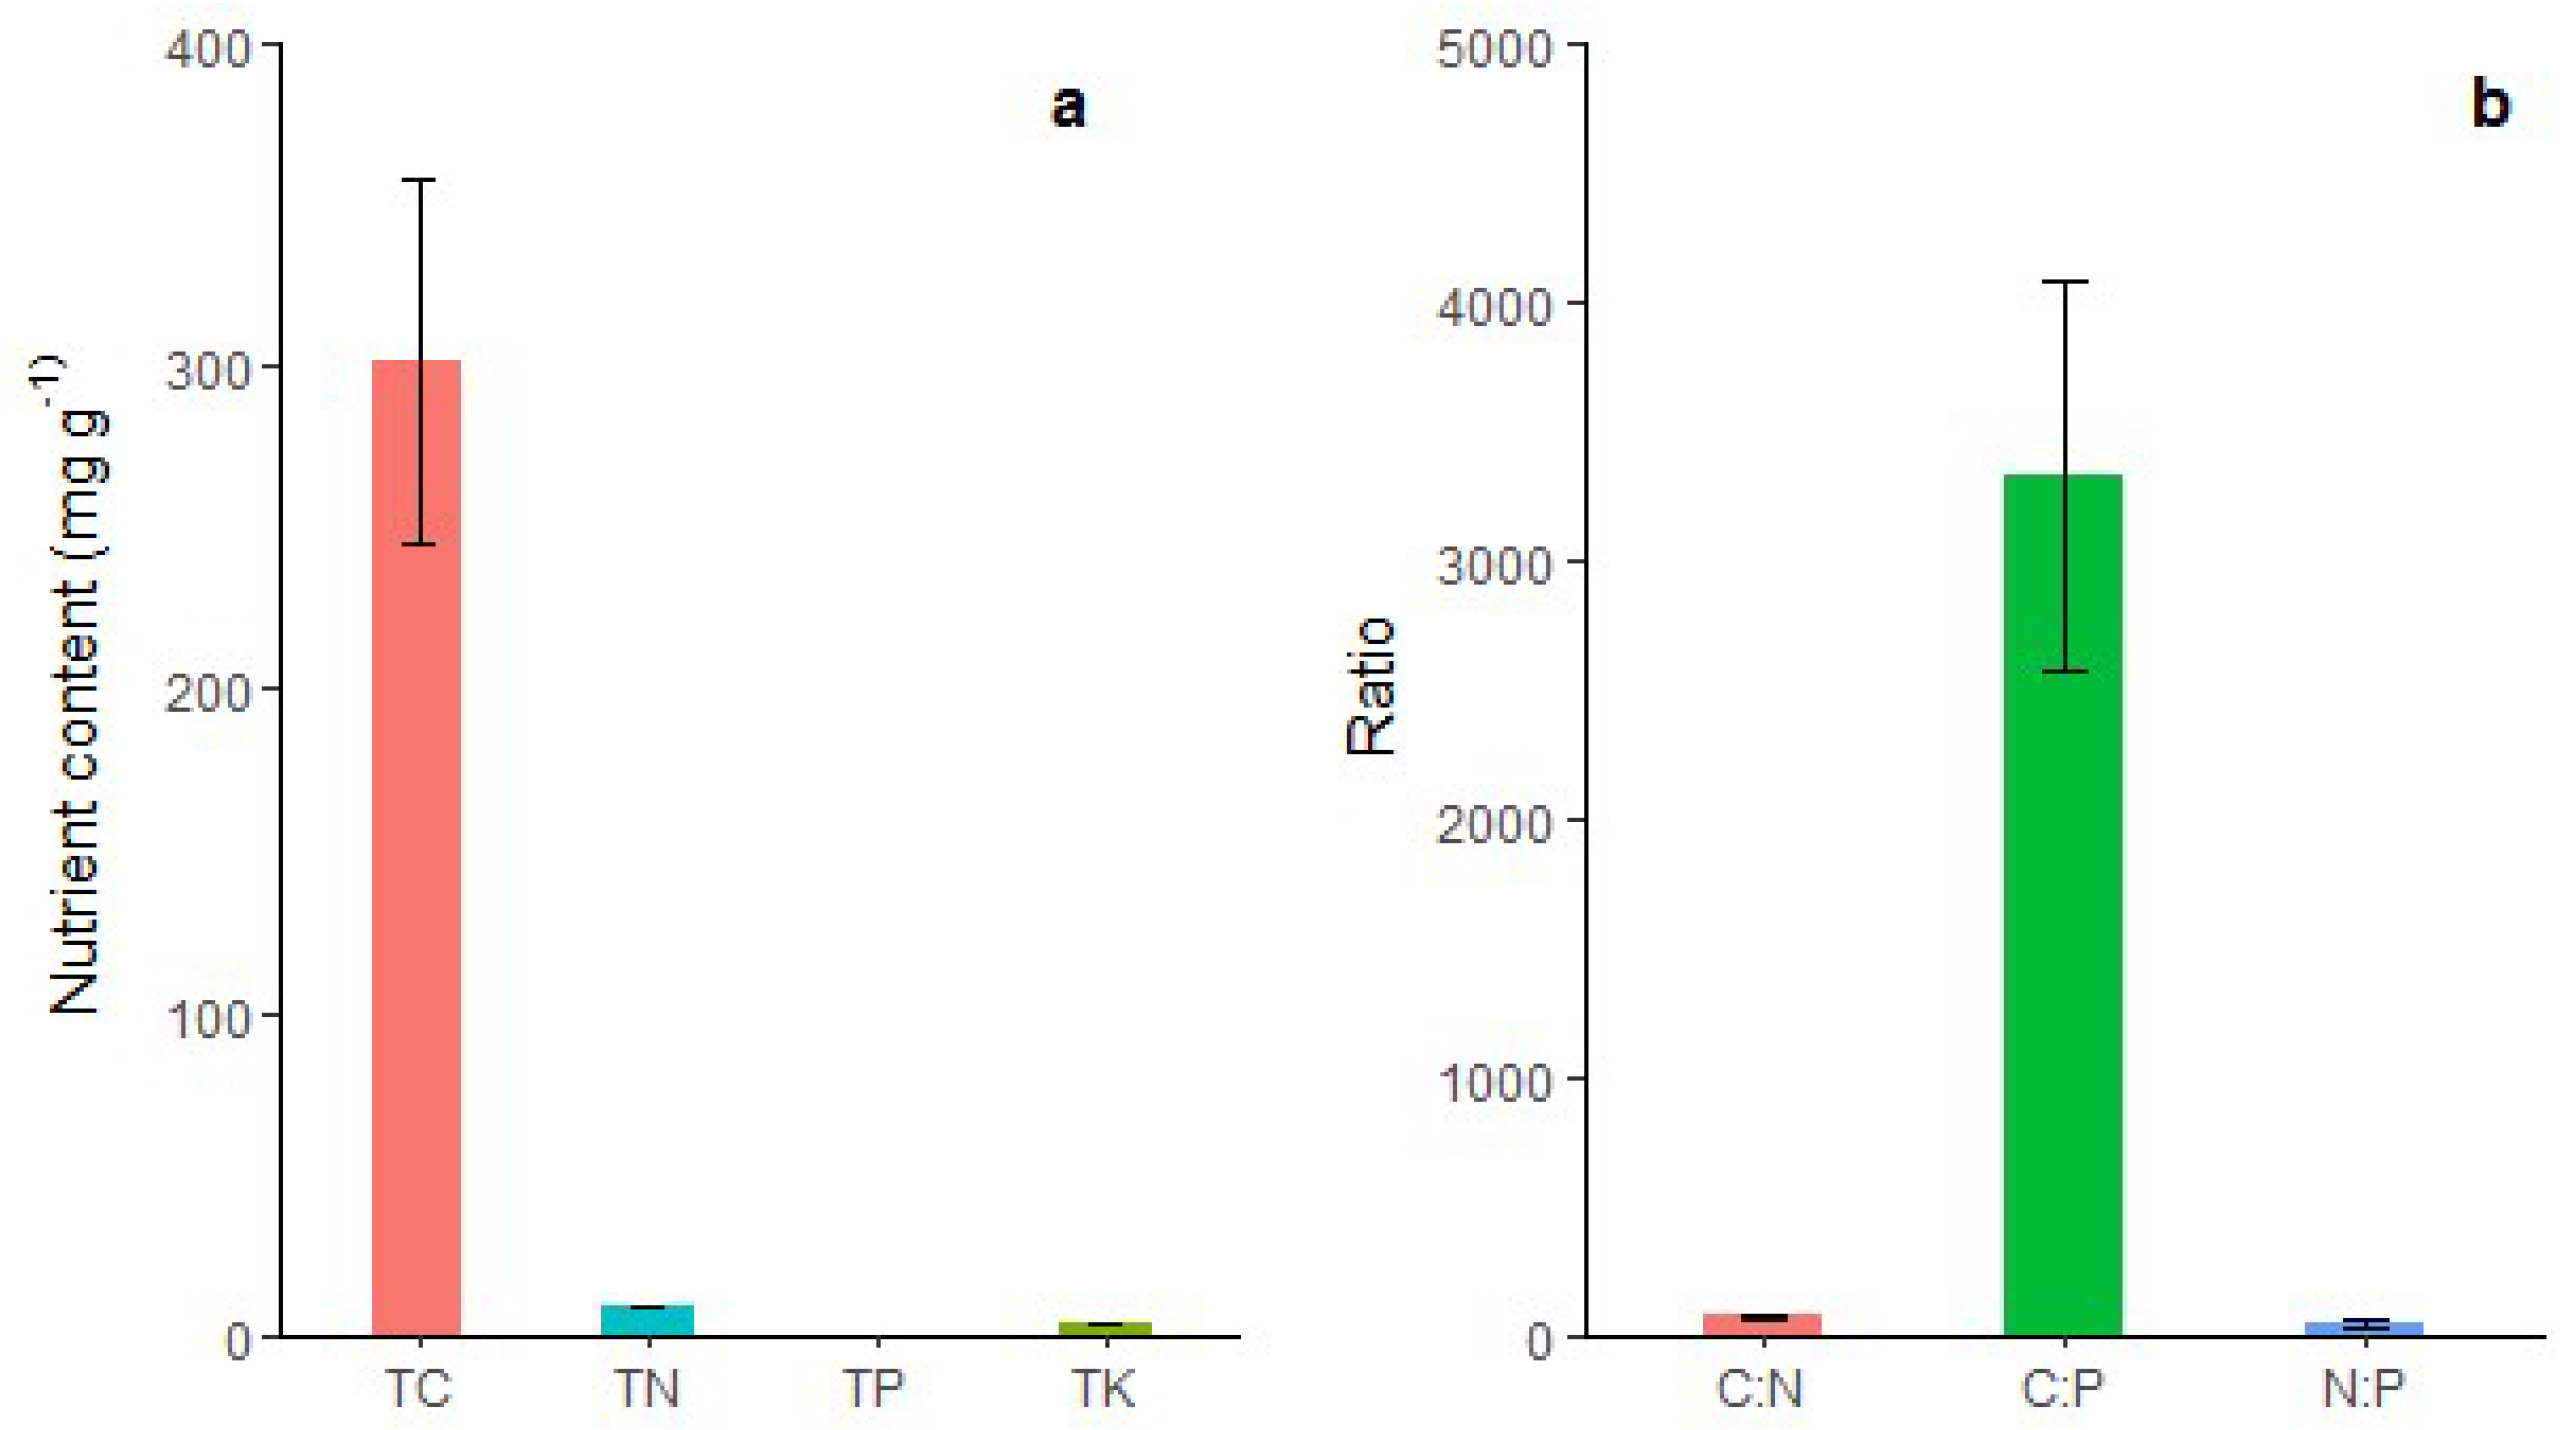
As shown in Figure 4, the accumulation of C in shoot sheaths was the highest (302.13 g/kg), followed by N (8.82 g/kg), K (4.24 g/kg), and P (0.09 g/kg).
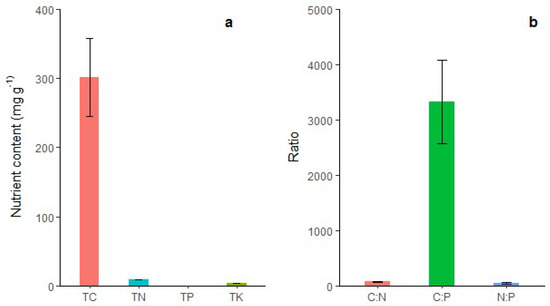
Figure 4.
(a) Total carbon (TC), total nitrogen (TN), total phosphorus (TP), total potassium (TK); and (b) carbon/nitrogen ratio (C:N), carbon/phosphorus ratio (C:P), and nitrogen/phosphorus ratio (N:P) of shoot sheaths in Moso bamboo forest. The error bars indicate the standard deviation (SD). The labels are the mean values of each parameter.
3.3. Shoot Sheath Decomposition
As shown in Table 4, Olson’s exponential equation could satisfactorily simulate the decomposition process of culm sheaths (R2 = 0.985). The decomposition of 50% of the sheath took 0.47 years, and 100% decomposition took 3.15 years.
Table 4.
Regression analysis between dry weight residue of litter and time.
4. Discussion
Shoot sheath is a major component of net primary or aboveground production. Because of the short growth time and the complexity of the biomass investigation of shoot sheaths, establishing a biomass model is the best approach. Most single-wood biomass models are fitted directly based on nonlinear functions or by logarithmic regression [32,33,34]. Previous studies have used the allometric model to estimate the individual biomass of Populus nigra [32], Cunninghamia lanceolata [33], and Phyllostachys edulis [34]. However, there is still controversy as to which model-fitting method should be adopted. Thus, likelihood analysis has been widely used to study the error structure of the forest biomass model [28]. As a tool for evaluating the error structure of biomass equations, likelihood analysis proposes to select the appropriate model form for given biomass data [23]. Using Monte Carlo simulation, we can prove which method performs better: with nonlinear regression better characterizing data with homoscedastic, additive, normal error; and linear regression better characterizing data with heteroscedastic, multiplicative, and lognormal error [28]. Zeng (2011) established a single-tree biomass model of larch and Masson pine as an example and conducted a random resampling test through Monte Carlo simulation. The results showed that all samples were used to establish the model to minimize its prediction error [35]. The allometric biomass model of the shoot sheath in the bamboo forest established in this study used three combinations of variables; namely, bamboo height (H), diameter at breast height (DBH), and internode length of bamboo at breast height (IL). Notably, biomass is generally related to the DBH and height [33,34,35]. DBH and IL were easier to measure at the study site, so we prefer to use only the DBH and IL in developing allometric models of shoot sheath biomass. Shen (2020) used diameter at breast height, age, and internode length of bamboo at breast height as variables, which were all measured to determine the Moso bamboo stem biomass data based on three different allometric growth equations fitting bamboo stem biomass models. The likelihood estimation method, the error structure, the model fitting method, and the goodness of fit and forecast accuracy of comparative analysis were determined and found to be suitable for a Moso bamboo stem biomass model of Zhejiang province [35]. Compared with the unary biomass model with diameter at breast height as the independent variable, the goodness of fit and prediction accuracy of the binary and ternary models were improved to some extent after introducing the variables bamboo age and internode length of bamboo at breast height [35]. Contrary to our results, the goodness of fit and prediction accuracy of the binary model and the ternary model did not improve after introducing diameter at breast height and internode length of bamboo at breast height variables. On the one hand, the difference in bamboo height was small. On the other hand, the dry weight of a single bamboo sheath increased first and then decreased, with the increase of bamboo height reaching the highest at DBH and the lowest at the bamboo tip. Besides, shoot sheath detachment lasts about 40–50 days from beginning to the end, during which the experiment is mainly affected by the weather. In this study, 56 bamboo plants were blown off by strong winds. This resulted in a mixture sheaths shed by different individual trees, which could be distinguished by size and color. However, the possibility of omissions still exists and may lead to errors in the statistical biomass results. The selection of parameters to construct the biomass model mainly needs to consider that sheaths are closely related to the biomass and are easy to measure. The DBH, IL, and H of Moso bamboo did not change after the completion of the first year [36]. This growth feature provided the possibility of investigating the biomass information of the shoot sheaths of old bamboo.
However, our study did not solve a biomass model of the shoot sheaths in wind-felled trees because the diameter and internode length at DBH showed a changing increasing and decreasing trend from bottom to top, and the wind-felled height was also different. Moreover, the wind-blown effect on trees is significant (25.93%); thus, this study suggests that the nutrient return ability of trees that cannot continue to grow due to environmental factors should not be ignored. In addition, Moso bamboo is affected by diseases and insect pests in the process of growth, leading to the possibility of irregular DBH and IL growth. However, DBH, IL, and H parameters were needed in our biomass model, which required additional analysis and statistics for trees affected by diseases, insect pests, and environmental disturbance. In our study area, the average tree density was 3375 stems ha−1. We used W3 to estimate the biomass of bamboo sheaths which reached 2193.75 kg/ha. High biomass means the nutrient content cannot be ignored. The nutrient contents of C, N, P, and K were 662.51 kg/ha, 19.35 kg/ha, 0.2 kg/ha, and 9.3 kg/ha, respectively. In particular, the proportion of C in the dry biomass in shoot sheaths reached 25.99–38.49%. The results were inconsistent with those of shoot sheath nutrients of the winter shoots in Huangshan, Anhui Province [10]. The nutrient content of a shoot sheath is the result of many variables, including forest type (including species or combinations of species), geographical location, stand age, and total stand area. To test nutrient content, we mixed the leaf sheaths of the same tree species into a composite sample. Shoots cannot photosynthesize before they mature into bamboo, and the nutrients needed can only be transmitted by the mother plant through the underground whip roots [37]. Nutrient resorption is a way to provide nutrients to the developing tissue instead of the soil [38]. In a study of bamboo leaves, it was found that the nutrient utilization efficiency was increased by nutrient transport before shedding [39]. Therefore, nutrient reabsorption and higher transport efficiency may exist in the process of culm sheath shedding. However, this needs further study for verification.
Bamboo sheath collection is also difficult because of the rapid decomposition rate. Litter decomposition is an important process of nutrient cycling in the bamboo forest ecosystem [40]. In this study, shoot sheath litter bags were left on the surface to ensure that environmental factors were as consistent as possible. However, the presence of decomposition bags may block the effect that some large animals have on decomposition [41]. Our results found that the decomposition rates (T95% ranging from 3.00 to 3.30 years) of shoot sheaths was lower than that of leaf litters in a Moso bamboo forest (T95% ranging from 6.77 to 9.40 years) investigated by Liu (2011) in Fujian [18]. Overall, the decomposition rate of culm sheaths was related to the substrate quality [40]. This suggests that N concentration positively affects the decomposition rate in the early stages of decomposition [40]. In contrast, in the advanced stages of decomposition, N concentration has a negative effect because N binds with lignin to form extremely decomposition-resistant compounds [42]. Tu (2014) studied litter decomposition in two subtropical bamboo ecosystems in Southwest China and found that the remaining mass decomposition was significantly explained by the initial C/N ratio [40].
It was found that the soil conditions in the pure forest were lower than that in the mixed forest, which reflected the trend of degradation of soil fertility [43]. In fact, the degradation did not have a serious impact on stand growth. However, this phenomenon can be exposed in long-term practice. Knowledge about the productivity, nutrient content, and decomposition rate of bamboo sheaths can provide a more comprehensive understanding of the nutrient flow state of the bamboo ecosystem. This, in turn, can help formulate reasonable management measures.
5. Conclusions
This paper presents a case study on the Moso bamboo forest in Yixing forest farm, Jiangsu province, and analyzes shoot sheath biomass by daily collected samples. Based on the allometric growth equation, using DBH, IL, and H as independent variables, six models were selected to establish the biomass of shoot sheaths using all samples. The model error structure analysis found that was >2, indicating multiplicative error. Thus, the log-transformed model fit the shoot sheath biomass model. Our results showed that the absolute values of t-value were >2, demonstrating that all models were preferable. The adjusted coefficient of determination of each model was >0.75. From the perspective of practical application, model W3 fitting DBH and IL was determined. The order of the elements in the shoot sheath was C > N > K > P. Decomposition tests showed that it took 0.47 years for 50% of the sheaths to decompose and 3.15 years for all sheaths to decompose. Although our study did not exclude the errors associated with environmental factors and individual differences on the biomass of shoots sheath, it can provide a theoretical basis for the sustainable management of bamboo forest in Yixing Forest Farm.
Author Contributions
S.F. and F.G. designed this study and improved the English language and grammatical editing. Y.Z. wrote the first draft of manuscript and performed the data analysis. Y.Z. and X.Y. did the field works. L.H. gave guidance and methodological advice. All the coauthors contributed to the discussion, revision and improvement of the manuscript. All authors have read and agreed to the published version of the manuscript.
Funding
Basic Scientific Research Funding of International Center For Bamboo and Rattan (1632021009).
Conflicts of Interest
The authors declare no conflict of interest.
References
- FAO. Global Forest Resources Assessment 2010: Main Report; Food and Agriculture Organization of the United Nations: Rome, Italy, 2011. [Google Scholar]
- National Forestry and Grassland Administration. China Forest Resources Report; China Forest Publishing House: Beijng, China, 2019. [Google Scholar]
- Tang, X.; Qi, L.; Fan, S.; Guan, F.; Zhang, H. Soil respiration and net ecosystem production in relation to intensive management in Moso bamboo forests. Catena 2016, 137, 219–228. [Google Scholar] [CrossRef]
- Jiang, Z.H. Bamboo and Rattan in the World; China Forest Publishing House: Beijng, China, 2007. [Google Scholar]
- Fisher, R.F.; Dan, B. Ecology and Management of Forest Soils; John Wiley: Chichester, UK, 2000. [Google Scholar]
- Turner, J.; Lambert, M. Analysing inter-rotational productivity and nutrition in a New South Wales radiata pine plantation. New For. 2013, 44, 785–798. [Google Scholar] [CrossRef]
- Tian, D.; Xiang, W.; Kang, W. Study on biological cycling of microelements in pinus massoniana plantations. Sci. Silvae Sin. 2003, 4, 1–8. (In Chinese) [Google Scholar]
- Gholz, H.L.; Perry, C.S.; Cropper, W.P.; Hendry, L.C. Litterfall, decomposition, and nitrogen and phosphorus dynamics in a chronosequence of slash pine (Pinus elliottii) plantations. For. Sci. 1985, 31, 463–478. [Google Scholar] [CrossRef]
- Huang, G.; Zhao, H.; Li, Y. Litter decomposition in hyper-arid deserts: Photodegradation is still important. Sci. Total Environ. 2017, 601–602, 784–792. [Google Scholar] [CrossRef]
- Roman, K.; Barwicki, J.; Hryniewicz, M.; Szadkowski, J. Production of electricity and heat from biomass wastes using a converted aircraft turbine AI-20. Processes 2021, 9, 364. [Google Scholar] [CrossRef]
- Su, W. Fertilization Theory and Practice for Phyllostachys Edulis Stand Based on Growth and Nutrient Accumulation Rules; Chinese Academy of Forestry: Beijing, China, 2012. (In Chinese) [Google Scholar]
- Li, L.; Li, N.; Lu, D.; Chen, Y. Mapping Moso bamboo forest and its on-year and off-year distribution in a subtropical region using time-series Sentinel-2 and Landsat 8 data. Remote Sens. Environ. 2019, 231, 111265. [Google Scholar] [CrossRef]
- Zheng, Y.; Guan, F.; Fan, S.; Zhou, Y.; Jing, X. Functional trait responses to strip clearcutting in a Moso bamboo forest. Forests 2021, 12, 793. [Google Scholar] [CrossRef]
- Wang, C. Biomass allometric equations for 10 co-occurring tree species in Chinese temperate forests. For. Ecol. Manag. 2006, 222, 9–16. [Google Scholar] [CrossRef]
- Hong, W.; Zheng, Y.; Chen, L. Study on biomass models of branches and leaves of phyllostachys heterocycla cv.pubescens. Sci. Silvae Sin. 1998, 34, 11–15. (In Chinese) [Google Scholar] [CrossRef]
- Zhou, G. Carbon Storage, Fixation and Distribution in Mao Bamboo (Phyllostachys pubescens) Stands Ecosystem. Ph.D. Thesis, Zhejiang University, Hangzhou, China, 2006. [Google Scholar]
- Tian, Y. Study on the Biomass of Different Origins in Moso Bamboo Base on Fertilizer Regulation. Ph.D. Thesis, Jiangxi Agricultural University, Jiangxi, China, 2011. [Google Scholar]
- Shen, Q. Study on the Site Classification and Site Quality Evaluation of Phyllostachys edulis Forests in Zhejiang Province. Ph.D. Thesis, Zhejiang A&F University, Hangzhou, China, 2019. [Google Scholar]
- Liu, G.; Fan, S.; Guan, F.; Du, M.; Guo, B. Effects of different proportion mixed Phyllostachys pubescens leaf litter on litter decomposition in P. pubescens forest. Chin. J. Ecol. 2011, 30, 1598–1603. (In Chinese) [Google Scholar] [CrossRef]
- Ren, L.; Liu, S.; Wang, Y.; Cai, C.; Luan, J.; Chen, C. Decomposition characteristics of litter of phyllostachys edulis and dicranopteris pedata. For. Res. 2018, 31, 91–97. (In Chinese) [Google Scholar] [CrossRef]
- Song, X.; Jiang, H.; Ma, Y.; Yu, S.; Zhou, G.; Peng, S.; Dou, R.; Guo, P. Litter decomposition across climate zone in Eastern China: The integrated influence of climate and litter quality. Acta Ecol. Sin. 2009, 29, 5219–5226. [Google Scholar] [CrossRef]
- Su, W.; Feng, H.; Fan, S.; Xu, Q.; Zhou, J.; Yang, S. Dynamic changes and accumulation rules of N, P and K contents in winter shoot of phyllostachys edulis. For. Res. 2013, 26, 252–256. (In Chinese) [Google Scholar] [CrossRef]
- Ni, H.; Su, W.; Fan, S.; Zeng, X.; Jin, Y. Advances in research for responses of soil nutrient cycling to the changes of soil nutrient input processes in forest ecosystems. Chin. J. Ecol. 2019, 38, 863–872. (In Chinese) [Google Scholar] [CrossRef]
- Baskerville, G.L. Use of logarithmic regression in the estimation of plant biomass. Can. J. For. Res. 1972, 2, 49–53. [Google Scholar] [CrossRef]
- Parresol, B.R. Additivity of nonlinear biomass equations. Can. J. For. Res. 2001, 31, 865–878. [Google Scholar] [CrossRef]
- Snowdon, P. A ratio estimator for bias correction in logarithmic regressions. Can. J. For. Res. 1991, 21, 720–724. [Google Scholar] [CrossRef]
- Zeng, W.; Tang, S. Bias correction in logarithmic regression and comparison with weighted regression for nonlinear models. For. Res. 2011, 24, 137–143. (In Chinese) [Google Scholar] [CrossRef]
- Xiao, X.; White, E.P.; Durham, H.S.L. On the use of log-transformation vs. nonlinear regression for analyzing biological power laws. Ecology 2011, 92, 1887–1894. [Google Scholar] [CrossRef] [Green Version]
- Ballantyne, F. Evaluating model fit to determine if logarithmic transformations are necessary in allometry: A comment on the exchange between Packard (2009) and Kerkhoff and Enquist (2009). J. Theor. Biol. 2013, 317, 418–421. [Google Scholar] [CrossRef]
- Ma, Y.; Jiang, L. Error structure and variance function of allomatric model. Sci. Silvae Sin. 2018, 54, 90–97. (In Chinese) [Google Scholar] [CrossRef]
- Burnham, K.P.; Anderson, D.R. Model Selection and Multimodel Inference: A Practical Information-Theoretic Approach; Springer: New York, NY, USA, 2002; Volume 2. [Google Scholar]
- Olson, J.S. Energy storage and the balance of producers and decomposers in ecological systems. Ecology 1963, 44, 322–331. [Google Scholar] [CrossRef] [Green Version]
- Dong, L.; Zhang, L.; Li, F. A compatible system of biomass equations for three conifer species in Northeast, China. For. Ecol. Manag. 2014, 329, 306–317. [Google Scholar] [CrossRef]
- Dong, L.; Zhang, L.; Li, F. Error structure and additivity of individual tree biomass model. Sci. Silvae Sin. 2015, 51, 28–36. [Google Scholar] [CrossRef]
- Shen, Q.; Tang, M. Stem volume models of phyllostachys edulis in Zhejiang Province. Sci. Silvae Sin. 2020, 56, 89–96. [Google Scholar]
- Zeng, W.; Tang, S. Goodness evaluation and precision analysis of tree biomass equations. Sci. Silvae Sin. 2011, 47, 106–113. (In Chinese) [Google Scholar] [CrossRef]
- Su, W.; Fan, S.; Zhao, J.; Cai, C. Effects of various fertilization placements on the fate of urea-15N in moso bamboo forests. For. Ecol. Manag. 2019, 453, 117632. [Google Scholar] [CrossRef]
- Johnson, D.W.; Turner, J. Nutrient cycling in forests: A historical look and newer developments. For. Ecol. Manag. 2019, 444, 344–373. [Google Scholar] [CrossRef]
- Wen, G.; Jian, Z.; Lianghua, Q.; Ze’an, S.; Rui, W.; Chang, Y. Leaf functional traits and influencing factors of Phyllostachys edulis and its varieties. J. For. Environ. 2020, 40, 260–268. [Google Scholar] [CrossRef]
- Tu, L.-H.; Hu, H.-L.; Hu, T.-X.; Zhang, J.; Li, X.-W.; Liu, L.; Xiao, Y.-L.; Cheng, G.; Li, R.-H. Litterfall, litter decomposition, and nutrient dynamics in two subtropical bamboo plantations of China. Pedosphere 2014, 24, 84–97. [Google Scholar] [CrossRef]
- Luan, J.; Liu, S.; Joann, S.L.; Whalen, K.; Wang, Y.; Wang, J.; Liu, Y.; Dong, W.; Chang, S.X. Functional diversity of decomposers modulates litter decomposition affected by plant invasion along a climate gradient. J. Ecol. 2020, 109, 1236–1249. [Google Scholar] [CrossRef]
- Berg, B.; Mcclaugherty, C. Plant Litter. Decomposition, Humus Formation, Carbon Sequestration; Springer: New York, NY, USA, 2013; p. 286. [Google Scholar]
- Zhang, M.M.; Fan, S.H.; Guan, F.Y.; Yan, X.R.; Yin, Z.X. Soil bacterial community structure of mixed bamboo and broad-leaved forest based on tree crown width ratio. Sci. Rep. 2020, 10, 6522. [Google Scholar] [CrossRef] [PubMed] [Green Version]
Publisher’s Note: MDPI stays neutral with regard to jurisdictional claims in published maps and institutional affiliations. |
© 2021 by the authors. Licensee MDPI, Basel, Switzerland. This article is an open access article distributed under the terms and conditions of the Creative Commons Attribution (CC BY) license (https://creativecommons.org/licenses/by/4.0/).