1. Introduction
The increasingly unpredictable crises in the timber market and the growing risks associated with pursuing sustainable forestry practices in the face of climate warming and weather anomalies have forced forest management units (FMUs) to focus on the economic aspects and financial performance of forest holdings [
1,
2,
3,
4,
5]. Furthermore, under conditions of accelerating economic, social, and political globalization and given the growing demand for timber and other forestry products and services in European countries, FMUs need to optimize their decisions concerning forestry operations and analyze their profitability [
6,
7,
8,
9,
10]. Forest holdings face numerous challenges in the context of implementing sustainable forest management (SFM) [
11], such as nature conservation in forest areas [
12], ecosystem services [
13,
14] a biobased economy [
15] and forest certification [
16]. The efficiency of forest management is also influenced by climate change and the increasing risk of damage caused by winds, draughts, and insect outbreaks [
17,
18]. Other significant factors include the organizational system and level of development of forest districts and forest service companies as well as the technologies used by them [
19]. These determinants also impact the financial management of forest holdings, which differs considerably from that of other economic entities, such as public sector organizations and state-owned enterprises and private companies. The lack of close correlations between the efforts undertaken and their effects leads to disproportions between expenditures on production and the value of the obtained timber or other forest products [
20]. The financial and accounting systems of forest holdings are shaped by the specific natural and economic determinants of forestry production [
21,
22]. Discrepancies between the production cycle of forest stands and the timing of labor inputs make it difficult to determine the financial outcomes of annual forestry operations [
23]. It should also be noted that in addition to harvesting timber State Forests holdings, which pursue SFM, play a major role in delivering crucial public services, such as the conservation of biodiversity as well as water and soil resources [
24,
25,
26]. Non-production forest functions, critical to modern societies and provided free of charge in Poland, entail a financial burden on forest holdings functioning under different natural conditions, which affects their profitability and ability to deliver those functions.
Forest holdings operate under varied natural and economic conditions, which influence the scale of their production, financial outlays, and forest management methods [
27,
28,
29,
30]. This means that FMUs operating under favorable conditions gain additional economic benefits in the form of a differential rent, while those operating under less favorable conditions are deprived of such benefits and may struggle to self-finance. Of importance is also the size of forest holdings, as the larger ones enjoy economies of scale due to the lower unit costs of forest management and timber production. It is easier and more profitable for large holdings to integrate forest policy goals with their management objectives as well as conduct forest investment projects, implement technological advances in practice, and take advantage of knowledge and innovation. In turn, the parcelization of forest holdings is problematic in the context of efficient management of forest resources, their productivity, and financial results [
31,
32].
Numerous authors have researched the economic and financial aspects of forest management, including the optimization of species composition, stand age structure, production cycle, regeneration methods, and timber harvesting and skidding [
33,
34,
35,
36,
37,
38,
39]. Callaghan et al. [
40] noted that while most management practices have a significant influence on economic efficiency, they differ depending on the region and forest type.
Comprehensive financial analysis involving capital, assets, financial results, and general financial performance is a tool that facilitates rational decision making [
10,
41,
42,
43,
44,
45]. The importance of such analysis increases with the degree of responsibility for the management of enterprises [
21]. As a result, from a managerial perspective, it is necessary to seek tools that may be helpful in evaluating and improving efficiency as well as identifying any inefficiencies of forest districts. The analysis of financial indicators (ratio analysis) assesses the performance of economic entities using specific measures of economic activity, but that an accurate interpretation of those indicators is of the essence [
46]. The number of financial indicators is practically unlimited, as indicators can be created as needed. The most popular of them are indicators of financial liquidity, profitability, economic activity and debt. Liquidity ratios measure a company’s ability to pay debt obligations. The debt ratio indicates the degree of debt financing. Efficiency ratios measure a company’s ability to use its assets and manage its liabilities effectively in the current period or in the short term. Profitability ratios reveal a company’s ability to earn a satisfactory profit and return on investment. Financial indicators can be compared over time and space, taking into account boundary conditions [
47,
48]. The need to monitor the finances of FMUs (in Poland SFNFH districts) is associated with the technically and organizationally challenging production conditions, and especially with the fundamental dependence of forest production on the natural environment, long production cycles, and the resulting need for long-term forecasting and planning of forest production [
49]. Given the confluence of complicated factors and determinants, analysis of the financial performance of forest districts, as well as cost analysis (which is the subject of a separate publication) are indispensable to maintain and improve the profitability of forestry production in the long-term. Some authors have applied ratio analysis to investigate the economic and financial problems of forest holdings [
50,
51,
52,
53].
The literature presents a variety of approaches to the measurement of technical and economic efficiency. The non-parametric approach concentrates on the regularity assumptions of the production possibility set [
54]. Data envelopment analysis (DEA) is a methodology extensively applied in measuring the relative efficiency of decision-making units with multiple inputs and outputs [
55,
56]. The free disposal hull (FDH) is an alternative deterministic, non-parametric model developed for the evaluation of productive efficiency. The DEA-based Malmquist productivity index (MPI) is a good tool for measuring the productivity change of DMUs at different periods of time. In the parametric approach it is assumed that the boundary of the production possibility set can be represented by a functional form with constant parameters [
54]. Parametric methods include the stochastic frontier approach (SFA), the distribution free approach (DFA), and the thick frontier approach (TFA). Finally, multiple criteria decision making (MCDM) is an alternative method of evaluation of technical efficiency.
Of interest is the financial performance of SFNFH districts, especially that they operate in varied natural conditions. The financial performance of forest districts and their position in the forestry sector can be evaluated by ratio analysis involving a set of liquidity, efficiency, and profitability indicators. Furthermore, comparative statistical methods may be deployed to construct aggregated indicators with a view to gaining more comprehensive insights. Both are useful in developing management strategies for State Forests units and can be implemented at all management levels in the process of allocating financial surpluses and improving the profitability of forest districts in the long term.
The effects of natural and economic determinants on the financial performance of forest districts are far from clear and have given rise to the following research questions: (1) Are there any statistically significant relationships between synthetic financial indicators and forest district categories defined on the basis of natural factors, such as forest site type (FST), forest site fertility, compatibility between stand species composition and forest site type, and actual tree species composition? (2) Are there any statistically significant relationships between synthetic financial indicators and forest district categories defined on the basis of economic factors (felling system, timber harvesting intensity, fragmentation of forest complexes, management difficulty level)?
The objective of the present work is to analyze the financial performance of forest districts using financial ratios, synthetic indicators, as well as relationships between the synthetic indicators and the natural and economic conditions of forest management. In particular, the study involves:
- (1)
Analysis of the financial performance of forest districts based on data from the years 2015–2019 and their comparison with those for 2005–2009;
- (2)
Analysis of relationships between synthetic financial indicators and selected natural and economic factors;
- (3)
A comparison of synthetic financial indicators based on different methodological models and the verification of their usefulness for assessing the financial performance of forest districts.
2. Materials and Methods
2.1. Characteristics of the Financial Management of the State Forests National Forest Holding and the Subject Matter of the Study
The State Forests National Forest Holding (SFNFH) is a self-financing entity without a legal personality [
57,
58] which manages 7609 thousand ha of land accounting for 77% of the woodland area of Poland. In contrast to private enterprises, in its operations, SFNFH prioritizes sustainability, environmental protection, and the preservation of forest biodiversity, with economically sound forestry production coming second. SFNFH is supposed to conduct its operations “based on economic considerations”, which means that it needs to continually improve ways of allocating its revenues to accomplish all of its statutory objectives. In the years 1994–2019 timber sales accounted for 78.6–87.2% of SFNFH revenues; in 2019, total SFNFH revenues amounted to PLN (zloty) 9149 million (as compared to total costs of PLN 8710 million).
State Forests units have very limited possibilities of diversifying their revenue sources, which makes their business foundations extremely labile, based on demand for one product only (timber). Despite its significant position in the timber supply market, SFNFH has been implementing changes in the way it manages its resources in order to maintain self-financing operations in the face of continually increasing operating costs. All State Forests units (the General Directorate, 17 regional directorates, and 430 forest districts) follow a uniform accounting policy pursuant to the Chart of Accounts adopted by the State Forests National Forest Holding [
59], with the financial year coinciding with the calendar year. SFNFH maintains its accounts and prepares its financial statements pursuant to the Polish Accounting Act [
60]. A unique feature of SFNFH is its Forest Fund, which is designed to compensate forest districts for any financial shortfalls arising from their forest management operations. Forest Fund resources, which are distributed at the central level by the SFNFH Director-General, may be also allocated to other goals, such as investments and the stabilization fund. Forest districts make contributions to the Forest Fund on a monthly basis depending on their revenues from timber sale; those contributions add to their costs and subtract from their profits and financial results. On the other hand, if the contribution is lower than the amount of Forest Fund subsidy they receive, the difference (the so-called basic subsidy) will reduce their costs, increasing their revenues and financial results [
61,
62,
63].
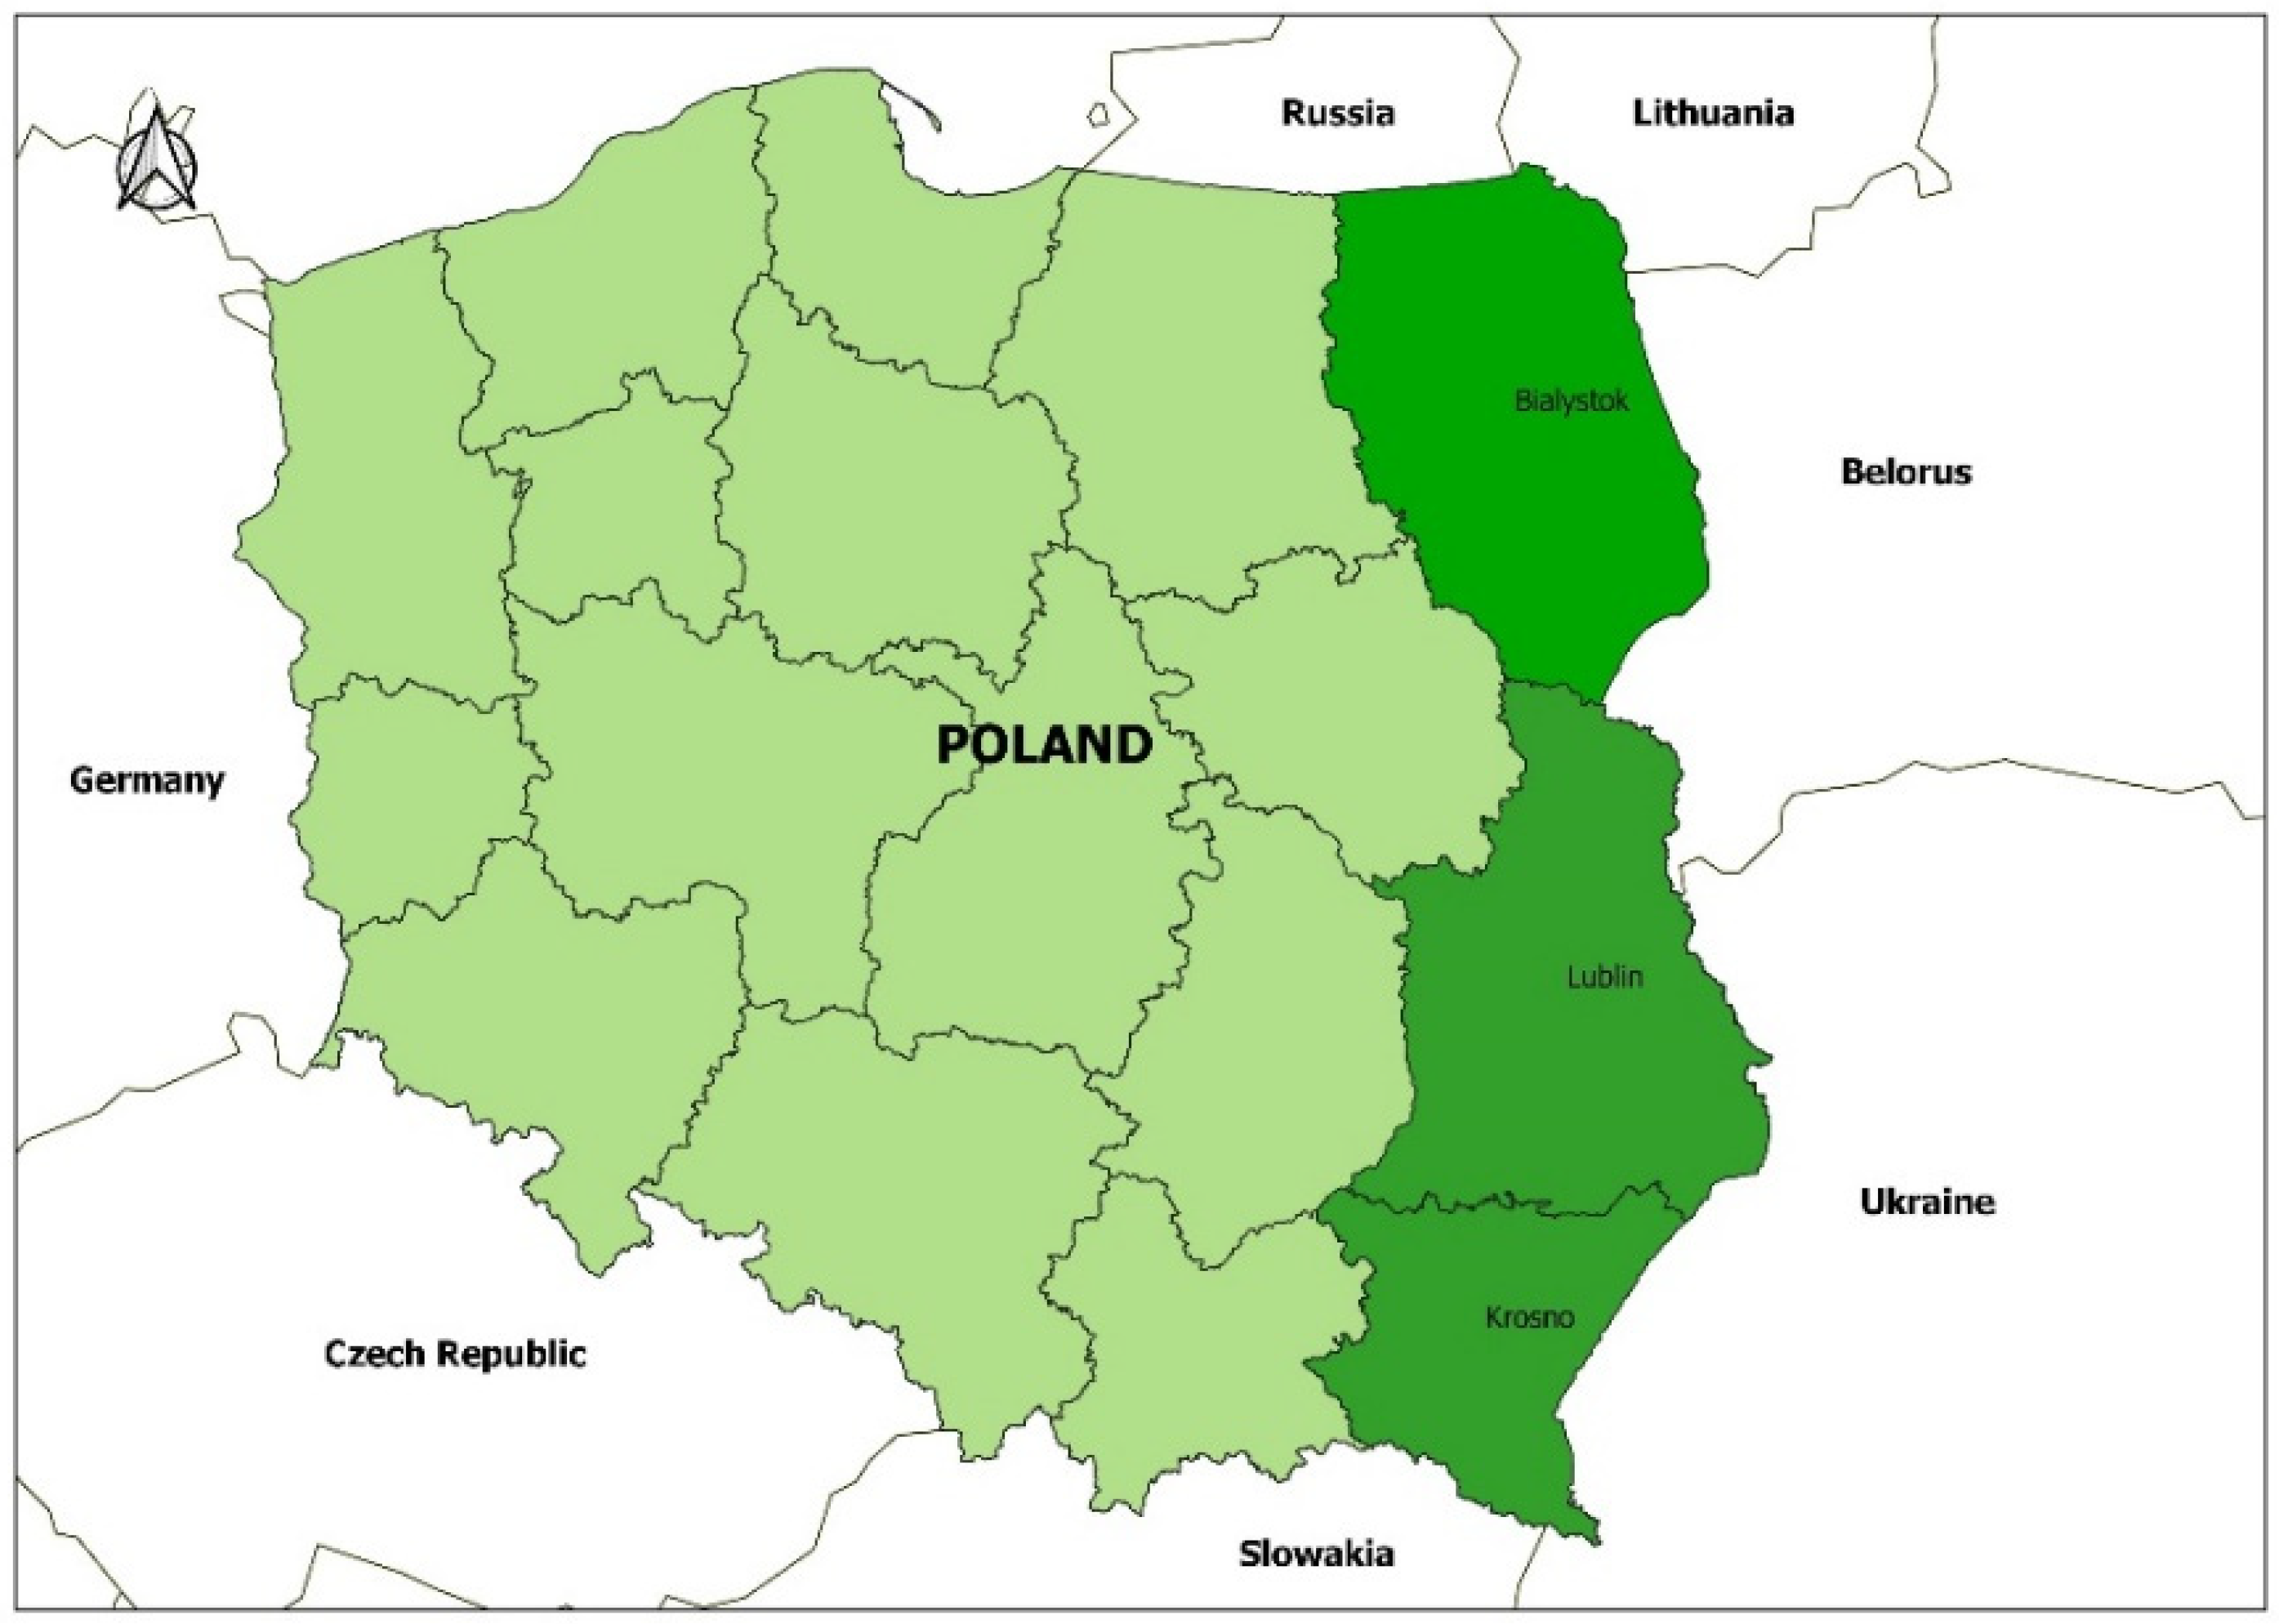
The present study encompassed 82 forest districts (the basic organizational units of SFNFH) belonging to the Białystok, Krosno, and Lublin State Forests Regional Directorates (SFRDs) in south-eastern, eastern, and north-eastern Poland (
Figure 1). These forest districts are located in areas characterized by comparable levels of economic development and a similar business environment. They also engage in similar marketing activities due to the specific structure of the wood processing industry; while facilities processing medium-diameter timber are highly concentrated, few pulp or paper mills are located in proximity of the above SFRDs; on the other hand, facilities processing large-diameter timber are scattered but they are found in the vicinity of large forest complexes in each of these SFRDs.
SFRD Białystok administers an area of 625,222 ha with a forest cover of 29.6%; SFRD Krosno administers 418,250 ha with a forest cover of 36.3%, and SFRD Lublin administers 420,400 ha with a forest cover of 22.2%. The studied area is quite varied in terms of forest site types (FSTs): montane FSTs occupy 160.9 thousand ha (11.9% of the total), upland FSTs cover 122.0 thousand ha (9.1%), while lowland FSTs occupy 1064.1 thousand ha, accounting for the largest share of the study area (79.0%). These proportions roughly reflect the distribution of FSTs on the scale of the whole country. In terms of the main forest tree species, the greatest area is occupied by Scots pine (695.3 thousand ha, or 52.0% of the overall study area), followed by oaks (110.1 thousand ha, or 8.2%), European beech (103.9 thousand ha, or 7.8%), birch (7.6%), Norway spruce (88.2 thousand ha, or 6.6%), and silver fir (78.7 thousand ha, or 5.9%). The average age of the studied stands (60 years) was higher than the average age of all stands managed by SFNFH (62 years in SFRD Białystok, 73 years in SFRD Krosno, and 65 years in Lublin SFRD).
In 2015 SFRD Białystok harvested 2987.9 thousand m
3 of timber at a mean price of 182.31 PLN/m
3, SFRD Krosno harvested 1886.2 thousand m
3 at 184.65 PLN/m
3, and SFRD Lublin harvested 2056.2 thousand m
3 at 189.50 PLN/m
3. The corresponding data for 2019 are 2952.5 thousand m
3 at 191.20 PLN/m
3 for SFRD Białystok, 2029.7 thousand m
3 at 199.74 PLN/m
3 for SFRD Krosno, and 2139.6 thousand m
3 at 199.39 PLN/m
3 for SFRD Lublin [
64,
65].
2.2. Data
The source of data for the present study was financial documentation from 82 SFNFH forest districts. The following information from the State Forest Information System (SILP) was made available by SFNFH bureaus as well as SFRD Białystok, SFRD Krosno, and SFRD Lublin for the years 2005–2009 and 2015–2019: (1) revenues, costs, and financial results excluding Forest Fund transfers; (2) basic financial statement items, such as State Forests equity, fixed and working assets, and liabilities; (3) annual reports on forest district activity (LPIR-1); (4) economic analyses concerning the performance of SFRDs, and (5) timber sales reports (“Acer”—LPIO-9). The financial statements of individual forest districts (balance sheets, profit and loss accounts, and cash flows) for the years 2005–2009 and 2015–2019 were also used.
Data on the environmental conditions of forestry operations were obtained from forest management plans for the studied forest districts, SFRD reports, as well as forest area and stock updates from the State Forests. Information about land areas was taken from the land register of the State Forests (LPIR-4). Data on management difficulty in forest districts were obtained from the BLP-344 report “Management difficulty indices for the organizational units of the State Forests: Methodology adjustment and updated results” commissioned by the State Forests [
29,
66,
67].
2.3. Classification Criteria and Categories of Forest Districts
In order to determine the effects of selected natural and economic factors on the financial performance of the analyzed entities, forest districts were grouped into categories that are homogeneous (to the extent possible) in terms of those factors. Forest district categories were defined by cluster analysis using the k-means method [
68] according to the following criteria: (1) natural criteria—forest site type (FST), site fertility, the degree of compatibility between stand species composition and site type, stand species composition and (2) economic criteria—stand regeneration method (felling system), harvesting volume, the degree of fragmentation of forest complexes and management difficulty level.
In the classification of forest districts by forest site type, the main site groups (coniferous, broad-leaved, upland, and montane) were defined on the basis of water abundance, fertility, and elevation. Those with an overall share exceeding 1.0% of the study area were used for the classification of forest districts in terms of the percentage share of site types; these were: fresh coniferous forest (FCF), fresh mixed coniferous forest (FMCF), moist mixed coniferous forest (MMCF), fresh mixed broadleaved forest (FMBF), moist mixed broadleaved forest (MMBF), boggy mixed broadleaved forest (BMBF), fresh broadleaved forest (FBF), moist broadleaved forest (MBF), alder swamp forest (ASF), alder-ash swamp forest (AASF), fresh upland broadleaved forest (FUBF), fresh montane broadleaved forest (FMontBF).
The classification of forest districts by site fertility was based on a modified site fertility index,
Wz [
69]:
where:
Forest sites were assigned to fertility categories as follows;
I: DCF (dry coniferous forest), SCF (swamp coniferous forest), SHMontCF (swamp high-mountain coniferous forest), SMontCF (swamp montane coniferous forest);
II: FCF (fresh coniferous forest), MCF (moist coniferous forest), SMCF (swamp mixed coniferous forest), FHMontCF (fresh high-mountain coniferous forest, MHMontCF (moist high mountain coniferous forest), FMontCF (fresh montane coniferous forest), MMontCF (moist montane coniferous forest);
III: FMCF (fresh mixed coniferous forest), MMCF (moist mixed coniferous forest), SMBF (swamp mixed broadleaved forest), FUCF (fresh upland mixed coniferous forest), MUMCF (moist upland mixed coniferous forest), MontMCF (montane mixed coniferous forest), FMontMCF (fresh montane mixed coniferous forest);
IV: FMBF (fresh mixed broadleaved forest), MMBF (moist mixed broadleaved forest), AF (alder forest), FUMBF (fresh upland mixed broadleaved forest), MUMBF (moist upland mixed broadleaved forest), FMontMBF (fresh montane mixed broadleaved forest), MMontMBF (moist montane mixed broadleaved forest);
V: FBF (fresh broadleaved forest), MBF (moist broadleaved forest), RF (riparian forest), AAF (alder-ash forest), FUBF (fresh upland broadleaved forest), MUBF (moist upland broadleaved forest, URF (upland riparian forest), UAAF (upland alder-ash forest), FMontBF (fresh montane broadleaved forest), MMontBF (moist montane broadleaved forest), MontRF (montane riparian forest), MontAAF (montane alder-ash forest).
The classification of forest districts by stand species composition was done by comparing the relative volumes of the main forest tree species: Scots pine, Norway spruce, silver fir, European beech, and oaks.
In terms of compatibility between the species composition of stands and the forest site types they occupy (stand-site compatibility), forest districts were divided into three categories based on the relative areas of compatible, partially compatible, and incompatible stands. The percentage share of stands with different degrees of stand-site compatibility was calculated based on information obtained from forest management plans for the studied forest districts according to Formula (2):
where:
U—the percentage share of stands with a given degree of stand-site compatibility;
p—area of stands with a given degree of stand-site compatibility;
P—total area of stands in the forest district;
Forest districts were also classified in terms of management difficulty levels according to the methodological assumptions and indicators adopted by the State Forests for evaluating the performance of forest districts [
28,
29].
As far as the degree of fragmentation of forest complexes is concerned, forest districts were classified based on the concentration indicator (Wk) defined as a quotient of the spatial range of a given forest district [ha] and the area actually managed by it [ha].
Forest districts were also classified into homogeneous groups based on felling systems: clearcutting (designated as I) and mixed systems (designated as II, III, IV, V), taking into account the volume of timber harvested in the years 2005–2009 and 2015–2019.
Finally, forest districts were grouped in terms of the intensity of harvesting operations expressed as the volume of timber harvested per unit of woodland area (m3/ha).
2.4. Ratio Analysis as a Tool for Evaluating the Financial Performance of Forest Districts
Financial indicators include liquidity, activity (efficiency), debt (solvency), and profitability ratios. Liquidity ratios reflect the ability of an enterprise to meet its current obligations. Activity ratios show how quickly an enterprise pays its debts and collects receivables as well as how effectively it manages its inventory. Profitability indicators express the relationship between operating profits, net sales revenues, total assets, and equity [
47,
70,
71]. The profitability of forest districts is primarily determined by their costs (optimized by the State Forests management) and revenues, which depend on natural conditions (volume and quality of timber) and market demand. An enterprise’s debt position is described by the debt ratio and the debt to equity ratio. The optimal value of the debt ratio is thought to be between 57% and 67% [
46,
72].
The financial performance of forest districts was evaluated by calculating financial ratios excluding Forest Fund effects on financial records. Aggregated (synthetic) indicators were computed using two sets of financial ratios: (1) the Universal Model (adopted by State Forests units) and (2) the model proposed by Buraczewski and Wysocki [
73] (
Table 1). Calculations were done in two accounting variants: including and excluding Forest Fund transfers from the balance sheets and profit and loss accounts.
The Universal Model assesses the financial performance of forest districts by means of liquidity, profitability, activity, and debt ratios. Buraczewski and Wysocki’s model [
73] places a greater emphasis on an enterprise’s debt position, paying less attention to activity ratios. Based on substantive considerations and statistical analysis of the variability and correlations between the ratios, two sets of liquidity, debt, activity, and profitability ratios were used for the calculation of synthetic indicators (
Table 1).
2.5. Evaluation of the Financial Performance of Forest Districts Using Synthetic Financial Indicators
Using a synthetic indicator, a forest district can be characterized by means of a single figure adopting values from the range [0, 1] (the closer it is to unity, the better the financial performance of the forest district). Three synthetic indicators were analyzed:
- (1)
Synthetic indicator 1—built according to the State Forests’ Universal Model, excluding Forest Fund transfers from financial records;
- (2)
Synthetic indicator 2—built according to the Universal Model, including Forest Fund transfers in financial records;
- (3)
Synthetic indicator 3—built according to the model proposed by A. Buraczewski and F. Wysocki [
73], excluding Forest Fund transfers from financial records.
The synthetic financial indicators were constructed using an unsupervised method due to the considerable diversity of the analyzed organizational units. The point of departure for building synthetic indicators was a data matrix [X] containing diagnostic variables, i.e., economic indicators characterizing the studied forest districts (3).
where
Analytical matrices for the periods 2015–2019 and 2005–2009 were constructed based on two sets of financial indicators: nine ratios from the Universal Model used in practice by forest districts, or alternatively eight ratios from the model proposed by Buraczewski and Wysocki [
73]. Prior to defining synthetic indicators, the diagnostic variables (stimulants, destimulants, and nominants) were normalized [
74]. Stimulants are indicators with high desirable values, destimulants are those with low desirable values, while nominants are variables for which optimal values can be determined.
Subsequently, the mean normalized values of the diagnostic variables describing the financial performance of forest districts were calculated from Formula (4):
where
2.6. Data Analysis Methods
Financial indicators were calculated using the same methodological assumptions for both study periods. Statistical analysis was used to evaluate the significance of differences between the independent variables (natural and economic conditions of forest district operations) and the dependent ones (synthetic indicators). Prior to this analysis, the variables were tested for normality of distribution using the Kolmogorov–Smirnov, Lilliefors, and Shapiro–Wilk tests. Since their distributions were non-normal, a non-parametric rank test was applied. Quantitative variables for three and more groups were compared using the Kruskal–Wallis test. Upon detecting significant differences, the post hoc Dunn test was performed to identify significantly different groups. The statistical significance level was adopted at p < 0.05.
Quantitative variables for three and more measurements were compared by means of the Friedman test. Upon detecting statistically significant differences, post hoc analysis was done by means of the Wilcoxon paired test with Bonferroni. Analysis was implemented in R version 4.1.0 [
75].
4. Discussion
This study applied the ratio analysis to evaluate the financial condition of forest districts and the impact of natural and economic factors on the economic situation of forest districts. Ratio analysis is designed to reveal certain salient relationships between financial records. It helps to identify strengths and weaknesses in the business activity of an enterprise, pointing to threats as well as areas of opportunity [
72,
73,
76]. The performed financial analysis provided knowledge about the level and differentiation of the values of financial ratios. In the study, financial ratios calculated for forest districts in the years 2015–2019 exhibited greater stability as compared to 2005–2009 due to the favorable economic conditions prevalent during the former period.
The studied forest districts were characterized by overliquidity, with all liquidity ratios exceeding their reference values (1.6, 1.2, and 0.2) [
42]. This was not caused by excessive timber inventories or a long receivable turnover ratio, but rather by the accumulation of excessive financial assets, which generated “opportunity costs” with respect to the market interest rates. Capital management strategy involving high levels of current assets and low levels of current liabilities led to overliquidity affecting from the profitability of forest districts. The efficiency ratios of forest districts for recent years showed an improvement on 2005–2009 in terms of days sales of inventory (13 days). While low DSI values are beneficial in that they signify low levels of stocks which are quickly replenished, care should be taken by forest districts to ensure sufficient inventory levels for meeting their contractual obligations and satisfying the demand for their products within a reasonable period of time. Indeed, the goal of inventory management is to maintain stocks at levels enabling smooth operations at the lowest possible costs [
72,
76]. Moreover, the differences observed in efficiency ratios indicate a preference for the payment of liabilities. The debt ratio for the years 2015–2019 amounted to 26.92%; it was higher than that for 2005–2009 (14.01%), but it still fell short of the recommended 57–67% range (at the same time, it points to the high financial independence of forest districts). The profitability of the analyzed forest districts was low due to their capital management strategies. Return on sales was lower in the period 2015–2019 (less than −0.52% in 75% of forest districts, and more than 6.0% in 25%). This was in part attributable to the insufficient marketing efforts of forest districts, which were not able to identify additional sources of demand and counter declining timber prices.
Given the low ROE of forest districts, they should intensify investment activity to improve the utilization of their equity and prevent the process of decapitalization occurring in some of them. The lowest financial indicators and the worst financial performance was found for forest districts managing stands belonging to the Białowieża Promotional Forest Complex due to the prioritization of conservation efforts over timber production in that area.
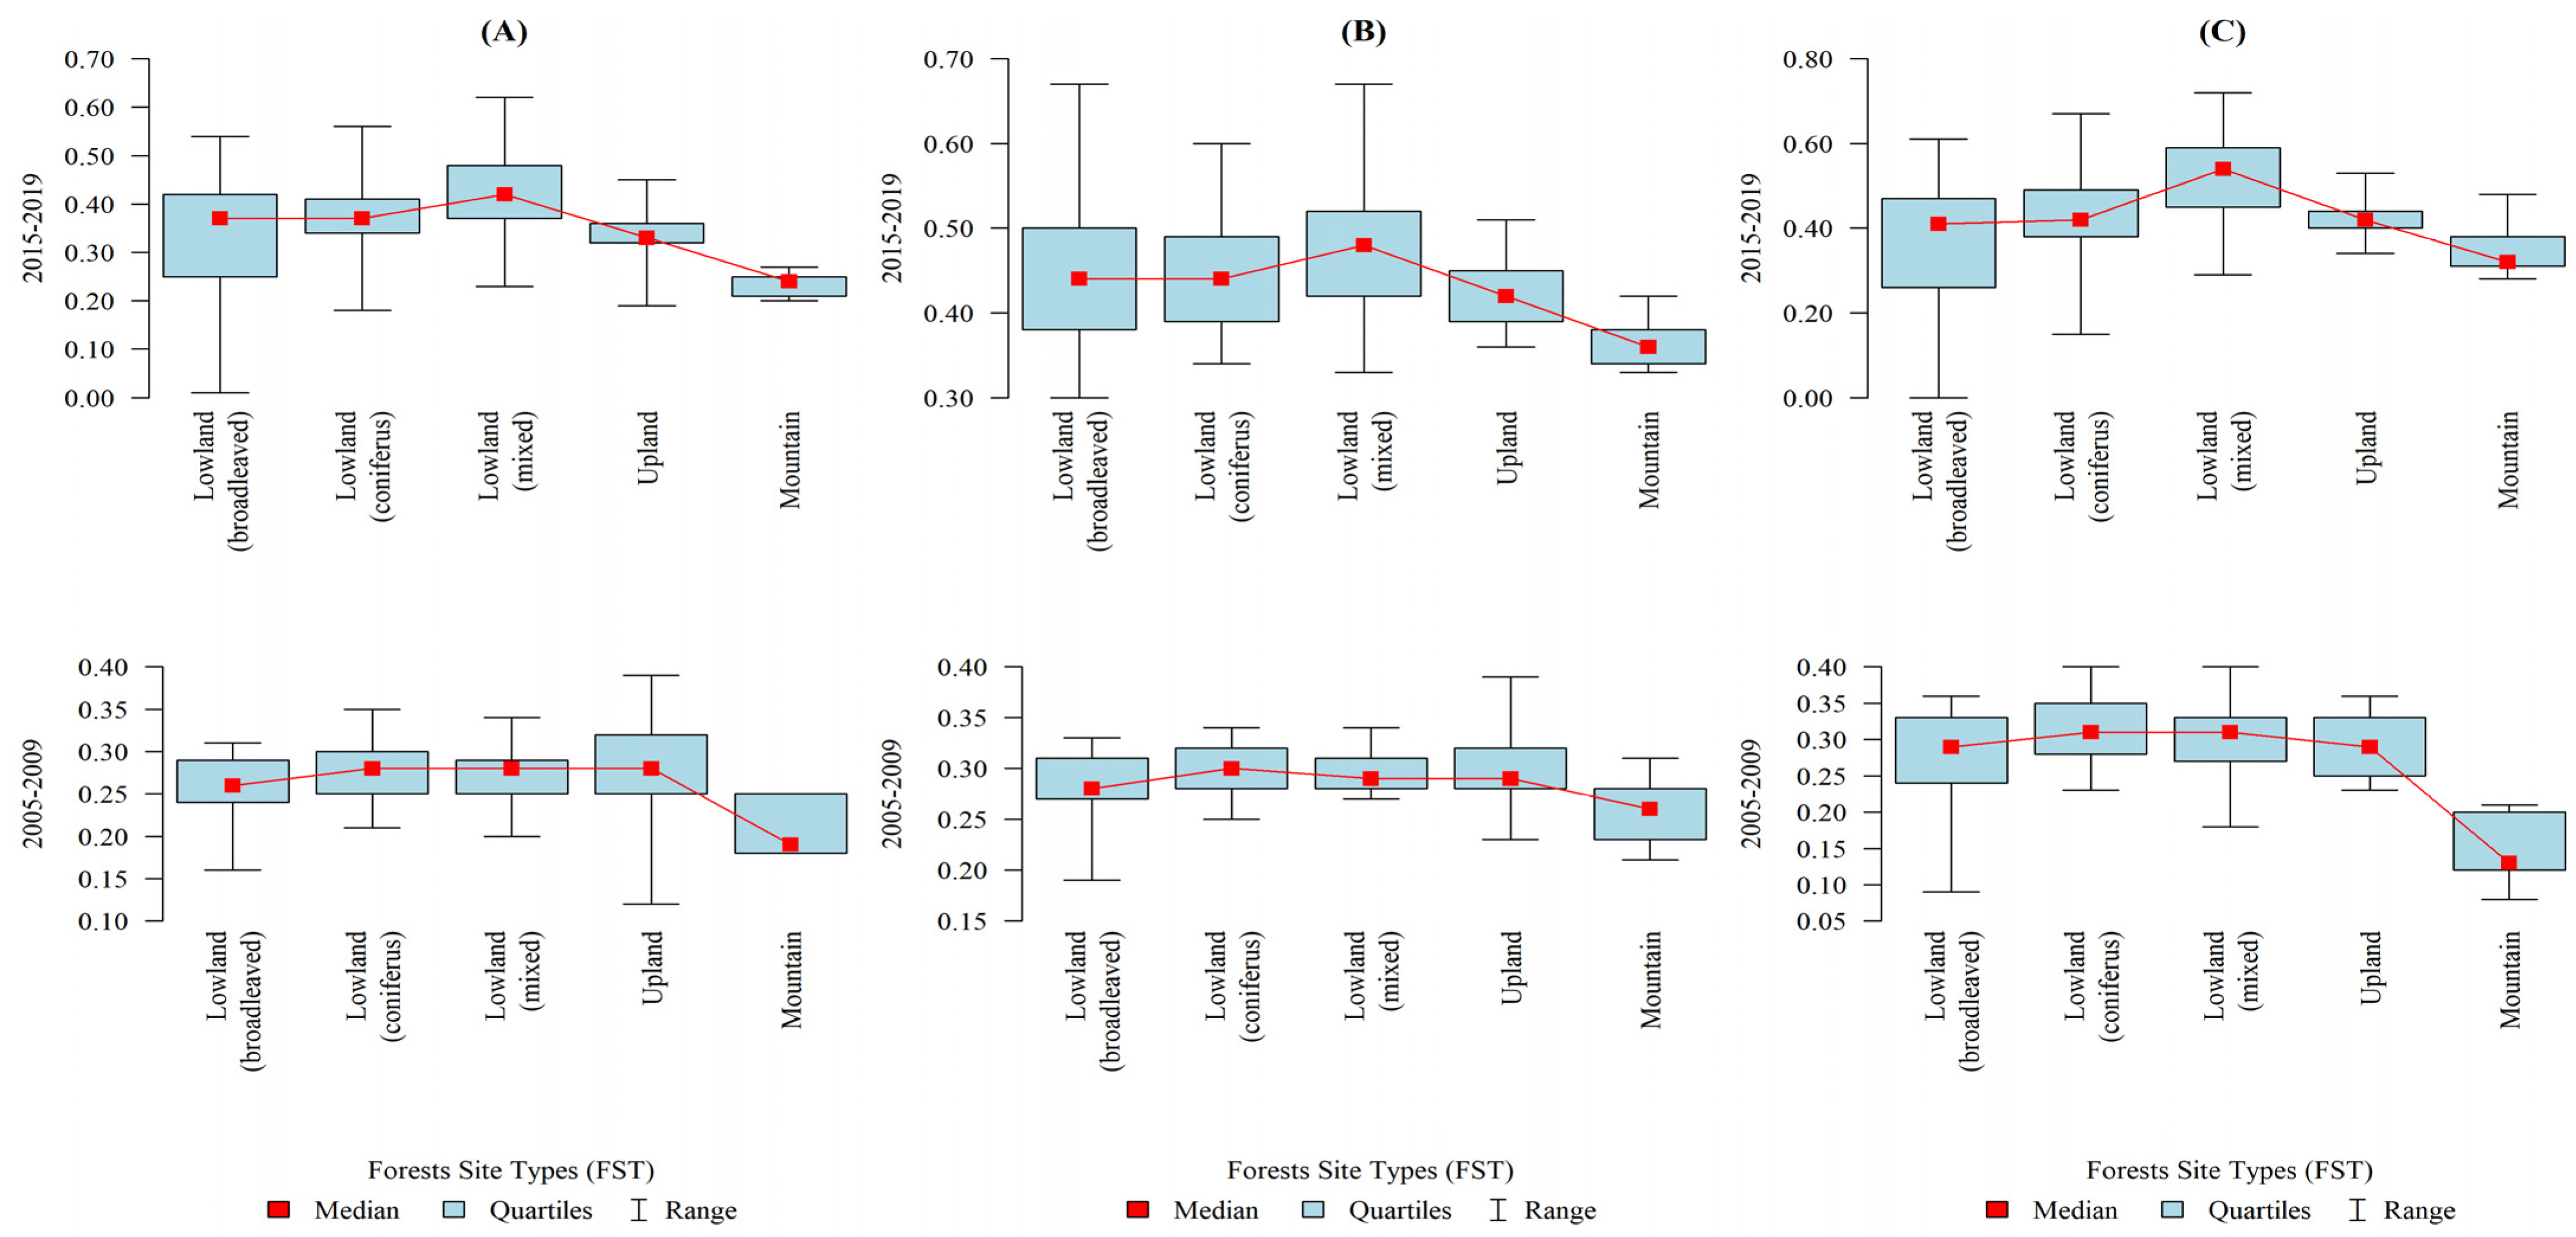
The present analyses partially corroborated the hypotheses concerning differences between the synthetic financial indicators and selected natural and economic conditions of forest district operations. However, the statistical significance differences was between the various categories of forest districts distinguished on the basis of natural and economic factors depending on the applied synthetic indicator (its underlying methodology). It was shown that the financial performance of forest districts depends on FHT. Significant differences were found between forest district categories distinguished on the bases of that factor. In 2015–2019 synthetic indicator 1, which excluded the effects of Forest Fund transfers, was significantly higher for forest districts managing lowland sites as compared to those managing upland and montane sites. The best financial results were obtained in lowland habitats, while forest districts operating in mountain conditions were characterized by the lowest economic efficiency. Similar results were obtained for the years 2005–2009, when montane forest districts exhibited significantly lower values of synthetic indicator 1 as compared to the lowland and upland ones. Additionally, Młynarski et al. [
10], who used data envelopment analysis (DEA), found that lowland forest districts exhibited high financial efficiency levels.
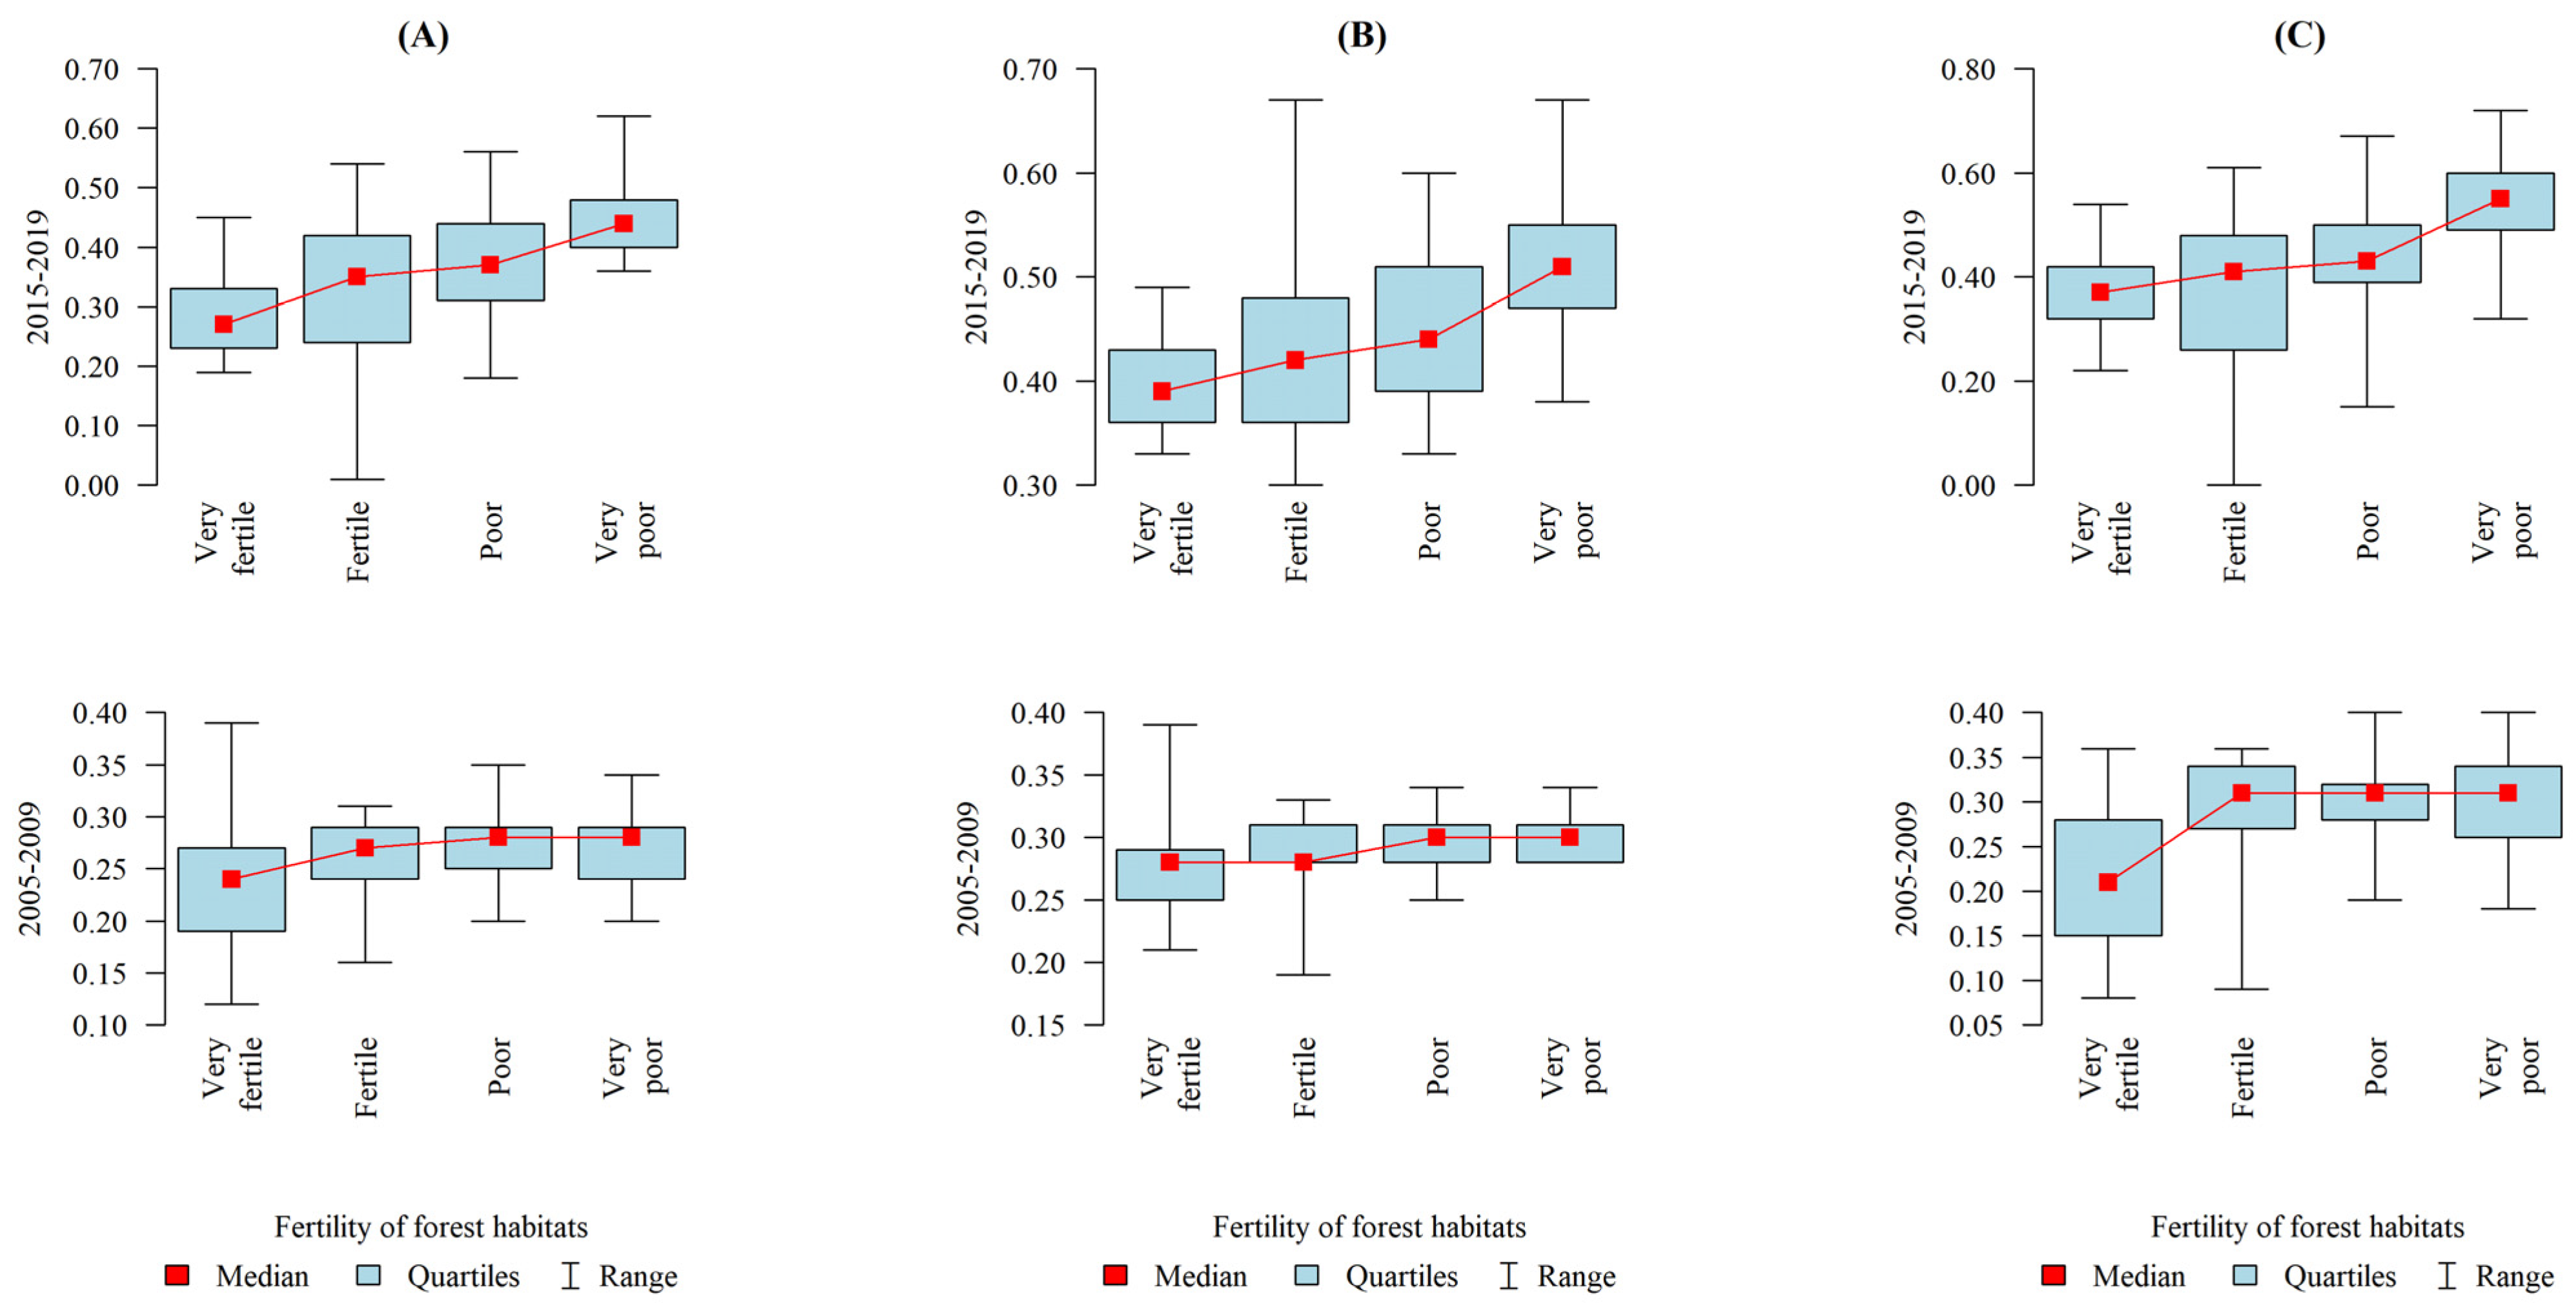
In terms of site fertility, the synthetic indicator was significantly higher for the very nutrient-poor sites typical of coniferous forests, especially when compared to the very fertile sites typical of broadleaved forests. It was thought that forest districts managing the more fertile high productivity sites would exhibit higher values of the synthetic indicator because silver fir stands of 1st quality class should yield 965 m
3 of timber per ha at 100 years as compared to 584 m
3/ha for pine stands of the same quality and age [
77]. The present results were probably affected by market factors related to timber sales, the quality of the assortments produced, as well as operational costs. Lysik [
45] reported that unit costs of forestry activities are higher in lowland forest districts managing the more fertile sites (vs. the less fertile ones). The highest unit costs were incurred by montane forest districts, where it is difficult to use economically efficient methods of timber harvesting and skidding.
No statistically significant differences in financial performance as determined by the synthetic indicators were found between the forest district categories distinguished on the basis of compatibility between stand species composition and forest site types.
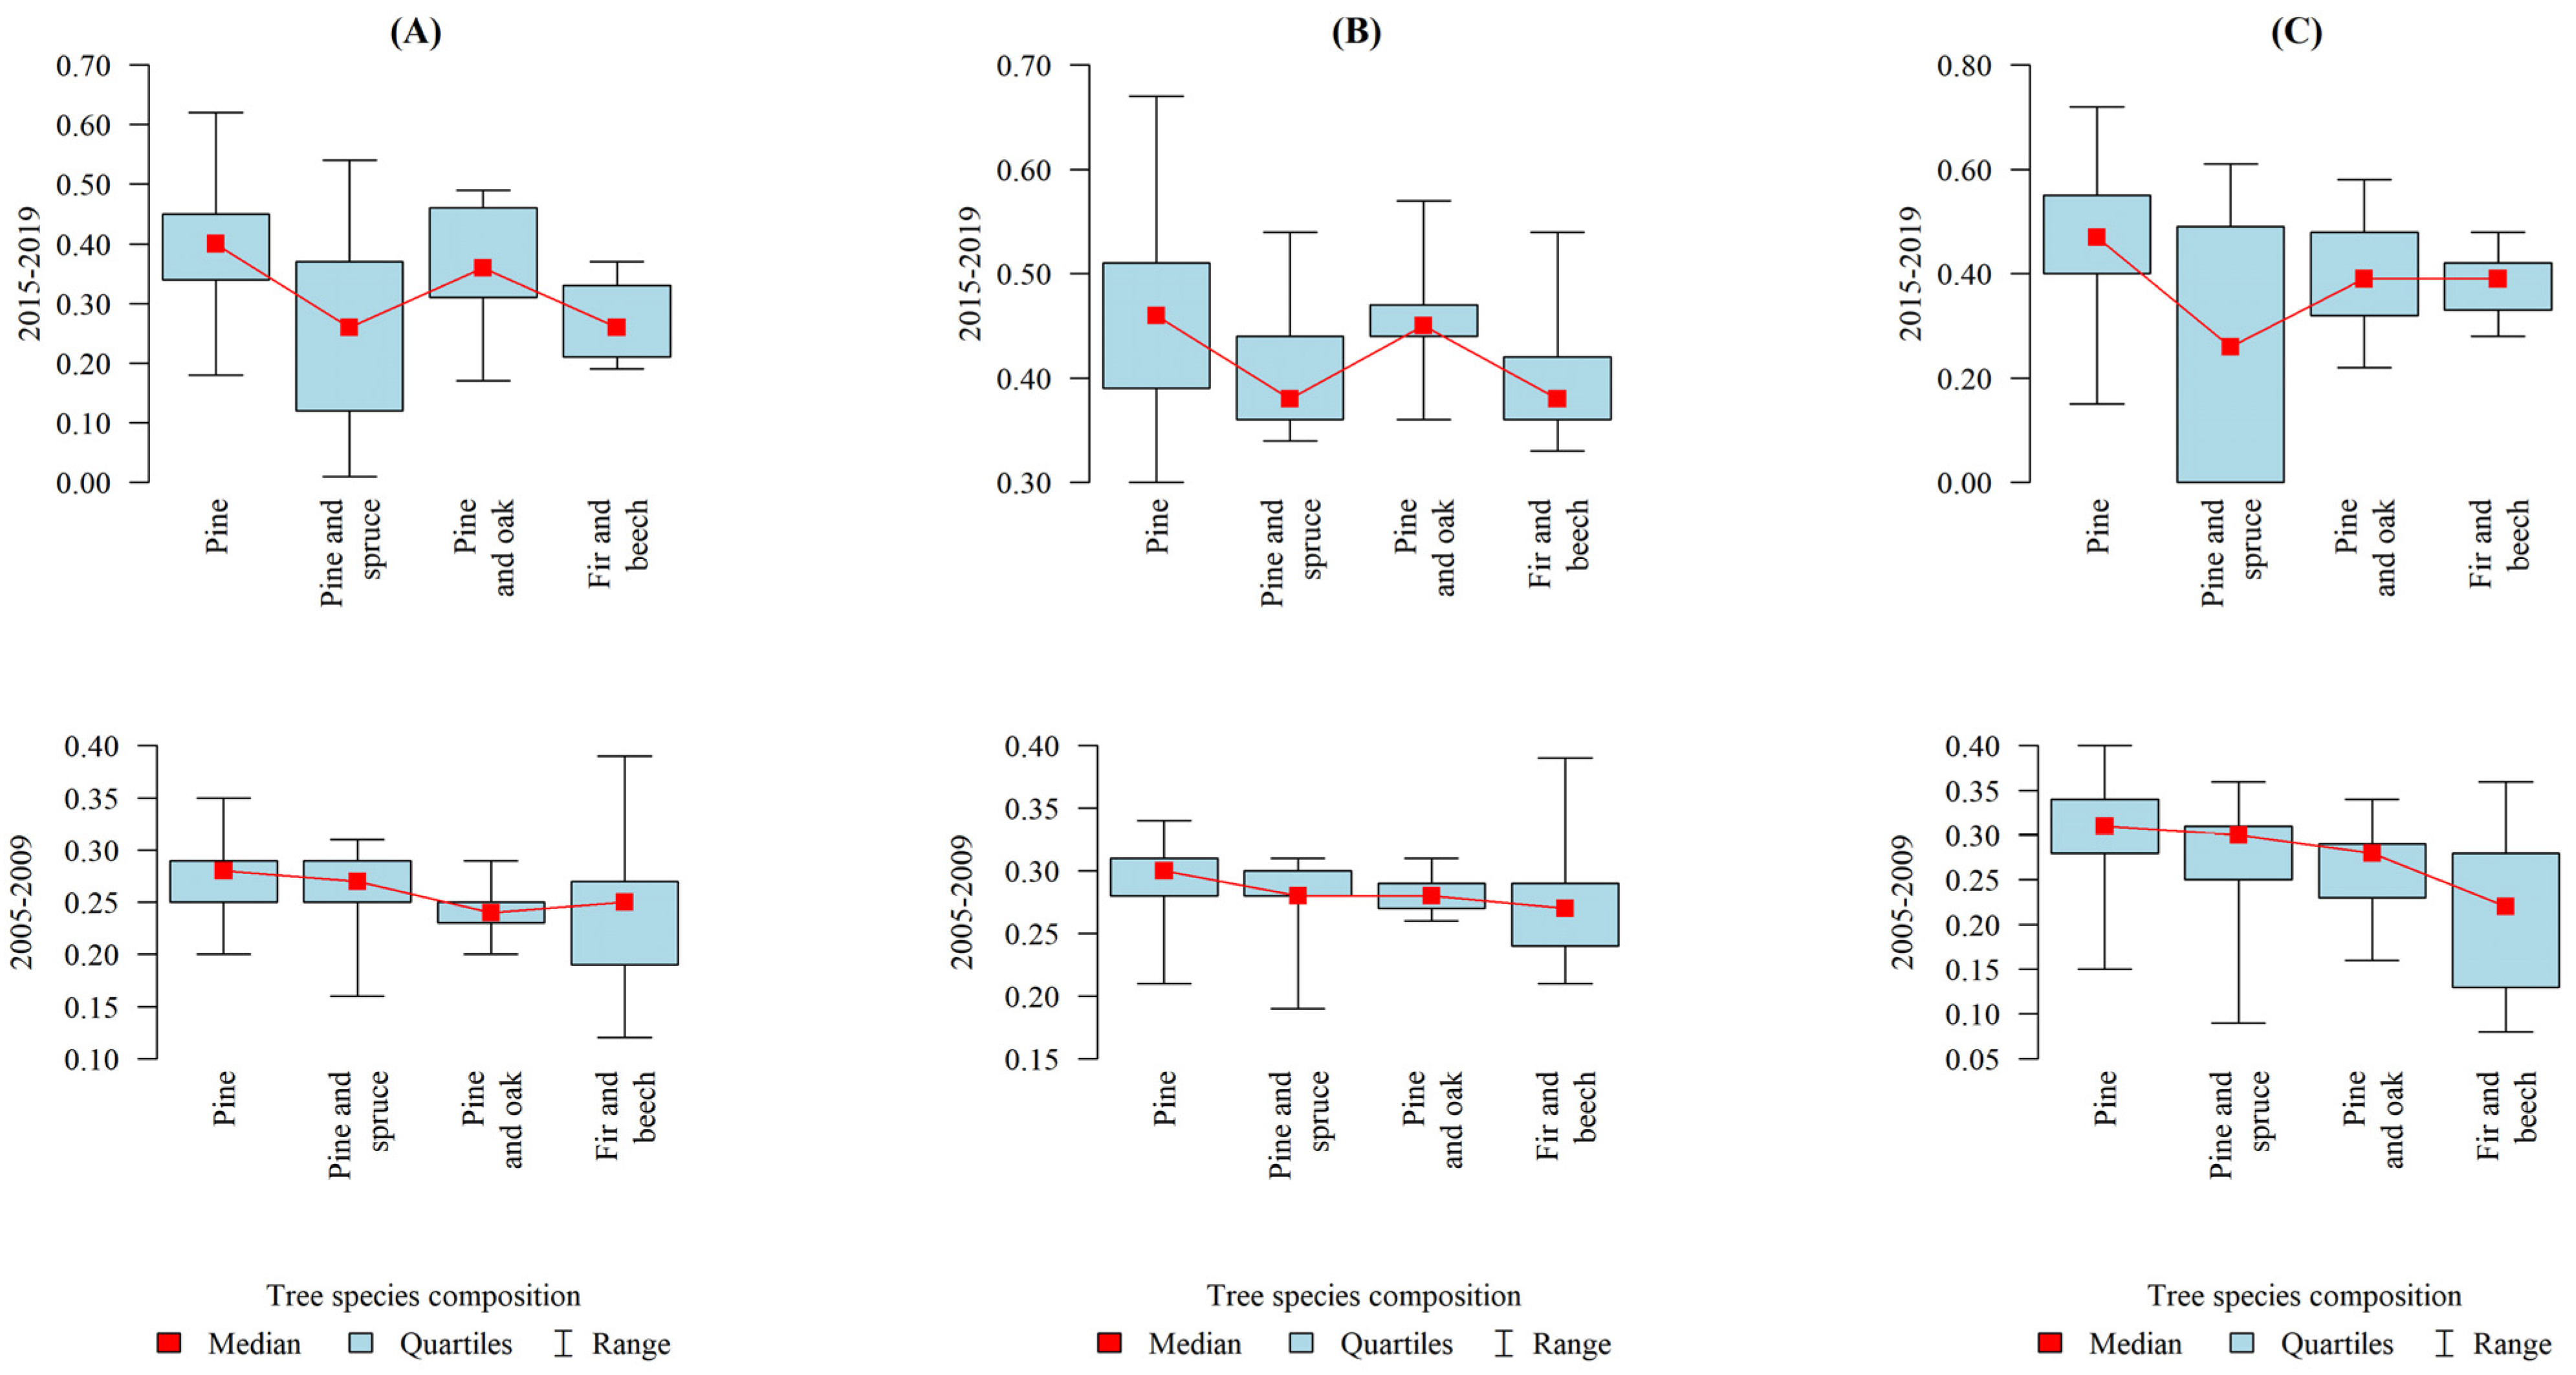
Our research has shown that there are significant relationships between the species composition of stands and the financial condition of forest districts. The establishment of stands by forest holdings is a matter of investment and financial considerations, with the strategic investment goals being reflected in the selection of tree species [
78]. Mixed and uneven-aged stands are preferable for environmental reasons and with a view to reducing silvicultural hazards, also in the context of climate change (increasingly severe droughts and winds) [
3,
79,
80,
81,
82,
83]. In terms of species composition, synthetic indicators 1 and 3 reached significantly higher values in forest districts with a dominance of pure pine stands as compared to those in the “pine and spruce” and “fir and beech” categories. In turn, in the years 2005–2009, forest districts with “pine and spruce” stands exhibited higher indicator values than in 2015–2019. This result was affected by forest districts in the Białowieża Promotional Forest Complex (where dominated by pine and spruce stands), where it is prohibited to fell trees that are 100 years old or older, which causes a continuous decline in the financial performance of those districts with each passing year. In the years 1999–2001, revenues from the managed area of the Białowieża Forest decreased by 74% as compared to 1995 [
84]. In the study of Lysik [
45], the synthetic indicator calculated according to Buraczewski and Wysocki’s methodology [
73] was the highest for forest districts with dominant spruce (those districts also revealed the best return on sales in 1999–2002). In turn, the results of Friedrich et al. [
85] indicate that productivity in mixed forest stands was often higher than that in pure forest stands. Knoke et al. [
86] pointed to the need to integrate findings on the biophysical properties of mixed forests such as growth, yield, and ecological stability against natural hazards into forest economic model-making [
87,
88]. Risk-averse decision-makers should therefore establish ecologically desirable mixed forests, even if their profitability is lower [
89] due to the substantial benefits attributable to significant risk reduction [
85].
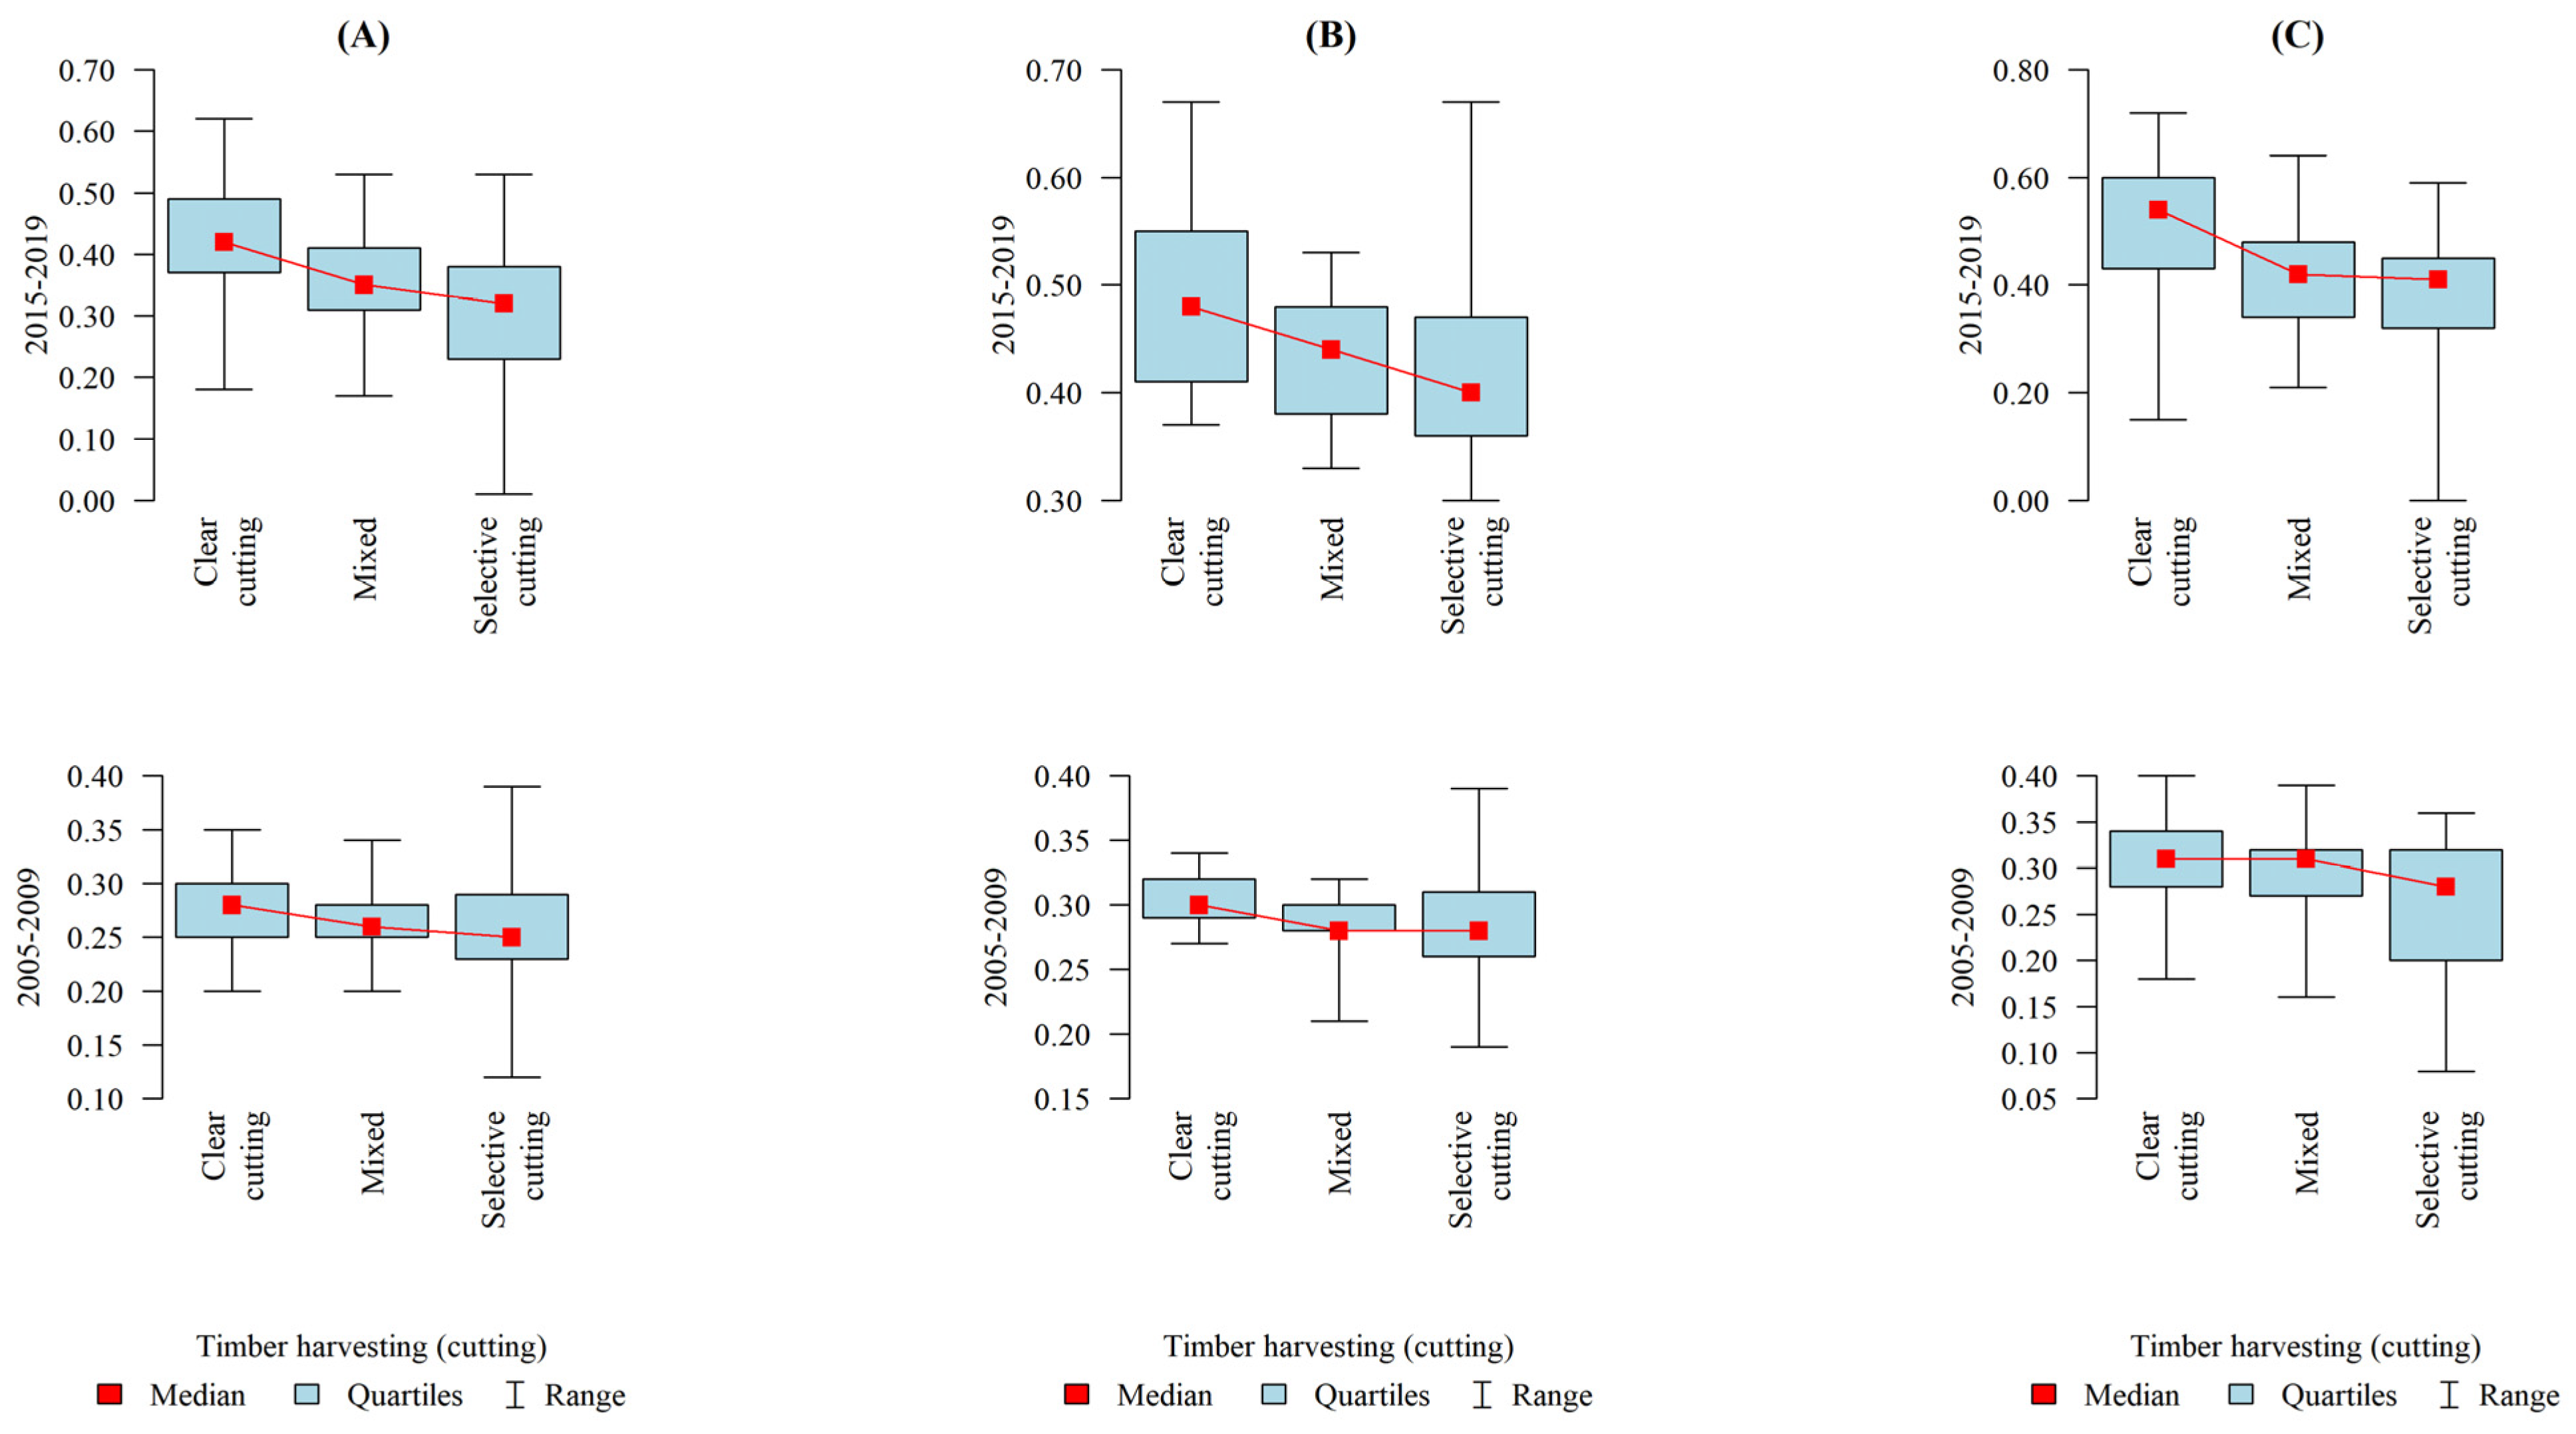
For many years now, stand regeneration systems have been the subject of debate among investors and environmentalists. The study showed that districts with predominant clearcutting were more financially efficient (their synthetic indicators ware significantly higher) as compared to districts with predominant selective cutting. The selection of optimum strategies ranging from continuous regeneration systems to clearcutting is crucial not only from the standpoint of timber production, but also because it has a direct impact on adaptation capacity, biodiversity, as well as esthetic, recreational, and cultural forest functions [
36]. Hanewinkel [
90] and O’Hara and Ramage [
91] noted that economic comparisons between different forest management systems are complicated and poorly understood due to the absence of a framework that would make it possible to accurately describe them and reliably weigh their profitability. Clearcutting has become the most controversial silvicultural practice; also the public often disapproves of the periodical absence of trees and other consequences of clearcutting, such as soil degradation [
92]. A study from Alabama shows that while clearcutting is superior in terms of economic efficiency (profitability, worker safety, and organization), it is considered the environmentally damaging [
93]. In the present study, the median of the synthetic indicator was the highest for forest districts with the largest proportion of clearcutting, but the greatest interquartile range was found for districts with a predominance of mixed and selective cutting systems. According to Cubbage [
94], harvesting costs often surpass actual wood growing costs. Aalmo et al. [
95] noted that ineffective harvesting operations can be improved, for instance by raising stand density or by increasing stem-volume for pine trees and broadleaves. Mixed felling systems usually entail higher costs [
96]. Thus, efforts should be made to increase the share of cheaper natural regeneration practices in forests, which may be facilitated by diversifying the age structure of stands. Despite the limited possibilities of mechanical harvesting, the costs of planting and tending to the new forest generation are lower in uneven-aged stands because natural regeneration and self-thinning are the central elements of forest management while harvesting focuses on large trees [
85].
Forest district revenues are affected by volume of harvested timber, and the structure of assortments produced from that timber. However, no statistically significant differences in financial performance were identified between forest district categories distinguished on the basis of harvesting volume. In 2015–2019 both the means and medians of synthetic indicators 1 and 3 were higher in forest districts characterized by intensive timber harvesting.
As the management of smaller stands entails lower economies of scale and impedes active management [
97,
98], it was expected that the fragmentation of forest complexes would have an impact on the financial performance of forest districts, but research did not bear out this hypothesis. Kittredge [
99] noted that the concentration of forest ownership may bring environmental and operational benefits, e.g., by optimizing and decreasing the number of access roads and skid trails, and thus reducing harvesting costs [
81].
This study also analyzed relationships between the synthetic financial indicators and the aggregated management difficulty indicator developed by Kocela et al. [
67] using an “aggregate of relative values” expressing the difficulty of conducting forestry operations in individual forest districts [
29]. The present findings did not reveal differences between the forest district categories distinguished on the basis of management difficulty and the applied synthetic financial indicators. These results should be treated cautiously as the management difficulty indicators may have already become partially obsolete for the 2015–2019 period (however, no statistically significant relationships were detected in 2005–2009, either).
The synthetic indicator calculated according to the Universal Model (excluding Forest Fund transfers from accounting records) exhibited the lowest mean and median values in both studied periods, being significantly different (
p < 0.05) from both the corresponding indicator including Forest Fund transfers and the indicator calculated pursuant to Buraczewski and Wysocki’s model [
73]. The novelty of the study consists of applying synthetic indicators calculated on the basis of different methodological assumptions for the evaluation of the financial performance of forest districts operating in different conditions as well as in analyzing the relationship between that performance and selected forest management conditions. The present study showed that a multiplicity of financial ratios can be successfully replaced with one synthetic measure representing the financial performance of forest districts. Furthermore, the use of two variants of accounting records and two sets of financial ratios enabled additional comparisons.
The financial condition of the analyzed forest districts varies and depends on many variables. In addition to the discussed natural and economic factors, it is affected by the increasing costs of nature and biodiversity conservation and the implementation of forest social functions, such as nature education and recreation. The increasing importance of non-production ecosystem services has reduced timber harvesting, especially due to nature conservation and recreational functions. Moreover, weather anomalies have increased forest management costs and uncertainty, thus adversely affecting the profitability of SFNFH holdings.
5. Conclusions
In the years 2015–2019, financial indicators revealed substantial variability and reflected an excessive liquidity of forest districts. A comparison with the findings for 2005–2009 indicated that their current liquidity was lower by approx. 5%. The activity (efficiency) ratios showed a good inventory turnover period as well as a short receivables conversion period. In the study period, the profitability indicators, and in particular ROS and ROE were unfavorable. A comparison of the mean values of those ratios indicates a slight deterioration of financial performance with respect to the period 2005–2009.
The study corroborated the hypothesis that studied natural and economic factors affect the financial performance of forest districts, except for compatibility between stand species composition and FST, management difficulty, and the fragmentation of forest complexes (apart from synthetic indicator 2). Taking into consideration natural factors, especially FST the most beneficial financial results were obtained by forest districts operating on lowland sites, while those operating in montane conditions exhibited the lowest results. In the context of site fertility, the highest values of the synthetic indicators were obtained for forest districts managing sites low in nutrients (coniferous forests). As regards species composition, it was found that the dominance of pine trees in stands was associated with superior financial performance. Among the economic factors, the most pronounced effects were attributable to the felling system (clear-cutting).
The presented models implementing synthetic financial indicators supplement traditional ratio analysis. They provide a single figure for evaluating the financial performance of forest districts as well as for comparing them in a given period. It should be noted that the indicators revealed high variation in the financial performance of forest districts, with their values remaining much below unity.
Synthetic financial indicator 1 (excluding Forest Fund transfers) was significantly lower than indicator 2, which confirms the limited applicability of the latter metric, constructed on the basis of ratios calculated from the balance sheet and profit and loss records of forest districts. In the case of SFNFH units, ratio analysis should not be performed using items from their financial statements, which are distorted by contributions to and subsidies from the Forest Fund.
Findings concerning the effects of selected natural and economic factors on the financial condition of forest districts may be used for financial planning and management by SFNFH, in particular in decision-making processes aimed to optimize forest management. The applied methods may provide the basis for constructing a sectoral evaluation tool.
Numerous factors affect the financial performance of forest districts, and so it is necessary to continue research into the effects of natural conditions, climate warming, economic changes, and ecosystem services (recreation and nature conservation) on that performance. Efforts should be made to develop economically optimal models of forest management for forest districts depending on their production potential, economic conditions, and social needs.


