Article

Understory Vegetation Composition and Stand Are Mainly Limited by Soil Moisture in Black Locust Plantations of Loess Plateau

1
College of Life Science, Northwest Agriculture and Forestry University, Xianyang 712100, China
2
College of Landscape Architecture and Arts, Northwest Agriculture and Forestry University, Xianyang 712100, China
3
College of Grass, Northwest Agriculture and Forestry University, Xianyang 712100, China
*
Author to whom correspondence should be addressed.
Forests 2021, 12(2), 195; https://doi.org/10.3390/f12020195
Submission received: 13 January 2021 / Revised: 29 January 2021 / Accepted: 3 February 2021 / Published: 8 February 2021
(This article belongs to the Section Forest Ecology and Management)

Abstract

:
Forestry eco-engineering programs in China occupy 721.77 × 10⁴ km2, among which plantations have a pivotal role in protecting the fragile ecological environment. Reforestation understory is often ignored because of the simple vertical structure. The importance of light in understory has been discovered. However, how other ecology factors (e.g., soil properties and geographical factors) influence understory composition and stratification remain unclear. In this study, we investigated the effects of understory composition and stratification on environmental factors in black locust plantations. We used systematic clustering analysis based on plant average height to describe understory stratification. The finding of this study was that black locust plantation understory consisted of three levels: (I) a low herbaceous layer (<80 cm), (II) a high herbaceous layer (80–130 cm), and (III) a shrub layer (>130 cm). Redundancy analysis indicated that soil moisture content and soil total phosphorus content were the largest contributors to the variation in understory vegetation composition. Soil moisture content, altitude, and soil organic carbon content were the largest contributors to the variation in understory stratification. Overall, by analyzing understory stratification and the relationship between soil and geographical factors, we gained a more comprehensive understanding of the interaction between understory and the microenvironment. This is especially important for reforestation management that maintains understory ecology function in the face of global climate change.

1. Introduction

Eco-engineering of protective forests has occurred over 1400 × 104 km2 across the word [1], playing a crucial role in sand fixation; water and soil conservation; and protection of farmland, animal husbandry, rail traffic, villages and buildings against avalanche, rockfalls, landslides, and floods [2,3,4]. The Three-North Afforestation Program and other forestry eco-engineering programs in China occupy 721.77 × 10⁴ km2, among which plantations have achieved remarkable results in ecological restoration [5,6]. The Loess Plateau has become a gully hill-dominated landscape from centuries of land use and severe soil erosion [7]. Black locust (Robinia pseudoacacia), as a pioneering tree species for water and soil conservation, occupies >90% of plantation forests in the Loess Plateau [7]. Currently, the environment of the Loess Plateau has been greatly improved. Global climate change is affecting elements such as hydrological systems, species activity and distribution, and species interactions [8]. Under global climate change, the way in which to effectively manage and maintain plantation ecology function is vital to environmental protection.
Understory information in forests has been studied by many researchers using ecological research and nutrient cycling; dealing with growth, survival, and regeneration and modeling of ecosystem functioning; and even conducting vegetation remote sensing [9,10,11,12]. The biomass of understory species is smaller than that of trees. However, their biomass turnover is fast. It has been observed that photosynthesis of the moss understory may account for 10 to 50% of whole-forest gross photosynthesis [13,14]. Therefore, understory primary productivity and turnover is curial for a forest system. Herbaceous communities may be particularly susceptible to climate change because of short growth cycle and fast metabolism, as well as the lack of capability to disperse long distances to closely track shifts in climate [15,16,17]. The Loess Plateau is more susceptible to global warming because of its fragile ecological environment. Comprehensive understanding of understory stand composition and interactions with the microenvironment is necessary to improve predictions of future plant communities.
Vertical stratification has been confirmed to be an important factor in maintaining species diversity [18]. Stand composition can indicate community ecological function and is widely used as an indicator for the management of forest resources [19,20,21,22]. Previous studies have generally classified plant vertical stratification into four layers: a canopy layer (>10 m), the understory (4–10 m), a shrub layer (1–4 m), and a ground layer (<1 m) [23]. There has been little comprehensive analysis of understory species [24]. Understory species as an essential component of forest ecosystems influence canopy succession and stand development [25]. Compared with natural forest, black locust plantation forest is simple in stratification, and understory vegetation is minimally distributed. All plants shorter than 1 m are combined into one layer in traditional classification, which represents a loss of important information for vertical structure of plantation understory species. We therefore need a comprehensive understanding of community composition and changes in vertical structure [26,27].
The asymmetry of light competition contributes to the vertical structure of vegetation [28,29,30]. Many studies have demonstrated the importance of light in community structure [31,32,33]. Hence, the relationship between the availability of light and the composition of species in forests has been elucidated. Soil fertility and geographical factors, however, can also influence species composition [34,35,36]. Species diversity and the development of vertical stratification both increase with the latitudinal thermal gradient [37,38]. Vertical structure is simpler in plantation than natural forests and can weaken the asymmetry of light competition. Soil and other environmental factors thus play prominent roles in the composition of communities. However, how other ecology factors (e.g., soil quality, geographical factors) influence understory vegetation stratification and composition remains unclear. We therefore selected soil (soil organic matter, total N, total P, and moisture contents) and geographical (slope, aspect, and altitude) factors to determine the response of understory species composition to environmental factors in black locust plantation.
Consequently, we herein examined artificial forests of different ages of Robinia pseudoacacia, which are the main types of afforestation in the arid and semi-arid regions of the Loess Plateau in China [39]. We describe understory vegetation stand compotation using species diversity, which is measured across a vertical profile [40]. We hypothesized that black locust plantation understory has a special vertical stratification favorable to restoration. Our specific objectives were to (a) find out the stand composition of understory vegetation in plantation, (b) identify the dynamics of understory vegetation composition on the basis of vertical stratification, and (c) determine the response of understory stand compotation to soil and georgic factors.

2. Materials and Methods

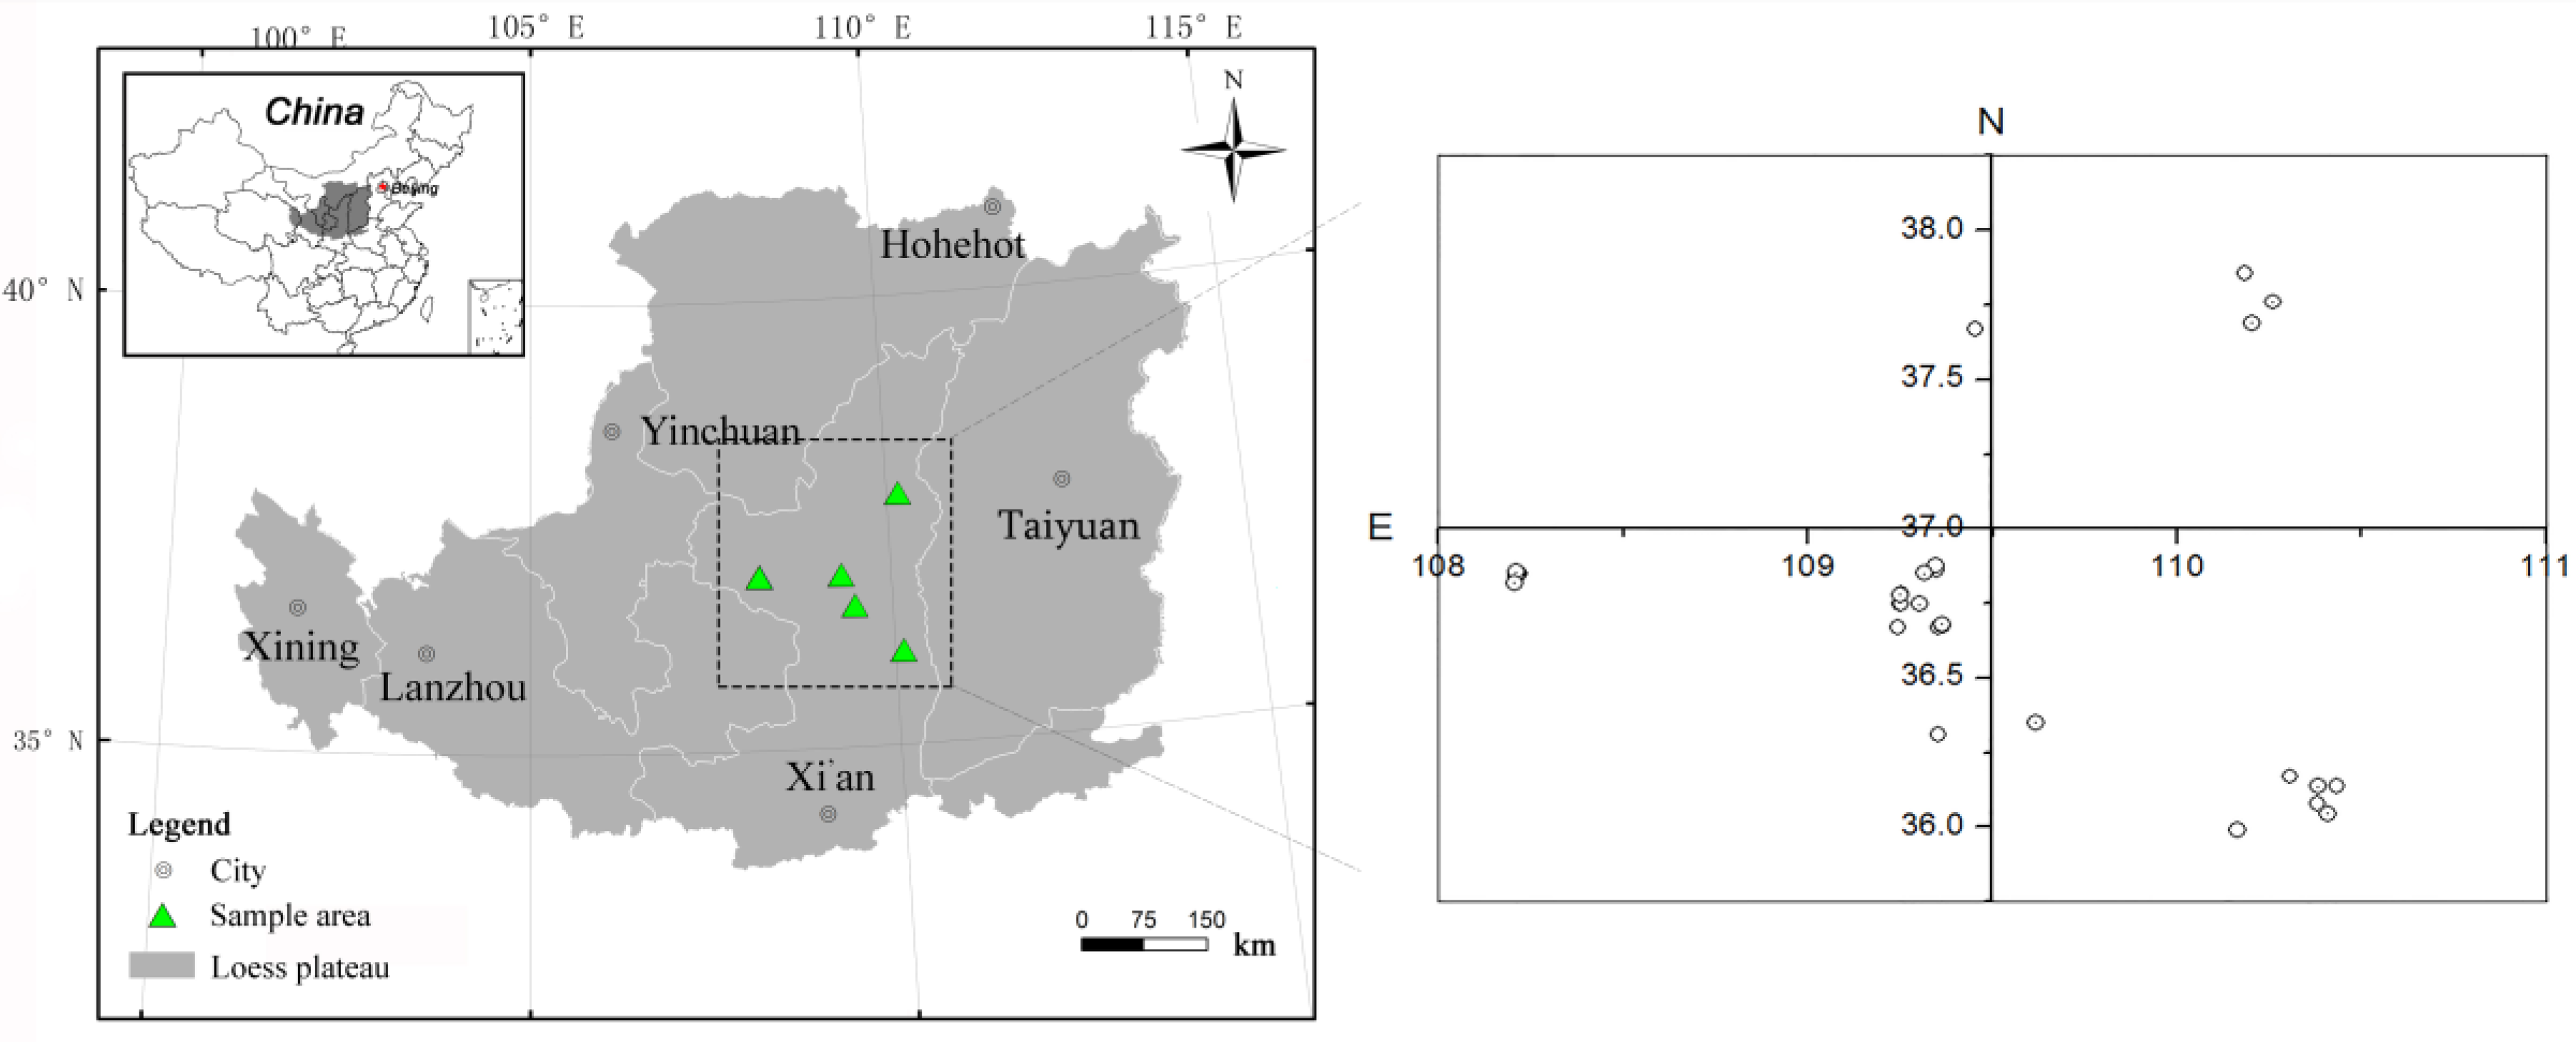
2.1. Study Sites and Experimental Design

The study sites were in the north-central provinces of China, in the central hilly region of the Loess Plateau (Figure 1). The climate is semi-arid with an average rainfall of 437 mm, with >77% falling from June to September. The mean annual temperature is 8.8 °C, ranging from −9.7 °C in January to 23.7 °C in July. The soil is a Huangmian soil [41]. The study area is a warm forest steppe where natural forests have been destroyed because of water and soil erosion, but where Robinia pseudoacacia, Armeniaca sibirica, Hippophae rhamnoides, Caragana korshinskii, and Medicago sativa have been abundantly planted for soil and water conservation. The native grasses are mainly composed of Poa sphondylodes, Lespedeza davurica, and Stipa bungeana.
The fieldwork was conducted from July to August in 2015 and 2016. A total of 33 sites (Figure 1, some large area sites have planted different age’s plantations, each stand age plantation has 3 sample) at different stages of development (10, 12, 13, 15, 17, 18, 20, 25, 30, 35, 40, 45, and 50 years) of R. pseudoacacia artificial forests were randomly selected. Three 20 × 20 m plots were established at each site. Their coordinates were recorded using GPS receivers (3 m resolution). Ten 1 × 1 m quadrats and six 5 × 5 m quadrats were randomly set in each plot for sampling herbaceous plants and shrubs, respectively. All plant species were identified and recorded, and the abundance, height, and coverage of each species were recorded. The height was measured from the soil surface to the highest point of the plant, and the coverage was estimated as the percentage of the plot covered by crowns for the shrub species and visually for the herbaceous species.

2.2. Measurement of Soil Physicochemical Properties

Soil properties were measured in mid-July. Five soil samples were randomly collected from the upper layer (0–20 cm) in each plot and were mixed as one composite sample (contains O and A horizon). These samples were air-dried, weighed, and sieved through a 2-mm mesh. The amount of soil organic C (SOC) was measured using Walkley–Black dichromate oxidation [42], the amount of total N (TN) was determined by the micro-Kjeldahl procedure [43], and the amount of total P (TP) was measured using alkali fusion–Mo-Sb anti-spectrophotometry. Three samples were randomly collected from the soil layer (0–200 cm) for measuring the soil moisture content (SMC) at each site.

2.3. Diversity Analysis

Three measures of diversity (local scale) were estimated for each plot: Shannon’s diversity index (H′) [44], the Brillouin diversity index (H) [45], and Pielou’s evenness index (J′) [46]:
H = i = 1 S P i l n P i ,
H = 1 N l n N ! n 1 ! n 2 ! n 3 ! ,
J = H l n S .
where S is the total number of species in the sample, Pi is the ratio of species i to total species, N is the number of each species, and N is the total plant population in the sample.

2.4. Data Analysis

Stratification in the artificial forests was analyzed by a systematic cluster analysis based on species height using R 4.0.3 (R Core Team 2020). Differences in soil properties were calculated using a one-way analysis of variance and a Fisher’s least significant difference (LSD) multiple comparison (p < 0.05). Correlations between environmental factors and diversity were determined using a redundancy analysis (RDA) with CANOCO5.0. Pearson correlation coefficients were calculated using SPSS Statistics 20.

3. Results

3.1. Vertical Structure

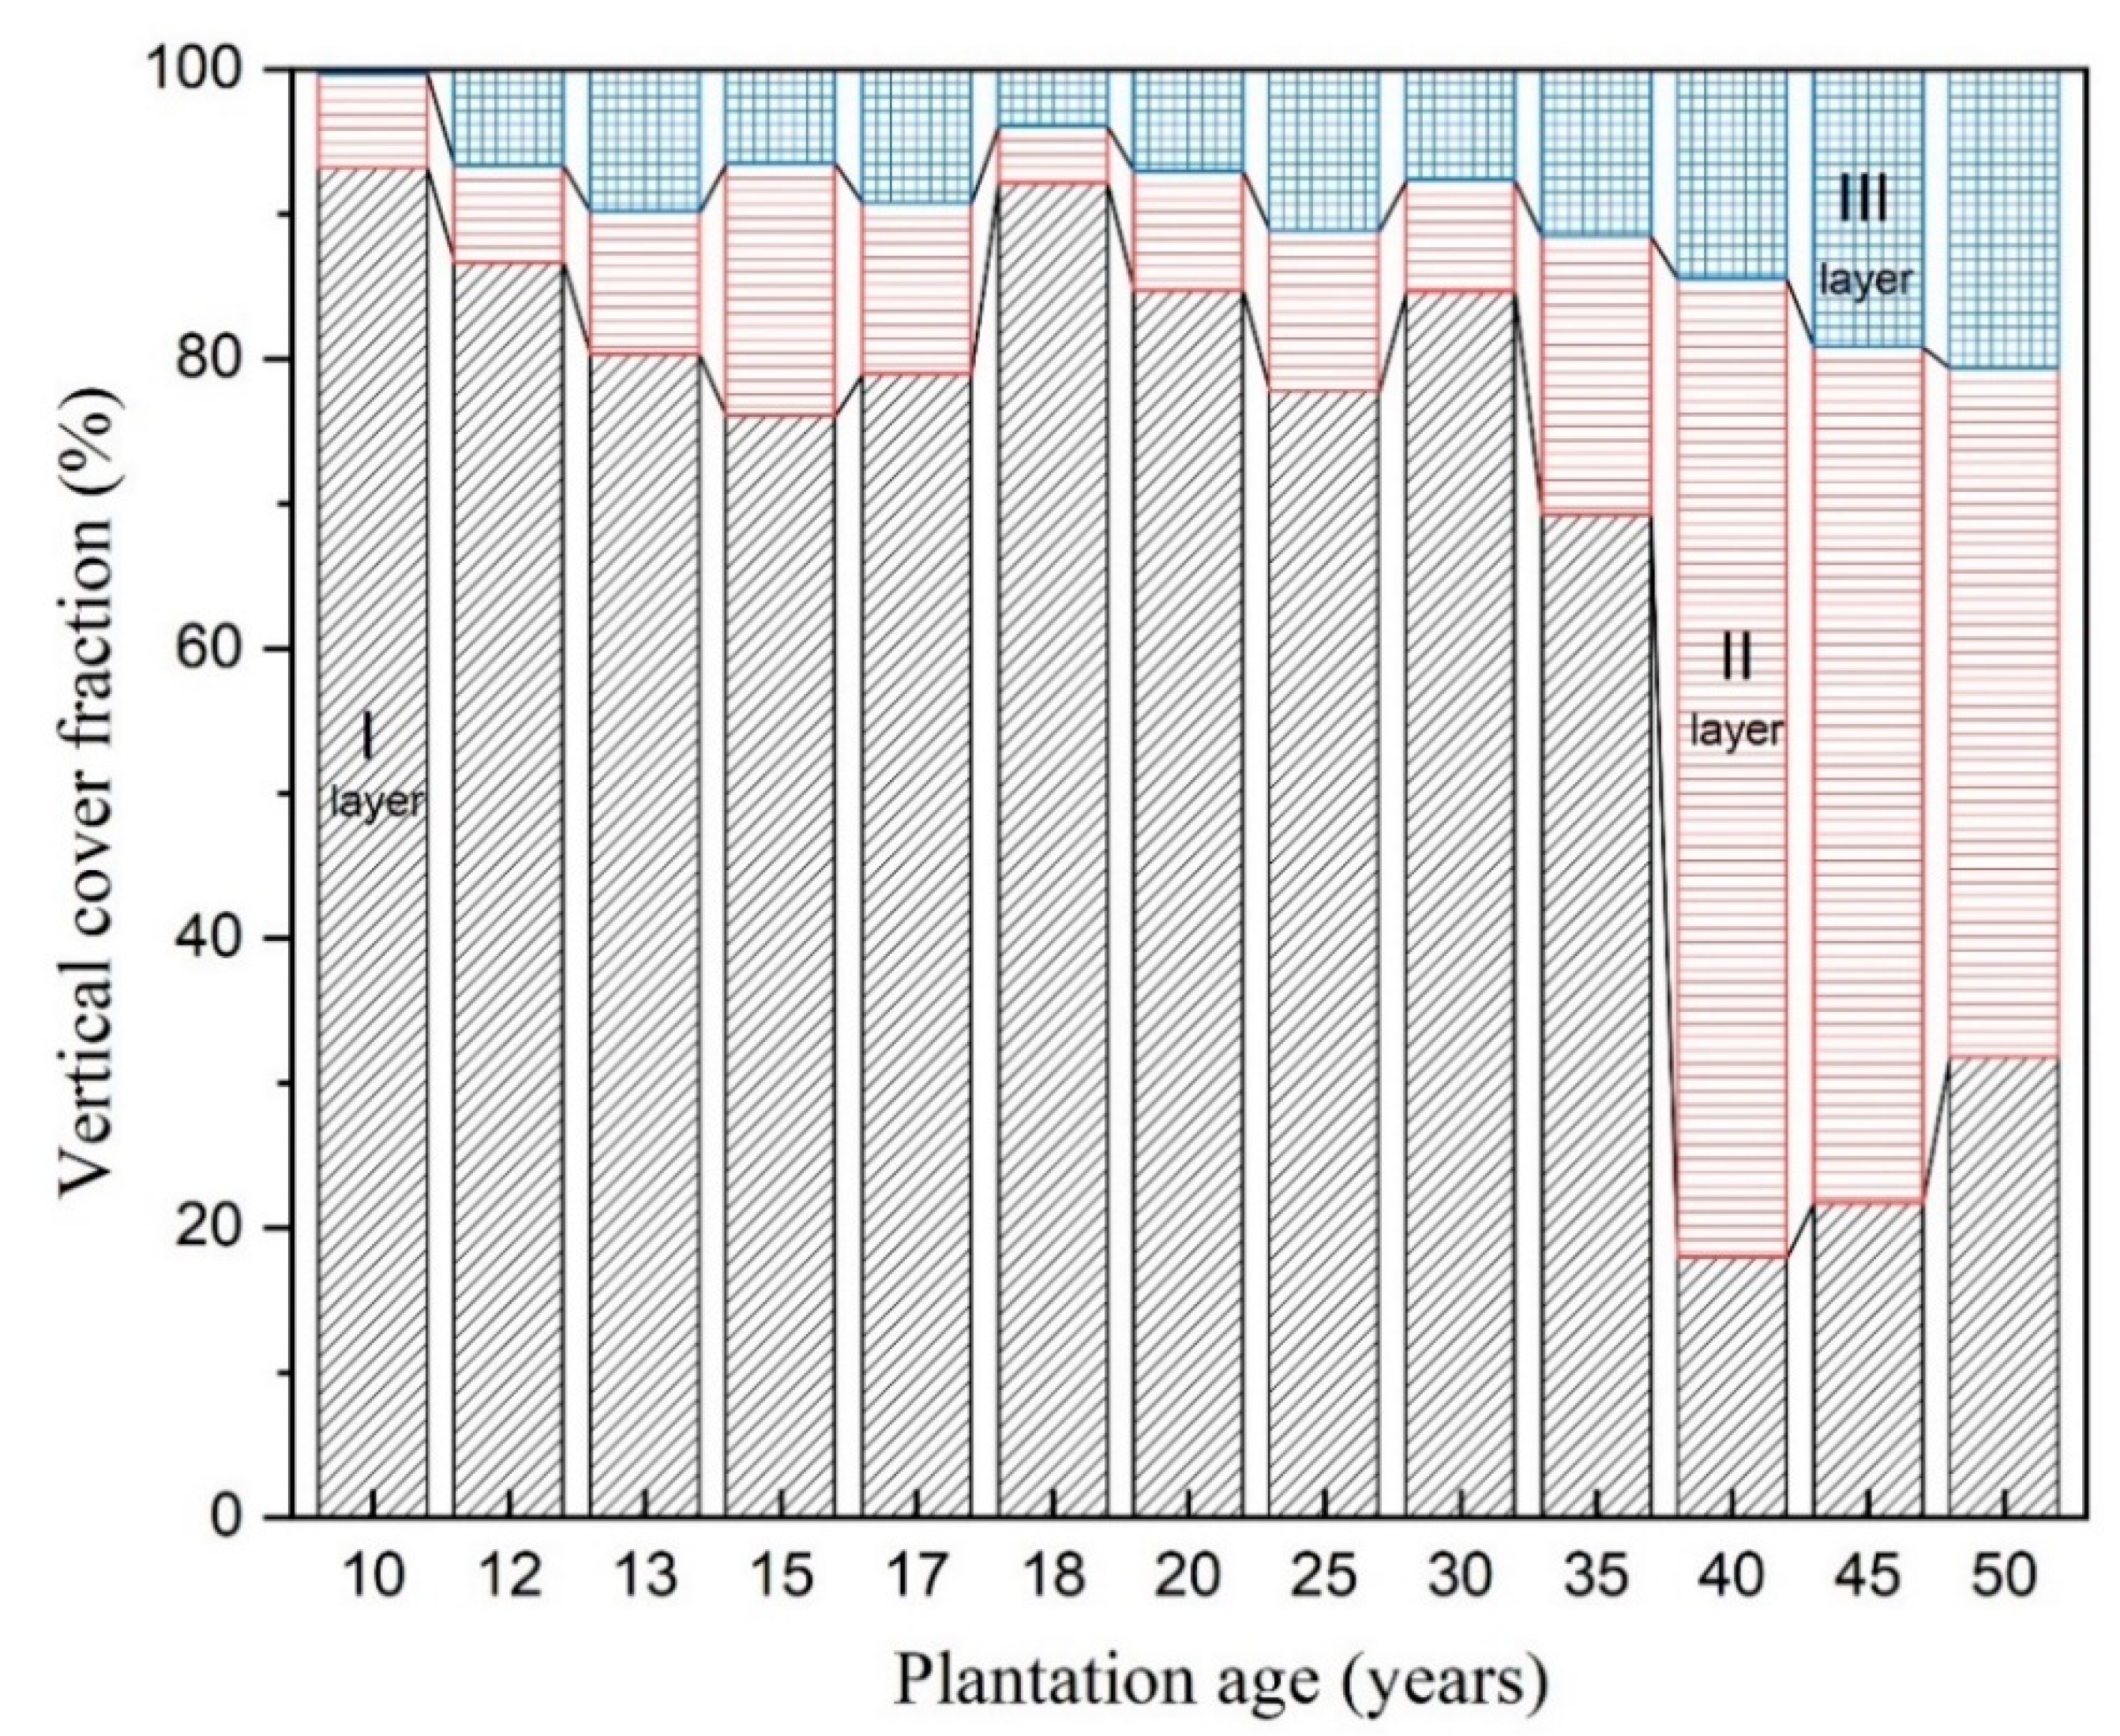
3.1.1. Stratification

A system clustering was proposed for stand segmentation on the basis of the average height of each species at the 33 sites (Figure 2). All undergrowth was divided into three layers: (I) a mainly low herbaceous layer (<80 cm), (II) a mainly high herbaceous layer (80–130 cm), and (III) a mainly shrub layer (>130 cm). Species with an average height >130 cm, such as H. rhamnoides, Sophora davidii, Ziziphus jujuba, and Periploca spium, were classed into layer III. Herbaceous layers were divided into two sublayers. Layer I mainly contained Viola philippica, Ajuga decumbens, Bidens parviflora, Dracocephalum moldavica, Sonchus oleraceus, Artemisia lavandulaefolia, Potentilla bifurca, Leymus secalinus, Melica scabrosa, and Hemistepta lyrate, among others. Layer II mainly contained herbaceous and tree seedings, such as Stipa grandis, Phragmites australis, Amorpha fruticose, and Ulmus daviana.

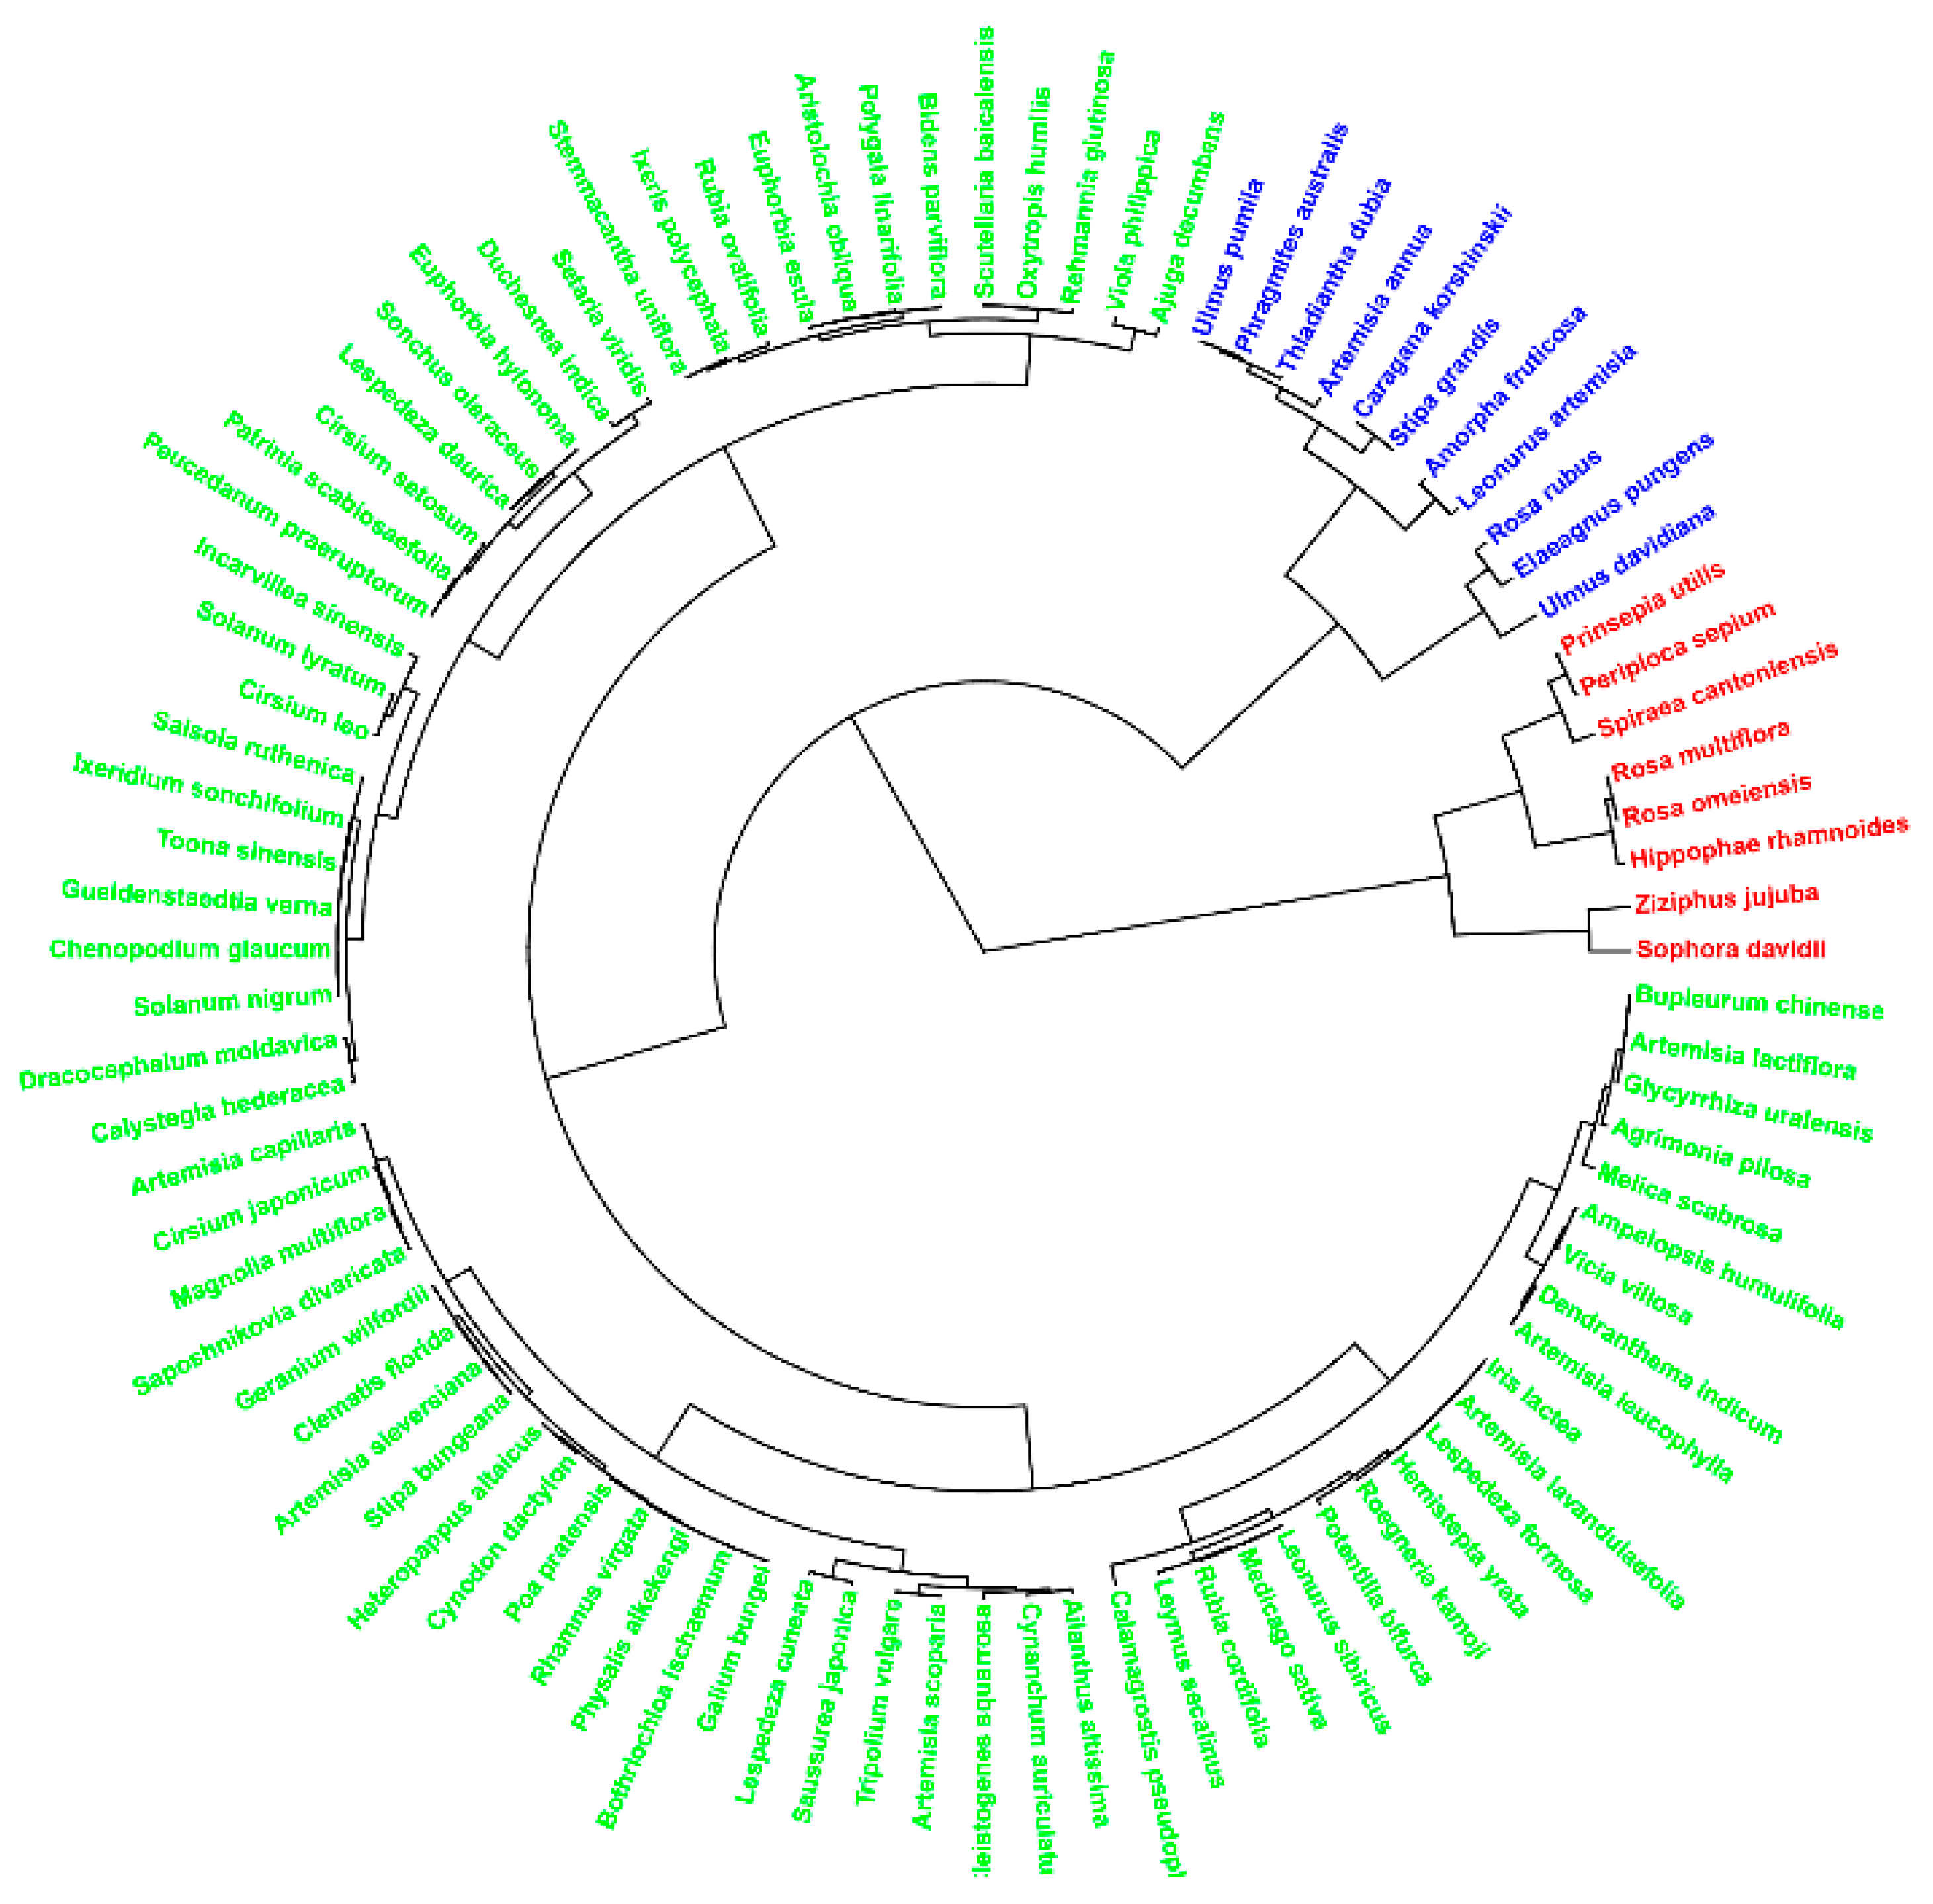
3.1.2. Understory Composition and Vertical Fractional Cover Dynamics

Mean vertical cover fractions dynamic of understory species for chronosequence of Robinia pseudoacacia plantations is shown in Figure 3. There was a clear trend of increase in that layers II and III were similar at stages of succession. The percentage of layer I first decreased, then increased, and later decreased. These data indicated that the structure and composition of the forests could change greatly over time, particularly in stand layers.

3.1.3. Diversity

We describe understory vegetation stand compotation using species diversity measured across a vertical profile. There were few or no species in layer III at the sample plot, and thus we did not count their diversity. We calculated the species diversity for the overall community, layer II, and layer I. The statistical parameters of the three diversity indices (H′, H, and J) are shown in Figure 4. H, H′, and J′ had similar trends in the different layers. All indices initially increased and then decreased from 10 to 25 years, and all indices increased from 25 to 35 years. All indices first decreased and then increased for the forests older than 35 years. J′ for the layers varied little between 10 and 35 years, but followed the order I > Community > II. H and H′ varied little between 10 and 50 years, but H varied more subtly than H′. H and H′ had the same trends for the shrub layer and the community as a whole, and layer I was the most stable. H and H′ followed the order Community > I > II for plantation 10–35 years. The diversity indices were higher for layer I than Community. H, H′, and J′ for the various layers peaked at 17 and 35 years.

3.2. Environmental Analysis

3.2.1. Soil Properties

The soil properties in our study tended to increase between 10 and 20 y and then began to fluctuate (Table 1). SOC content differed significantly among 10, 12, and 13 y but not among 15, 17, 18, 20, and 25 y. SOC content was highest at 45 y and then at 30 and 40 y. TN content did not differ significantly from 10 to 15 y but increased significantly for 17–20 y. TN content peaked at 30 y. TP content did not differ significantly in the early (10–13 y) or later (30–50 y) stages and peaked at 25 y. SMC initially increased, then decreased, and peaked at 25 and 35 y.

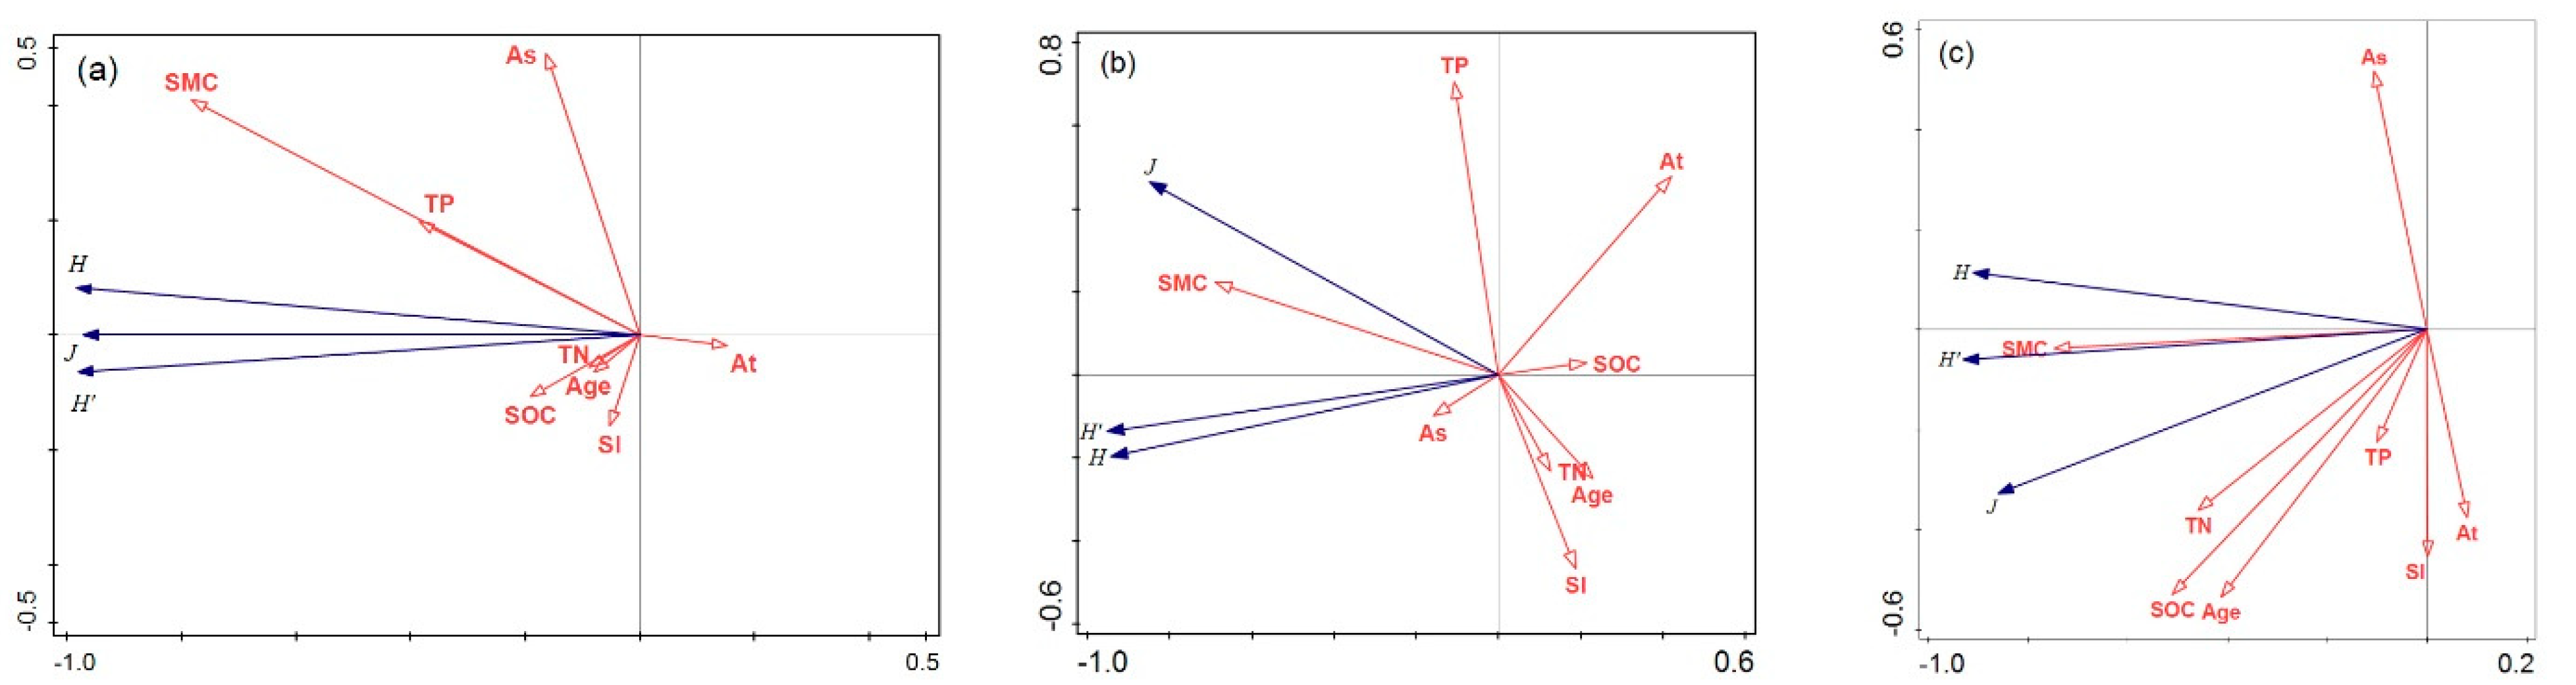
3.2.2. Redundancy Analysis

The ecological associations between the environmental factors and diversity were further identified using an RDA. The first RDA axes explained 96.42% of the total variation in the data (Figure 5a). Diversity was significantly correlated positively with SMC but negatively with At for overall community. The RDA indicated that SMC (F = 15.9, p = 0.002) and TP content (F = 1.9, p = 0.006) were the largest contributors to the variation in diversity and accounted for 60.9% and 14.8% of the variation, respectively. The order of influence of the various factors was SMC > TP > SOC > As > At > Age > TN > Sl. The relationships were analyzed to identify the environmental factors affecting the diversity in layer II (Figure 5b). SMC (F = 7.5, p = 0.002) and At (F = 2.2, p = 0.01) were the largest contributors to the variation in diversity and accounted for 43.9% and 18.0% of the variation, respectively. The order of influence was SMC > At > TP > Age > Sl > SOC > As > TN. The relationships among the environmental factors and diversity in layer I were analyzed (Figure 5c). SMC (F = 9.8, p = 0.002) and SOC (F = 23.2, p = 0.01) were the largest contributors to the variation in diversity and accounted for 54.9% and 26.0% of the variation, respectively. The order of influence was SMC > SOC > TN > Age > As > TP > At > Sl.

4. Discussion

4.1. Understory Stratification and Dynamic

Forest vertical structure is shaped by species competition for light, water, and soil nutrients, as well as by forest succession and past disturbances [47]. Black locust canopy did not change significantly in the early stages of succession. The characteristics of artificial forests thus determine their specific stand structures. Herbaceous species occurred in localized spots and accounted for a large proportion of the total recorded species (Figure 3). Herbaceous species that have a short growth cycle and fast metabolism can better adapt to the heterogeneity of soil. Moreover, layer I plants played an important role in the structures and functions of the Loess Plateau ecosystem. Soil nutrient contents fluctuate with successional stage, which differentially affects the growth of species and alters vegetation structure. The proportion of each layer in the community was constantly changing as the stage of succession. Different types of stand structure generally represented different species composition. The community contained more taller plants with the plantation succession. Soil fertility in our study increased with forest age, and the proportion of layer II in the community gradually increased (Figure 3). Herbaceous plants generally cover the forest floor under a canopy gap, dominate the area, and inhibit the regeneration of canopy species [47], which may account for the decrease in diversity of layer III in the intermediate stages of succession. The low herbaceous layers of plants are gradually replaced because of the increased canopy cover and the inherent asymmetry of light competition [20]. Therefore, the proportion of layer I decreased in the late plantation stage. There was an obvious discontinuity in the trend of vertical cover fraction components between 35 years and 40 years, as shown in Figure 3. The reason is that the overall species richness decreased after 40 years, which led to the increase of proportion of originally low diversity layer II and layer I. As shown in Figure 4, the trend or inflection point of similar discontinuity, whether H or H’, had a significant decline at 40 years. Plants respond to succession by changing species composition. Species in the layer I (e.g., Clematis florida, Poapratensis, and S. bungeana) can survive only under occasional favorable environmental conditions and have lower nutritional requirements [48], and thus the diversity was higher in layer I than layer II in all the succession stages. The Loess Plateau plantation community has a low species evenness, particularly at early stages of forest development because of a higher number of opportunists and a lower number of individuals [49]. Plants on the forest floor strongly affect SMC and the availability of soil nitrogen [47]. As the succession progressed, the proportions of different stratifications became clear, as seen in Figure 3, and the main reason for this was not the absolute increase of species richness but the specialization of species and decrease of overall diversity at the later stage of the succession. Diversity measured across a vertical profile allows a better understanding of the dynamics of community vertical structure. Species composition and structure adapt to particular environments in each region, suggesting that the management and protection of forest resources should pay attention to community structure and species composition, particularly for artificial forests.

4.2. Differential Responses of Understory Stand and Composition to Environmental Factors

As a key index of compositional, structural, and functional attributes, diversity has been used as an overall indicator of communities [50]. Species with different resource niches can be dominant in different environments. Different factors in our study influenced species diversity in the different layers (Figure 5). H′ has been widely used to estimate stand structure [51]. We thus determined the responses of understory stand composition to environmental factors using the relationship between diversity and environmental factors. Both H and H′ in our study could express the dynamic characteristics of a community, but H provided more details for the high herbaceous layer (e.g., 15 to 17 years). Species evenness index (J’) is commonly used to describe the relative abundance or proportion of individuals in a species. It is a supplementary description of species diversity index and reflects the evenness of species distribution. The high coincidence degree of evenness index in different layers may be due to the low species diversity and uneven distribution of the region itself. Undergrowth species are very rare in late succession, and due to this, J’ began to show a larger difference between different layers (40 to 50 years).
Species diversity is also influenced by many environmental factors, such as soil and topography [52]. Sparse canopy mitigates understory competition for light; thus, the stratification of layers relies more on soil nutrition and geography. Except for TP, all the other soil properties showed similar trends (Table 1), which may be because phosphorus is an element closely related to temperature and light condition. TP is related to the development and opening of plantation canopy. Higher canopy closure in the middle of succession resulted in higher phosphorus content, which corresponded to the peak of species diversity in the middle of succession. SMC, as an indirect indicator of precipitation, was an important soil property influencing species diversity. All of the three diversity indices almost coincided at 35 years, as seen in Figure 4. Because the species evenness was relatively high, all of the layer diversity indices almost coincided at the 35 year mark. The turning point in the species’ situation was also evident in soil moisture, which peaked at 35 years. This region of the Loess Plateau is known for its long agricultural history and serious soil erosion, as well as its dry climate with low precipitation [53]. Plants are sensitive to SMC because of the dry weather and serious soil erosion. This study also showed that SMC was the key factor influencing all layers’ compositions. Several reports have shown that elevation is an important topographical property influencing species diversity, which can indirectly regulate the distribution of plants [48]. Similar to previous studies, SMC and At in our study were the main drivers of species diversity in layer II. Arid areas with low precipitation and high evaporation are more suitable for deep-rooted shrub species. These species are mildly affected by the fertility of the topsoil, and most of them grow in the field layer as annual herbs can survive under only occasional favorable environmental conditions. SOC and TN contents thus become the main factors influencing layer I species diversity. The long-term interaction between the soil and vegetation eventually formed the specific community structure in this region. Our results demonstrated the importance of soil factors, related to species vertical structure, for determining community stability in artificial forests. Different environmental factors drive the stratification by influencing the diversity in each layer. Community structure is the result of plant adaptation to the environment. We can predict community structure using the characteristics of the environment and can also predict the environmental characteristics. Moreover, we can regulate stratification by adjusting environmental factors.

5. Conclusions

Understory composition and stratification of artificial forests have specific characteristics. Understory composition and stand of black locust plantation in Loess Plateau are mainly limited by soil moisture. SMC, At, SOC, and TN content affected species diversity and drove forest structure (Figure 6). Soil moisture content, an important soil factor, restricted the restoration of the local vegetation. We can intervene in the formation of community structure by controlling environmental factors, and thus communities can efficiently use the environmental resources and quickly form climax communities. For instance, we can control layer I composition by adjusting SMC, SOC, and TN. Comprehensive understanding of understory stand composition and interactions with the microenvironment is necessary to maintain and predict a plantation’s ecology function. We can effectively manage artificial forests by intervening in specific forests, providing a new strategy for the conservation of artificial forests. Further research should focus on the specific roles of environmental factors in forest stand composition.

Author Contributions

Formal analysis, H.-F.W.; funding acquisition, W.-F.H.; investigation, H.-F.W. and W.Z.; methodology, H.-F.W., G.L., T.G. and W.-F.H.; writing—original draft, H.-F.W. All authors have read and agreed to the published version of the manuscript.

Funding

This study was supported by 2018 TCM Public Health Service Subsidy Special “National Chinese Medicine Resources Census Project” ((2018)43, Baota district K3090219002, Zichang County K3090219001) and Shaanxi Academy of Forestry Special projects for technological innovation programs (SXLK2020-0204).

Institutional Review Board Statement

Not applicable.

Informed Consent Statement

Not applicable.

Data Availability Statement

The data presented in this study are available on request from the corresponding author.

Conflicts of Interest

The authors declare no conflict of interest.

References

  1. Zhu, J.; Song, L. A review of ecological mechanisms for management practices of protective forests. J. For. Res. 2020, 1–14. [Google Scholar] [CrossRef]
  2. Franklin, J.F.; Donato, D.C. Variable retention harvesting in the Douglas-fir region. Ecol. Process. 2020, 9, 1–10. [Google Scholar] [CrossRef]
  3. Brandle, J.; Hintz, D. 34. Windbreaks for the future. Agric. Ecosyst. Environ. 1988, 22, 593–596. [Google Scholar] [CrossRef]
  4. Zhang, L.; Schwärzel, K. China&rsquo;s Land Resources Dilemma: Problems, Outcomes, and Options for Sustainable Land Restoration. Sustainability 2017, 9, 2362. [Google Scholar] [CrossRef] [Green Version]
  5. Zhu, J.-J.; Zheng, X. The prospects of development of the Three-North Afforestation Program (TNAP): On the basis of the results of the 40-year construction general assessment of the TNAP. Chin. J. Ecol. 2019, 5, 1600–1610. [Google Scholar]
  6. Chen, C.; Park, T.; Wang, X.; Piao, S.; Xu, B.; Chaturvedi, R.K.; Fuchs, R.; Brovkin, V.; Ciais, P.; Fensholt, R.; et al. China and India lead in greening of the world through land-use management. Nat. Sustain. 2019, 2, 122–129. [Google Scholar] [CrossRef] [PubMed]
  7. Ma, C.; Luo, Y.; Shao, M.; Li, X.; Sun, L.; Jia, X. Environmental controls on sap flow in black locust forest in Loess Plateau, China. Sci. Rep. 2017, 7, 1–12. [Google Scholar] [CrossRef] [PubMed] [Green Version]
  8. IPCC. Annex I: Atlas of Global and Regional Climate Projections. In Climate Change 2013: The Physical Science Basis. Contribution of Working Group I to the Fifth Assessment Report of the Intergovernmental Panel on Climate Change; Intergovernmental Panel on Climate Change: Cambridge, UK; New York, NY, USA, 2013; p. 1311. [Google Scholar]
  9. Majasalmi, T.; Rautiainen, M. The impact of tree canopy structure on understory variation in a boreal forest. For. Ecol. Manag. 2020, 466, 118100. [Google Scholar] [CrossRef]
  10. Majasalmi, T.; Rautiainen, M.; Stenberg, P.; Manninen, T. Validation of MODIS and GEOV1 fPAR Products in a Boreal Forest Site in Finland. Remote Sens. 2015, 7, 1359–1379. [Google Scholar] [CrossRef] [Green Version]
  11. Tonteri, T.; Salemaa, M.; Rautio, P.; Hallikainen, V.; Korpela, L.; Merilä, P. Forest management regulates temporal change in the cover of boreal plant species. For. Ecol. Manag. 2016, 381, 115–124. [Google Scholar] [CrossRef]
  12. Gilliam, F.S. The Ecological Significance of the Herbaceous Layer in Temperate Forest Ecosystems. BioScience 2007, 57, 845–858. [Google Scholar] [CrossRef]
  13. Goulden, M.L.; Crill, P.M. Automated measurements of CO2 exchange at the moss surface of a black spruce forest. Tree Physiol. 1997, 17, 537–542. [Google Scholar] [CrossRef] [Green Version]
  14. Nilsson, M.C.; Wardle, D.A. Understory Vegetation as a Forest Ecosystem Driver: Evidence from the Northern Swedish Boreal Forest. Front. Ecol. Environ. 2005, 3, 421–428. [Google Scholar] [CrossRef]
  15. Van Der Veken, S.; Bellemare, J.; Verheyen, K.; Hermy, M. Life-history traits are correlated with geographical distribution patterns of western European forest herb species. J. Biogeogr. 2007, 34, 1723–1735. [Google Scholar] [CrossRef]
  16. Collins, L.; Bradstock, R.A.; De Dios, V.R.; Duursma, R.A.; Velasco, S.; Boer, M.M. Understorey productivity in temperate grassy woodland responds to soil water availability but not to elevated [CO2]. Glob. Chang. Biol. 2018, 24, 2366–2376. [Google Scholar] [CrossRef]
  17. Zellweger, F.; De Frenne, P.; Van Calster, H.; Chudomelová, M.; Decocq, G.; Dirnböck, T.; Durak, T.; Heinken, T.; Jaroszewicz, B.; Kopecký, M.; et al. Forest microclimate dynamics drive plant responses to warming. Science 2020, 368, 772–775. [Google Scholar] [CrossRef]
  18. Feroz, S.M.; Yoshimura, K.; Hagihara, A. Stand stratification and woody species diversity of a subtropical forest in limestone habitat in the northern part of Okinawa Island. J. Plant Res. 2008, 121, 329–337. [Google Scholar] [CrossRef]
  19. Gao, T.; Qiu, L.; Hammer, M.; Gunnarsson, A. The Importance of Temporal and Spatial Vegetation Structure Information in Biotope Mapping Schemes: A Case Study in Helsingborg, Sweden. Environ. Manag. 2011, 49, 459–472. [Google Scholar] [CrossRef] [PubMed]
  20. Laurans, M.; Herault, B.; Vieilledent, G.; Vincent, G. Vertical stratification reduces competition for light in dense tropical forests. For. Ecol. Manag. 2014, 329, 79–88. [Google Scholar] [CrossRef]
  21. Staab, M.; Blüthgen, N.; Klein, A.-M. Tree diversity alters the structure of a tri-trophic network in a biodiversity experiment. Oikos 2014, 124, 827–834. [Google Scholar] [CrossRef]
  22. Barros, C.; Thuiller, W.; Georges, D.; Boulangeat, I.; Münkemüller, T. N-dimensional hypervolumes to study stability of complex ecosystems. Ecol. Lett. 2016, 19, 729–742. [Google Scholar] [CrossRef] [Green Version]
  23. Zehm, A.; Nobis, M.; Schwabe, A. Multiparameter analysis of vertical vegetation structure based on digital image processing. Flora Morphol. Distrib. Funct. Ecol. Plants 2003, 198, 142–160. [Google Scholar] [CrossRef] [Green Version]
  24. Hamraz, H.; Contreras, M.A.; Zhang, J. Forest understory trees can be segmented accurately within sufficiently dense airborne laser scanning point clouds. Sci. Rep. 2017, 7, 6770. [Google Scholar] [CrossRef] [PubMed] [Green Version]
  25. Jules, M.J.; Sawyer, J.O.; Jules, E.S. Assessing the relationships between stand development and understory vegetation using a 420-year chronosequence. For. Ecol. Manag. 2008, 255, 2384–2393. [Google Scholar] [CrossRef]
  26. Nan, M.-X.; Sen, Z.-Y.; Lei, Z.; Ying, X. Population structure and understory species diversity of different aged Pinus sylvestris var. mongolica plantations in Nenjiang Sandy Land of Northeast China. Chin. J. Appl. Ecol. 2012, 23, 2332. [Google Scholar] [CrossRef]
  27. Niu, R.; Liu, J.; Zhao, X.; Qin, Y. Ecological benefit of different revegetated covers in the middle of Hexi corridor, northwestern China. Environ. Earth Sci. 2015, 74, 5699–5710. [Google Scholar] [CrossRef]
  28. Bernhardt-Römermann, M.; Gray, A.; Vanbergen, A.J.; Bergès, L.; Bohner, A.; Brooker, R.W.; De Bruyn, L.; De Cinti, B.; Dirnböck, T.; Grandin, U.; et al. Functional traits and local environment predict vegetation responses to disturbance: A pan-European multisite experiment. J. Ecol. 2011, 99, 777–787. [Google Scholar] [CrossRef]
  29. Connolly, J.; Wayne, P. Asymmetric competition between plant species. Oecologia 1996, 108, 311–320. [Google Scholar] [CrossRef]
  30. Kern, C.C.; Montgomery, R.A.; Reich, P.B.; Strong, T.F. Canopy gap size influences niche partitioning of the ground-layer plant community in a northern temperate forest. J. Plant Ecol. 2013, 6, 101–112. [Google Scholar] [CrossRef] [Green Version]
  31. Fourrier, A.; Bouchard, M.; Pothier, D. Effects of canopy composition and disturbance type on understorey plant assembly in boreal forests. J. Veg. Sci. 2015, 26, 1225–1237. [Google Scholar] [CrossRef]
  32. Rüger, N.; Wirth, C.; Wright, S.J.; Condit, R. Functional traits explain light and size response of growth rates in tropical tree species. Ecology 2012, 93, 2626–2636. [Google Scholar] [CrossRef]
  33. Plewa, R.; Jaworski, T.; Hilszczański, J.; Horák, J. Investigating the biodiversity of the forest strata: The importance of vertical stratification to the activity and development of saproxylic beetles in managed temperate deciduous forests. For. Ecol. Manag. 2017, 402, 186–193. [Google Scholar] [CrossRef]
  34. Batterman, S.A.; Hedin, L.O.; Van Breugel, M.; Ransijn, J.; Craven, D.J.; Hall, J.S. Key role of symbiotic dinitrogen fixation in tropical forest secondary succession. Nature 2013, 502, 224–227. [Google Scholar] [CrossRef] [PubMed]
  35. Kargar-Chigani, H.; Javadi, S.A.; Zahedi-Amiri, G.; Khajeddin, S.J.; Jafari, M. Vegetation composition differentiation and species-environment relationships in the northern part of Isfahan Province, Iran. J. Arid. Land 2017, 9, 161–175. [Google Scholar] [CrossRef] [Green Version]
  36. Zhang, H.; Guo, W.; Yu, M.; Wang, G.G.; Wu, T. Latitudinal patterns of leaf N, P stoichiometry and nutrient resorption of Metasequoia glyptostroboides along the eastern coastline of China. Sci. Total Environ. 2018, 618, 1–6. [Google Scholar] [CrossRef] [PubMed]
  37. Oliveira, B.F.; Scheffers, B.R. Vertical stratification influences global patterns of biodiversity. Ecography 2018, 42, 249. [Google Scholar] [CrossRef] [Green Version]
  38. Ohsawa, M. Latitudinal comparison of altitudinal changes in forest structure, leaf-type, and species richness in humid monsoon Asia. Plant Ecol. 1995, 121, 3–10. [Google Scholar] [CrossRef]
  39. Schwärzel, K.; Zhang, L.; Montanarella, L.; Wang, Y.; Sun, G. How afforestation affects the water cycle in drylands: A process-based comparative analysis. Glob. Chang. Biol. 2020, 26, 944–959. [Google Scholar] [CrossRef] [Green Version]
  40. Neumann, M.; Starlinger, F. The significance of different indices for stand structure and diversity in forests. For. Ecol. Manag. 2001, 145, 91–106. [Google Scholar] [CrossRef]
  41. Wang, H.; Deng, N.; Wu, D.; Hu, S.; Kou, M. Long-term net transformation and quantitative molecular mechanisms of soil nitrogen during natural vegetation recovery of abandoned farmland on the Loess Plateau of China. Sci. Total Environ. 2017, 607, 152–159. [Google Scholar] [CrossRef] [PubMed]
  42. Nelson, D.W.; Sommers, L.E. Total carbon, organic carbon, and organic matter. In Methods of Soil Analysis Part 2; Chemical and Microbial Properties: Madison, WI, USA, 1982; pp. 360–383. [Google Scholar]
  43. Su, Y.Z.; Zhao, W.Z.; Su, P.X.; Zhang, Z.H.; Wang, T.; Ram, R. Ecological effects of desertification control and desertified land reclamation in an oasis–desert ecotone in an arid region: A case study in Hexi Corridor, northwest China. Ecol. Eng. 2007, 29, 117–124. [Google Scholar] [CrossRef]
  44. Lindgren, P.M.; Sullivan, T.P. Influence of alternative vegetation management treatments on conifer plantation attributes: Abundance, species diversity, and structural diversity. For. Ecol. Manag. 2001, 142, 163–182. [Google Scholar] [CrossRef]
  45. Reyes, G.P.; Kneeshaw, D.D. Moderate-severity disturbance dynamics in Abies balsamea-Betula spp. forests: The relative importance of disturbance type and local stand and site characteristics on woody vegetation response. Écoscience 2008, 15, 241–249. [Google Scholar] [CrossRef]
  46. Perry, D.A. The scientific basis of forestry. Annu. Rev. Ecol. Syst. 1998, 29, 435–466. [Google Scholar] [CrossRef]
  47. Inoue, T.; Fukuzawa, K.; Watanabe, T.; Yoshida, T.; Shibata, H. Spatial pattern of soil nitrogen availability and its relationship to stand structure in a coniferous-broadleaved mixed forest with a dense dwarf bamboo understory in northern Japan. Ecol. Res. 2017, 32, 227–241. [Google Scholar] [CrossRef]
  48. Zhang, P.; Shao, M.; Zhang, X. Spatial pattern of plant species diversity and the influencing factors in a Gobi Desert within the Heihe River Basin, Northwest China. J. Arid. Land 2017, 9, 379–393. [Google Scholar] [CrossRef]
  49. Ricotta, C.; Avena, G. On the relationship between Pielou’s evenness and landscape dominance within the context of Hill’s diversity profiles. Ecol. Indic. 2003, 2, 361–365. [Google Scholar] [CrossRef]
  50. Bergholz, K.; May, F.; Giladi, I.; Ristow, M.; Ziv, Y.; Jeltsch, F. Environmental heterogeneity drives fine-scale species assembly and functional diversity of annual plants in a semi-arid environment. Perspect. Plant Ecol. Evol. Syst. 2017, 24, 138–146. [Google Scholar] [CrossRef]
  51. Correia, D.L.P.; Raulier, F.; Filotas, É.; Bouchard, M. Stand height and cover type complement forest age structure as a biodiversity indicator in boreal and northern temperate forest management. Ecol. Indic. 2017, 72, 288–296. [Google Scholar] [CrossRef]
  52. Zuo, X.; Zhao, X.; Zhao, H.; Zhang, T.; Li, Y.; Wang, S.; Li, W.; Powers, R. Scale dependent effects of environmental factors on vegetation pattern and composition in Horqin Sandy Land, Northern China. Geoderma 2012, 173, 1–9. [Google Scholar] [CrossRef]
  53. Li, Z.; Liu, C.; Dong, Y.; Chang, X.; Nie, X.; Liu, L.; Xiao, H.; Lu, Y.; Zeng, G. Response of soil organic carbon and nitrogen stocks to soil erosion and land use types in the Loess hilly–gully region of China. Soil Tillage Res. 2017, 166, 1–9. [Google Scholar] [CrossRef]
Figure 1. Location of the study sites in the center of the Loess Plateau, China.
Forests 12 00195 g001
Figure 2. Hierarchical clustering of understory species based on average height. The same color represents the same group.
Forests 12 00195 g002
Figure 3. Mean vertical cover fractions (%) of understory species for chronosequence of Robinia pseudoacacia plantations.
Forests 12 00195 g003
Figure 4. Diversity indices for the overall community, layer I, and layer II for the various forest ages.
Forests 12 00195 g004
Figure 5. Redundancy analysis of species diversity of (a) overall community, (b) layer II, and (c) layer I with environmental factors. SOC, soil organic carbon; TN, total N; TP, total P; SMC, soil moisture content; Sl, slope; As, aspect; At, altitude.
Forests 12 00195 g005
Figure 6. Understory stratification and main influence factors in black locust plantations of Loess Plateau.
Forests 12 00195 g006
Table 1. Mean (± SD) soil organic C, total N, total P, and moisture contents in the R. pseudoacacia plantations.
Age (y)SOC (g·kg−1)TN (g·kg−1)TP (g·kg−1)SMC (%)
102.86 ± 0.10 g0.44 ± 0.02 f0.55 ± 0.01 c5.92 ± 0.1 d
123.87 ± 0.29 f0.48 ± 0.03 f0.62 ± 0.03 c5.58 ± 0.13 d
134.57 ± 0.33 e0.53 ± 0.02 ef0.57 ± 0.01 c6.90 ± 0.45 c
154.58 ± 0.20 e0.54 ± 0.05 ef0.78 ± 0.07 b7.45 ± 0.14 b
177.22 ± 0.29 d0.65 ± 0.07 d1.11 ± 0.13 a7.66 ± 0.33 b
187.33 ± 0.57 d0.63 ± 0.04 d1.08 ± 0.14 a7.64 ± 0.10 b
207.48 ± 0.42 d0.66 ± 0.06 d1.06 ± 0.08 a7.13 ± 0.22 b
257.41 ± 0.70 d0.65 ± 0.02 de1.13 ± 0.12 a8.17 ± 0.33 a
3010.48 ± 0.03 b1.10 ± 0.05 a0.60 ± 0.08 c8.00 ± 0.20 a
358.65 ± 0.08 c0.96 ± 0.02 bc0.58 ± 0.07 c8.17 ± 0.28 a
4010.48 ± 0.18 b1.10 ± 0.15 a0.60 ± 0.06 c7.45 ± 0.50 b
4511.55 ± 0.03 a1.05 ± 0.01 ab0.61 ± 0.08 c6.20 ± 0.20 ab
509.87 ± 0.21 b0.90 ± 0.08 c0.62 ± 0.06 c7.64 ± 0.40 b
Different letters within a column indicate significant differences at p < 0.05.
Publisher’s Note: MDPI stays neutral with regard to jurisdictional claims in published maps and institutional affiliations.

