Article

Canopy Gaps Improve Landscape Aesthetic Service by Promoting Autumn Color-Leaved Tree Species Diversity and Color-Leaved Patch Properties in Subalpine Forests of Southwestern China

Key Laboratory of Eco-Environments Three Gorges Reservoir Region, Chongqing Key Laboratory of Plant Ecology and Resources Research in Three Gorges Reservoir Region, School of Life Science, Southwest University, Chongqing 400715, China
*
Author to whom correspondence should be addressed.
Forests 2021, 12(2), 199; https://doi.org/10.3390/f12020199
Submission received: 30 December 2020 / Revised: 4 February 2021 / Accepted: 4 February 2021 / Published: 8 February 2021
(This article belongs to the Section Forest Ecology and Management)

Abstract

:
Background and Objectives: The landscape aesthetic service (LAS) is a crucial ecosystem service in subalpine forests of the mountain and ravine regions of the Tibetan Plateau, especially in autumn; it can provide important ecological and economic value, improving the livelihood of the local people. Canopy gap acts as a key role in the maintenance of species diversity and forest stability and ecosystem services. However, the mechanisms and interactions of forest stability maintained by gap formations and LAS via gap dynamics are not fully understood. The aim of this study was to explore the effects of canopy gaps on autumn color-leaved tree species diversity (ACTSD), color-leaved patch structure attributes (CPSA), LAS, and their interactions during the autumn viewing period, and to provide a fundamental basis for the management and protection of subalpine autumn color-leaved forests (SACF). Materials and Methods: We used very high-resolution images to quantify gap characteristics and examined the effects of canopy gaps on ACTSD, CPSA, and LAS in 21 SACF plots in southwestern China. We then used path analysis to determine the relationships between these factors. Results: The number of gaps and total gap area were the key gap characteristics affecting LAS; particularly, medium canopy gaps (51–100 m2) played a more important role. The path model showed that increasing the total gap area along with the number of medium canopy gaps had direct positive effects on ACTSD, color-leaved patch diversity, and total color-leaved patch area, thus improving the LAS. Conclusions: Canopy gaps indirectly improve LAS in autumn by significantly affecting ACTSD and CPSA. Our results suggest that forest managers may be able to manipulate the numbers and proportion of medium canopy gaps to protect and preserve ACTSD and color-leaved landscapes, promoting the LAS of SACF, and in turn, ensuring the coordinated development of economic, social, and ecological benefits for the underdeveloped rural montane areas of southwestern China.

1. Introduction

Mosaic patches in forests—the result of canopy gap formation and dynamics—play a significant role in the conservation of species diversity, stabilization of forest landscape structure, and functioning of forest ecosystem services [1,2,3]. Canopy gaps are caused by the destruction or mortality of canopy trees or branches by various factors such as old age, pests, and strong snow, wind, or fire [4]. Canopy gap formation affects microenvironmental heterogeneity and resource distribution and offers opportunities for tree colonization and regeneration. Over time, partial filling trees gradually reach or approach the canopy layer and form relatively closed forest patches. This process is termed gap dynamics or forest growth cycle [5,6]. The subalpine forest distributed in the eastern edge of the Tibetan plateau is maintained by this kind of forest growth cycle [7]. A conceptual model has been developed by Wang et al. [7] to describe the cycle stages in a subalpine forest, which are the creation of gaps in coniferous forests due to disturbance (which serve as triggers for the forest cycles), the development of broad-leaved patches in the gaps, the regeneration of broad-leaved patches into mixed patches, and finally the return of coniferous forests. Therefore, forest gap dynamics are an important form of forest stability maintenance and species diversity conservation, not only in tropical regions but also in subalpine mountain areas [8].
Subalpine autumn color-leaved forests are widely distributed in the mountain and ravine regions at the eastern edge of the Tibetan Plateau in southwestern China. The stability of forests is often conserved by various mosaic patches (in different gap filling stages), which are formed by gaps with a green background [9]. These green backgrounds are often dominated by evergreen fir species, and autumn-colored patches are dominated by deciduous tree species (e.g., birch, maple, poplar, and mountain ash, also called autumn color-leaved tree species because of their colorful leaves in the autumn season). Previous research in subalpine forests indicated that autumn color-leaved trees are considered pioneer tree species in the subalpine forest gap succession series, and canopy gaps provide favorable environmental conditions (e.g., high light environments) for their establishment and regeneration [9]. Therefore, canopy gaps are an important structure for the existence and maintenance of autumn color-leaved trees in subalpine autumn color-leaved forests. Meanwhile, the autumn color-leaved trees and the color-leaved patches within canopy gaps display bright colors in autumn that can evoke positive emotional responses in people [10] and play a central role in determining the landscape aesthetic service of subalpine autumn color-leaved forests. Therefore, canopy gaps play a key role in the supply of landscape aesthetic service in subalpine autumn color-leaved forests; as such, we need a better understanding of how forest stability is maintained by gap formations and how forest aesthetic service functioning is maintained via gap dynamics.
Landscape aesthetic service is a key cultural ecosystem service and is related to biodiversity [11,12,13], and several studies have shown that landscape aesthetic service correlates positively with species diversity [14,15]. Furthermore, the structural attributes of patches are key factors in determining this ecosystem service [16,17]. Many studies have found that color patch diversity [18], patch shape complexity [19], and spatial distribution and proportion of color patches [20] have a strong impact on landscape aesthetic service. The changes in autumn color-leaved tree species diversity and color-leaved patch structure attributes induced by canopy gaps may have a significant influence on landscape aesthetic service in subalpine autumn color-leaved forests. Therefore, it is likely that an inherent linkage between forest community stability and forest ecosystem services (landscape aesthetic service) exists by way of canopy refilling processes (gap dynamics). However, very few studies have examined how canopy gaps affect autumn color-leaved tree species diversity and color-leaved patch structure attributes, thereby affecting landscape aesthetic service in subalpine color-leaved forests during the autumn viewing period.
An objective and quantifiable evaluation of gap characteristics and patch structure attributes is essential for understanding the effects of canopy gaps on species diversity, patch structure attributes, and related ecosystem services. The traditional method is based on ground measurements at the stand level [21] and is effective to account for gap area and number, but not to accurately measure other key gap features (e.g., shape) and to adequately reflect the spatial distribution pattern; additionally, surveys over large areas are time consuming and labor intensive [22]. The method based on remote sensing satellite images or aerial photography is thought to be a better way to solve these problems so as to obtain measurements efficiently and accurately at a large scale [23]. However, even the resolution of conventional aerial or satellite images is commonly not high enough to permit accurate spatial quantifications of small canopy gaps or patches [24]. With the development of unmanned aerial vehicles with near-surface remote sensing technology, very high-resolution aerial images can be obtained easily, which can then be used to detect small canopy gaps or patches, even those with sizes as small as 1 m2 [25].
In this study, we used very high-resolution images to quantify the characteristics of canopy gaps and color-leaved patches and examined the effects of gap characteristics on autumn color-leaved tree species diversity, color-leaved patch structure attributes, and landscape aesthetic service. Path analysis was used to determine the relationship between canopy gaps and autumn color-leaved tree species diversity, color-leaved patch structure attributes, and landscape aesthetic service in 21 subalpine autumn color-leaved forest plots in autumn. The objective of this study was to quantify the effects of canopy gaps on autumn color-leaved tree species diversity, color-leaved patch structure attributes, landscape aesthetic service, and their interactions. We hypothesized that autumn color-leaved tree species diversity, color diversity, and color patch area have positive effects on landscape aesthetic service, and canopy gaps positively influence landscape aesthetic service by directly affecting autumn color-leaved tree species diversity and color-leaved patch structure properties. We additionally postulated that gap size and gap number were the two most important aspects affecting color-leaved patch attributes, further affecting landscape aesthetic service.

2. Materials and Methods

2.1. Study Area

This study was conducted in the subalpine autumn color-leaved forests of Li County, located in western Sichuan, China (102°41′–103°14′ E, 31°24′–31°50′ N) (Figure 1). Elevation ranges from 2000 to 3500 m, with slope ranging approximately 5–40°. The region is characterized by a monsoon mountain climate, with dry periods from November to April and wet periods from May to October. The annual mean temperature is 8.66 °C, ranging from 0.56 °C in January to 16.39 °C in July. The average annual precipitation is 772 mm, ranging from 600 to 1100 mm, 88% of which falls during the summer season from May to October [26].
The region is famous for the biggest autumn color-leaved sightseeing forests of China, characterized by high biodiversity and rich tourism resources; ecotourism based on the viewing of autumn color-leaved forests is one of the major components of the revenue of the area. The tourism income during the subalpine autumn color-leaved forest viewing period (in October) is 920 million yuan, accounting for 28.21% of the annual tourism income of Li County (the data comes from the latest (2016) released by the Li County Statistics Bureau, http://www.ablixian.gov.cn/lxrmzf/c100087/201703/1feca3231b-314814a277db9d7e63d72d.shtml (3 February 2021)). The vegetation is dominated by evergreen trees (Abies faxoniana, Picea asperata, Quercus aquifolioides) and mixed with autumn color-leaved trees such as Acer oliverianum, Betula platyphylla, Cotinus coggygria, Sorbus koehneana, and Larix kaempferi.

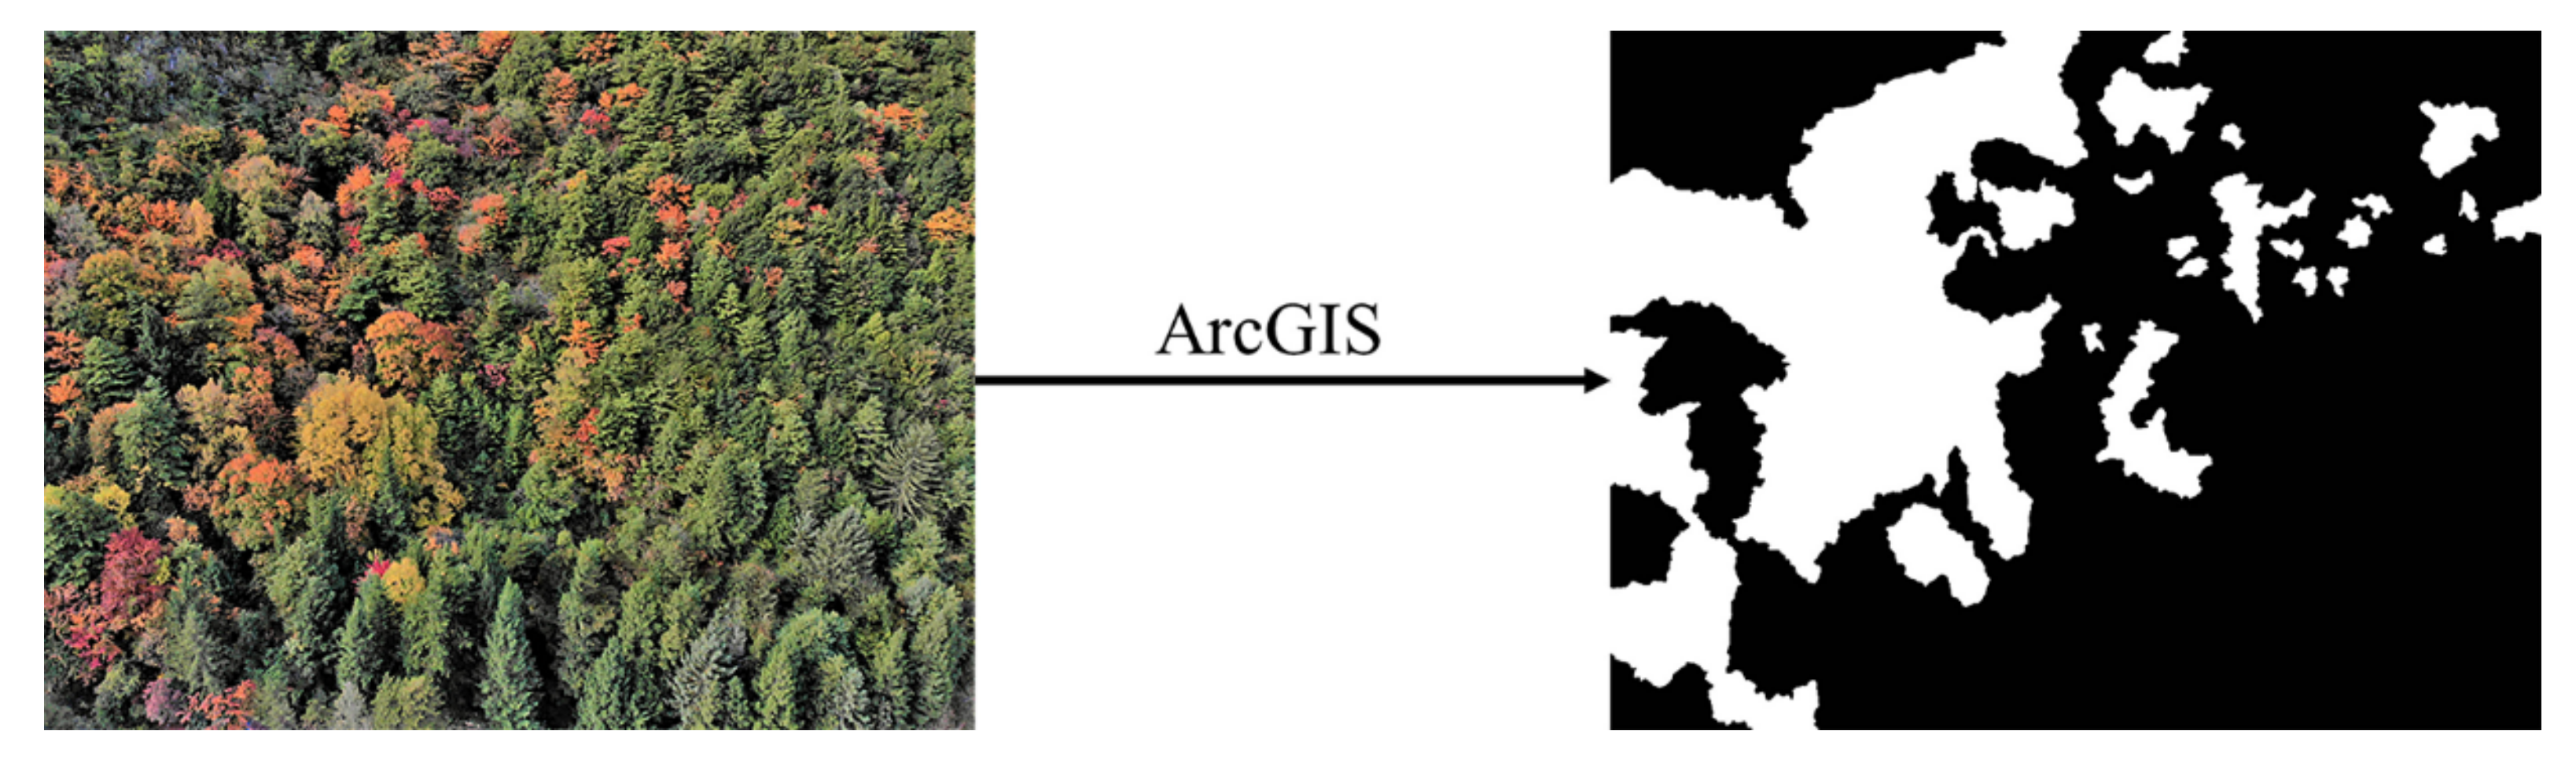
2.2. Gap Characteristics Measurement

In this study, color-leaved mosaic patches originated from the filling of canopy gaps in forests; therefore, we defined canopy gap in this study as a space filled with autumn color-leaved trees and surrounded by evergreen trees at the boundary. Canopy gaps were detected and mapped from very high-resolution aerial photographs (approximately 2.5 cm/pixel). Aerial photos of 21 plots were taken by drones (DJI Mavic air, Shenzhen, China; details of the drones can be found at https://www.dji.com/cn/mavic-air/info#specs (8 November 2020)) during autumn leaf-coloration peak periods in October 2018 and 2019 [27]. The photos were taken from approximately 50 m above the center of the target plots, with the camera perpendicular to the slope, in order to obtain very high-resolution images and to ensure that the shooting area of all plots was approximately 7500 m2. Maps of gaps were manually sketched with visual interpretation to create shape files as accurately as possible using ArcGIS 10.6 (ESRI, Redlands, CA, USA); vector data were subsequently converted to raster data (Figure 2).
Landscape indices have been proven to accurately quantify gap characteristics in previous studies [25,28]. Three widely used indices were selected to quantify the gap size, shape, and spatial distribution. Gap area represented gap size. Gap shape index estimated gap shape complexity, with a value of 1 used as for the standard shape (square of same size); the larger the gap shape index value, the more complex the shape. Euclidean nearest-neighbor distance of gaps assessed the degree of aggregation of gaps (the distance to the nearest neighboring gap); the smaller the value, the more aggregated the gap distribution. These indicators were calculated using FRAGSTATS 4.2.1 (University of Massachusetts, Amherst, MA, USA), a spatial pattern analysis program used to quantify landscape structure attributes.

2.3. Autumn Color-Leaved Tree Species Diversity Measurement

Based on the map of gaps at each site, each gap was placed in a 25 m2 quadrat to investigate canopy autumn color-leaved trees. When the gap area was larger and one quadrat could not represent all autumn color-leaved tree species within the canopy gap, more quadrats were added to measure as much of the autumn color-leaved tree species of the canopy gap as possible (details of the number of quadrats in canopy gaps are provided in Table S1). Species name, species number, and leaf color were recorded in each quadrat for September to October 2019. Considering the inconsistency of quadrat area in gaps, the Gleason index (GI) was used to calculate the autumn color-leaved tree species diversity; the formula for the index is as follows: GI = S/Ln A, where S is the number of autumn color-leaved tree species in each gap and A is the total survey area of each gap. A total of 35 tree species were noted, and 27 autumn color-leaved tree species were recorded, including S. koehneana, Rhus punjabensis, A. oliverianum, A. davidii, B. platyphylla, B. utilis, C. coggygria, L. kaempferi, L. mastersiana.

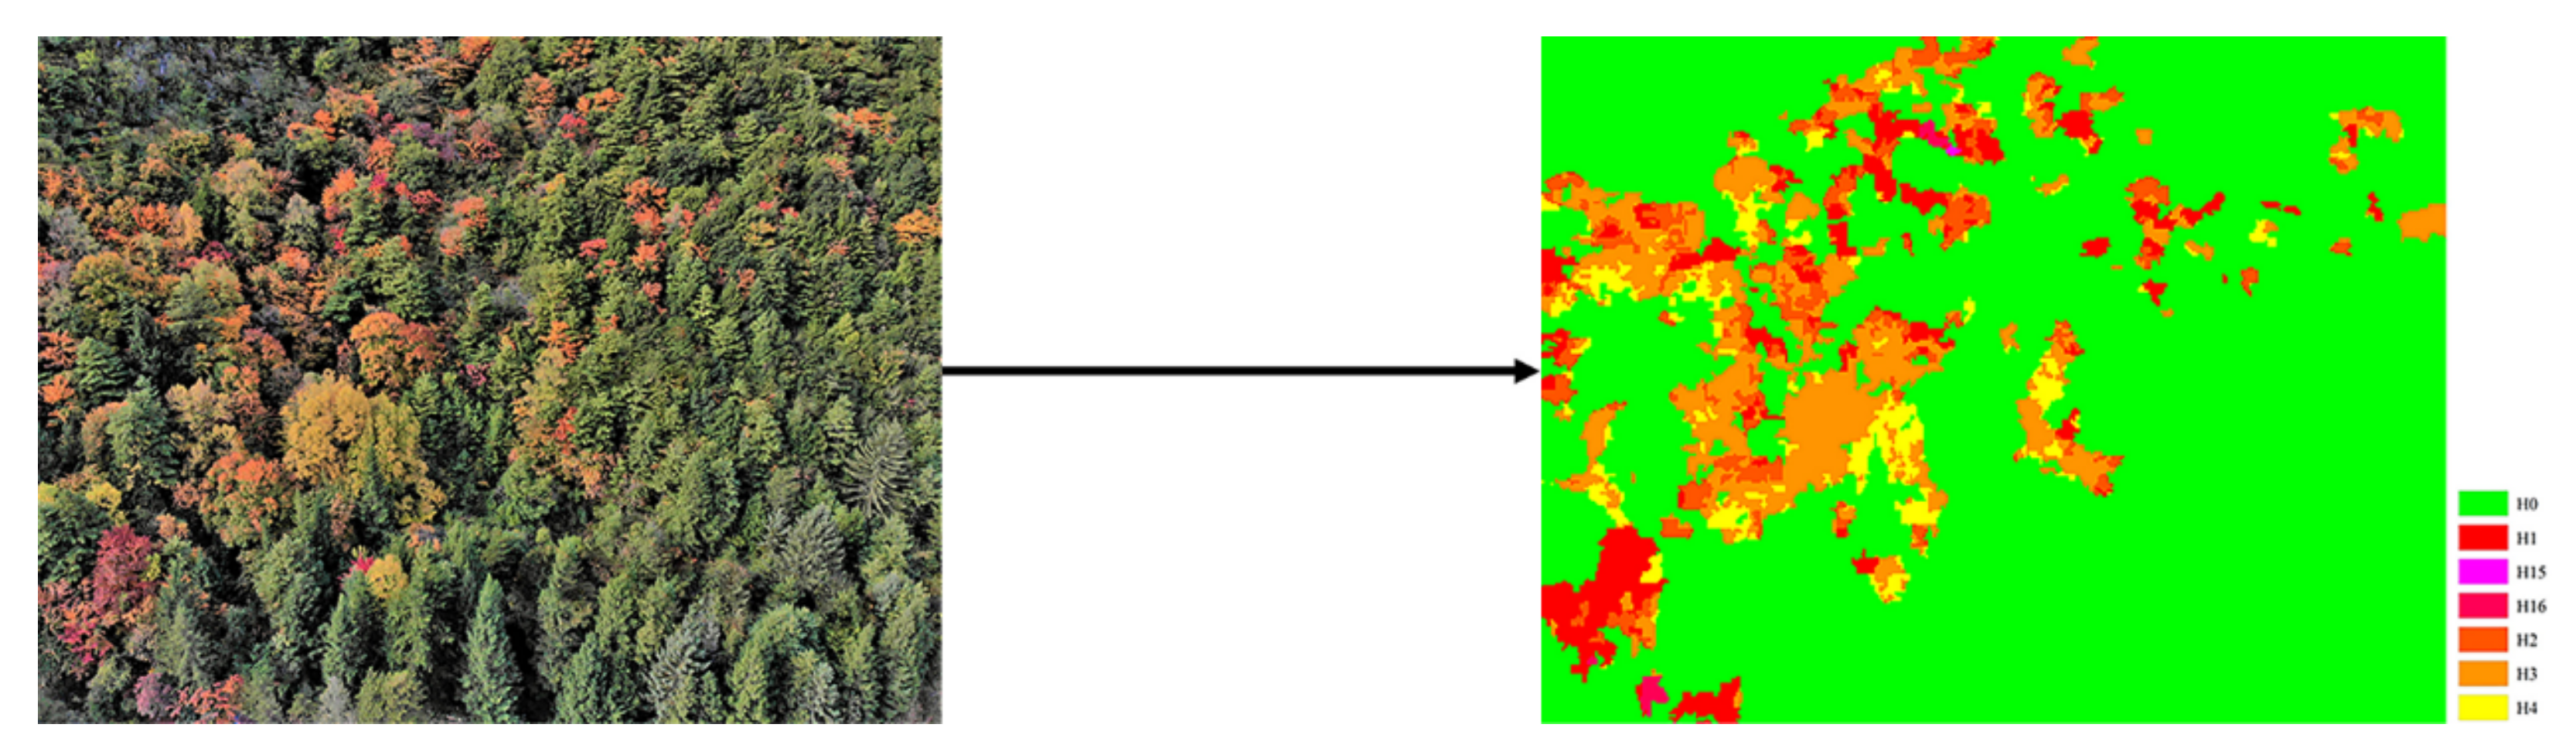
2.4. Color-Leaved Patch Structure Attribute Measurement

The color digital photo method of Zhang et al. [18]—an objective method to quantify forest color—was used to measure color-leaved patch structure attributes. The shooting rules were consistent with canopy gap photography. We digitized each photo and divided it into nineteen colors (black, gray, white, H1, H2, H3, H4, H5, H6, H7, H8, H9, H10, H11, H12, H13, H14, H15, and H16) (Figure S1). Analyzing the patch color of all plots, we further found that red, orange, yellow, and green were the main colors of the subalpine autumn color-leaved forests, so we simplified the colors into eight types: H1 (red), H2 (red-orange), H3 (orange), H4 (yellow), H14 (fuchsia), H15 (rose), H16 (magenta), and H0 (green and all other colors) (Figure 3). The processes of photo digitization and color extraction were performed using MATLAB 2018a (Math Works, Natick, MA, USA) with self-programming (details provided in Zhang et al. [18]). We converted the map of the color-leaved patch distribution to a grid using ArcGIS, and the indices of color-leaved patches were calculated using FRAGSTATS. Four indices were selected to characterize color-leaved patch structure attributes. Number of color-leaved patch types represented color-leaved patch diversity. Color-leaved patch area represented color-leaved patch size. Shape index of color-leaved patch represented color-leaved patch complexity, and the Euclidean nearest-neighbor distance of color-leaved patches estimated spatial configuration of color-leaved patches.

2.5. Landscape Aesthetic Service Measurement

Scenic beauty estimation was used to measure the landscape aesthetic service of subalpine autumn color-leaved forests [29]. We first selected a photo taken during the autumn leaf-coloration peak periods in October 2019 to represent the landscape of a plot; subsequently, 21 photos were selected (one from each plot) to create the electronic questionnaire by Wenjuanxing (a web questionnaire platform). The questionnaire consisted of two parts. The first part of the questionnaire asked the participants for their demographic information, including gender, age, occupation, education, and residence status. The second part asked the participants to evaluate the landscape aesthetic service of subalpine autumn color-leaved forest by rating each image on a scale ranging from −3 (dislike it very much) to 3 (like it very much). More details about the samples and the questionnaire are given in Paragraph S1. The questionnaire was randomly issued with the help of Wenjuanxing through an online survey from October to November 2019 in China. We collected 219 questionnaires and deleted 40 invalid questionnaires with the same answers for the different landscapes; 179 were ultimately determined to be valid for analysis. Basic demographic information of the participants is provided in Table S2.

2.6. Data Analysis

According to the size of the gap area and combined with the previous studies in subalpine forests [30,31], canopy gaps in each plot were categorized into five gap groups: small gap (≤50 m2), medium gap (51–100 m2), large gap (101–500 m2), very large gap (501–1000 m2), and extremely large gap (>1000 m2). Here, we describe gap characteristics, color-leaved species diversity, and color-leaved patch structure attributes at three scales. The first level was that of gaps and included indices such as gap area, gap shape index, and autumn color-leaved tree species diversity, number of color-leaved patch types, color-leaved patch shape index, and color-leaved patch area of each gap. The second level was that of gap groups and included indices such as total gap area, number of gaps, mean shape index of gaps, mean Euclidean nearest-neighbor distance of gaps, and autumn color-leaved tree species diversity, number of color-leaved patch types, mean shape index of color-leaved patches, total color-leaved patch area, and the mean Euclidean nearest-neighbor distance of color-leaved patches of all gaps in each gap group. The third level was that of plots, and consisted of indices including total gap area, number of gaps, mean shape index of gaps, mean Euclidean nearest-neighbor distance of gaps, and autumn color-leaved tree species diversity, number of color-leaved patch types, mean shape index of color-leaved patches, total color-leaved patch area, and the mean Euclidean nearest-neighbor distance of color-leaved patches of all gaps in each plot.
The landscape aesthetic service (LAS) measured existing differences in the answers of different participants, affecting the evaluation results according to either strict or loose standards. We used the method reported by Daniel et al. [16], which was effective in eliminating differences in evaluation results, to calculate the LAS for each plot. The detailed process follows:
cp = cf/N
z = NOR (cp)
z ¯ = n = 1 n 1 Z n n
LAS   =   ( z ¯ i z ¯ a )   ×   100
where cf is the cumulative frequency value of each grade ranked from high to low; cp is the cumulative probability value of each grade ranked from high to low; N is the number of questionnaires; NOR is z is the standard normal deviation (NOR) associated with each of the cumulative probability values; z ¯ is the arithmetic mean of z; n is grade, n = 1, …, 7 corresponding to the score from −3 to 3; z ¯ i is the arithmetic average of z with the ith landscape; and z ¯ a is the arithmetic average of z with a landscape by random selection.
Normality of all variables was checked using the Kolmogorov–Smirnov test. We tested for variations in gap characteristics, autumn color-leaved tree species diversity, and color-leaved patch structure attributes among five gap size classes and among five gap groups using Kruskal–Wallis one-way analysis of variance because of heterogeneous variances and unequal sample numbers between five gap size classes and five gap groups. Meanwhile, correlation analyses were used to determine the relationships between canopy gaps with autumn color-leaved tree species diversity and color-leaved patch structure attributes at the gap level and at the gap group level. Gap area, color-leaved patch diversity, and color-leaved patch area were natural log-transformed for all analyses.
To test the effects of canopy gaps on landscape aesthetic service, color-leaved species diversity and color-leaved patch structure attributes, and their interactions, were examined. First, we used correlation analysis to determine the relationships between landscape aesthetic service and gap characteristics, color-leaved species diversity, and color-leaved patch structure attributes. Then, path analysis was used to test how canopy gaps affected landscape aesthetic service by affecting autumn color-leaf tree species diversity and color-leaved patch structure attributes. Models were assessed by Chi-square goodness-of-fit (p > 0.05 indicate good fit), standardized root mean square residual (SRMR; values < 0.08 indicate good fit), and comparative fit index (CFI; values > 0.95 indicate good fit) [32]. We aimed to determine how canopy gaps affected landscape aesthetic service and which size of canopy gaps played a more important role in landscape aesthetic service in subalpine autumn color-leaved forests. Thus, the effects of canopy gaps on landscape aesthetic service were examined at gap group levels and at plot levels.
Statistical analyses were performed using SPSS 24.0 (IBM, Armonk, NY, USA), and path analyses were performed using AMOS 23.0 software (IBM, Armonk, NY, USA).

3. Results

3.1. Gap Characteristics

The percentage of total forest area covered by gaps was 21.69%. A total of 403 gaps were detected, with a total gap area of 35,108 m2. The average gap area was 87.18 ± 13.63 m2 (mean ± SE), ranging from 1 to 3468 m2 (Table S3). The gap size distribution decreased exponentially, in terms of number of gaps, with increasing size (Table S3). Of the total number of gaps, more than 70% were ≤50 m2 in size. The gap number distribution of five different size classes showed that more than half of the plots were dominated by gaps ≤50 m2 in size (Table S3). The proportions of gap area in the five size classes showed that more than half of the gap area was contributed by gaps >50 m2 in size, except for several plots that were absolutely dominated by gaps ≤50 m2 in size (Figure S2). The average of the mean shape index of gaps (GMSI) was 1.74 ± 0.04, with maximum and minimum values of 1.39 and 2.02, respectively (Table S3). The average of the mean Euclidean nearest-neighbor distance of gaps (GMENN) was 4.59 ± 0.73 m, ranging from 0.00 to13.98 m (Table S3).

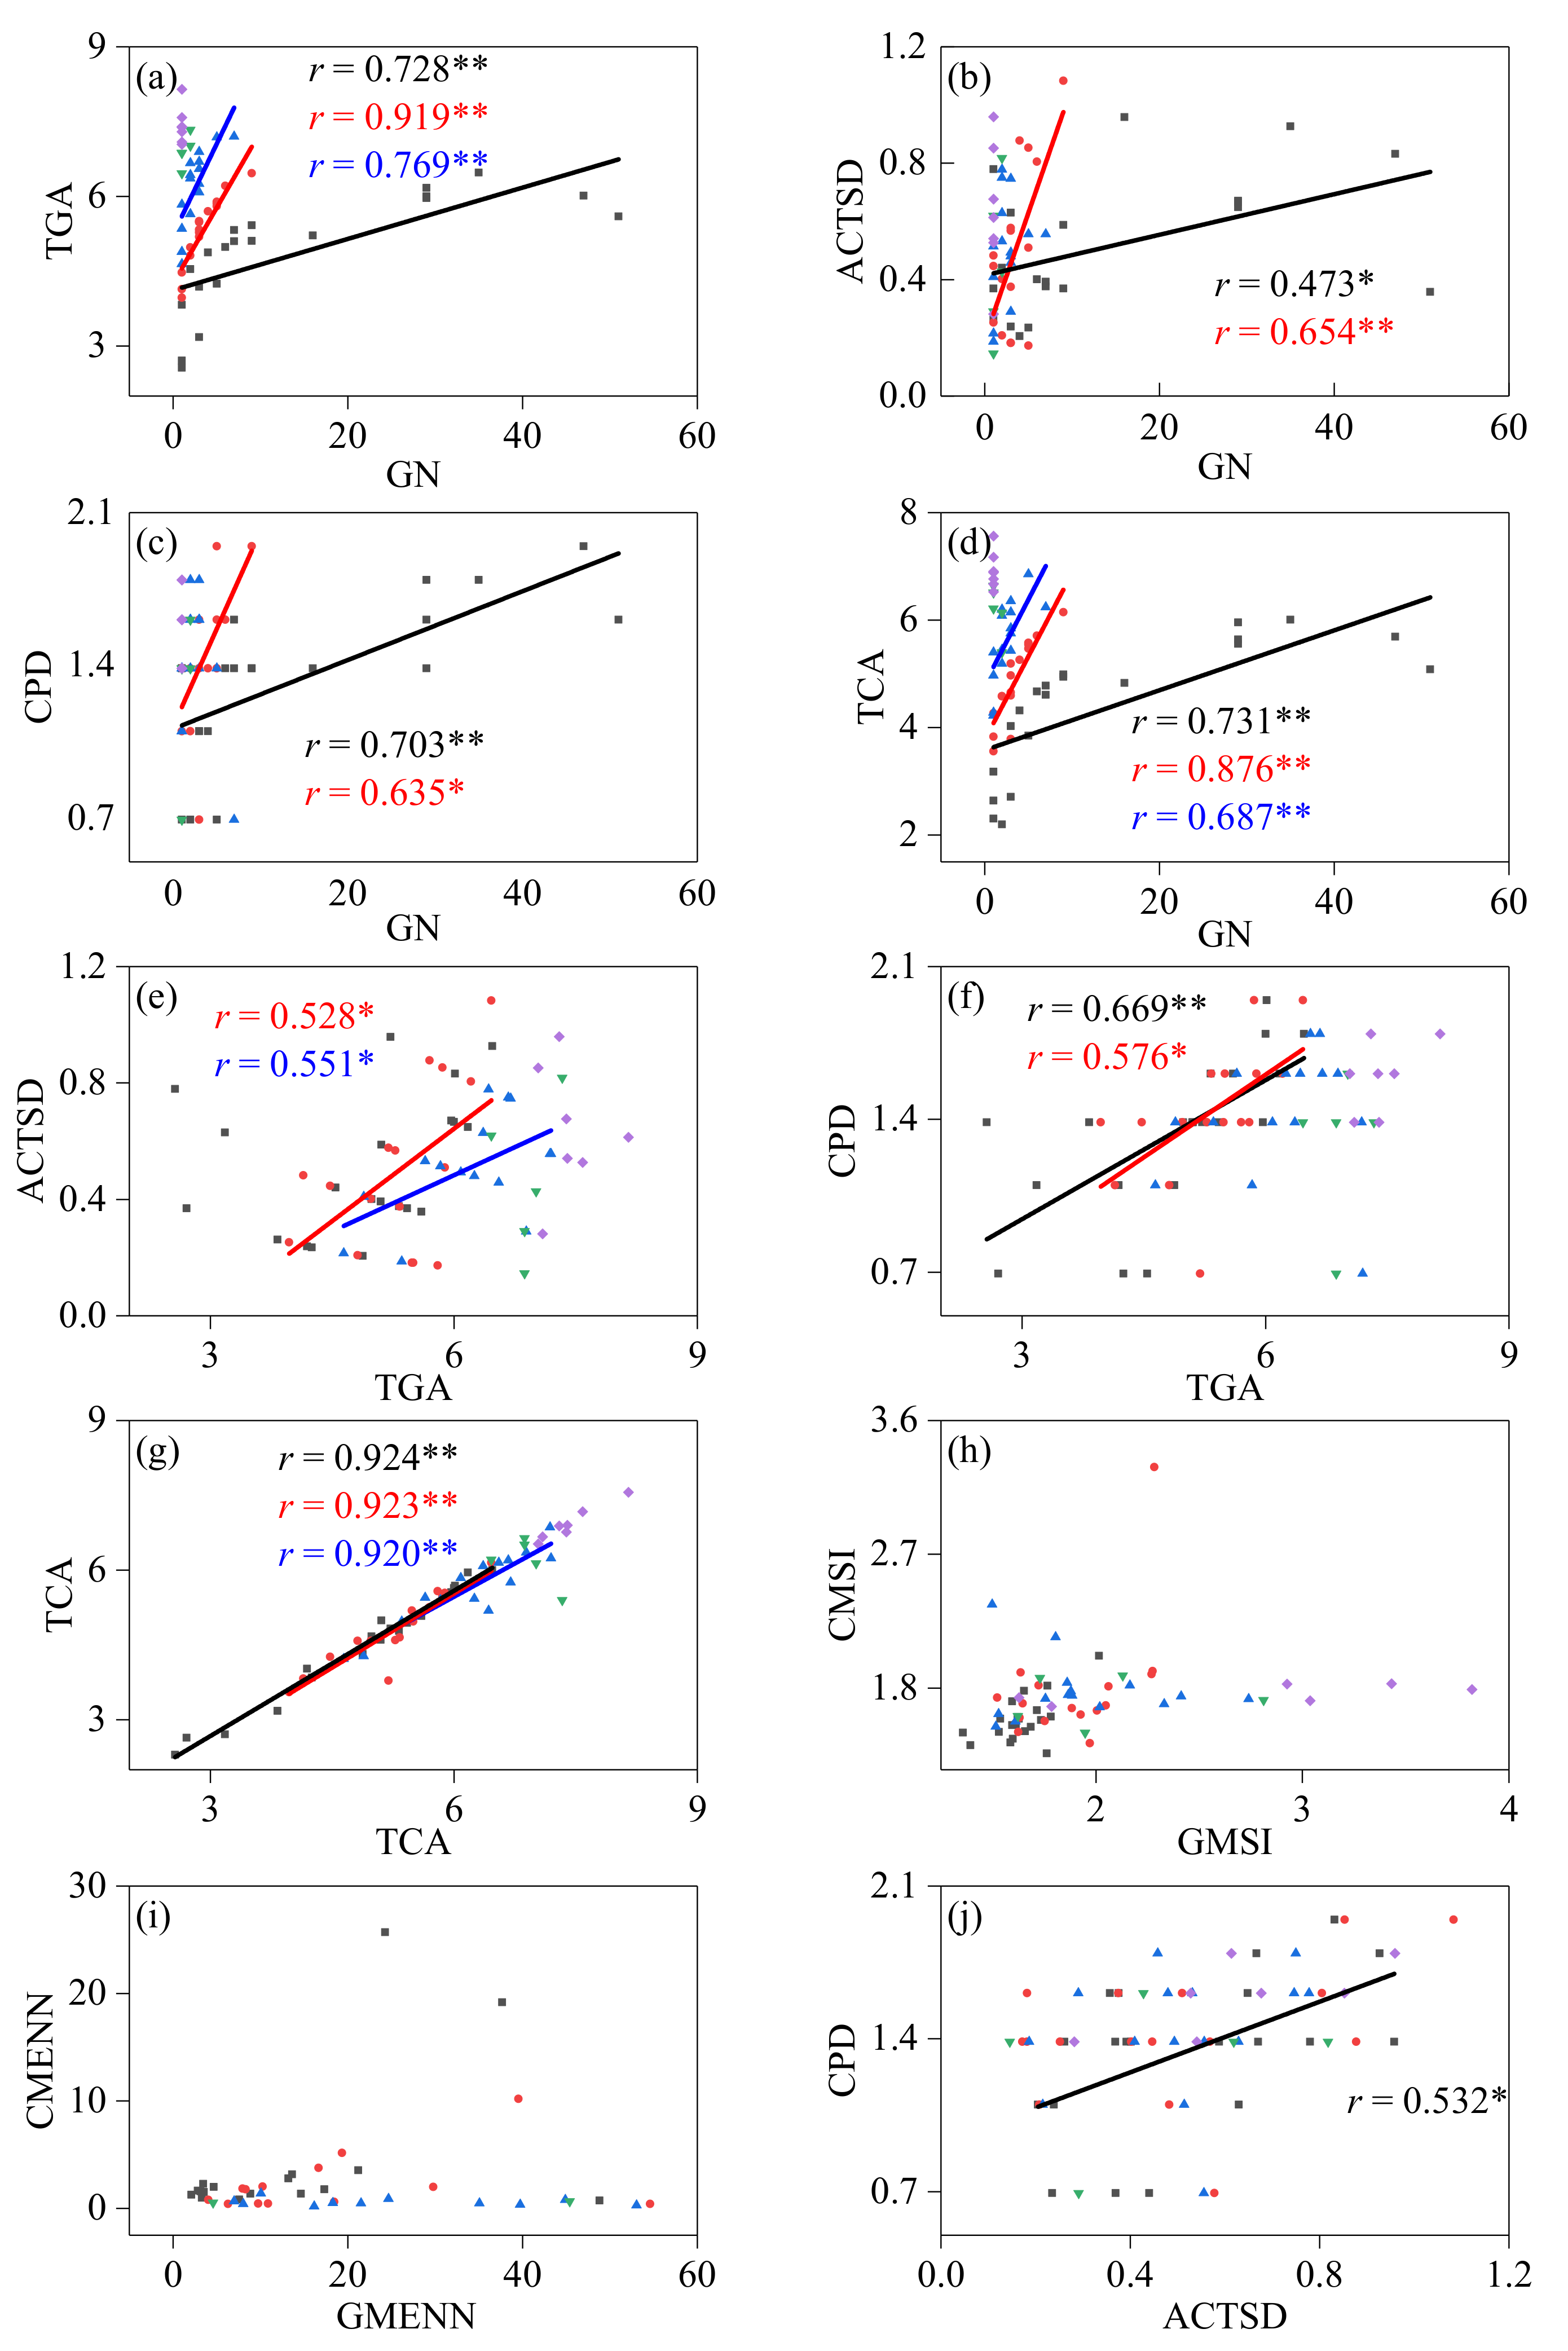
3.2. Effects of Canopy Gaps on Autumn Color-Leaved Tree Species Diversity and Color-Leaved Patch Structure Attributes

At the gap level, gap shape index, autumn color-leaved tree species diversity (ACTSD), and color-leaved patch structure attributes of the five canopy gap-size classes exhibited a large variation (all p < 0.001), and these indicators were significantly higher in gaps >50 m2 in size than in gaps ≤50 m2 in size (Table 1). Correlation analysis results showed that the ACTSD (Figure 4a; r = 0.568, p < 0.01), color-leaved patch diversity (CPD) (Figure 4b; r = 0.608, p < 0.01), color-leaved patch area (CA) (Figure 4d; r = 0.962, p < 0.01), gap shape index (GSI) (Figure 4e; r = 643, p < 0.01), and color-leaved patch shape index (CSI) (Figure 4f; r = 542, p < 0.01) significantly increased with increasing gap area (GA). CPD was positively related to ACTSD (Figure 4c; r = 0.380, p < 0.05), and CSI significantly increased with increasing GSI (Figure 4g; r = 0.552, p < 0.01).
In the five gap groups with different sizes, the number of gaps (GN), total gap area (TGA), GMSI, total color-leaved patch area (TCA), the mean shape index of color-leaved patches (CMSI), and the mean Euclidean nearest-neighbor distance of color-leaved patches (CENN) (all p < 0.01) were significantly different (Table 2). There was no significant difference in GENN, ACTSD, and CPD among the five gap groups (Table 2). Correlation analysis results showed that TGA and TCA increased significantly with GN in small (Figure 5a; r = 0.728, p < 0.01; Figure 5d; r = 0.731, p < 0.01), medium (Figure 5a; r = 0.919, p < 0.01; Figure 5d; r = 0.876, p < 0.01), and large (Figure 5a; r = 0.769, p < 0.01; Figure 5d; r = 0.687, p < 0.01) gap groups. ACTSD and CPD increased significantly with increasing GN in small (Figure 5b; r = 0.473, p < 0.05; Figure 5c; r = 0.703, p < 0.01) and medium (Figure 5b; r = 0.654, p < 0.01; Figure 5c; r = 0.635, p < 0.05) gap groups. ACTSD of the medium and large groups was positively correlated with TGA (Figure 5e; r = 0.528, p < 0.05; r = 0.551, p < 0.05, respectively). CPD was significantly increased with TGA in small (Figure 5f; r = 0.669, p < 0.01) and medium (Figure 5f; r = 0.576, p < 0.05) gap groups. There was a significant positive correlation between TGA and TCA of small, medium, and large gap groups (Figure 5g; r = 0.924; r = 923; r = 0.920; all p < 0.01). We found a significant relationship between ACTSD and CPD in the small gap group only (Figure 5j; r = 0.532, p < 0.05). There was no significant relationship between GMSI and CMSI, GMENN and CMENN in the five gap groups.

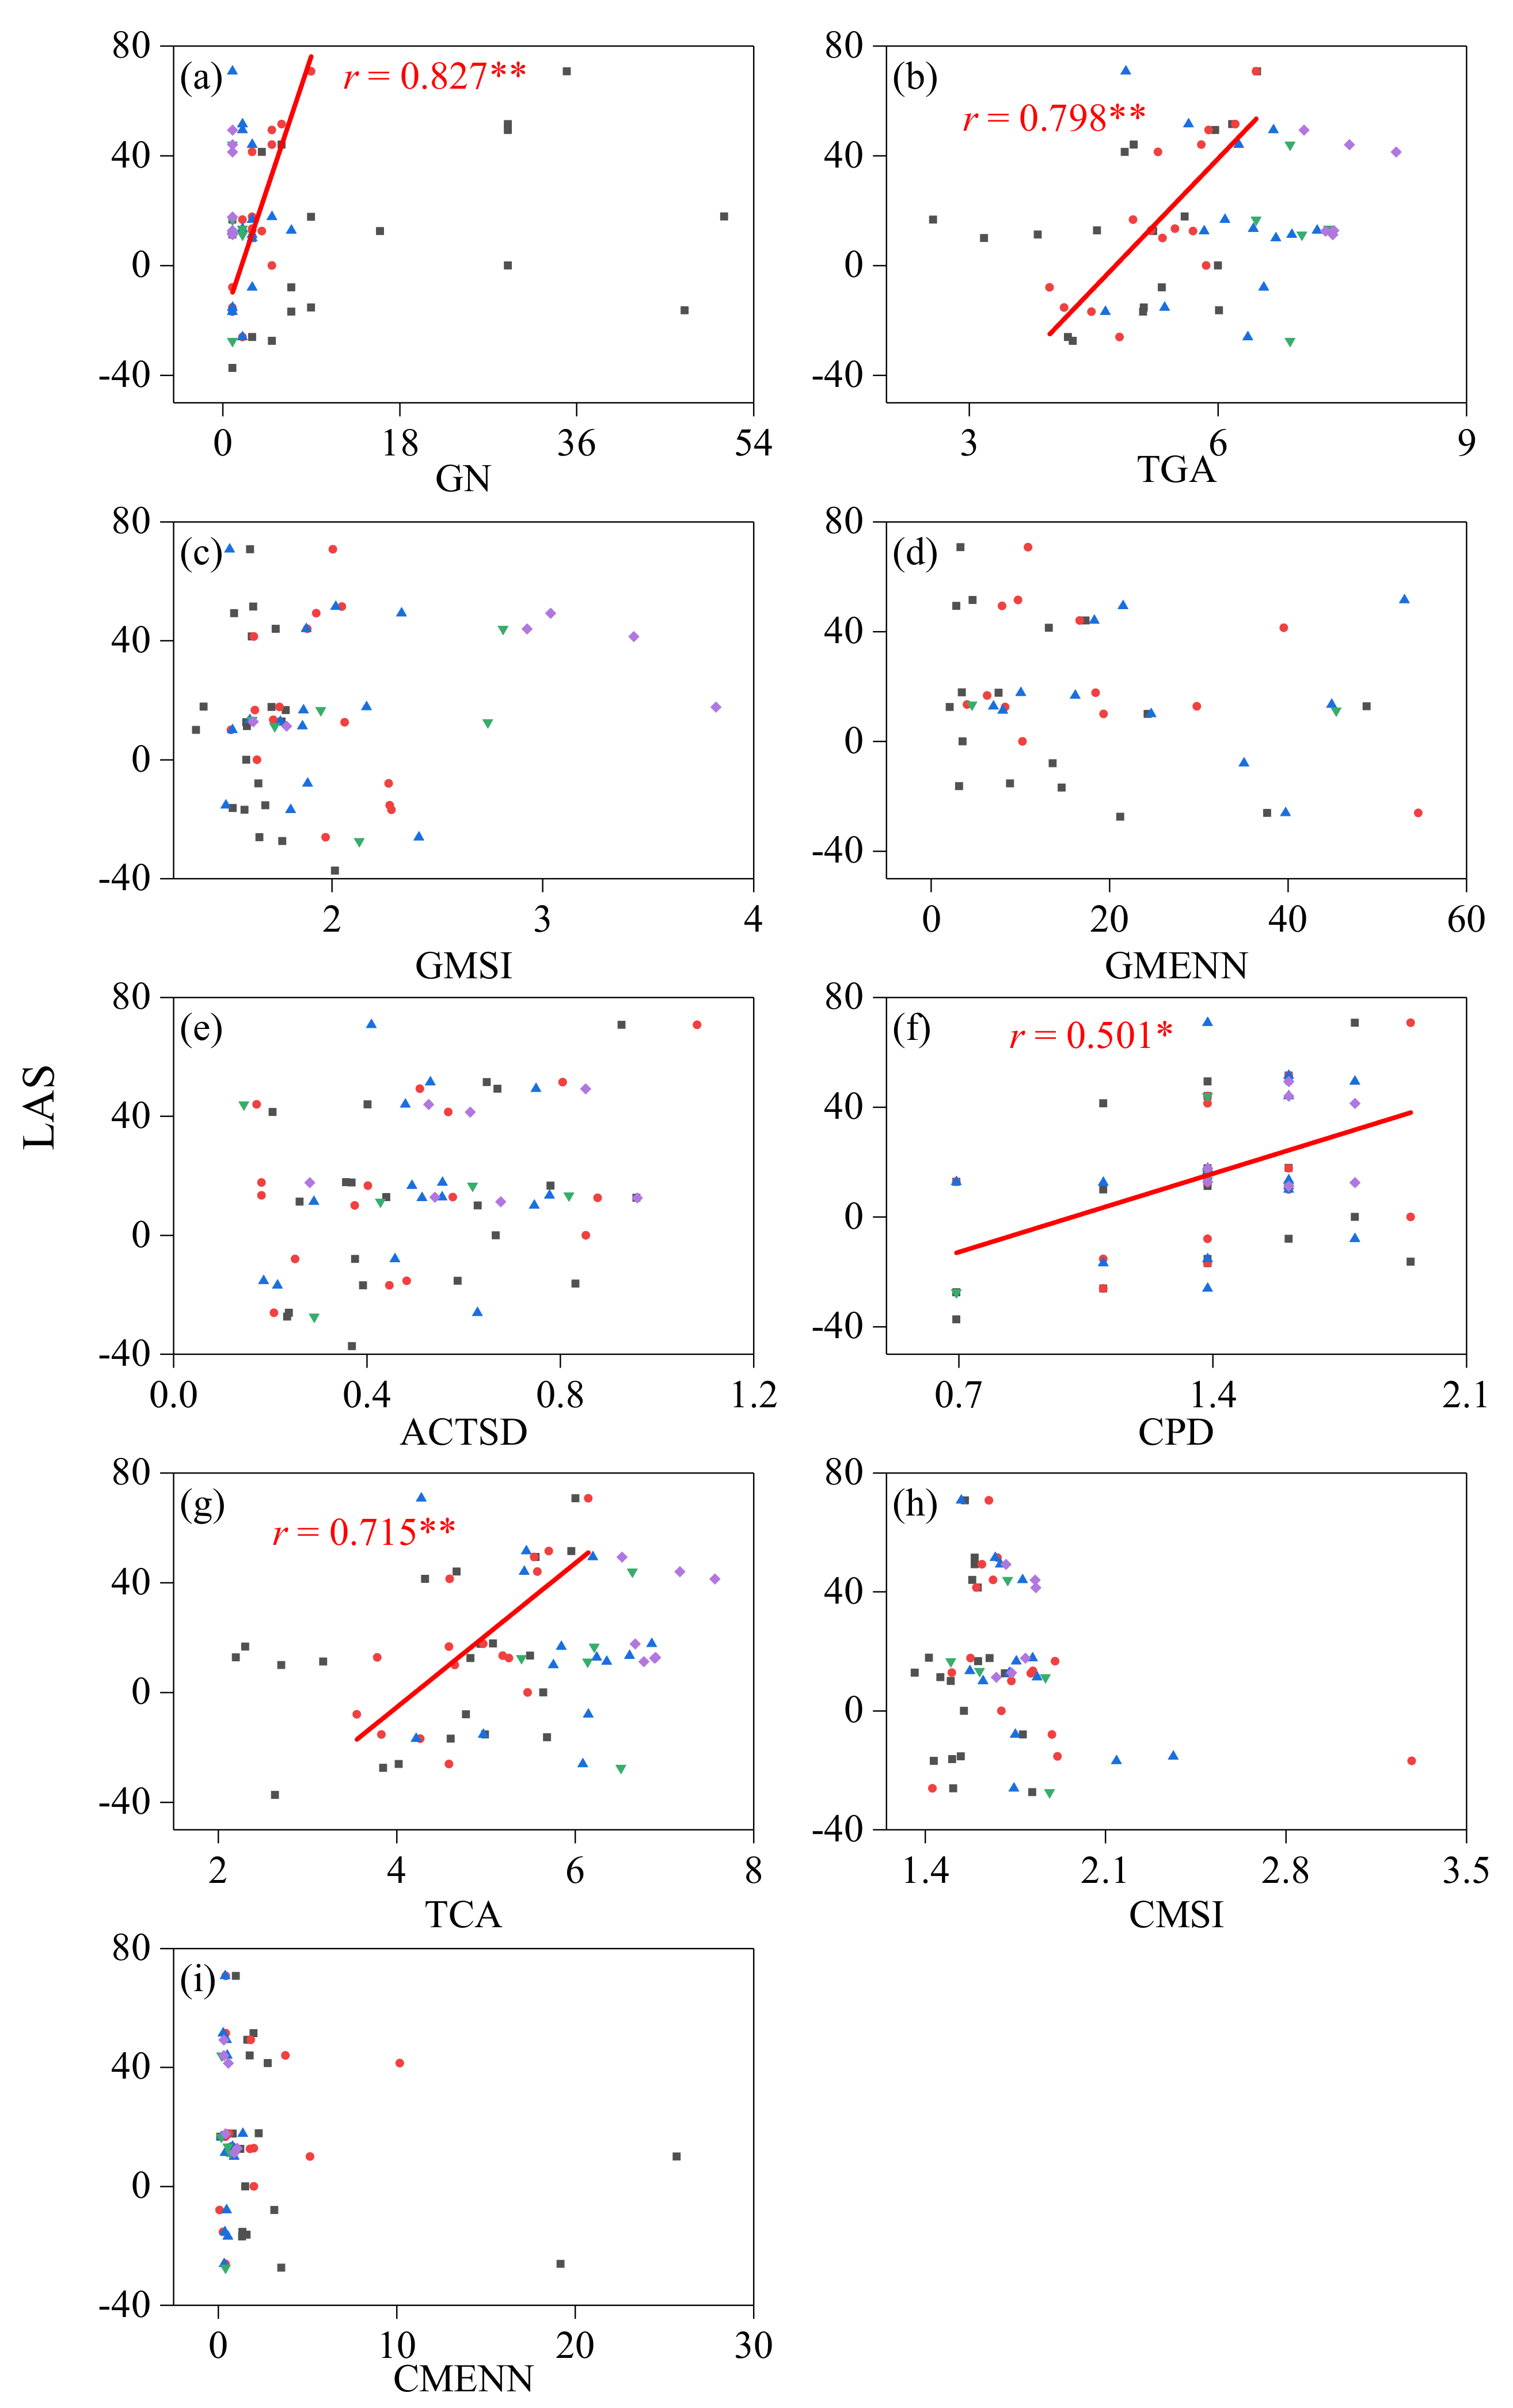
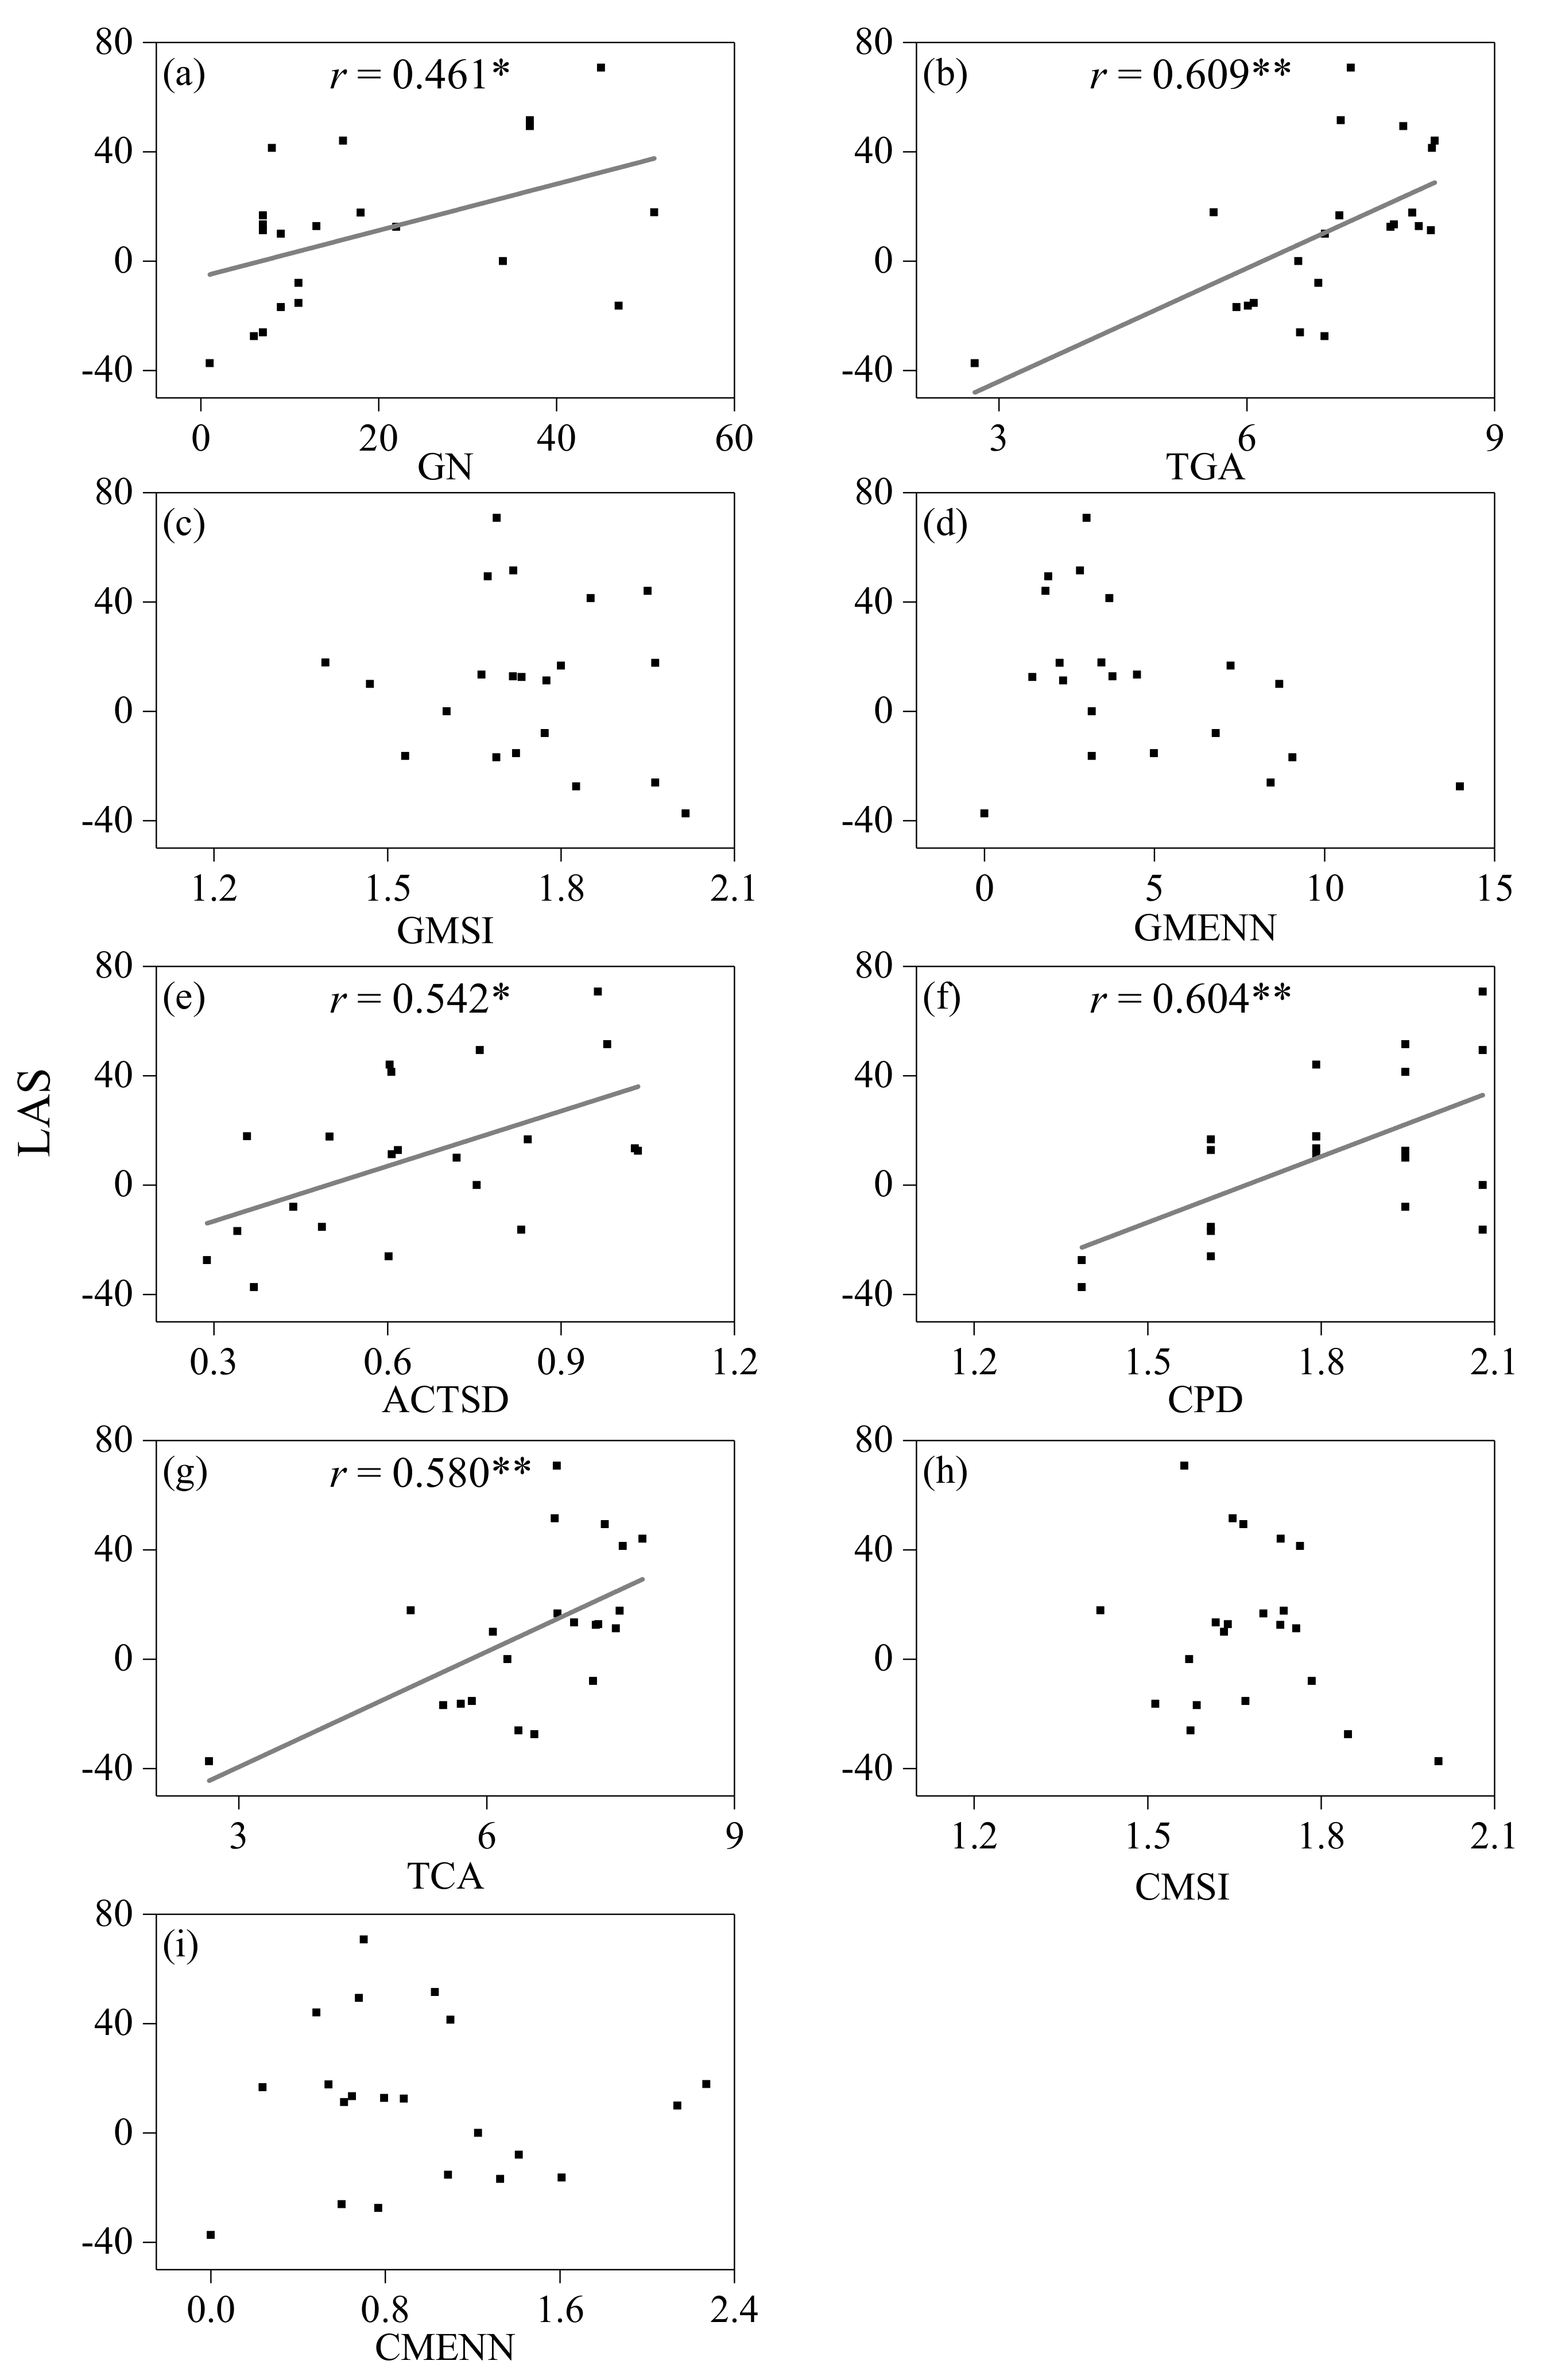
3.3. Effects of Canopy Gaps on Landscape Aesthetic Service

Landscape aesthetic service (LAS) was related to all gap groups, but was significantly positively related to GN (Figure 6a; r = 0.827, p < 0.01), TGA (Figure 6b; r = 0.798; p < 0.01), CPD (Figure 6f; r = 0.501, p < 0.05), and TCA (Figure 6g; r = 0.715, p < 0.01) in only the medium gap group. There was no significant correlation between LAS and ACTSD, GMSI, GMENN, CMSI, and CMENN in all gap groups.
The path model that included the GN, TGA, ACSTD, CPD, and TCA using medium gap group data was a good fit (χ2 = 13.59; p = 0.09; SRMR = 0.00; CFI = 1.00) and explained 75% of the variance in LAS (Figure 7a). The model showed that GN had a strong positive correlation with TGA (λ = 0.98; p < 0.001), and the increase in TGA indirectly affected LAS by significantly increasing TCA (λ = 0.99; p < 0.001), followed by ACTSD (λ = 0.66; p < 0.05) and CPD (λ = 0.61; p > 0.05). The TCA had a significantly positive direct effect on LAS (λ = 0.79; p < 0.01), while the CPD was positively (but not significantly) related to LAS. ACTSD had an indirect effect on LAS by having a direct effect on CPD.
At the plot level, the LAS had a significant positive linkage with GN (Figure 8a; r = 0.461, p < 0.05), TCA (Figure 8b; r = 0.609, p < 0.01), ACTSD (Figure 8e; r = 0.542, p < 0.05), CPD (Figure 8f; r = 0.604, p < 0.01), and TCA (Figure 8g; r = 0.580, p < 0.01), but there was no significant correlation between LAS and MSI of gaps, GMENN, CMSI, and CMENN.
The path model based on GN, TGA, ACTSD, CPD, and TCA at the plot level was a good fit (χ2 = 3.74; p = 0.44; SRMR = 0.00; CFI = 1.00) and explained 61% of the variance in LAS (Figure 8b). The model showed that TCA (λ = 0.43; p < 0.05) directly and positively affected LAS. The effects of ACTSD (λ = 0.10; p > 0.05) and CPD (λ = 0.42; p > 0.05) were positive but weak. The TGA had a direct, significant, and positive effect on TCA (λ = 0.98; p < 0.001), followed by ACTSD (λ = 0.42; p < 0.05). GN had a direct, strong, positive effect on CPD (λ = 0.61; p < 0.001).

4. Discussion

4.1. Impact of Canopy Gaps on Autumn Color-Leaved Tree Species Diversity and Color-Leaved Patch Structure Attributes

Gap size distribution in subalpine autumn color-leaved forests followed a negative exponential model, with many small canopy gaps and few larger ones (Table S3). This result, obtained by using the high-resolution aerial photography method, is similar to the results of a ground survey, where small canopy gaps were shown to be dominant in subalpine forests [31,32]. Based on the gap-size distribution found in our study, we conclude that the subalpine autumn color-leaved forests in western Sichuan are shaped by a small-scale disturbance regime, and canopy gaps formed by single or few canopy tree deaths are dominant.
Gap size had a significant impact on species diversity [33]. In the subalpine autumn color-leaved forests examined in this study, autumn color-leaved tree species diversity increased with increasing gap area at the gap level (Figure 4). Similar results have been reported in other forests, where species diversity has been shown to be positively correlated with gap area [34,35]. In forests, environmental heterogeneity and resource availability often have a strong and positive impact on species composition and diversity [36,37,38]. Gap size is a suitable index to characterize microenvironmental heterogeneity and resource sequestration within canopy gaps [39]. Large canopy gaps provide more heterogeneous microenvironments and resource availability and support more varied species assemblages [40,41]. In addition, tree species with different levels of shade tolerance respond differently to gap size [40,42]. Previous studies have suggested that large canopy gaps have higher light availability and contain a higher number of shade-intolerant (early successional) species compared to small canopy gaps [43,44]. Thus, it is not surprising that a large canopy gap has a higher number of autumn color-leaved tree species.
Although species diversity had a significant response to variation in gap area at the gap level, there was no significant difference in autumn color-leaved tree species diversity among the five gap groups, despite the large variation in total gap area (Table 2). In this study, a majority of plots were characterized by a large number of small canopy gaps and a small number of large canopy gaps, and a large area proportion of large gaps and a small area proportion of small ones. There are no doubts that large-gap groups have a high number of species due to the species–area relationship [45]; for small gap groups, gap area limits the number of species. The number of gaps plays a key role in determining the opportunities for colonization of trees. We speculate that a large number of small canopy gaps may increase the chances of colonization of different species and thus offset the area limitation of species diversity. Our findings support the hypothesis that autumn color-leaved tree species diversity was significantly increased with increasing number of gaps in the small (≤50 m2 in size) and medium (51–100 m2 in size) gap groups (Figure 5). This may explain the lack of significant differences in autumn color-leaved tree species diversity among the five gap groups. Thus, when exploring the effects of canopy gaps on species diversity at large scales, the number of gaps should also be considered in addition to gap size.
Species composition and structure within canopy gaps play a key role in determining patch structure attributes [46,47]. Plant color diversity often reflects the species diversity experienced visually by humans [48]. In this study, there was a positive relationship between color-leaved patch diversity and autumn color-leaved tree species diversity, and both increased with gap area. This means that canopy gaps not only maintain species diversity but also color diversity, especially in large canopy gaps. The patch area largely reflects the abundance and total basal area of trees within canopy gaps. Previous studies demonstrated that increasing gap area increased both the number of stems and total basal area [49,50]. Our results showed that color-leaved patch area exerted a strong positive relationship with gap area. This indicates that large canopy gaps support greater autumn color-leaved tree survival and help maintain the patches formed in them.

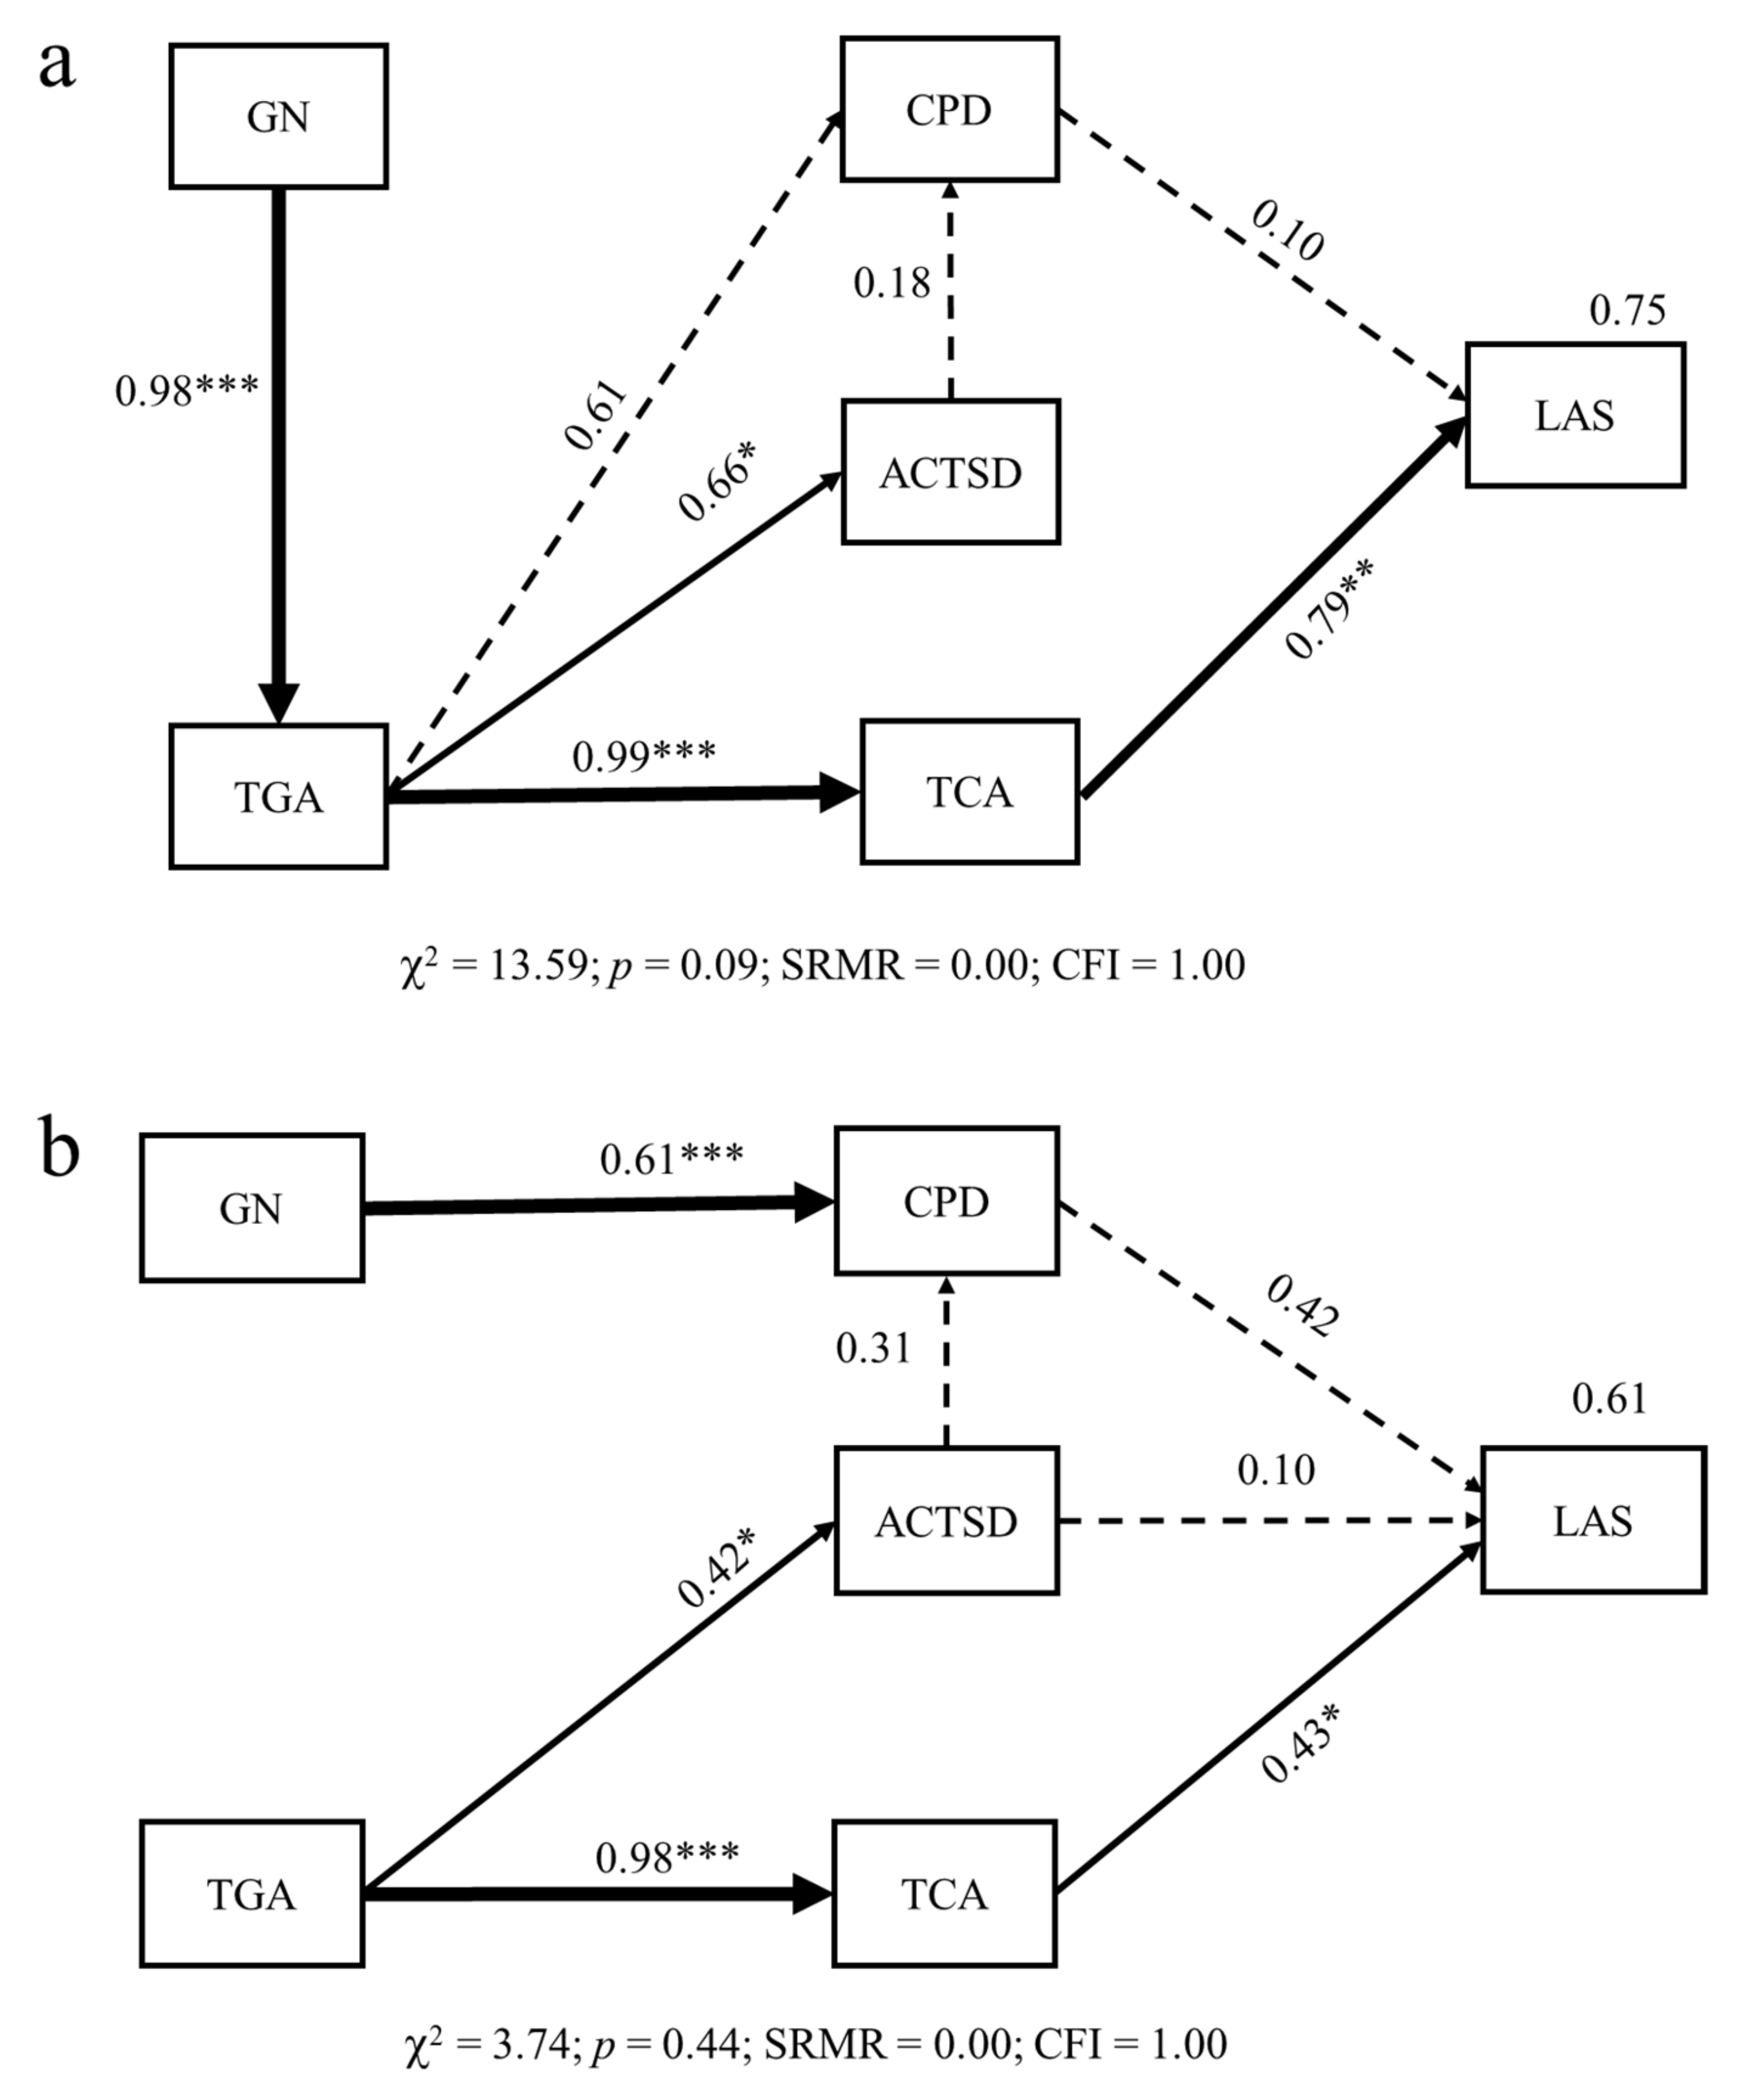
4.2. Influences of Canopy Gaps on Landscape Aesthetic Service Are Mediated through Color-Leaved Species Diversity, Color-Leaved Patch Diversity, and Color-Leaved Patch Area

Path models demonstrated that the total color-leaved patch area induced by canopy gaps had a significant influence on landscape aesthetic service. The proportion of color is known to have a significant impact on landscape aesthetic service [20]. A large total color-leaved patch area can form a high visual impact and strong visual traction in forests with green matrices, thereby significantly improving landscape aesthetic service [51]. A high area proportion of canopy gaps in subalpine autumn color-leaved forests can provide more space for colonization and regeneration of autumn color-leaved trees. More autumn color-leaved trees reach the canopy and form a large area of color-leaved landscapes, thus promoting the landscape aesthetic service. Compared to medium and large canopy gaps, the color-leaved patches produced in small canopy gaps do not create impressive visual impacts, and with low visual attractiveness, they cannot cause strong and positive emotional reactions from appreciators. In addition, canopy gaps caused by small-scale disturbances are dominant, and large or very large canopy gaps are few, which may be the reason why we did not find significant effects of large or very-large gap groups. Thus, based on our results, we suggest that medium canopy gaps play a more significant role in landscape aesthetic service in subalpine autumn color-leaved forests.
Canopy gaps can also improve the landscape aesthetic service indirectly by increasing the autumn color-leaved tree species diversity and color-leaved patch diversity. Previous studies have suggested that species diversity has a positive relationship with landscape aesthetic service [11,52]. Our results are consistent with the findings in grasslands [53] and marine ecosystems [15], where landscape aesthetic service was observed to increase with increasing species diversity. These findings provide evidence that landscape aesthetic service has a consistent positive response to species diversity in different ecosystems. Our findings are consistent with the findings in meadows [54], where the role of color diversity in landscape aesthetic service was stronger than that of species diversity. This is mainly because species diversity per se is not a driver of human response [55], but it directly affects color diversity and thus establishes a positive linkage with landscape aesthetic service [53]. Path models showed that autumn color-leaved tree species diversity significantly increased with increasing gap area and positively affected color-leaved patch diversity. Overall, these results highlight the importance of canopy gaps in maintaining species diversity, which allows for color diversity to improve landscape aesthetic service in subalpine autumn color-leaved forests.

5. Conclusions

Our study is one of the first to demonstrate the impact of canopy gaps on autumn color-leaved tree species diversity, color-leaved patch structure attributes, landscape aesthetic service, and their interactions, in subalpine autumn color-leaved forests. Our results support that the high-resolution aerial photography is an effective method to quantify the gap characteristics in subalpine forests. This study offers new insight into the role of canopy gaps in maintaining biodiversity and ecosystem services.
In subalpine autumn color-leaved forests, most autumn color-leaved trees are considered pioneer tree species. Along with advancing succession, these trees will be replaced by evergreen trees, leading to the disappearance of the color-leaved landscape and the loss of the landscape aesthetic ecosystem service. Based on our results, we suggest that canopy gaps formed by small-scale disturbances should be reserved or created that have high canopy closures and/or are dominated by evergreen trees; this allows autumn color-leaved tree species to regenerate (or be planted), which is beneficial for preserving the trees and the colorful patches they form. Although a large canopy gap is more conducive to the survival of autumn color-leaved tree species and the production of spectacular color-leaved landscapes, large-scale disturbances are rare in forests. In addition, a large number of small and medium canopy gaps also have high species diversity, and many medium canopy gaps result in a large total gap area and form a striking color-leaved landscape, thus significantly improving landscape aesthetic service. It is worth noting that small canopy gaps are generally unfriendly to shade-intolerant species as light requirements are not sufficiently met [56,57]. Therefore, intermediate canopy gaps (51–100 m2) are more suitable for the management application of subalpine autumn color-leaved forests. Increasing the amount of medium canopy gaps is conducive to increasing color-leaved species diversity and maintaining color-leaved landscape structure, helping to maintain subalpine autumn color-leaved forests at the optimal stage of higher species diversity and higher landscape aesthetic service, which is of great significance for maintaining ecological security and economic development of the region. The results of this study can help forest managers to conserve tree species diversity, maintain landscape structure, and improve landscape aesthetic service via mediating of canopy gaps. Reserving canopy gaps is very essential to protect tree species diversity and forest structure, thus maintaining the forest ecosystem service and function in subalpine autumn color-leaved forests of southwestern China.

Supplementary Materials

The following are available online at https://www.mdpi.com/1999-4907/12/2/199/s1. Table S1: Number of quadrats in canopy gaps in 21 subalpine autumn color-leaved forest plots. Table S2: Basic demographics of questionnaire subjects. Table S3: Gap characteristics in 21 subalpine autumn color-leaved forest plots. Figure S1: Classification of nineteen colors. Figure S2: Proportions of gap area in five size classes in 21 subalpine autumn color-leaved forest plots. Contribution of total gap area of five different size classes to forest area in absolute percentage at each plot. Paragraph S1: The sample of the questionnaire.

Author Contributions

Conceptualization, Q.L. and J.T.; data curation, J.T.; funding acquisition, J.T.; investigation, Q.L., J.C., and X.Z.; methodology, Q.L., Y.D., Y.L., J.L., and J.T.; supervision, J.T.; writing—original draft, Q.L.; writing—review and editing, Q.L., Y.L., and J.T. All authors have read and agreed to the published version of the manuscript.

Funding

This research was funded by the National Key Research and Development Program of China (2017YFC0505003).

Institutional Review Board Statement

Not applicable.

Informed Consent Statement

Not applicable.

Data Availability Statement

The data presented in this study are available on request from the corresponding author.

Acknowledgments

The authors would like to thank Sadichhya for her assistance with English language and grammatical editing. The authors wish to express their profound gratitude to the National Key Research and Development Program of China (2017YFC0505003) for support rendered in the course of this research.

Conflicts of Interest

The authors declare no conflict of interest.

References

  1. Watt, A.S. Pattern and process in the plant community. J. Ecol. 1947, 1, 1–22. [Google Scholar] [CrossRef] [Green Version]
  2. Lertzman, K.P.; Sutherland, G.D.; Inselberg, A.; Saunders, S.C. Canopy gaps and the landscape mosaic in a coastal temperate rain forest. Ecology 1996, 77, 1254–1270. [Google Scholar] [CrossRef]
  3. Chávez, V.; Macdonald, S.E. The influence of canopy patch mosaics on understory plant community composition in boreal mixedwood forest. For. Ecol. Manag. 2010, 259, 1067–1075. [Google Scholar] [CrossRef]
  4. Zang, R.; Wang, B. Study on canopy disturbance regime and mechanism of tree species diversity maintenance in the lower subtropical evergreen broad-leaved forest, South China. Plant Biosyst. 2002, 136, 241–250. [Google Scholar] [CrossRef]
  5. Brokaw, N.; Busing, R.T. Niche versus chance and tree diversity in forest gaps. Trends Ecol. Evol. 2000, 15, 183–188. [Google Scholar] [CrossRef]
  6. Yamamoto, S. Forest gap dynamics and tree regeneration. J. For. Res. 2000, 1, 223–229. [Google Scholar] [CrossRef]
  7. Wang, Y.; Tao, J.; Li, Y.; Yu, X.; Xi, Y. Effects of Fargesia nitida on species diversity and trees Regeneration in different forest cycles of subalpine forest in Wolong Nature Reserve. Sci. Silvae Sin. 2007, 43, 1–7. [Google Scholar] [CrossRef]
  8. Zang, R.; Tao, J.; Li, C. Within community patch dynamics in a tropical montane rain forest of Hainan Island, South China. Acta Oecologica 2005, 28, 39–48. [Google Scholar] [CrossRef]
  9. Wang, W.; Hu, K.; Tao, J.; Li, Z. The regeneration of tree species in subalpine dark coniferous forest in the Wolong Nature Reserve. J. Wuhan Bot. Res. 2006, 24, 130–134. [Google Scholar] [CrossRef]
  10. Kuper, R. Effects of flowering, foliation, and autumn colors on preference and restorative potential for designed digital landscape models. Environ. Behav. 2018, 52, 1–13. [Google Scholar] [CrossRef]
  11. Gobster, P.H.; Nassauer, J.I.; Daniel, T.C.; Fry, G. The shared landscape: What does aesthetics have to do with ecology? Landsc. Ecol. 2007, 22, 959–972. [Google Scholar] [CrossRef]
  12. Daniel, T.C.; Muhar, A.; Arnberger, A.; Aznar, O.; Boyd, J.W.; Chan, K.M.A.; Costanza, R.; Elmqvist, T.; Flint, C.G.; Gobster, P.H.; et al. Contributions of cultural services to the ecosystem services agenda. Proc. Natl. Acad. Sci. USA 2012, 109, 8812–8819. [Google Scholar] [CrossRef] [Green Version]
  13. Tribot, A.; Deter, J.; Mouquet, N. Integrating the aesthetic value of landscapes and biological diversity. Proc. Biol. Sci. 2018, 285, 20180971. [Google Scholar] [CrossRef] [PubMed]
  14. Lindemann-Matthies, P.; Marty, T. Does ecological gardening increase species richness and aesthetic quality of a garden? Biol. Conserv. 2013, 159, 37–44. [Google Scholar] [CrossRef]
  15. Tribot, A.; Mouquet, N.; Villéger, S.; Raymond, M.; Hoff, F.; Boissery, P.; Holon, F.; Deter, J. Taxonomic and functional diversity increase the aesthetic value of coralligenous reefs. Sci. Rep. 2016, 6, 34229. [Google Scholar] [CrossRef] [PubMed] [Green Version]
  16. Daniel, T.C. Whither scenic beauty? Visual landscape quality assessment in the 21st century. Landsc. Urban Plan. 2001, 54, 267–281. [Google Scholar] [CrossRef]
  17. Dudek, T. Influence of selected features of forests on forest landscape aesthetic value- example of Se Poland. J. Env. Eng. Landsc. 2018, 26, 275–284. [Google Scholar] [CrossRef] [Green Version]
  18. Zhang, Z.; Qie, G.; Wang, C.; Jiang, S.; Li, X.; Li, M. Relationship between forest color characteristics and scenic beauty: Case study analyzing pictures of mountainous forests at sloped positions in Jiuzhai Valley, China. Forests 2017, 8, 63. [Google Scholar] [CrossRef]
  19. Liu, J.; Chamberlain, B.C.; Kozak, R.A.; Meitner, M.J.; Nesbitt, L. Relating shape to human aesthetic evaluations of harvest blocks from an aerial perspective. Scand. J. For. Res. 2018, 33, 793–799. [Google Scholar] [CrossRef]
  20. Ma, B.; Hauer, R.J.; Xu, C. Effects of design oroportion and distribution of color in urban and suburban green space planning to visual aesthetics quality. Forests 2020, 11, 278. [Google Scholar] [CrossRef] [Green Version]
  21. Schliemann, S.A.; Bockheim, J.G. Methods for studying treefall gaps: A review. For. Ecol. Manag. 2011, 261, 1143–1151. [Google Scholar] [CrossRef]
  22. Nakashizuka, T.; Katsuki, T.; Tanaka, H. Forest canopy structure analyzed by using aerial photographs. Ecol. Res. 1995, 1, 13–18. [Google Scholar] [CrossRef]
  23. Nyamgeroh, B.B.; Groen, T.A.; Weir, M.J.C.; Dimov, P.; Zlatanov, T. Detection of forest canopy gaps from very high resolution aerial images. Ecol. Indic. 2018, 95, 629–636. [Google Scholar] [CrossRef]
  24. Getzin, S.; Nuske, R.; Wiegand, K. Using unmanned aerial vehicles (UAV) to quantify spatial gap patterns in forests. Remote Sens. 2014, 6, 6988–7004. [Google Scholar] [CrossRef] [Green Version]
  25. Getzin, S.; Wiegand, K.; Schöning, I. Assessing biodiversity in forests using very high-resolution images and unmanned aerial vehicles. Methods Ecol. Evol. 2012, 3, 397–404. [Google Scholar] [CrossRef]
  26. Liu, Y.; Zhang, J.; Yang, W.; Wu, F.; Xu, Z.; Tan, B.; Zhang, L.; He, X.; Guo, L. Canopy gaps accelerate soil organic carbon retention by soil microbial biomass in the organic horizon in a subalpine fir forest. Appl. Soil Ecol. 2018, 125, 169–176. [Google Scholar] [CrossRef]
  27. Zhang, X.; Chen, J.; Li, Q.; Liu, J.; Tao, J. Color quantification and evaluation of landscape aesthetic quality for autumn landscape forest based on visual characteristics in subalpine region of western Sichuan, China. Chin. J. Appl. Ecol. 2020, 31, 45–54. [Google Scholar] [CrossRef]
  28. Wu, C.; Cheng, C.; Chang, C.; Lin, C.; Chang, K.; Chuang, Y. Gap shape classification using landscape indices and multivariate statistics. Sci. Rep. 2016, 6, 1–10. [Google Scholar] [CrossRef]
  29. Daniel, T.C.; Boster, R.S. Measuring Landscape Esthetics: The Scenic Beauty Estimation Method; USDA Forest Service Research Paper; USDA: Washington, DC, USA, 1976.
  30. Wang, W.; Tao, J.; Li, Z.; Zhang, W.; Ding, Y. Gap features of subalpine dark coniferous forest in Wolong Nature Reserve. Chin. J. Appl. Ecol. 2004, 15, 1989–1993. [Google Scholar] [CrossRef]
  31. Liu, Q.; Wu, Y. Effects of gap size on regeneration of subalpine coniferous forests in northwest Yunnan. Chin. J. Appl. Environ. Biol. 2002, 8, 453–459. [Google Scholar] [CrossRef]
  32. Grace, J.; Anderson, T.; Olff, H.; Scheiner, S. On the specification of structural equation models for ecological systems. Ecol. Monogr. 2010, 80, 67–87. [Google Scholar] [CrossRef] [Green Version]
  33. Menges, E.S.; Craddock, A.; Salo, J.; Zinthefer, R.; Weekley, C.W. Gap ecology in Florida scrub: Species occurrence, diversity and gap properties. J. Veg. Sci. 2008, 19, 503–514. [Google Scholar] [CrossRef]
  34. Mallik, A.U.; Kreutzweiser, D.P.; Spalvieri, C.M. Forest regeneration in gaps seven years after partial harvesting in riparian buffers of boreal mixedwood streams. For. Ecol. Manag. 2014, 312, 117–128. [Google Scholar] [CrossRef]
  35. Weber, T.A.; Hart, J.L.; Schweitzer, C.J.; Dey, D.C. Influence of gap-scale disturbance on developmental and successional pathways in Quercus-Pinus stands. For. Ecol. Manag. 2014, 331, 60–70. [Google Scholar] [CrossRef]
  36. Busing, R.T.; White, P.S. Species diversity and small-scale disturbance in an old-growth temperate forest: A consideration of gap partitioning concepts. Oikos 1997, 78, 562–568. [Google Scholar] [CrossRef] [Green Version]
  37. Xu, W.; Ci, X.; Song, C.; He, T.; Zhang, W.; Li, Q.; Li, J. Soil phosphorus heterogeneity promotes tree species diversity and phylogenetic clustering in a tropical seasonal rainforest. Ecol. Evol. 2016, 6, 8719–8726. [Google Scholar] [CrossRef]
  38. Kumar, P.; Chen, H.Y.H.; Thomas, S.C.; Shahi, C. Linking resource availability and heterogeneity to understorey species diversity through succession in boreal forest of Canada. J. Ecol. 2018, 106, 1266–1276. [Google Scholar] [CrossRef]
  39. Denslow, J. Tropical rainforest gaps and tree species diversity. Annu. Rev. Ecol. Syst. 1987, 18, 431–451. [Google Scholar] [CrossRef]
  40. Hubbell, S.P.; Foster, R.B.; O’Brien, S.T.; Harms, K.E.; Condit, R.; Wechsler, B.; Wright, S.J.S.; Loo de Lao, S. Light-gap disturbances, recruitment limitation, and tree diversity in a neotropical forest. Science 1999, 283, 554–557. [Google Scholar] [CrossRef] [Green Version]
  41. Dee, J.R.; Menges, E.S. Gap ecology in the Florida scrubby flatwoods: Effects of time-since-fire, gap area, gap aggregation and microhabitat on gap species diversity. J. Veg. Sci. 2014, 25, 1235–1246. [Google Scholar] [CrossRef]
  42. Whitmore, T.C. Canopy gaps and the two major groups of forest trees. Ecology 1989, 70, 536–538. [Google Scholar] [CrossRef]
  43. Brokaw, N.V.L.; Scheiner, S.M. Species composition in gaps and structure of a tropical forest. Ecology 1989, 70, 538–541. [Google Scholar] [CrossRef]
  44. Schnitzer, S.A.; Carson, W.P. Treefall gaps and the maintenance of plant species diversity in a tropical forest. Ecology 2001, 82, 913–919. [Google Scholar] [CrossRef]
  45. Preston, F.W. The canonical distribution of commonness and rarity: Part I. Ecology 1962, 2, 185–215. [Google Scholar] [CrossRef]
  46. Busing, R.T. Composition, Structure and Diversity of Cove Forest Stands in the Great Smoky Mountains: A Patch Dynamics Perspective. J. Veg. Sci. 1998, 9, 881–890. [Google Scholar] [CrossRef]
  47. Manabe, T.; Shimatani, K.; Kawarasaki, S.; Aikawa, S.; Yamamoto, S. The patch mosaic of an old-growth warm-temperate forest: Patch-level descriptions of 40-year gap-forming processes and community structures. Ecol. Res. 2009, 24, 575–586. [Google Scholar] [CrossRef]
  48. Grose, M.J. Plant colour as a visual aspect of biological conservation. Biol. Conserv. 2012, 153, 159–163. [Google Scholar] [CrossRef]
  49. Runkle, J.R. Patterns of disturbance in some old-growth mesic forests of eastern north America. Ecology 1982, 63, 1533–1546. [Google Scholar] [CrossRef] [Green Version]
  50. Arriaga, L. Gap-building-phase regeneration in a tropical montane cloud forest of north-eastern Mexico. J. Trop. Ecol. 2000, 16, 535–562. [Google Scholar] [CrossRef]
  51. Li, P. The Influence of Space Characteristics of Color Patch on the Autumn Aesthetic Quality of the Forest of Cotinus coggygria. Master’s Thesis, Beijing Forestry University, Beijing, China, 2018. [Google Scholar]
  52. Quijas, S.; Jackson, L.E.; Maass, M.; Schmid, B.; Raffaelli, D.; Balvanera, P. Plant diversity and generation of ecosystem services at the landscape scale: Expert knowledge assessment. J. Appl. Ecol. 2012, 49, 929–940. [Google Scholar] [CrossRef] [Green Version]
  53. Lindemann-Matthies, P.; Junge, X.; Matthies, D. The influence of plant diversity on people’s perception and aesthetic appreciation of grassland vegetation. Biol. Conserv. 2010, 143, 195–202. [Google Scholar] [CrossRef] [Green Version]
  54. Hoyle, H.; Norton, B.; Dunnett, N.; Richards, J.P.; Russell, J.M.; Warren, P. Plant species or flower colour diversity? Identifying the drivers of public and invertebrate response to designed annual meadows. Landsc. Urban Plan. 2018, 180, 103–113. [Google Scholar] [CrossRef]
  55. Graves, R.A.; Pearson, S.M.; Turner, M.G. Species richness alone does not predict cultural ecosystem service value. Proc. Natl. Acad. Sci. USA 2017, 114, 3774–3779. [Google Scholar] [CrossRef] [Green Version]
  56. Cowell, C.M.; Hoalst-Pullen, N.; Jackson, M.T. The limited role of canopy gaps in the successional dynamics of a mature mixed Quercus forest remnant. J. Veg. Sci. 2010, 21, 201–212. [Google Scholar] [CrossRef]
  57. Petritan, A.M.; Nuske, R.S.; Petritan, I.C.; Tudose, N.C. Gap disturbance patterns in an old-growth sessile oak (Quercus petraea L.)—European beech (Fagus sylvatica L.) forest remnant in the Carpathian Mountains, Romania. For. Ecol. Manag. 2013, 308, 67–75. [Google Scholar] [CrossRef]
Figure 1. Location of study region.
Forests 12 00199 g001
Figure 2. Diagram of the canopy gap boundary definition process. The left is the original picture of a plot; the right is the map of gaps after processing. A white patch represents a gap.
Forests 12 00199 g002
Figure 3. Diagram of color-leaved patches processing. The left is the original picture of a plot; the right is the map of color-leaved patch distribution after processing; H1—H4 and H14—H16 represent color-leaved patches and H0 represents green patches. H1 represents red color-leaved patches; H2 represents red-orange color-leaved patches; H3 represents orange color-leaved patches; H4 represents yellow color-leaved patches; H14 represents fuchsia color-leaved patches; H15 represents rose color-leaved patches; H16 represents magenta color-leaved patches.
Forests 12 00199 g003
Figure 4. Relationships between GA with (a) ACTSD, (b) CPD, (d) CA, (e) GSI, and (f) CSI; the relationship between CPD with (c) ACTSD; the relationship between GSI with (g) CSI of each gap. ACTSD–autumn color-leaved tree species diversity; CPD–color-leaved patch diversity; CSI–color-leaved patch shape index; GSI–gap shape index; CA–color-leaved patch area; GA–gap area. Correlations (r) are indicated on the figure: ** indicates p < 0.01.
Forests 12 00199 g004
Figure 5. Relationship between GN with (a) TGA, (b) ACTSD, (c) CPD, and (d) TCA; relationship between TGA with (e) ACTSD, (f) CPD, (g) TCA, (h) GMSI and CMSI, (i) GMENN and CMENN, and (j) ACTSD and CPD in different gap groups. ACTSD–autumn color-leaved tree species diversity; CMENN–mean Euclidean nearest-neighbor distance of color-leaved patches; CMSI–mean shape index of color-leaved patch; CPD–color-leaved patch diversity; GMENN–mean Euclidean nearest-neighbor distance of gaps; GMSI–mean shape index of gaps; GN: number of gaps; TCA–total color-leaved patch area; TGA–total gap area. Black solid square indicates the value in small gap group; red solid circle indicates the value in medium gap group; blue solid triangle indicates the value in large gap group; green solid triangle indicates the value in very large gap group; purple solid diamond indicates the value in extreme large gap group. Solid lines with different colors indicate that there is a significant relationship between gap characteristics with ACTSD and color-leaved patch structure attributes in different gap groups; if there is no significant relationship, it is not marked in the figure; * and ** indicate p < 0.05 and p < 0.01, respectively.
Forests 12 00199 g005
Figure 6. Relationship between LAS with (a) GN, (b) TGA, (c) GMSI, (d) GMENN, (e) ACTSD, (f) CPD, (g) TCA, (h) CMSI, and (i) CMENN, in different gap groups. ACTSD–autumn color-leaved tree species diversity; CMENN–mean Euclidean nearest-neighbor distance of color-leaved patches; CMSI–mean shape index of color-leaved patch; CPD–color-leaved patch diversity; GMENN: mean Euclidean nearest-neighbor distance of gaps; GMSI–mean shape index of gaps; GN–number of gaps; LAS–landscape aesthetic service; TCA–total color-leaved patch area; TGA–total gap area. Red solid lines indicate that there is a significant relationship between landscape aesthetic service with gap characteristics, ACTSD, and color-leaved patch structure attributes in the medium gap group; if there is no significant relationship, it is not marked in the figure; * and ** indicate p < 0.05 and p < 0.01, respectively.
Forests 12 00199 g006
Figure 7. Path models for the effects of canopy gaps on ACTSD, CPD, TCA, and LAS (a) at medium canopy group level and (b) at the plot level. ACTSD–autumn color-leaved tree species diversity; CPD–color-leaved patch diversity; GN–number of gaps; LAS–landscape aesthetic service; TCA–total color-leaved patch area; TGA–total gap area. Numbers at arrows are standardized path coefficients (λ); *, ** and *** indicate p < 0.05, p < 0.01, and p < 0.001, respectively. Solid black lines indicate significant pathways (p < 0.05) and dashed black lines indicate nonsignificant pathways (p > 0.05); the strength of pathways is indicated by the width of the lines. R2 values labeled above the response variables indicate the proportion of variation explained by the relationship with other variables. The goodness-of-fit tests are shown at the bottom of each path diagram.
Forests 12 00199 g007
Figure 8. Relationship between LAS with (a) GN, (b) TGA, (c) GMSI, (d) GMENN, (e) ACTSD, (f) CPD, (g) TCA, (h) CMSI, and (i) CMENN, in each plot. ACTSD–autumn color-leaved tree species diversity; CMENN–mean Euclidean nearest-neighbor distance of color-leaved patches; CMSI–mean shape index of color-leaved patch; CPD–color-leaved patch diversity; GMENN–mean Euclidean nearest-neighbor distance of gaps; GMSI: mean shape index of gaps; GN–number of gaps; LAS–landscape aesthetic service; TCA–total color-leaved patch area; TGA–total gap area. Solid lines indicate that there is a significant relationship between landscape aesthetic service with gap characteristics, ACTSD, and color-leaved patch structure attributes; if there is no significant relationship, it is not marked in the figure; * and ** indicate p < 0.05 and p < 0.01, respectively.
Forests 12 00199 g008
Table 1. Differences of gap characteristics, color-leaved tree species diversity, color-leaved patch structure attributes in five gap size classes.
≤50 m251–100 m2101–500 m2501–1000 m2>1000 m2p
GSI1.57 ± 0.01 c1.83 ± 0.05 b1.91 ± 0.06 ab1.94 ± 0.17 ab2.78 ± 0.30 a0.000
ACTSD0.35 ± 0.01 c0.51 ± 0.03 b0.60 ± 0.04 ab0.74 ± 0.14 ab1.00 ± 0.12 a0.000
CPD0.84 ± 0.03 b1.25 ± 0.04 a1.29 ± 0.05 a1.35 ± 0.12 a1.60 ± 0.06 a0.000
CA2.14 ± 0.06 c4.25 ± 0.03 b5.37 ± 0.07 ab6.59 ± 0.09 ab7.42 ± 0.14 a0.000
CSI1.57 ± 0.02 b1.88 ± 0.05 a1.84 ± 0.07 a1.83 ± 0.07 a1.78 ± 0.04 a0.000
Values are the mean ± SE (standard error). ACTSD–autumn color-leaved tree species diversity; CPD–color-leaved patch diversity; CSI–color-leaved patch shape index; GSI–gap shape index; CA–color-leaved patch area. The p-values indicate the results of the Kruskal–Wallis one-way analysis of variance comparing the different gap size classes. Significant results (p < 0.05) are highlighted in bold. Values with different letters in the same row mean significant differences among different gap size classes.
Table 2. Differences of gap characteristics, color-leaved tree species diversity, and color-leaved patch structure attributes in five gap groups.
SMLVLELp
GN14.70 ± 3.57 a3.50 ± 0.53 b2.60 ± 0.42 bc1.40 ± 0.24 bc1.00 ± 0.00 c0.000
TGA4.88 ± 0.25 c5.32 ± 0.18 bc6.18 ± 0.20 ab6.91 ± 0.14 a7.42 ± 0.14 a0.000
GMSI1.64 ± 0.03 b1.89 ± 0.06 a1.92 ± 0.09 a2.04 ± 0.21 a2.77 ± 0.36 a0.000
GMENN13.92 ± 3.418.15 ± 4.1225.31 ± 4.7424.99 ± 20.420.131
ACTSD0.52 ± 0.050.50 ± 0.070.51 ± 0.050.46 ± 0.120.64 ± 0.080.626
CPD1.34 ± 0.081.43 ± 0.081.43 ± 0.081.29 ± 0.161.60 ± 0.060.306
TCA4.40 ± 0.28 c4.88 ± 0.19 c5.64 ± 0.21 b6.42 ± 0.10 ab6.93 ± 0.13 a0.000
CMSI1.59 ± 0.03 b1.80 ± 0.11 a1.78 ± 0.05 a1.72 ±0.07 ab1.76 ± 0.03 a0.006
CMENN3.98 ± 1.62 a2.01 ± 0.69 ab0.55 ± 0.08 b0.40 ± 0.09 b0.59 ± 0.13 b0.001
Values are the mean ± SE (standard error). The p-values indicate the results of the Kruskal–Wallis one-way analysis of variance comparing the different gap groups. S is small gap group; M is medium gap group; L is large gap group; VL is very large gap group; EL is extreme large gap group. ACTSD–autumn color-leaved tree species diversity; CMENN–mean Euclidean nearest-neighbor distance of color-leaved patches; CMSI–mean shape index of color-leaved patch; CPD–color-leaved patch diversity; GMENN–mean Euclidean nearest-neighbor distance of gaps; GMSI–mean shape index of gaps; GN–number of gaps; TCA–total color-leaved patch area; TGA–total gap area; ‘’ means no data. Significant results (p < 0.05) are highlighted in bold. Values with different letters in the same row mean significant differences.
Publisher’s Note: MDPI stays neutral with regard to jurisdictional claims in published maps and institutional affiliations.

