Article

Climate Variability, Land Cover Changes and Livelihoods of Communities on the Fringes of Bobiri Forest Reserve, Ghana

1
Department of Environmental Science, College of Science, Kwame Nkrumah University of Science and Technology, Kumasi, Ghana
2
Sustainability Research Institute, School of Earth and Environment, University of Leeds, West Yorkshire, Leeds LS2 9JT, UK
*
Author to whom correspondence should be addressed.
Forests 2021, 12(3), 278; https://doi.org/10.3390/f12030278
Submission received: 21 September 2020 / Revised: 24 December 2020 / Accepted: 16 January 2021 / Published: 28 February 2021
(This article belongs to the Section Forest Ecology and Management)

Abstract

:
Climate variability coupled with land use and land cover changes have resulted in significant changes in forest reserves in Ghana with major implications for rural livelihoods. Understanding the link between climate variability, land use and land cover changes and rural livelihoods is key for decision-making, especially regarding sustainable management of forest resources, monitoring of ecosystems and related livelihoods. The study determined the extent to which climate variability drives land cover changes in the Bobiri forest reserve, Ghana. Landsat images from 1986, 2003, 2010 and 2014 were used to evaluate land cover changes of the Bobiri forest reserve in Ghana. Participatory research approaches including household questionnaire surveys, focus group discussions and key informant interviews were conducted in four fringe communities of the Bobiri forest reserve. Findings showed that local people perceived changes in rainfall and temperature patterns over the past years. Historical rainfall and temperature data for the study area showed increased variability in rainfall and an increasing temperature trend, which are consistent with the perception of the study respondents. Analysis of land cover satellite images showed that there has been significant transformation of closed forest to open forest and non-forest land cover types over the 28-year period (1986–2014), with an overall kappa statistic of 0.77. Between 2003 and 2014, closed forest decreased by 15.6% but settlement/bare ground and crop land increased marginally by 1.5% and 0.9%, respectively. Focus group discussions and key informant interviews revealed that increased land cover changes in the Bobiri forest reserve could partly be attributed to erratic rainfall patterns. Other factors such as logging and population growth were reported to be factors driving land cover changes. The study concluded that the Bobiri forest reserve has witnessed significant land cover changes and recommended that alternative livelihood sources should be provided to reduce the direct dependency of fringe communities on the forest for livelihood and firewood.

1. Introduction

Globally, climate change and variability have received considerable research attention due to their adverse impacts on livelihoods especially in sub-Saharan Africa (SSA), where adaptive capacity is low [1]. The Intergovernmental Panel on Climate Change (IPCC) [2] revealed that some countries in SSA face dry conditions that make agriculture demanding, and climate change is likely to decrease growing seasons, as well as force large regions of marginal agricultural potential out of production. Climate variability and extreme events have the potential to affect both natural and modified forests [3]. Lucier et al. [4] reported that, many changes in forests have been caused by recent global warming. It has been projected that future climate changes and their concomitant effects are expected to have adverse effects on forests [3]. Some of the effects include: observed shifts in vegetation distribution and increased mortality of trees as a result of heat and droughts in forests worldwide [5,6]. These effects will have significant repercussions on food security and related livelihoods in SSA, particularly in Ghana where agriculture is predominantly rain-fed [7,8,9].
Farming is the dominant livelihood in the forest zone of Ghana [10]. Most of these farming practices entail the management and integration of trees, food crops and/or livestock and hence are agroforestry by definition [11]. Other livelihood options available to forest dependent communities in Ghana are: sale of non-timber forest products (including snails, mushrooms, canes, raffia and leafy vegetables), beekeeping, livestock rearing, artisanal milling, charcoal production etc. [12]. However, according to Mckeown [13], the livelihood strategies of forest dependent communities in Ghana are still linked to illegal chainsaw milling practices. This is partly due to structural flaws in the system (e.g., inequitable land and tree tenure and corruption) [13].
In Ghana, rural livelihoods are negatively affected by land use and land cover changes [14]. Grasslands are gradually becoming widespread in forest communities in Ghana due to a number of reasons including bush burning, rearing of ruminants, population growth and timber logging [15]. Deforestation rates have increased over the past two decades in Ghana with significant impacts on rainfall, temperature and livelihoods [12]. For instance, Ghana lost a mean of 135,000 hectares (ha) of forest for each year for the period 1990 to 2000 [16]. Ghana’s forests further reduced by 115,000 ha for the period 2000 to 2005 [16]. In total, Ghana lost 26% of its forest cover between 1990 and 2005 [16]. The outcomes of the reduction of closed forests to grasslands and other land use types have been a dramatic change in climate and evolution of strategies to sustain livelihoods in forest-dependent communities.
Bobiri forest reserve is found in the Ashanti region of Ghana and is administered by the Forestry Research Institute of Ghana (FORIG). According to FORIG [17], the reserve supplies significant value, including the non-timber reserve supplies as well as timber products and fodder. It serves the purpose of ecotourism (i.e., serves as a butterfly sanctuary). Furthermore, the reserve gives the chance to acquire an in-depth knowledge of the environment as well as the opportunity to get educated on new cultures. However, the forest reserve has seen some form of forest fragmentation lately due, primarily, to both legal and illegal timber exploitation and arable crop farming [17]. Similarly, Addo-Fordjour and Ankomah [18] identified bushfires, illegal logging, and gathering of fuel as factors affecting the fast reduction of closed-canopy forest in Bobiri forest reserve.
Studies have been conducted in the past regarding land use and land cover changes in Ghana. For instance, Antwi-Agyei et al. [14] highlighted the dangers from urbanisation to land cover changes and identified the key drivers of land use change in the Owabi reservoir catchment. Similarly, Osei et al. [19] also examined the impact of climate and land use changes on the hydrological process of the Owabi catchment. Urbanization has also been implicated in land use changes in the Achimota forest reserve, an urban tropical forest in Accra [20]. These studies document impressive evidence on land use and land cover (LULC) changes in Ghana. However, evidence on how climate variability drives LULC changes in forest communities has received limited research attention. Therefore, this paper addresses the research gap by determining the extent to which climate variability drives livelihoods and land cover changes of communities on the fringes of Bobiri forest reserve. The study objectives were: (i) to explore the perception of fringe communities of the Bobiri forest reserve on rainfall and temperature changes; (ii) to assess the extent of rainfall and temperature changes in the Bobiri forest reserve for the period 1960–2016; (iii) to determine the extent of land cover changes in the Bobiri forest reserve for the period 1986–2014; and (iv) to assess the perceived factors driving land cover changes in the Bobiri forest reserve.
Findings from this study will provide useful information to aid policy makers in devising appropriate policies to improve rural livelihoods in forest-fringe communities. A more profound comprehension of the interconnection between climate variability, land use and land cover changes and rural livelihoods is also key for taking decisions especially regarding sustainable management of forest resources, monitoring of ecosystems and related livelihood dynamics [14,21].

2. Materials and Methods

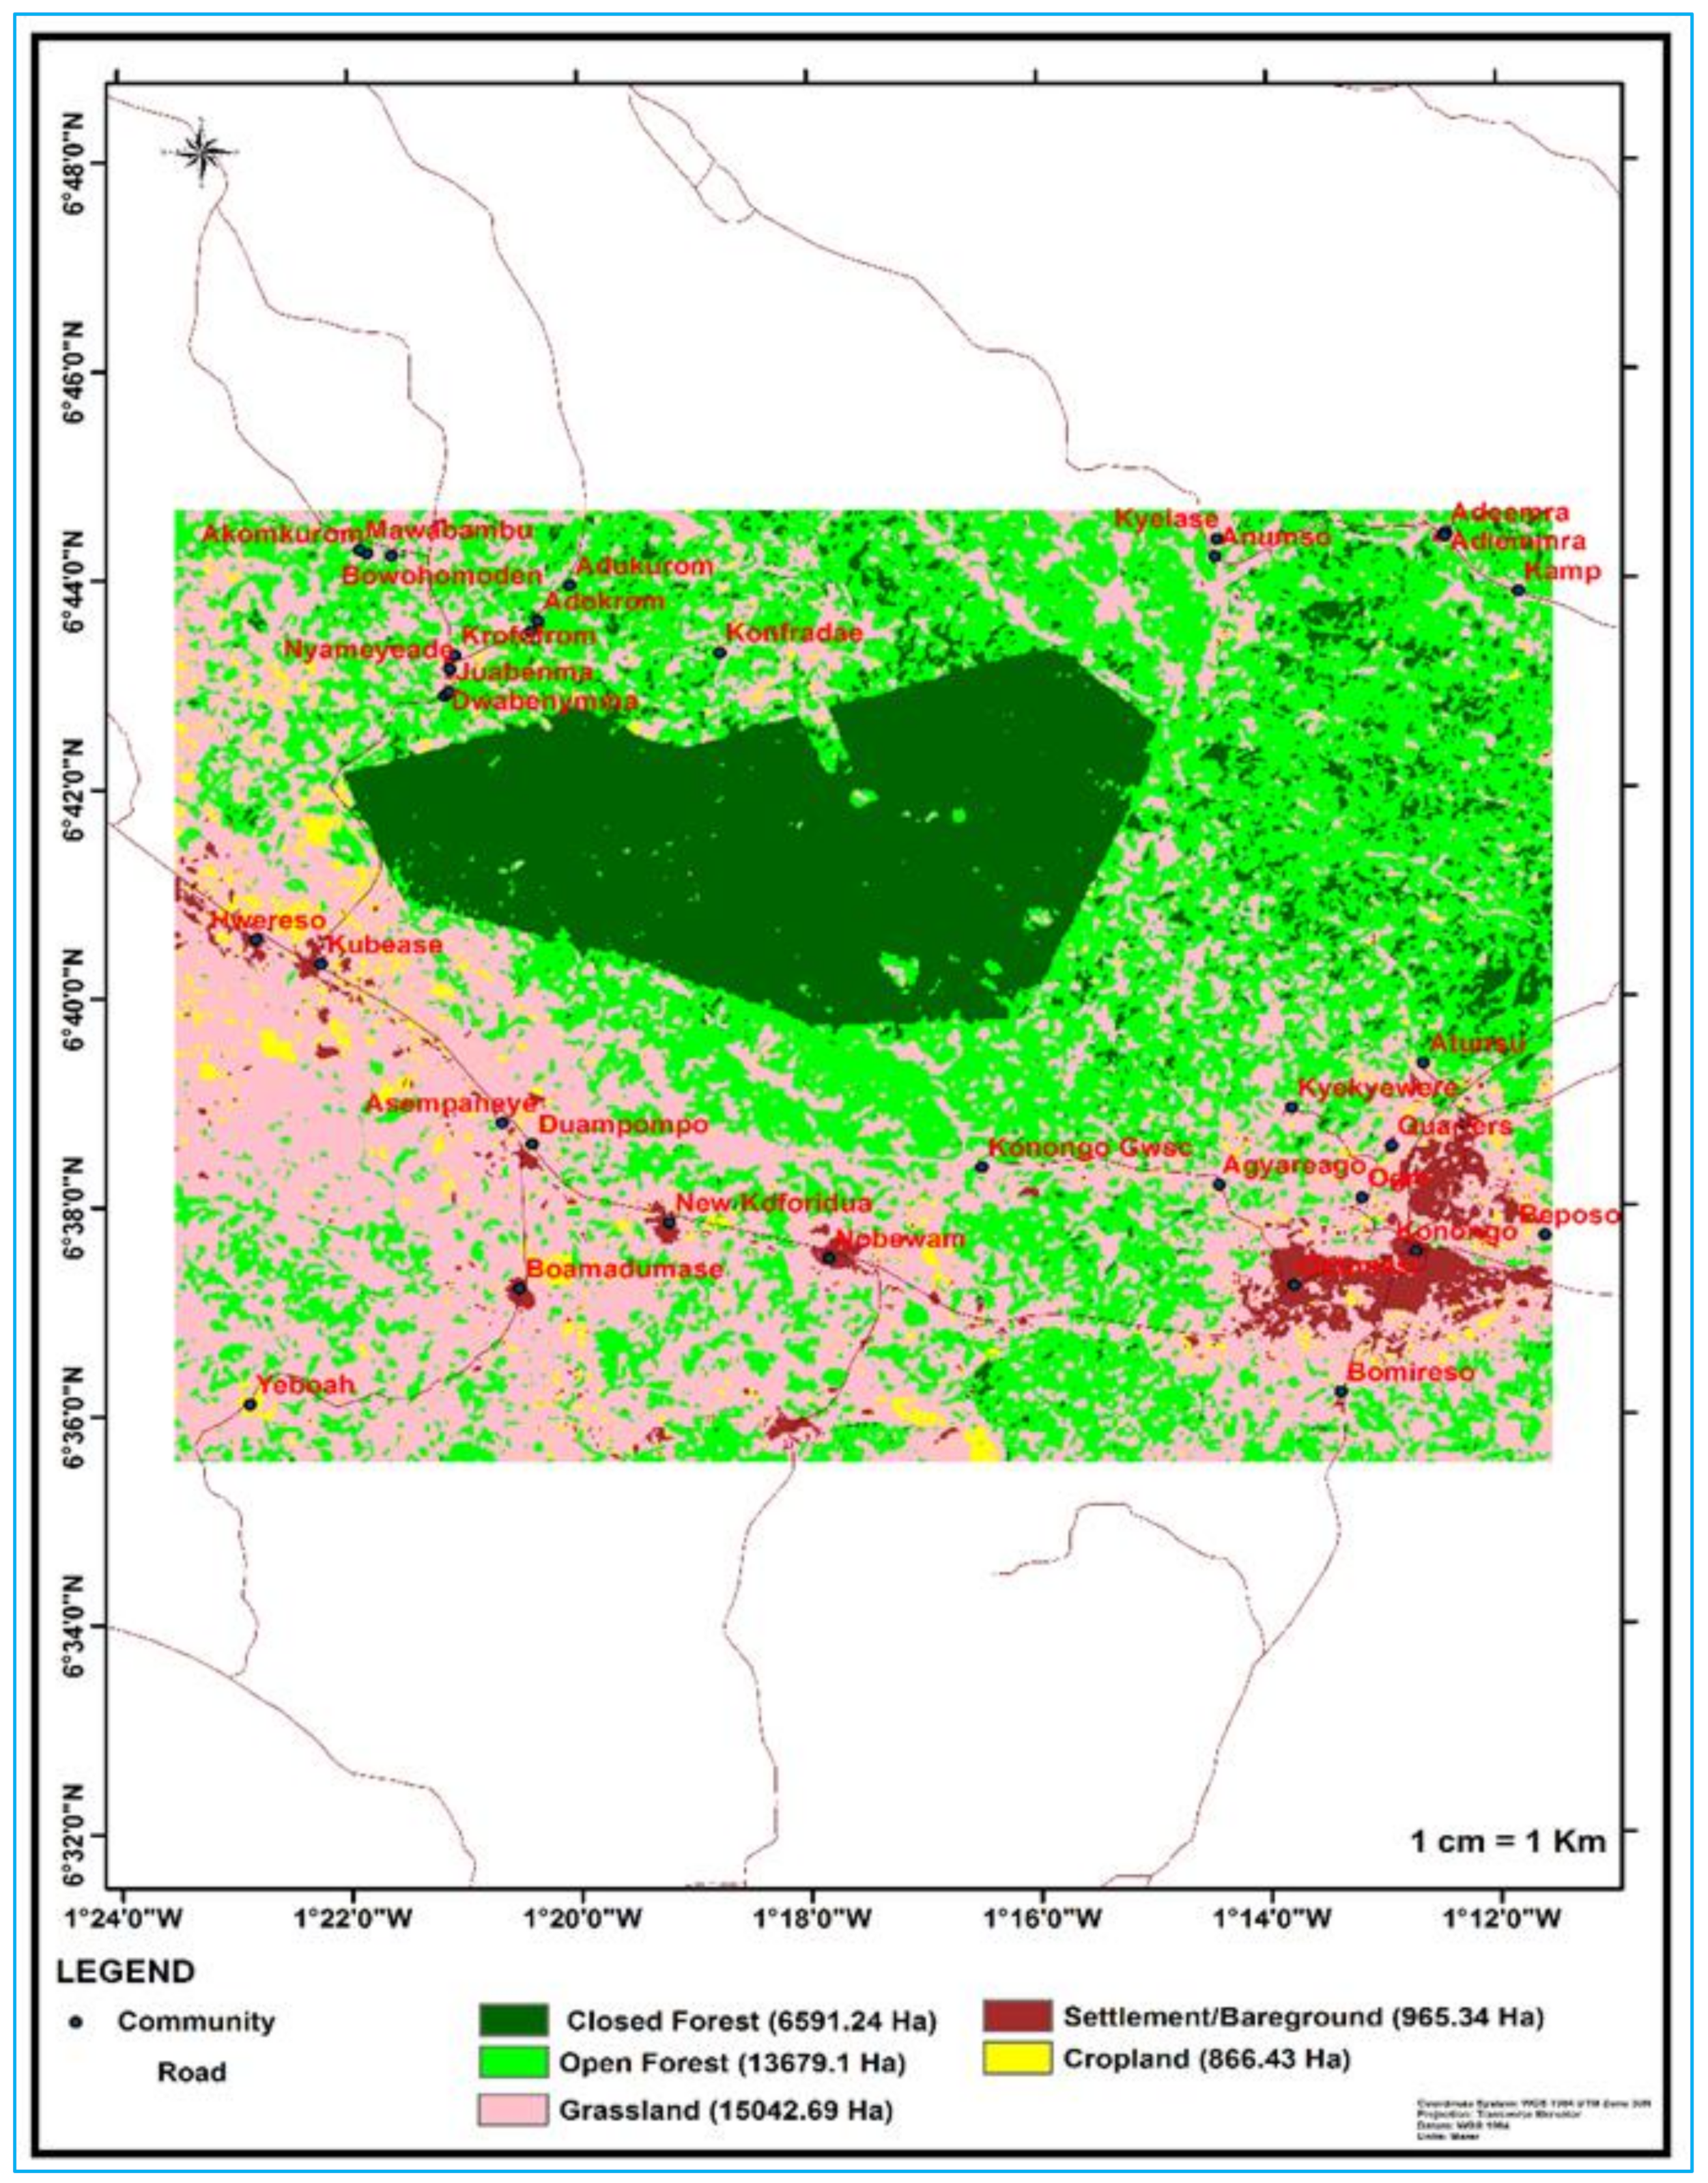
2.1. Description of Study Area

Bobiri forest reserve is together overseen by fringe communities of the forest and FORIG. According to Djagbletey [22], about a quarter of the forest has been laid to one side and is being used for forest research by the Forestry Research Institute of Ghana (FORIG). Bobiri forest reserve was created in its unspoilt state in 1939, yet from that point forward, it has encountered different types of human interferences. Bobiri forest reserve lies between latitude 6°40′ and 6°44′ north of the Equator and on longitudes 1°15′ and 1°22′ west of the Greenwich meridian (Figure 1). The entire area of the reserve for tourism is 54.6 square kilometers, and forms part of the Juaso forest reserve district of the Ashanti region.
Addo-Fordjour and Ankomah [18] reported that the reserve lies in the tropical moist semi-deciduous southeast forest zone of Ghana. The forest reserve is the nearest reserve to Kumasi in the Ashanti region. Annual rainfall in the forest varies between 1200 and 1750 mm, and the main dry season lasts from December to March with a shorter dry season in August. Rainfall in the forest is bimodal with two rainy seasons: March to June and September to November.
Four communities surrounding the forest reserve were purposively selected. The study communities were chosen as a result of the details obtained from native people on their dependence on products or resources from the forest. The natives are people from the fringe communities who share collective ancestral ties to the forest lands and the natural resources. The natural resources and lands on which they rely on are inevitably connected to their livelihoods. A sample of these natives were interviewed to determine how much these communities depended on the forest reserve. Thus, the communities that were selected were Konfradae, Dwabenymma, Krofofrom and Kubease (Figure 1). In each community, households were randomly selected by ballot and each household was allocated a ballot paper. A total of 100 households were selected from each of the four fringe communities. This was done to achieve a sample size of 400 respondents intended for this study. Table 1 shows the characteristics of the study communities.

2.2. Research Design and Analysis

The study combined Landsat satellite images together with mixed-method participatory approaches to understand the effects of LULC changes on livelihoods in the selected study communities. Time series analysis, a statistical methodology appropriate for longitudinal research design, was adopted to determine the trend in mean annual rainfall and temperature for the period 1960–2016. In addition, cross-sectional design was used to explore the perception of fringe communities to climate change and variability. A cross-sectional study design is where variables are measured or determined at the same time in a given population [23]. According to Alexander et al. [23], the cross-sectional survey is useful for assessing the knowledge, beliefs, attitudes and practices of a population regarding a particular event or phenomenon.

2.2.1. Trend Analysis of Rainfall and Temperature

The nonparametric Mann–Kendall trend test was used for trend analysis while Sen’s slope estimator was used to evaluate the magnitude of the trend [24,25]. This test was used to analyze the rainfall and temperature data collected over time for consistently increasing or decreasing trends in the rainfall and temperature values. The test establishes two hypotheses: the null and alternate hypothesis. The null hypothesis assumes that there is no significant trend in the time series and the alternate hypothesis assumes the opposite. Autocorrelation was taken into account using the Hamed and Rao method [26]. The advantages of using this test are that (1) it is nonparametric (i.e., it does not require the data to be normally distributed); (2) it is less sensitive to outliers (extraordinarily high values within time series data); and (3) it is the most robust as well as suitable for detecting trends in rainfall and temperature. This method has been used in the past in hydrological and climatological studies to determine the extent of change of climatic variables [27,28,29]. The Mann–Kendall trend test following Gilbert [30] is calculated as follows:
s g n   ( x j x k) is an indicator function that takes on the values 1, 0, or −1 according to the sign of s g n   ( x j x k), that is,
s g n   ( x j x k )   =   1     i f   x j x k   > 0
s g n   ( x j x k )   =   0     i f   x j x k   = 0
s g n   ( x j x k )   =   1     i f   x j x k   < 0
where x j and x k are the sequential rainfall or temperature values in months j and k (j > k) respectively. A positive value is an indicator of increasing trend and a negative value is an indicator of decreasing trend. In the equation, X1, X2, X3… Xn represents ‘n’ data points (monthly), where XJ represents the data point at time J. Then the Mann–Kendall statistic (S) is defined as the sum of the number of positive differences minus the number of negative differences, given by:
S =   k = 1 n 1 j = k + n n s g n   ( x j x k )
where
s g n   ( x j x k )   =   1     i f   x j x k   > 0
s g n   ( x j x k )   =   0     i f   x j x k   = 0
s g n   ( x j x k )   =   1     i f   x j x k   < 0
The variance is given by:
V A R   S = 1 18   [ n   n 1 2 n   + 5   k = 1 p q k   q k 1 2 q k + 5 ] ,
where p is the total number of tie groups in the data, and q k is the number of data points contained in the k-th tie group.
Trends considered at the study area were tested for significance. A normalized test statistic (Z-score) was used to check the statistical significance of the increasing or decreasing trend of mean precipitation and temperature values. The trends of temperature were determined and their statistical significance was tested using the Mann–Kendall trend significant test with the level of significance of 0.05 (Z_α/2 = ±1.96).
Z =   n 1 v a r s i f ,   S > 0
Z = 0   i f ,   S > 0
Z =   n 1 v a r s i f ,   S < 0
Hypothesis testing: H o = μ = μ o means there is no significant trend/stable trend in the data and Ha = μ μ o means there is a significant trend/unstable trend in the data. −Z1−α/2ZZ1−α/2 accepts the hypothesis or else rejects the null hypothesis. Powerfully increasing or decreasing trends indicate a higher level of statistical significance [31].
The variability in annual rainfall and temperature in the study area was estimated using the coefficient of variation [32]. The coefficient of variation was estimated by dividing the standard deviation by the mean and the result multiplied by one hundred percent. This is represented as:
C V =   σ μ × 100 %
where σ = standard deviation and μ =   mean.

2.2.2. Image Acquisition

Landsat images with little or no cloud cover for the years 1986 (Landsat 5), 2003 (Landsat 7), 2010 (Landsat 7) and 2014 (Landsat 8) were downloaded from the United States Geological Survey (USGS) Global Visualization Viewer (GLOVIS) website (https://glovis.usgs.gov/). The cloud cover information (a percentage) for each image was obtained from the metadata on the same website. Landsat images were used for this work because of their long coverage of the earth surface which spans from the 1970s to date, their availability (open source) and spatial resolution (30 m) making them suitable for land cover classification [33]. Landsat images come in tiles and each tile is identified by its path and row number which is unique. The Landsat tile that covers the study area for this work has the path and row number of 194 and 055 respectively. The Landsat images were downloaded as zip files and therefore program software, WinRAR, was used to extract them into their various bands and stored for further analysis. Table 2 provides further details of the Landsat images used.
The community and road shape files were obtained from the Center of Remote Sensing and Geographic Information System (CERSGIS), University of Ghana and Department of Feeder Roads, Ghana respectively. The study area boundary was arbitrarily developed using the “editing toolset” in ArcGIS 10.3 to cover the communities (i.e., Konfradae, Dwabenymma, Krofofrom and Kubease) involved in this study which span from longitude 1°23′32.405′′ west (W) and latitude 6°44′42.28′′ north (N) to longitude 1°11′26.458′′ W and latitude 6°35′32.599′′ N.

2.2.3. Image Preprocessing

Before using the satellite images, preprocessing was done. The preprocessing involved radiometric correction, geometric correction and atmospheric correction. Radiometric correction was done to reduce or correct errors in the digital numbers of image. The process improved the interpretability and quality of remote sensed data. Geometric correction was done to compensate for the distortions and ultimately produce a corrected image with a high level of geometric integrity. Furthermore, the atmospheric correction was done to determine true surface reflectance by removing atmospheric effects from satellite images. Atmospheric correction was arguably the most important part of the pre-processing of satellite remotely sensed data because any omission could have produced erroneous results.

2.2.4. Image Classification

Image classification is performed to identify and assign real world thematic classes to the image pixels [33]. In this study, image classification was done in two (2) stages, supervised and unsupervised classification.

Unsupervised Classification

In the unsupervised classification method, the computer software categorized the pixels into common land use using their spectral characteristics without any training data [33]. In this work, the isodata unsupervised classification algorithm in ERDAS Imagine 2010 was used to classify each clipped image (output from the clip operation) into 30–40 classes. The classes were merged together based on the spectral similarity to form 8–10 classes. The community and road shape files were overlaid on the outputs to check the distribution of these classes across the communities and for easy navigation for field data collection. A map was produced from the 2014 classified image together with the community and road shape files. This was used as preliminary map for field data collection.

Field Data Collection

The field data collection was undertaken to first familiarize ourselves with the nature of land use within the study area, and also pick points as training datasets for supervised image classification. The points were also used to perform accuracy assessment of the classified images to assess their level of correctness. A stratified clustered representative sampling technique was adopted for the field data collection, where points were collected based on the dominance of the various classes. That is, the higher the coverage, the more points are collected. One hundred points were collected from the field. The data collected from the field included the coordinates of the points using a Global Positioning System (GPS) receiver, the land use description at that point and the adjoining land use. For inaccessible areas, Google Earth software was employed to extricate points. All the data were entered on a field sheet and later transferred into a Microsoft Excel sheet. The field data were grouped according to the land use types identified. In all, five land use types were identified, namely, open forest, closed forest, grassland, crop land and settlement/bare ground. Table 3 describes the land use types identified.

Supervised Classification

In the supervised classification, the image analyst “supervises” the pixel categorization process by specifying, to the computer algorithm, numerical descriptors of the various land cover types present in a scene [33]. The classification was done in ERDAS Imagine 2010. The polygon tool was used in training the pixels (signatures). This was made easier based on the knowledge of the study area gained from the field visit as well as images from the Google Earth software. During the training of pixels, each class (land use) had subclasses. The purpose of the subclasses was to reduce the margin of error. After training the pixels, the maximum likelihood algorithm was used in running the classification. The maximum likelihood (ML) classifier considers not only the cluster center but also its shape, size and orientation and this is achieved by calculating a statistical distance based on the mean values and covariance matrix of the clusters [33]. After the classification, the outputs were displayed in ArcGis 10.3. The subclasses were merged together using the reclass tool in ArcGis 10.3. This operation is called reclassification. The reclassified maps were then filtered to remove the “salt-and-pepper appearance” and enhance the cartographic presentation after the image classification. This was done using the “majority filter” tool in ArcGis 10.3. The outputs from the filtering operation became the final land use maps. The final maps included the land use, community and road network.

2.2.5. Change Detection

According to Singh [34], detailed remote sensing data processed in a timely fashion can be vital in change detection tasks to check the differences in land cover changes at different times. Lu et al. [35] report that there are several change detection methods available and each method has differences based on the type of change to be detected, the type of imagery and the final purpose of the change image. However, the change method that was used in this study was the “postclassification comparison” [36,37,38,39]. This method allows the determination of the difference between independently classified images from each of the years in question and it is the only approach in which “from” and “to” classes can be evaluated for each changed pixel. This technique provides the benefit of permitting the design and the update of GIS databases, as categories or classes are given, and quantitative estimations of each class can be ascertained [40].

2.2.6. Validation

Validation, also called accuracy assessment, is a critical step in the use and distribution of the results of analyses of remotely sensed data [41]. In this work, the source of information employed to evaluate the precision of the categorization were from the field data. The accuracy assessment was performed on the final land use map. Confusion matrix analysis was used. This employs correctness evaluation methods to derive statistical products, which may be employed to examine the standard of the categorization answers. The matrix compares on category-by-category emerging from the field data and the categorization answers. The overall accuracy as well as the kappa statistic was also computed. The accuracy assessment was performed on the 2014 land use map since it was the most recent map.

2.2.7. Participatory Methods

Primary data was administered through personal interview surveys with closed-ended and open-ended questions to heads of different households, or other representatives of the family who were accustomed with the use of the forest resources or products. Primary data focused on the respondents’ perception of climate variability and the perceived causes, their main livelihood activities and the perceived factors driving LULC changes in the communities. For each community, a total of 100 questionnaire were randomly administered. The questionnaires were administered in their homes or any convenient place in the catchment area. In total, we selected 400 respondents for the study. The interviews were conducted in an appropriate local language (Asante Twi) and we ensured confidentiality of response. The respondents agreed to taking part in the interviews. There was no pressure on them to participate. Additionally, it was explained to them that, they could pull out of the study at any stage they desired. The questionnaires were administered from January to June 2017.
A focus group discussion (FGD) was carried out in each community to collect information on services provided by the ecosystem and vulnerability of local communities to climate change effects. Focus groups participants were selected based on the need to incorporate dissimilar socioeconomic groups and also people who demonstrated substantial comprehension of the climatic modifications and a comprehensive agro-ecological understanding of the communities. For the purpose of this study, an average number of 10 participants were used for the FGD and consisted of equal number of men and women so as to generate gender-specific information. Focus group participants included farmers, traditional authorities, men, women, youth, assembly members and unit committee members. Each of the focus group discussion lasted for about an hour.
Respondents who displayed substantial comprehension of the climatic modifications around them from the focus group discussions and administration of the questionnaires were chosen for in-depth interviews. These were some rural farmers, traditional leaders and the leaders involved in community decision making. An average number of five (5) participants from each community were used for the key informant interviews. The interviews lasted for about 45 minutes. The discussions from the FGD and key informant interviews were taped and later transcribed with the agreement of the participants.
We used Microsoft Excel version 2013 and IBM Statistical Package for Social Sciences (SPSS) version 21 to analyze the data. We used descriptive statistics comprising means, frequencies and percentages to evaluate data obtained from the household surveys. Reflexive thematic analysis was also used to examine qualitative data gathered from focus group discussions and key informant interviews following analytic strategies as suggested by Braun and Clarke [42].

3. Results

3.1. Sociodemographic Characteristics of the Respondents

The male population constituted 143 individuals (35.8%) whilst females constituted the larger portion of the study with 257 (64.2%). With regards to age, 217 respondents (54.3%) were within the age category of 21–40 years (Appendix A, Table A1) and the male population within this age category constituted 64.3% whilst the females formed 48.6%. Regarding education, only 57 of the respondents (14.3%) had no formal education. The majority of the respondents (n = 264; 66.0%) had attained basic form of education. Very few of the respondents (n = 36; 9.0%) had tertiary education. Regarding length of experience acquired in farming, 156 respondents (39.0%) had 6–10 years of experience in farming. Nevertheless, 110 respondents (27.5%) had 11–20 years of farming experience. A few of the respondents (n = 53; 13.3%) had farmed for less than five years (Appendix A, Table A1).

3.2. Main Livelihood Activities of the Communities

Among the livelihood activities, crop production dominated most with 198 (49.5%) respondents. This was followed by non-timber forest products (NTFPs) where 97 (24.3%) of the respondents were involved. The respondents involved in petty trading (for examples: food vending and sale of groceries) constituted the least (4.5%) as indicated in Table 4. It was observed that the males (59.4%) were more involved in crop production whilst the females (30.7%) were more engaged in NTFPs and charcoal making (9.8%) (Table 4).

3.3. Perception of the Respondents on Rainfall and Temperature Changes

Although most of the local people in the communities did not understand the science of climate variability, nevertheless, they had knowledge on the impacts of increasing temperature and rainfall variability. The perception of the rural communities on precipitation and temperature trends is shown in Table 5. A sizeable number of the respondents had knowledge of climate variability issues. For the purpose of this study, climatic changes were limited to alterations of precipitation and temperature pattern that have marked the study area for the past years. In terms of rainfall, 290 of the respondents (72.5%) perceived that there were changes in the onset of rainfall. Some of the respondents (27.5%) perceived no changes in the onset of rainfall. One hundred and two respondents (25.5%) perceived rainfall to be increasing. The majority of the respondents, 74.5%, perceived rainfall to be decreasing. With regard to temperature, the majority of the respondents (91.5%) perceived that temperature kept on increasing with only a few of the respondents (8.5%) perceiving temperature to be decreasing.
Regarding the causes of climate variability, 349 (87.3%) of the respondents perceived that anthropogenic activities (for example, overlogging and bush fires) were the main causes of the changing climate. Twenty-four (6.0%) attributed the phenomenon to natural occurrence, while 17 (4.3%) and 10 (2.5%) of the respondents said the cause of changing climate is a punishment by God and signs of the end of time respectively. The order of the causes of climate variability did not differ significantly by gender as both males and females perceived overlogging and signs of the end of time as the greatest and least causes of climate variability respectively (Table 6).

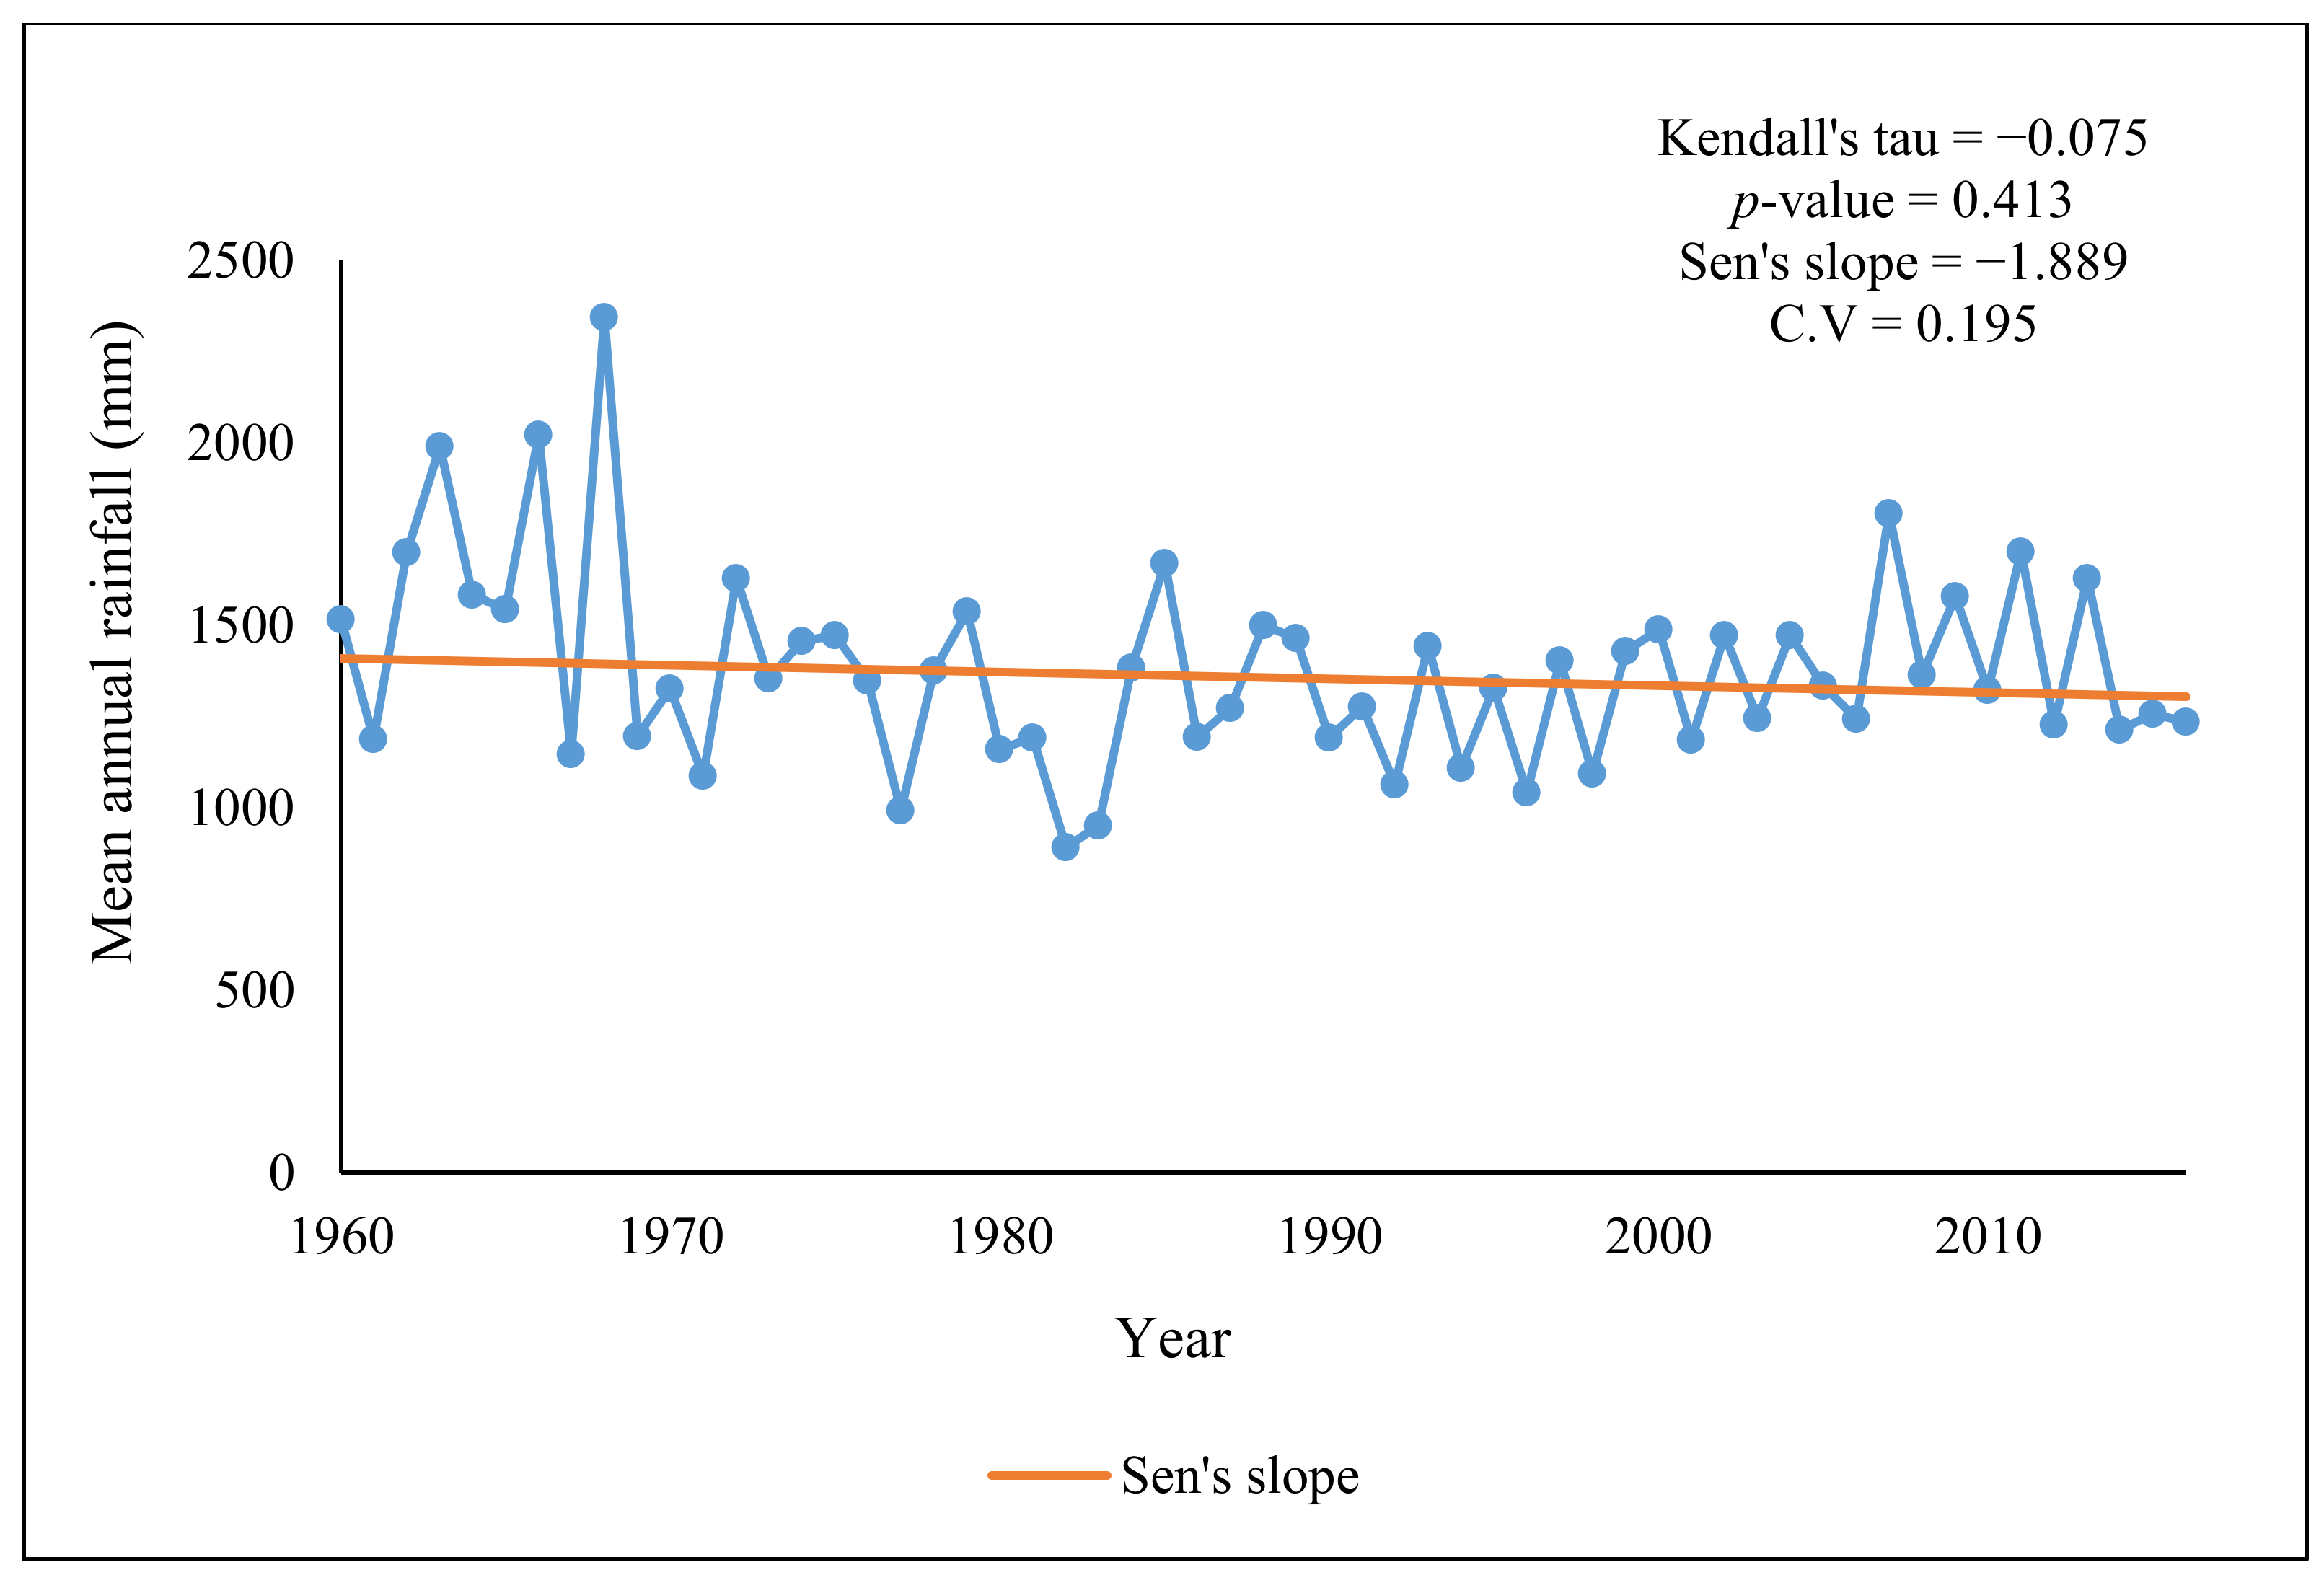
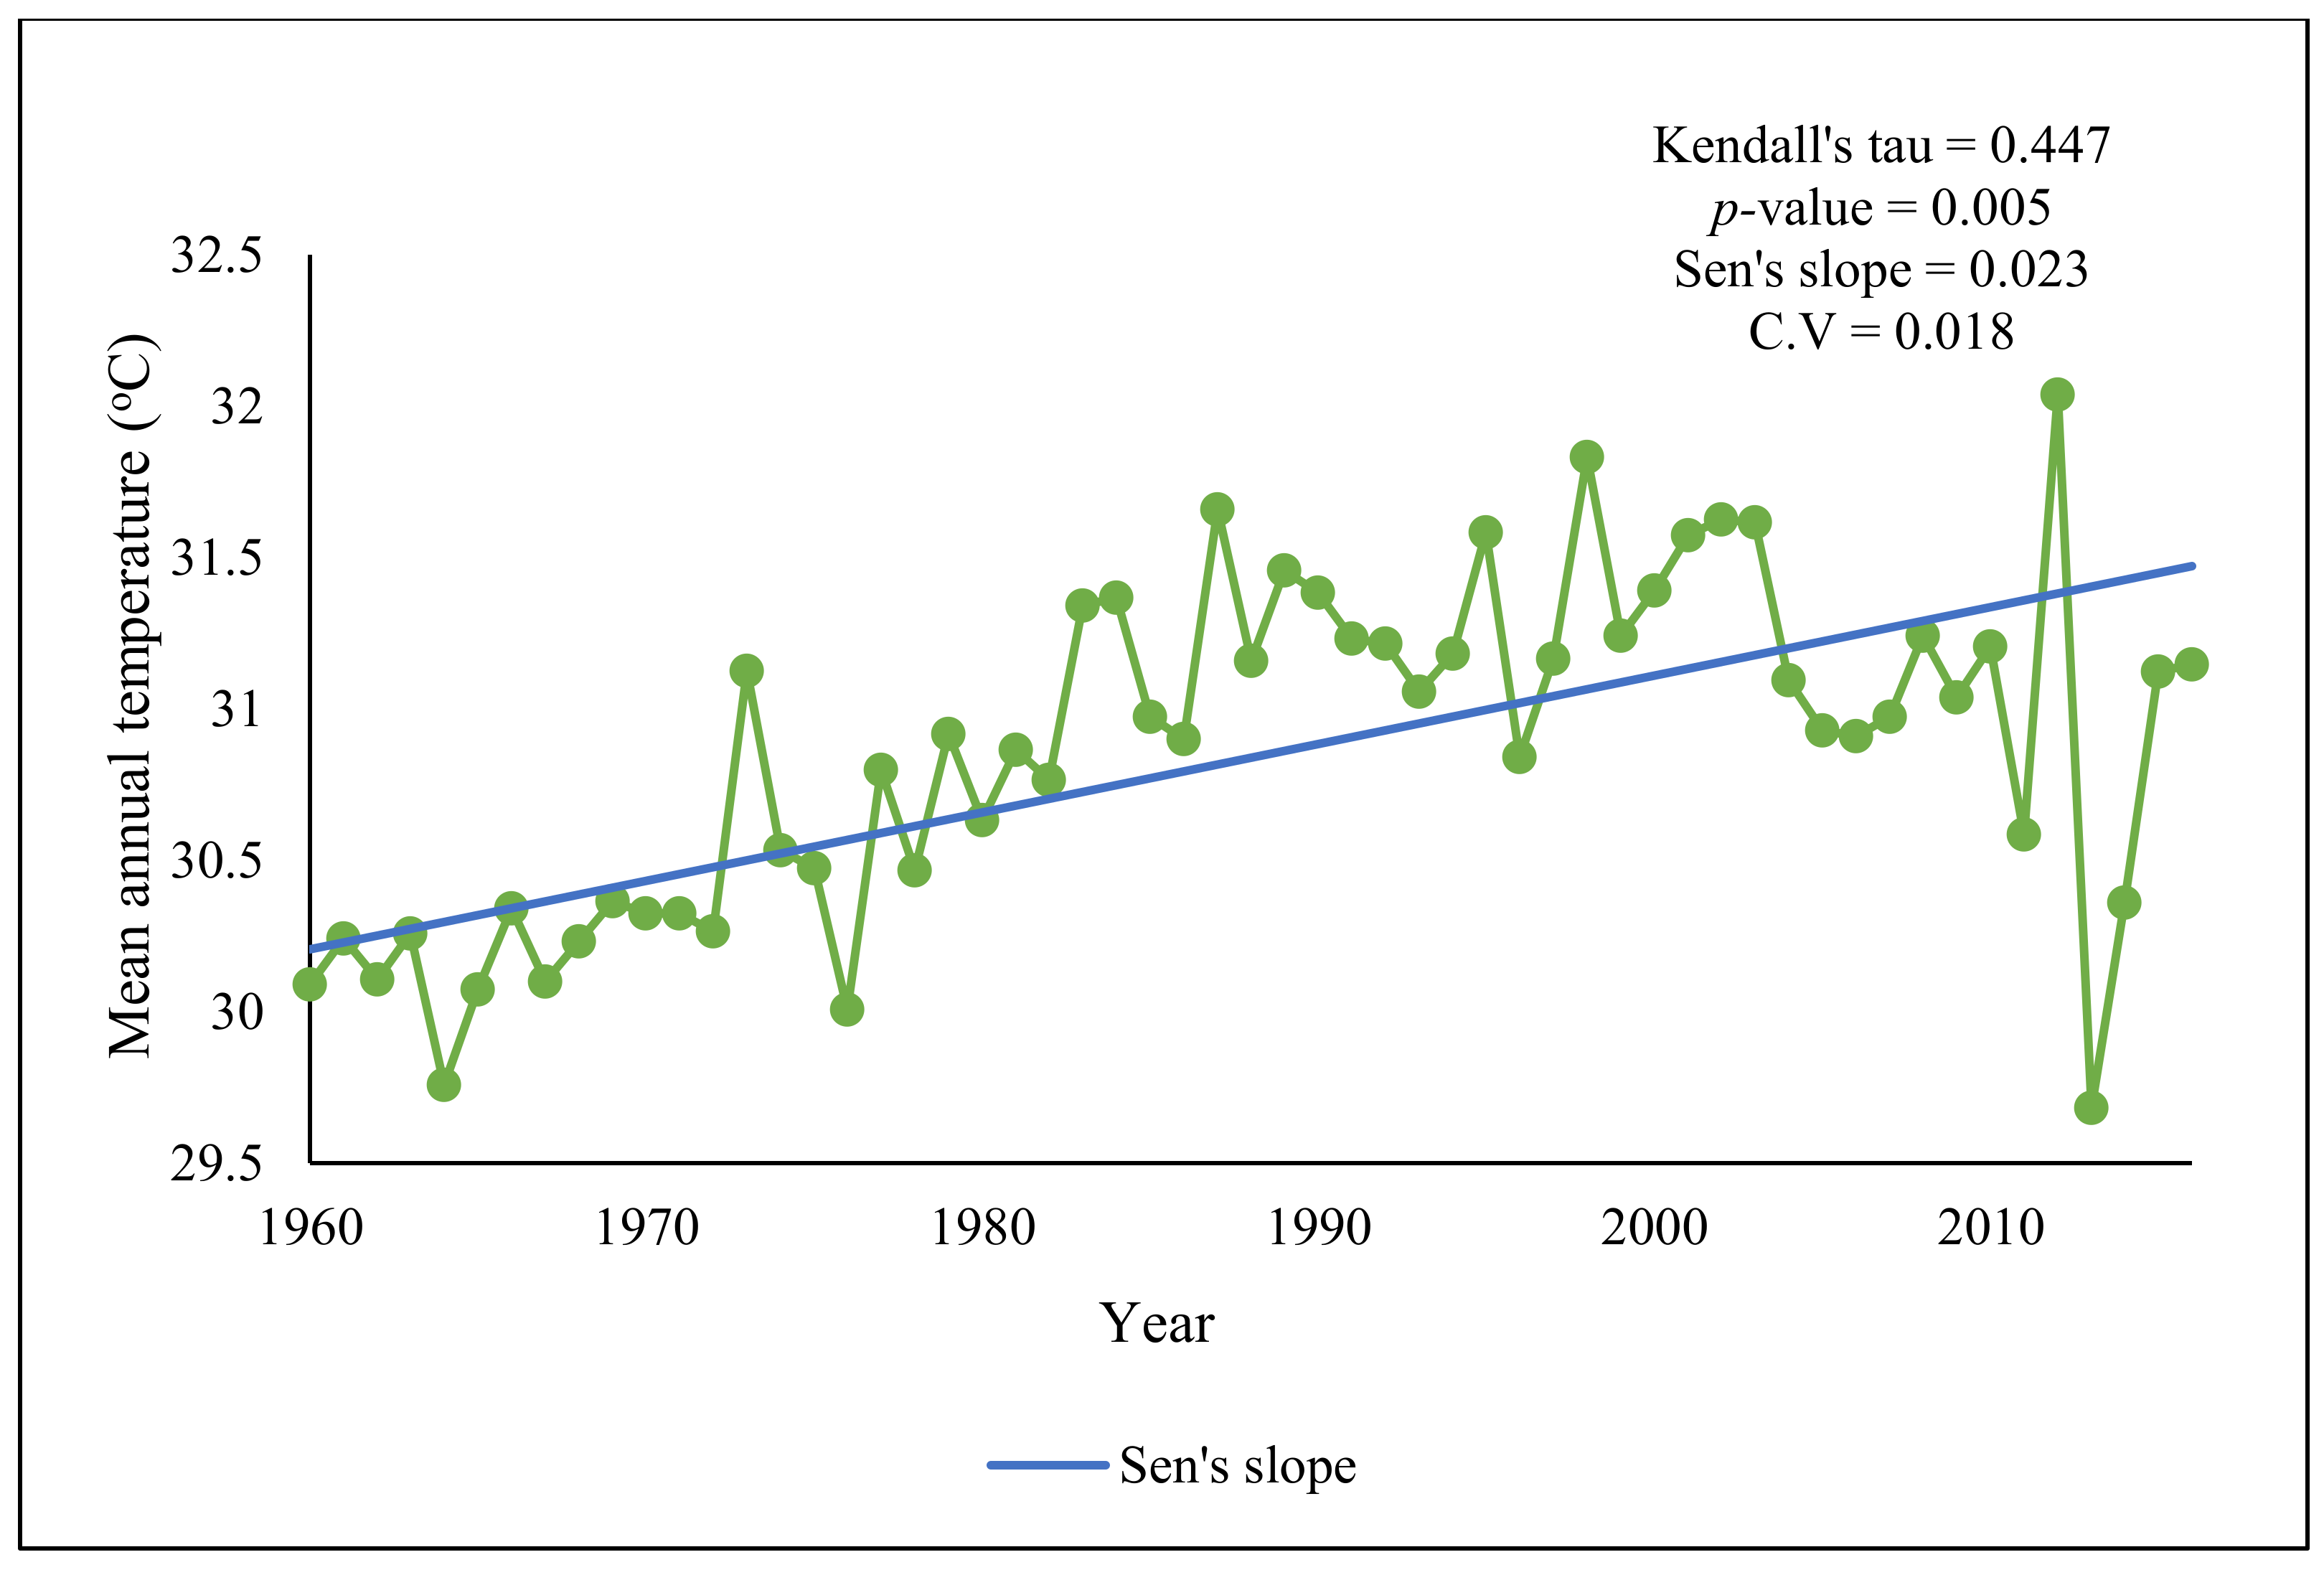
3.4. Extent of Rainfall and Temperature Changes in the Bobiri Forest Reserve, Ghana

Results showed that annual rainfall patterns in the study area have been variable from 1960 to 2016, with the highest mean annual rainfall (2343.7 mm) recorded in the year 1968 and the lowest (891 mm) recorded in the year 1982 (Figure 2). The negative values of Sen’s slope and Kendall’s tau indicated a decrease in annual rainfall in the study area over the period of the study (1960–2016), although the trend was not statistically significant (p > 0.05). The study area experienced a rainfall variability of about 20%.
Figure 3 presents the extent of temperature changes within the study area for the period 1960–2016. The Mann–Kendall test indicated significant increase in temperature over time (p < 0.05) during the study period. Kendall’s tau and Sen’s slope also confirmed an increase in annual temperature over the study period. The study area experienced a temperature variability of about 2%.

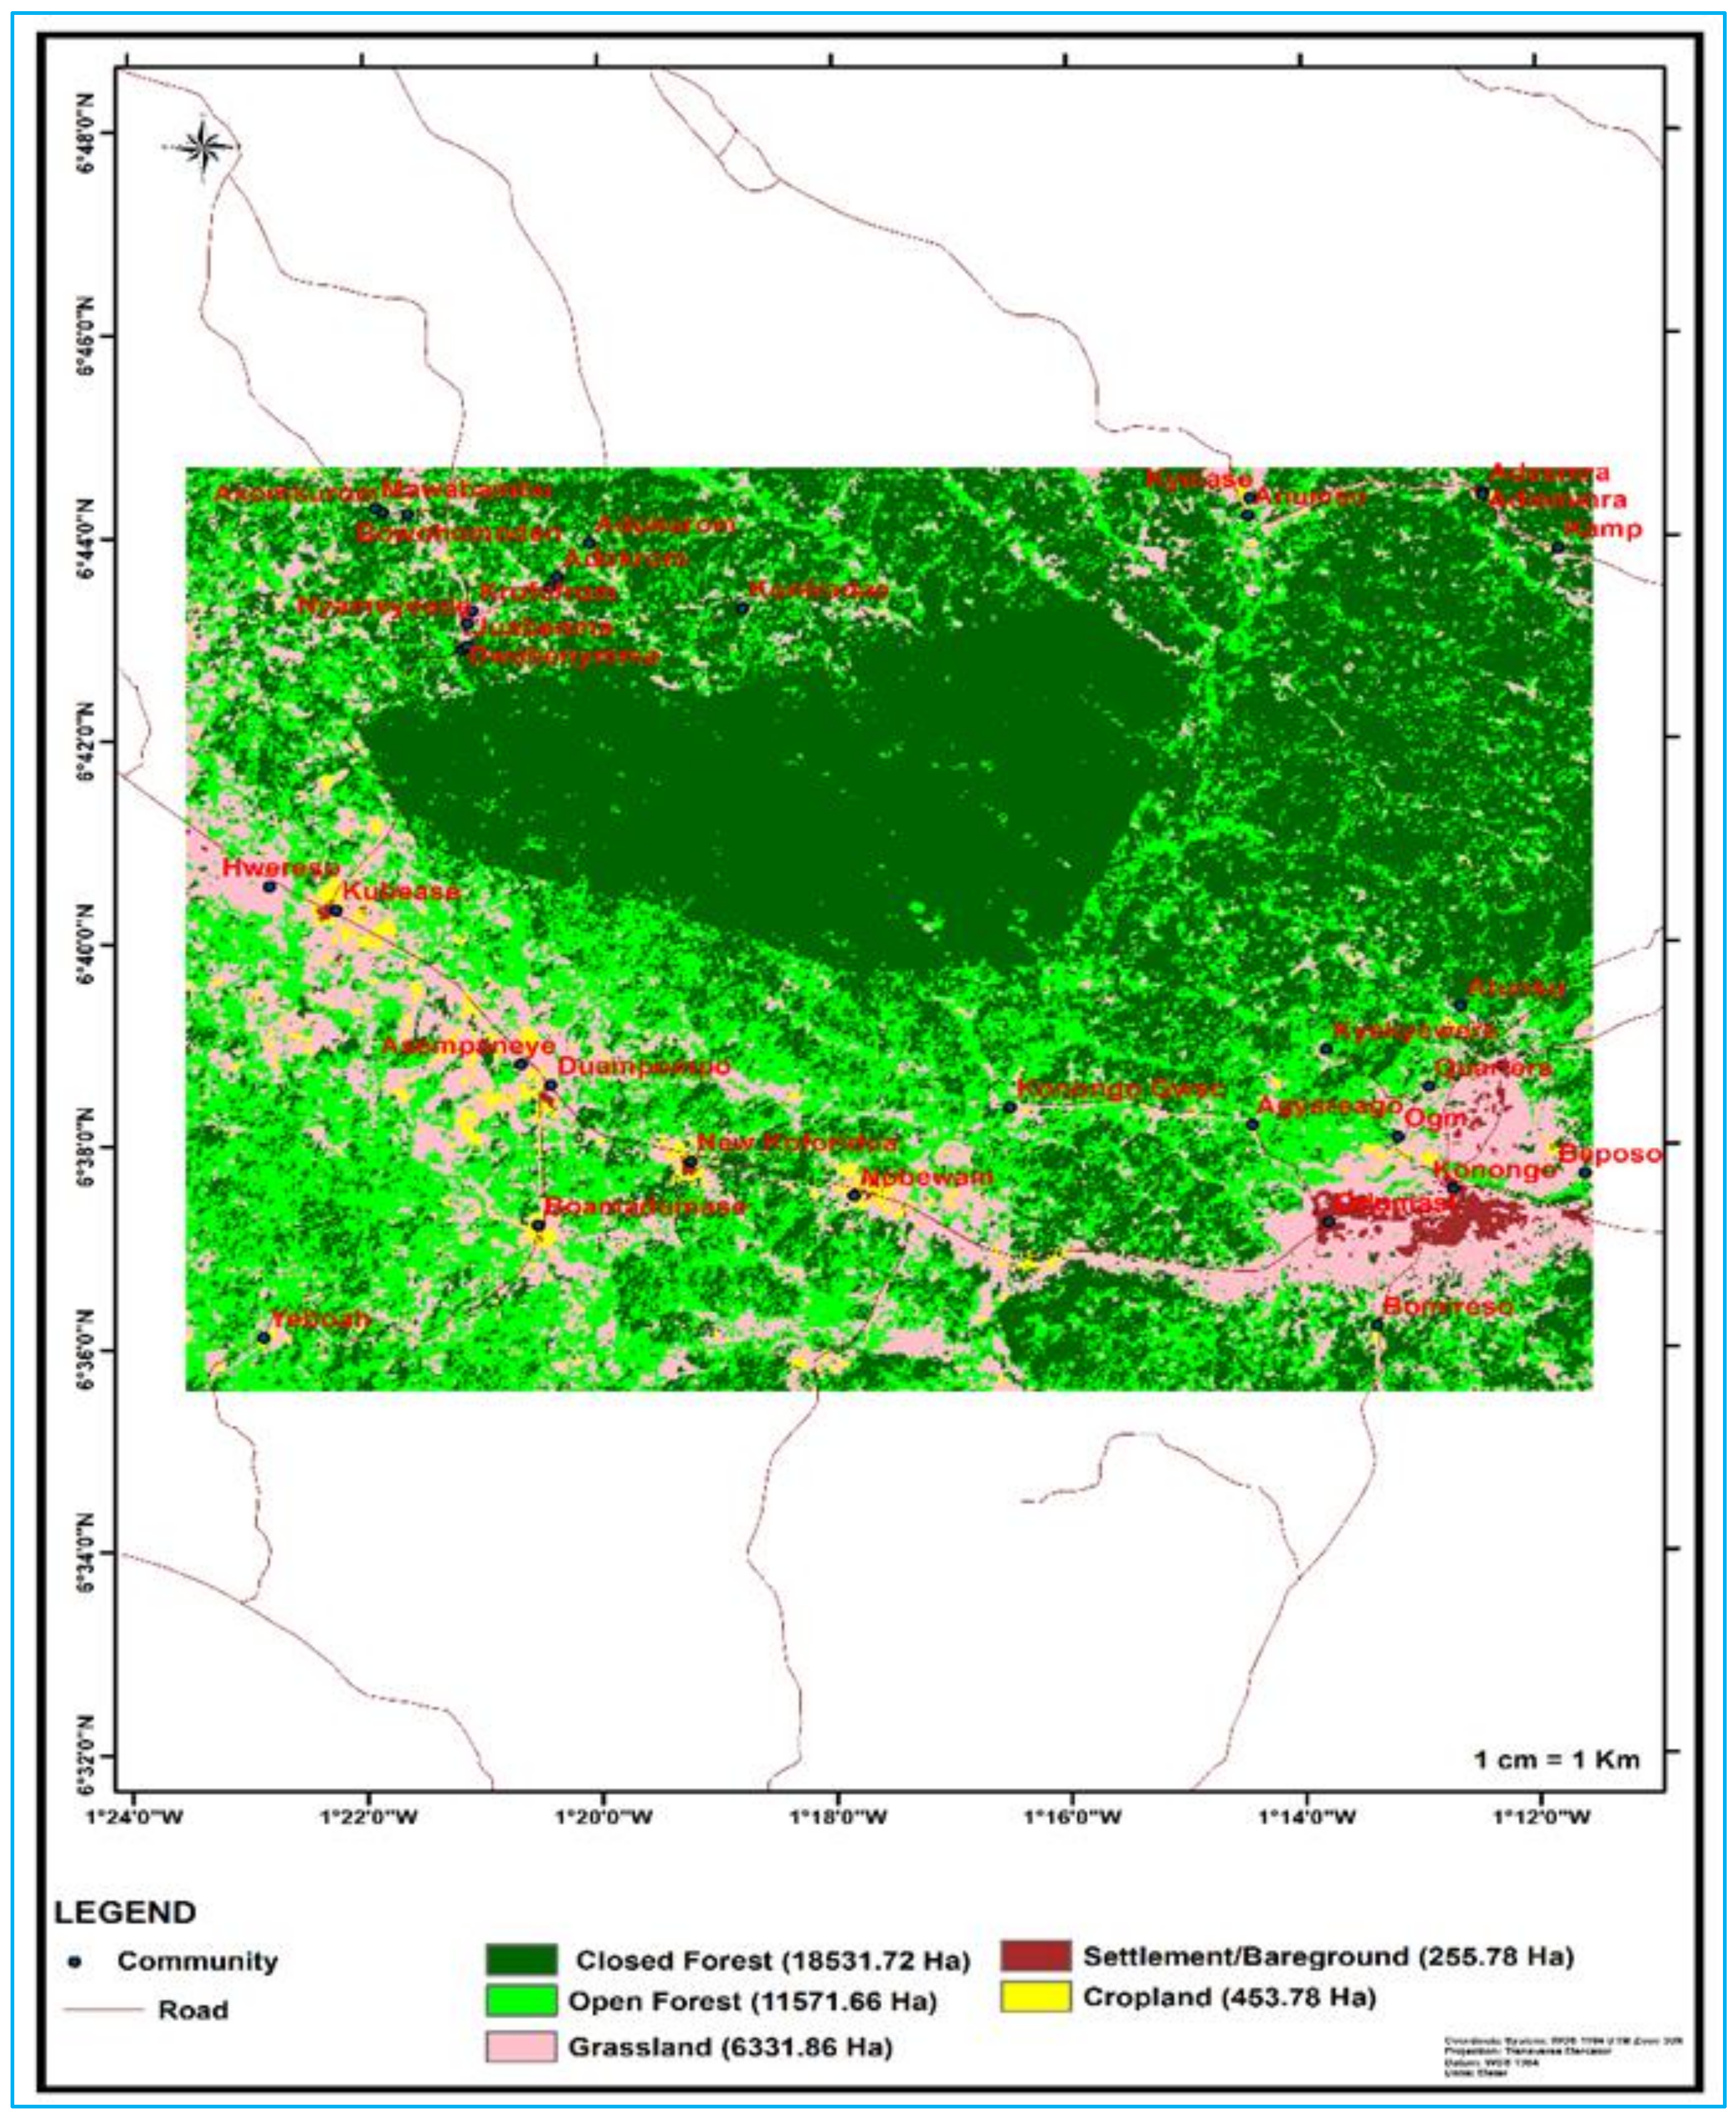
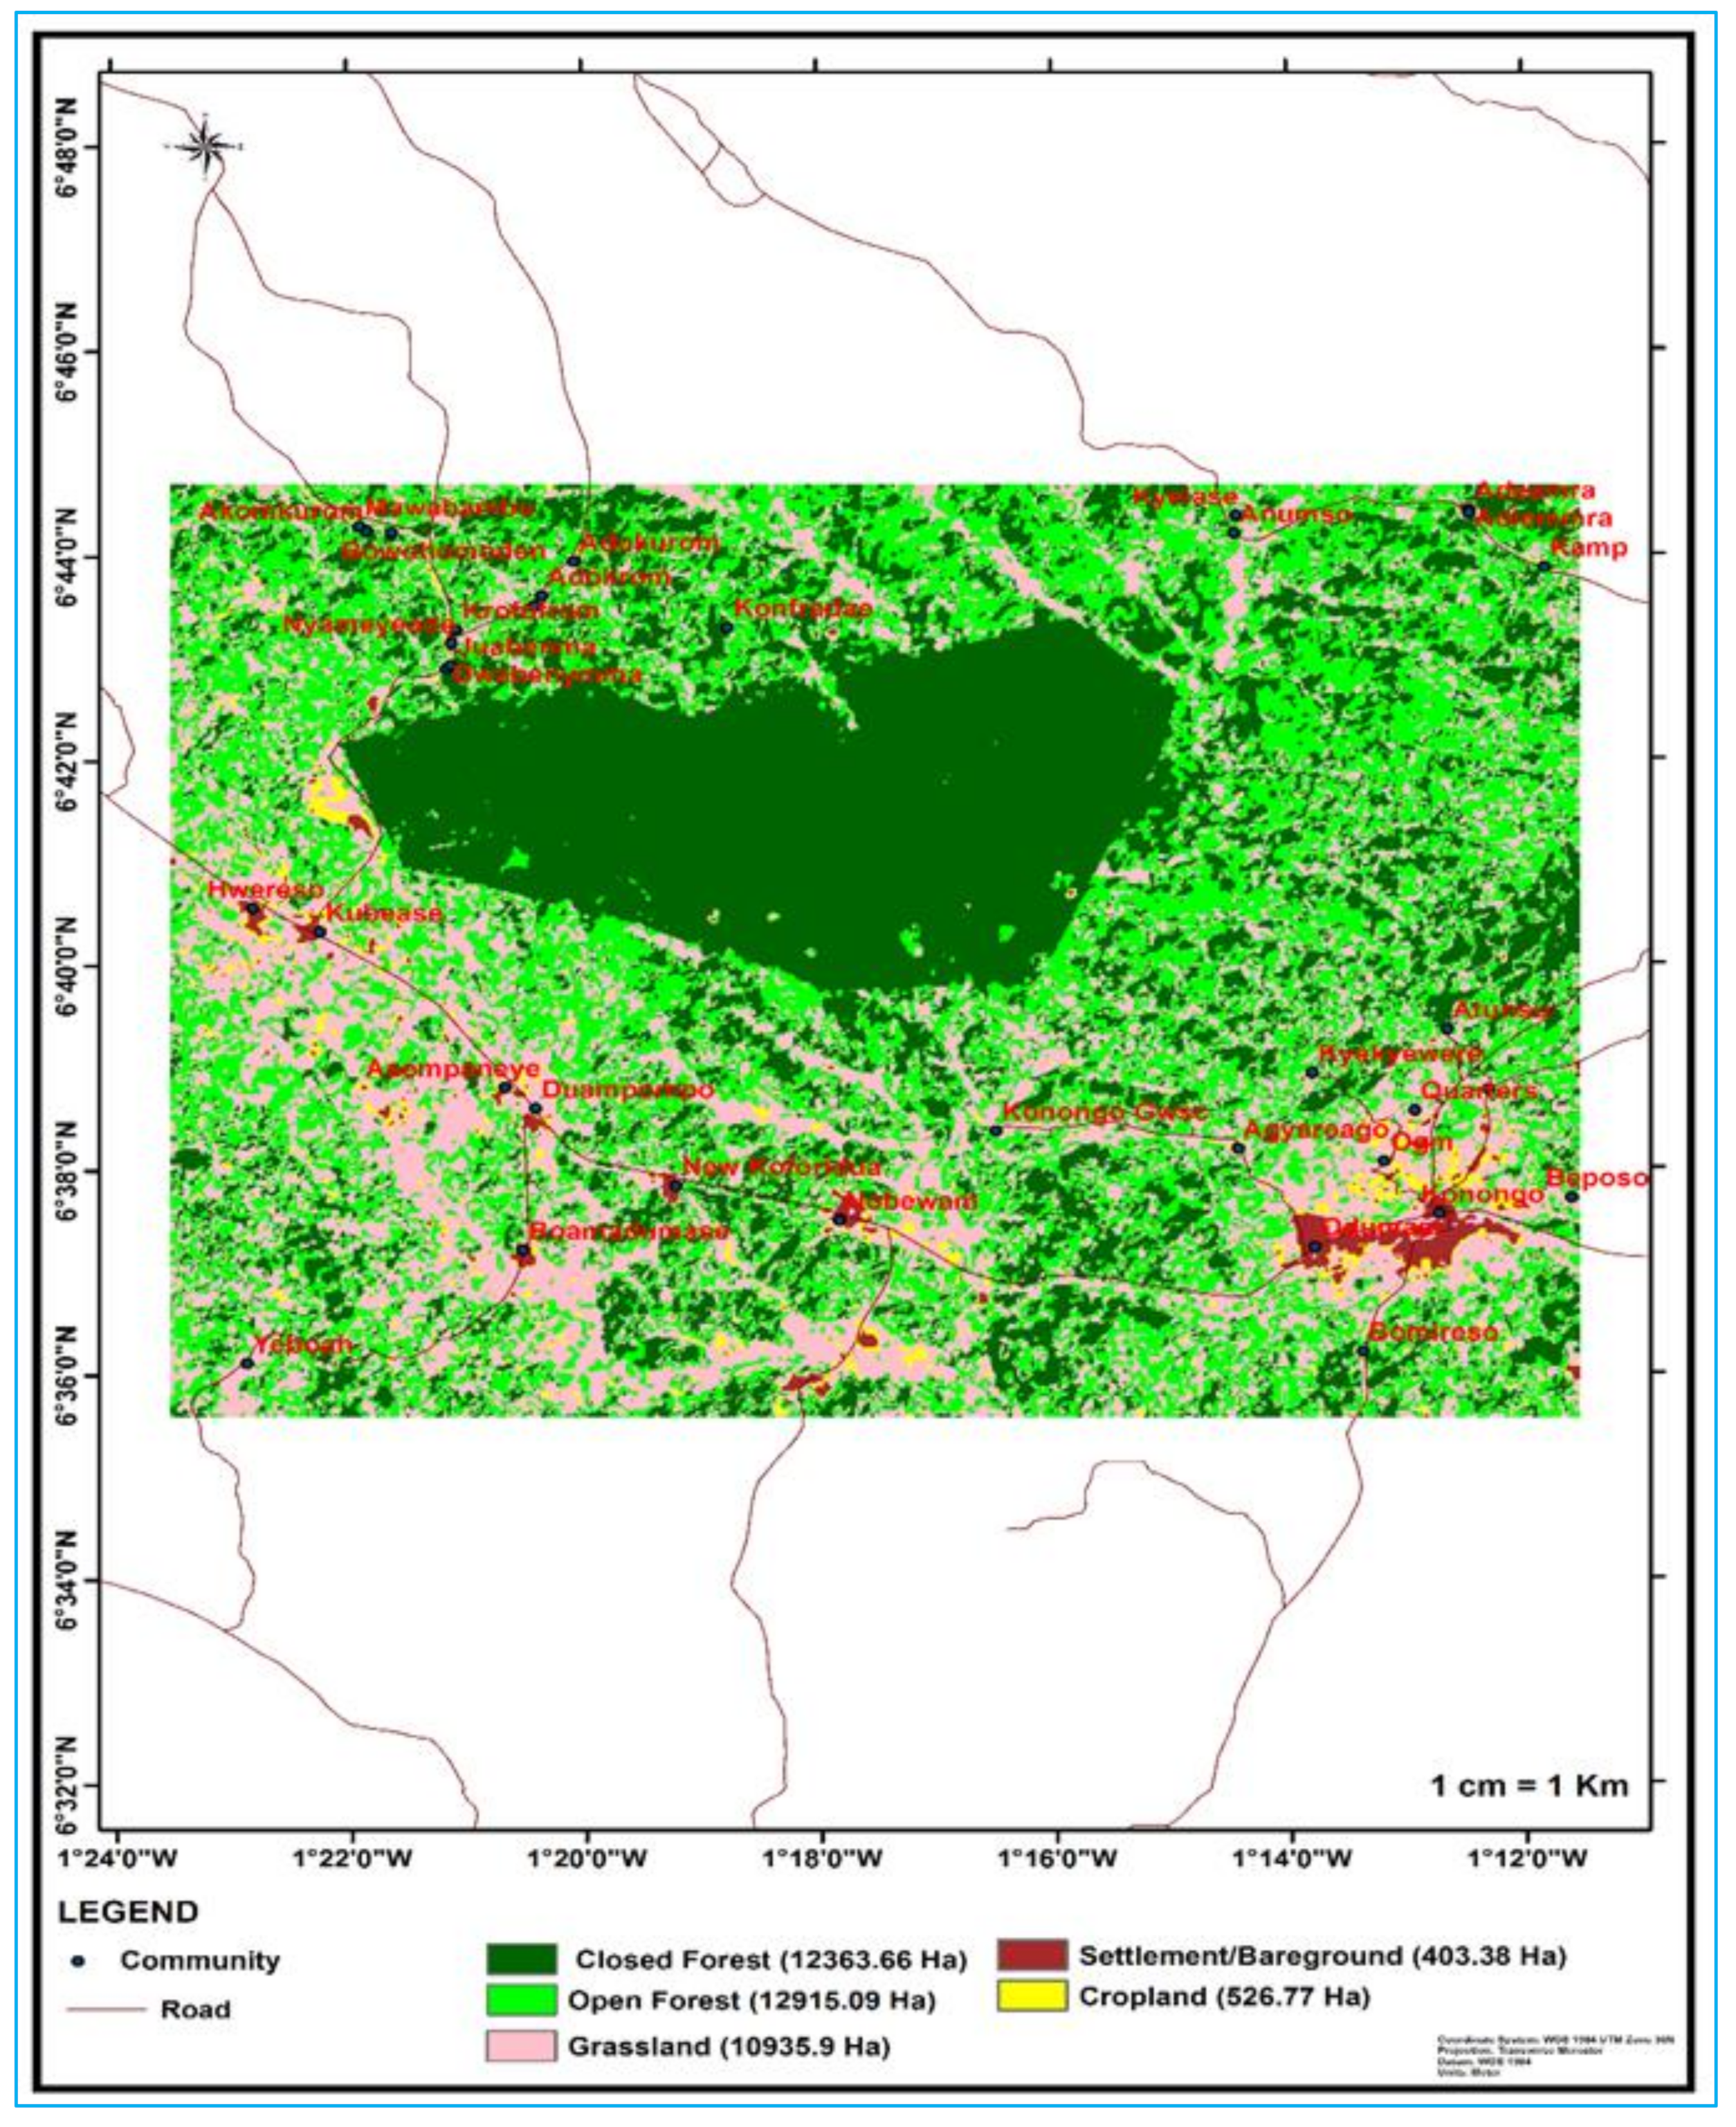
3.5. Description of Landsat Images from 1986, 2003, 2010 and 2014

Settlement/bare ground in 1986 occupied the smallest class, and farming activities were limited since crop land occupied 1.2% of the total classes. The northeastern part of the reserve and surrounding communities were mostly made up of closed forest. However, the southeastern part was made up basically of grassland. Open forest recorded the second highest composition, occupying 31.2% of the total land size of the reserve, as seen in the Figure 4.
Figure 5 shows the Landsat image for 2003. Grassland increased to 29.4% with a massive reduction in the closed forest cover to 33.3%. The northeastern part of the reserve was gradually turned into open forest. The northern part was still made up of closed forest. Although crop land shot up marginally, farming was still practiced on a small scale by indigenes of the rural communities.
Figure 6 shows the Landsat image for 2010. Crop land recorded the lowest fraction of 2.3%. The southern part constituted the highest portion of grassland. Settlement/bare ground rapidly continued to increase with time to reach 2.6% in 2010.
Figure 7 shows the Landsat image for 2014. Settlement/bare ground gradually shot up to 3.6%. Crop land also increased marginally by 0.3%. But there was a massive reduction of the closed forest to 14.4%, and grassland continued to increase.

3.6. LULC Changes 1986–2014

Comparison of the LULC changes between 1986 and 2003 showed an increase in open forest and a drastic increase in grassland with a change of 3.6% and 12.4% respectively. The closed forest cover however decreased dramatically by 16.6%. Settlement/bare ground and crop land went up by 0.4% and 0.2% respectively, as shown in Table 7. From 2003 to 2010, the results show that grassland still increased by a percentage of 11.1%.
Open forest also increased marginally by 2.0%. However, closed forest decreased by 15.6% but settlement/bare ground and crop land increased marginally by 1.5% and 0.9% respectively. Considering 2010–2014, grassland, settlement/bare ground and crop land still increased by a percentage of 2.1%, 1.0% and 0.3% respectively. However, closed forest decreased by 3.3%, while open forest did not change significantly, with a 0.02% increase over the period of consideration.

3.7. Land Use and Distribution Cover

Table 8 presents the land use and the distribution cover for the study years as obtained from the maps. Closed forest recorded the highest percentage of 49.9% whilst settlement/bare ground recorded the least (0.7%) in 1986. In 2003, open forest recorded the highest percentage of 34.8%, whilst settlement/bare ground recorded the lowest of 1.1%. Grassland recorded the highest percentage of 40.5% whilst crop land recorded the least (2.3%) in 2010. In 2010, grassland recorded the highest percentage of 42.6% whilst crop land recorded the least of 2.6%.

3.8. Accuracy Assessment

The users’ accuracy for closed forest was 93.3% as against the producers’ accuracy of 100.0% (Table 9). This was followed by open forest which had users’ accuracy of 80.0% as against its producers’ accuracy of 88.9%. On the other hand, grassland had producers’ accuracy of 74.2% while the users’ accuracy was 76.7%. A similar trend could be said of crop land which had users’ accuracy of 80.0% as against the producers’ accuracy of 61.5%. The overall kappa statistic was 0.770. Kappa statistics measure the agreement between the classified image and the reference data or training samples. The highest possible value is 1. Since the overall kappa index and the individual indices were close to 1, it means there was a high correlation between the classified image and the reference data.

3.9. Perceived Factors Driving LULC Changes in the Bobiri Forest Reserve

The study also sought to determine the perceived factors driving land cover changes in the Bobiri forest reserve. Descriptive statistics of the results are summarized in Table 10. Almost half of the respondents (n = 193; 48.3%) reported logging as the key factor driving LULC changes in the forest reserve. This was followed by population growth (n = 89; 22.3%). Just a few of the respondents (n = 7; 1.8%) reported infrastructural development as a factor driving LULC changes in the forest reserve.
Furthermore, focus group discussion results showed that households within the fringe communities of the forest reserve were of the view that illegal farming, which was not captured in the household survey questions, as well as logging were the two significant factors driving land use changes. Similarly, they pointed out that urbanization through settlement was driving the land use or cover changes. These were consistent with the results obtained from the household survey. Some of the focus group participants reported these:
“Most of the indigenes cut down trees for the production of charcoal and firewood, and also the trees provide us with construction materials which we sell to generate income for ourselves and families, and I think it could be a crucial factor for LULC changes.”
(Focus group participant, Kubease, April, 2017).
“Some of the farmers engage in shifting cultivation and the moment the new forested lands they are cultivating on get engulfed by weeds, then they move to clear more forests which in my opinion could be a cause of LULC.”
(Focus group participant, Konfradae, May, 2017).
“Because our population is higher now as compared to the past, people have moved to settle here and as a result have cut down trees and have built houses on the land and in my opinion this could be a driving factor of LULC.”
(Focus group participant, Dwabenymma, May, 2017).
Results from key informant interviews also suggested that reduced rainfall amounts together with increasing temperatures in the study area could be implicated in the increasing conversion of undisturbed forest into grassland and other land cover types.
“In my opinion, I think the decreased amounts of rainfall and the increasing temperatures have caused some of the trees to die and this could be the reason for the conversion of the closed forest to other land cover types such as grassland.”
(Key informant, Krofofrom, April, 2017).
“Because the rains are inconsistent as in the past where there were increased amounts of rainfall, most of the plants are getting destroyed because of the increasing temperatures and this in my opinion could be the major reason for the conversion of the undisturbed forest into grassland and other land cover types.”
(Key informant, Kubease, April, 2017).
“The heat we experience these days does not favour the growth of many of the trees in the forest reserve. For instance, the drought we experienced in this country from 1981–1983 caused numerous trees to die because of the absence of the rains for almost two years. Personally, I believe that is the reason for the decrease in the closed forest.”
(Key informant, Dwabenymma, April, 2017).

4. Discussion

4.1. Perception of Fringe Communities on Rainfall and Temperature Changes

Most of the respondents reported that there is delay of the start of the rainfall period compared to previously. In addition, the majority of the respondents perceived an increasing temperature coupled with an increasing rainfall variability in the study communities. The findings are similar to that of Antwi-Agyei et al. [43] and Owusu and Waylen [44], suggesting that farming households in Ghana perceived increased temperature patterns, erratic rainfall and delay in the onset of the rains. The respondents’ perception on increased temperature and erratic rainfall was consistent with the temperature and rainfall data analyzed (Figure 2 and Figure 3).
Moreover, a vast majority of the respondents perceived overlogging as the major cause of climate variability in the communities. Some respondents also perceived other causes, such as bushfires, natural occurrences, punishment by God and sign of the end of the world. These findings are in line with that of Codjoe et al. [45], who reported that the majority of the respondents in six districts in Ghana perceived the causes of climate change as deforestation, indiscriminate setting of fire to bushes before farming, God’s plan to signify the end of time, farming activities and illegal mining.
Furthermore, the communities depend on crop production, livestock rearing, forest resources, fuel wood and NTFPs as their sources of livelihoods. Most of the respondents reported that the quantity of NTFPs such as mushrooms and snails which served as food for them have all reduced as a result of the changing climate. Most of the respondents also admitted that rainfall variability and the delays in its onset have affected the productivity of their crops through diminishing crop yields and reduced production. This poses threats to food security and livelihoods in the communities. This finding was confirmed by Boon and Ahenkan [46] who reported that, in some selected communities surrounding the Sui forest reserve in Sefwi Wiawso district, Ghana, rainfall variability and delayed rainfall onset had direct impacts on the livelihoods of the indigenous communities. Given that climate variability is impacting the households in the fringe communities surrounding Bobiri forest reserve, this suggests low levels of preparedness among the fringe communities for future climate related hazards. Thus, a rise in temperature, rainfall variability and lengthened dry spell conditions are anticipated to stretch Bobiri forest reserve and its fringe communities. This could add extra burden on weak institutional capacity, extreme poverty, infections and poverty-stricken infrastructure as predicted by Antwi-Agyei [47]. Enhancing the adaptive capacity of the fringe communities is vital in order to reduce their vulnerabilities to the consequences of climate variability.

4.2. Extent of Rainfall and Temperature Changes in the Study Communities

Climate data analysis showed a noticeable increase in temperature and a corresponding erratic change in rainfall. This result compares favorably with that of the United Nations Development Programme (UNDP) [48], suggesting that climate change is manifested in Ghana through rising temperatures and increasing variability of rainfall. The lowest annual mean rainfall recorded in the year 1982 explains the reason for severe famine in the whole country from 1982 to 1983 [49]. This information therefore shows excessive vulnerability amongst forest-fringe communities in Ghana. Climate variability is anticipated to disproportionately affect forest-fringe communities by further exacerbating the risks that these communities encounter [12]. Other studies have also shown that even moderate increases in temperatures will have undesirable impacts on forest resources in Ghana [12,46,50].

4.3. Extent of LULC Changes in the Bobiri Forest Reserve over the Study Period

The classified map of 1986, 2003, 2010 and 2014 shows that the closed forest has been depleted over the years (1986–2014). On the other hand, there was an appreciable increase in grassland and a marginal increase in open forest, settlements and crop lands. These findings are similar to those of Antwi-Agyei et al. [14], who observed significant conversion of crop lands to grasslands in other parts of Ghana. Tekle and Hedlund [51] reported increases in the size of settlements at the expense of the forests in the Kalu district of Ethiopia. Mark and Kudakwashe [52] noticed a decrease in forest and a crop land increase in a study conducted in Shurugwi district in the Midlands province of Zimbabwe. The transformation of vital parts of the closed-canopy forest into open-canopy and non-forest land cover in the forest reserve might be as a result of several factors including decrease or insufficiency in the conservation level of the forests and the rapid changes in socioeconomic, demographic and institutional changes [18,53,54].
The transformation of forest covers into other land cover classes has a great impact on the environment. Trees serve as carbon sinks and therefore clearing of trees means reducing the carbon sinks. In the course of the last few hundred years, deforestation and other land use changes in numerous nations have contributed significantly to climatic carbon dioxide increments [55]. Most of the carbon dioxide emission from burning of wood to serve as fuel for heating and cooking purposes are presently happening in the tropics. LULC changes are accountable for fifteen to twenty percent of present CO2 emissions, which thus elevates the earth’s surface average global temperature thereby causing global warming [56]. This poses a serious threat to biodiversity thereby affecting natural habitats and also causing the erratic changes in rainfall resulting in floods and droughts [57,58].

4.4. Perceived Factors Driving LULC Changes in the Bobiri Forest Reserve, Ghana

The respondents perceived the key factors driving LULC changes in the reserve as logging, population growth, deforestation, overgrazing, urbanization and infrastructural development. These findings are consistent with other studies in Ghana (including Antwi-Agyei et al. [14], Addo-Fordjour and Ankomah [18], Kleemann et al. [59], Appiah et al. [60], Attua and Fisher [61]). Logging is a crucial anthropogenic act which substantially promotes the loss of forest cover in Ghana [18,62]. Asamoah et al. [63] reported that the impacts of chainsaw logging activity on biodiversity and forest cover can be exceptionally destructive compared to conventional logging. For this reason, in 1998, chainsaw logging was prohibited in Ghana as a means of safeguarding the forests [64]. Chainsaw logging, which is an illegal activity reported by the respondents, questions the efficacy of the forestry commission and the fringe communities.
The rise in population also has crucial effects for the transformation of forest covers to other land cover classes [65,66] particularly in SSA [67]. This is because, as the population increases, the requirement for agricultural land and fuel wood also increases [68,69]. Another factor perceived by the respondents was deforestation. Farmland expansion is predominantly seen as the principal cause making up 60% of overall tropical deforestation activities [70]. Slash and burn agriculture was also reported as a vital agent of deforestation [70]. In Ghana, the majority of forest lands have been cleared for timber exploitation and cocoa cultivation to increase the economic sufficiency of the country [12]. This poses serious implications for the social and biotic integrity of the country’s forests [12].
Overgrazing was also identified by most of the respondents as a factor. Peeling bark on trees in order to supply forage or food for livestock could as well be a challenge in forested areas but it is not the crucial driver of tree felling. Overgrazing is exacerbated by the sociological phenomena referred to as the “tragedy of the commons” [71]. The rural people dispense forestlands yet rear livestock for themselves and try to enhance them by rearing as many as they can. Thus, this results in more livestock than the land can actually bear. The animals get rid of the vegetation and the winds complete the task by gusting away the top soil which could eventually transform grasslands into bare ground.
Some of the respondents also identified urbanization and infrastructural development as the cause of the LULC change in the study area. Developing villages and towns around the forest reserve need land to set up the infrastructure essential to sustain the increasing population and this is normally done by clear-cutting [72,73,74]. The construction of roads unfastens up the land to development and brings many individuals to the forest frontier. These settlers usually establish a colony in the forest by utilizing new roads or logging trails to access the forest for subsistence land. The growth of infrastructural projects is of global worry due to the fact that tropical forest clearing accounts for 20% of anthropogenic carbon emissions by eliminating globally important carbon sinks [75].

4.5. Perceived Role of Climate Variability in Driving Land Cover Changes in Bobiri Forest Reserve

Key informants and other respondents were of the view that reduced rainfall amounts and increasing temperatures could also be implicated in the increasing conversion of undisturbed forest into grassland and other land cover types in the forest reserve. This result is supported by Alkama and Cescatti [76] and Dale et al. [77] suggesting that, the main ways that changes in climate can alter LULC changes are due to variable rainfall patterns, increasingly incessant and severe weather events as well as higher mean yearly temperatures. This is because, the regions of numerous species of plant rely to a great extent upon rainfall patterns and temperature. Therefore, as climate influences these patterns, numerous kinds of vegetation and trees are compelled to move to higher elevations and scopes [78]. While higher unevenness in patterns of rainfall can reduce plant development generally, temperature rises can lengthen the growing season, potentially making way for more than one cropping cycle during the same season [79].
In addition, there is increased tree mortality worldwide as a result of droughts and heat in the forests [6]. The key informants confirmed this by reporting that most of the trees in Bobiri forest reserve died during the 1981–1983 drought in Ghana and they perceived this as one of many causes of land cover changes in the forest reserve.
Moreover, variability in precipitation and temperature could as well enhance the risk of outbreaks of insect infestation, harmful to other plants and the forests [80]. Severe weather events could also give rise to vital amounts of destruction to vegetation and other trees from flooding, storm surges, and high winds [81]. Storms and floods can also change the flows of water thereby damaging the general well-being of the forest [82].

5. Conclusions and Recommendations

This study investigated the extent to which climate variability drives livelihoods and land cover changes of fringe communities of Bobiri forest reserve, Ghana. Findings showed that there has been a significant conversion of the closed forest to open forest and non-forest land cover types over the 28-year period (1986–2014), with an overall kappa statistic of 0.770. These changes have predominantly been driven by logging, population growth, deforestation, overgrazing, urbanization and infrastructural development. Trend analysis of rainfall and temperature data suggested an erratic rainfall and an increasing temperature in the fringe communities, which were consistent with the perception of the respondents. Key informant interviews indicated that increased land cover changes in the Bobiri forest reserve could partly be attributed to erratic rainfall patterns, increasing temperatures and other severe weather events.
Based on the findings, the study recommends the need for sustainable management of the forest reserve and this calls for the termination of illegal acts including chainsaw logging and also administering tough penalties for the culprits involved in this illegal activity. The rural communities ought to be encouraged to participate in environmental decisions since it is vital to improve their livelihoods and ecosystem management services.

Author Contributions

Conceptualization, F.B.-A. and P.A.-A.; methodology, F.B.-A.; validation, F.B.-A.; formal analysis, F.B.-A.; writing—original draft preparation, F.B.-A.; writing—review and editing, P.A.-A. and E.N.; visualization, F.B.-A.; supervision, P.A.-A. and E.N. All authors have read and agreed to the published version of the manuscript.

Funding

This research received no external funding.

Acknowledgments

The authors are thankful to Stephen Adu-Bredu from the Council for Scientific and Industrial Research, Kumasi for providing rainfall and temperature data and Prince Boama from the Forestry Commission of Ghana, Kumasi for providing Landsat images. The authors are also grateful to the four communities that took part in the study. The authors would like to acknowledge the support of the Global Challenges Research Fund (GCRF) African SWIFT Project.

Conflicts of Interest

The authors declare no conflict of interest.

Appendix A

Table A1. Socioeconomic characteristics of the study respondents.
VariablesGender
Males
(n = 143)
Females
(n = 257)
Total
(n = 400)
Age (years)
Below 208 (5.6)20 (7.8)28 (7.0)
21–4092 (64.3)125 (48.6)217 (54.3)
41–6020 (14.0)68 (26.5)88 (22.0)
>6023 (16.1)44 (17.1)67 (16.8)
Education
No formal education32 (22.4)25 (9.7)57 (14.3)
Basic61 (42.6)203 (79.0)264 (66.0)
Secondary28 (19.6)15 (5.8)43 (10.7)
Tertiary22 (15.4)14 (5.5)36 (9.0)
Household size
1 to 5 Individuals101 (70.6)125 (48.6)226 (56.5)
6 to 10 Individuals38 (26.6)100 (38.9)138 (34.5)
11 to 15 Individuals4 (2.8)32 (12.5)36 (9.0)
Length of farming experience (in years)
<515 (10.5)38 (14.8)53 (13.3)
6–1067 (46.9)89 (34.6)156 (39.0)
11–2033 (23.1)77 (30.0)110 (27.5)
>2028 (19.5)53 (20.6)81 (20.3)
Numbers in parentheses are percentages and numbers without parentheses indicate respondent counts.

References

  1. Niang, I.; Ruppel, O.C.; Abdrabo, M.A.; Essel, A.; Lennard, C.; Padgham, J.; Urquhart, P.A. Climate Change 2014: Impacts, Adaptation and Vulnerability—Contributions of the Working Group II to the Fifth Assessment Report of the Intergovernmental Panel on Climate Change; Cambridge University Press: Cambridge, UK, 2014; pp. 1199–1265. [Google Scholar] [CrossRef]
  2. Intergovernmental Panel on Climate Change. Synthesis Report Summary Chapter for Policymakers; IPCC: Genevavgbcf, Switzerland, 2014. [Google Scholar]
  3. Keenan, R.J. Climate change impacts and adaptation in forest management: A review. Ann. For. Sci. 2015, 72, 145–167. [Google Scholar] [CrossRef] [Green Version]
  4. Lucier, A.; Ayres, M.; Karnosky, D.; Thompson, I.; Loehle, C.; Percy, K.; Sohngen, B. Forest responses and vulnerabilities to recent climate change. IUFRO World Ser. 2009, 22, 29–52. [Google Scholar]
  5. Lenoir, J.; Gégout, J.C.; Dupouey, J.L.; Bert, D.; Svenning, J.C. Forest plant community changes during 1989–2007 in response to climate warming in the Jura Mountains (France and Switzerland). J. Veg. Sci. 2010, 21, 949–964. [Google Scholar] [CrossRef]
  6. Allen, C.D.; Macalady, A.K.; Chenchouni, H.; Bachelet, D.; McDowell, N.; Vennetier, M.; Kitzberger, T.; Rigling, A.; Breshears, D.D.; Hogg, E.H.; et al. A global overview of drought and heat-induced tree mortality reveals emerging climate change risks for forests. For. Ecol. Manag. 2010, 259, 660–684. [Google Scholar] [CrossRef] [Green Version]
  7. Akudugu, M.A.; Dittoh, S.; Mahama, E.S. The implications of climate change on food security and rural livelihoods: Experiences from Northern Ghana. J. Environ. Earth Sci. 2012, 2, 21–29. [Google Scholar]
  8. Derbile, E.K. Reducing vulnerability of rain-fed agriculture to drought through indigenous knowledge systems in north-eastern Ghana. Int. J. Clim. Chang. Strateg. Manag. 2013, 5, 71–94. [Google Scholar] [CrossRef]
  9. Yaro, J.A. Building Resilience and Reducing Vulnerability to Climate Change: Implications for Food Security in Ghana; Friedrich-Ebert-Stiftung, Ghana Office: Accra, Ghana, 2013. [Google Scholar]
  10. Kofi, A.F.; Joyce, A.; Rose, A.D.; Mensah, A.K.; Samuel, A.; Agyei, B.E.; Nyarko, O.A.; Minu, P. The Potential and Constraints of Agroforestry in Forest Fringe Communities of the Asunafo District-Ghana; Friedrich-Ebert-Stiftung, Ghana Office: Accra, Ghana, 2003. [Google Scholar]
  11. Somarriba, E. Revisiting the past: An essay on agroforestry definition. Agrofor. Syst. 1992, 3, 233–240. [Google Scholar] [CrossRef]
  12. Amisah, S.; Gyampoh, A.B.; Sarfo-Mensah, P.; Quagrainie, K.K. Livelihood trends in response to climate change in forest fringe communities of the Offin Basin in Ghana. J. Appl. Sci. Environ. Manag. 2009, 13, 13. [Google Scholar] [CrossRef] [Green Version]
  13. Mckeown, J.P.; Gyakye, J.K. Promoting Legal Livelihoods in Ghana; Tropenbos International: Wageningen, The Netherlands, 2015. [Google Scholar]
  14. Antwi-Agyei, P.; Kpenekuu, F.; Hogarh, J.N.; Obiri-Danso, K.; Abaidoo, R.C.; Jeppesen, E.; Andersen, M.N. Land use and land cover changes in the owabi reservoir catchment, Ghana: Implications for livelihoods and management. Geosciences 2019, 9, 286. [Google Scholar] [CrossRef] [Green Version]
  15. Boakye, E.; Odai, S.N.; Adjei, K.A.; Annor, F.O. Landsat images for assessment of the impact of land use and land cover changes on the Barekese catchment in Ghana. Eur. J. Sci. Res. 2008, 22, 269–278. [Google Scholar]
  16. Damnyag, L.; Saastamoinen, O.; Blay, D.; Dwomoh, F.K.; Anglaaere, L.C.; Pappinen, A. Sustaining protected areas: Identifying and controlling deforestation and forest degradation drivers in the Ankasa Conservation Area, Ghana. Biol. Conserv. 2013, 165, 86–94. [Google Scholar] [CrossRef]
  17. Forestry Research Institute of Ghana (FORIG). 2011. Available online: http://csir-forig.org.gh/ (accessed on 4 March 2020).
  18. Addo-Fordjour, P.; Ankomah, F. Patterns and drivers of forest land cover changes in tropical semi-deciduous forests in Ghana. J. Land Use Sci. 2017, 12, 71–86. [Google Scholar] [CrossRef]
  19. Osei, M.A.; Amekudzi, L.K.; Wemegah, D.D.; Preko, K.; Gyawu, E.S.; Obiri-Danso, K. The impact of climate and land-use changes on the hydrological processes of Owabi catchment from SWAT analysis. J. Hydrol. Reg. Stud. 2019, 25, 100620. [Google Scholar] [CrossRef]
  20. Tuffour-Mills, D.; Antwi-Agyei, P.; Addo-Fordjour, P. Trends and drivers of land cover changes in a tropical urban forest in Ghana. Trees For. People 2020, 2, 100040. [Google Scholar] [CrossRef]
  21. Kamwi, J.M.; Chirwa, P.W.; Manda, S.O.; Graz, P.F.; Kätsch, C. Livelihoods, land use and land cover change in the Zambezi Region, Namibia. Popul. Environ. 2015, 37, 207–230. [Google Scholar] [CrossRef] [Green Version]
  22. Djagbletey, G.D. Impact of Selective Logging on Plant Diversity, Natural Recovery and Vegetation Carbon Stock: The Case of Bobiri Forest Reserve. Ph.D. Thesis, Kwame Nkrumah University, Kabwe, Zambia, 2014. [Google Scholar]
  23. Alexander, L.K.; Lopes, B.; Ricchetti-Masterson, K.; Yeatts, K.B. Second Edition of the ERIC Notebook: Cross-sectional Studies. Eric Noteb. 2015, 1–5. Available online: https://sph.unc.edu/files/2015/07/nciph_ERIC8.pdf (accessed on 7 April 2020).
  24. Gocic, M.; Trajkovic, S. Analysis of changes in meteorological variables using Mann-Kendall and Sen’s slope estimator statistical tests in Serbia. Glob. Planet. Chang. 2013, 100, 172–182. [Google Scholar] [CrossRef]
  25. Da Silva, R.M.; Santos, C.A.; Moreira, M.; Corte-Real, J.; Silva, V.C.; Medeiros, I.C. Rainfall and river flow trends using Mann–Kendall and Sen’s slope estimator statistical tests in the Cobres River basin. Nat. Hazards 2015, 77, 1205–1221. [Google Scholar] [CrossRef]
  26. Hamed, K.H.; Rao, A.R. A modified Mann-Kendall trend test for autocorrelated data. J. Hydrol. 1998, 204, 182–196. [Google Scholar] [CrossRef]
  27. Tabari, H.; Somee, B.S.; Zadeh, M.R. Testing for long-term trends in climatic variables in Iran. Atmos. Res. 2011, 100, 132–140. [Google Scholar] [CrossRef]
  28. Mondal, A.; Kundu, S.; Mukhopadhyay, A. Rainfall trend analysis by Mann-Kendall test: A case study of north-eastern part of Cuttack district, Orissa. Int. J. Geol. Earth Environ. Sci. 2012, 2, 70–78. [Google Scholar]
  29. Yadav, R.; Tripathi, S.K.; Pranuthi, G.; Dubey, S.K. Trend analysis by Mann-Kendall test for precipitation and temperature for thirteen districts of Uttarakhand. J. Agrometeorol. 2014, 16, 164. [Google Scholar]
  30. Gilbert, R.O. Statistical Methods for Environmental Pollution Monitoring; John Wiley & Sons: Hoboken, NJ, USA, 1987. [Google Scholar]
  31. Siraj, K.T.; Mohammed, A.; Bam, S.; Addisu, S. Long years comparative climate change trend analysis in terms of temperature, coastal Andhra Pradesh, India. Abhinav Natl. Mon. Refereed J. Res. Sci. Technol. 2013, 2. [Google Scholar]
  32. Addisu, S.; Selassie, Y.G.; Fissha, G.; Gedif, B. Time series trend analysis of temperature and rainfall in lake Tana Sub-basin, Ethiopia. Environ. Syst. Res. 2015, 4, 25. [Google Scholar] [CrossRef] [Green Version]
  33. Lillesand, T.; Kiefer, R.W.; Chipman, J. Remote Sensing and Image Interpretation; John Wiley & Sons: Hoboken, NJ, USA, 2015. [Google Scholar]
  34. Singh, A. Review article digital change detection techniques using remotely-sensed data. Int. J. Remote Sens. 1989, 10, 989–1003. [Google Scholar] [CrossRef] [Green Version]
  35. Lu, D.; Mausel, P.; Brondizio, E.; Moran, E. Change detection techniques. Int. J. Remote Sens. 2004, 25, 2365–2401. [Google Scholar] [CrossRef]
  36. Jensen, J.R.; Ramsey, E.W.; Mackey Jr, H.E.; Christensen, E.J.; Sharitz, R.R. Inland wetland change detection using aircraft MSS data. Photogramm. Eng. Remote Sens. 1987, 53, 521–529. [Google Scholar]
  37. Dimyati, M.U.H.; Mizuno, K.; Kobayashi, S.; Kitamura, T. An analysis of land use/cover change in Indonesia. Int. J. Remote Sens. 1996, 17, 931–944. [Google Scholar] [CrossRef]
  38. Ward, D.; Phinn, S.R.; Murray, A.T. Monitoring growth in rapidly urbanizing areas using remotely sensed data. Prof. Geographer. 2000, 52, 371–386. [Google Scholar] [CrossRef]
  39. Raja, R.A.; Anand, V.; Kumar, A.S.; Maithani, S.; Kumar, V.A. Wavelet based post classification change detection technique for urban growth monitoring. J. Indian Soc. Remote Sens. 2013, 41, 35–43. [Google Scholar] [CrossRef]
  40. Fichera, C.R.; Modica, G.; Pollino, M. Land Cover classification and change-detection analysis using multi-temporal remote sensed imagery and landscape metrics. Eur. J. Remote Sens. 2012, 45, 1–18. [Google Scholar] [CrossRef]
  41. Janssen, L.L.; Vanderwel, F.J. Accuracy assessment of satellite derived land-cover data: A review. Photogramm. Eng. Remote Sens. 1994, 60, 419–426. [Google Scholar]
  42. Braun, V.; Clarke, V. Reflecting on reflexive thematic analysis. Qual. Res. Sport Exerc. Health 2019, 11, 589–597. [Google Scholar] [CrossRef]
  43. Antwi-Agyei, P.; Stringer, L.C.; Dougill, A.J. Livelihood adaptations to climate variability: Insights from farming households in Ghana. Reg. Environ. Chang. 2014, 14, 1615–1626. [Google Scholar] [CrossRef]
  44. Owusu, K.; Waylen, P.R. Identification of historic shifts in daily rainfall regime, Wenchi, Ghana. Clim. Chang. 2013, 117, 133–147. [Google Scholar] [CrossRef]
  45. Codjoe, F.N.Y.; Ocansey, C.K.; Boateng, D.O.; Ofori, J. Climate change awareness and coping strategies of cocoa farmers in rural Ghana. J. Biol. Agric. Healthc. 2013, 3, 19–29. [Google Scholar]
  46. Boon, E.; Ahenkan, A. Assessing Climate Change Impacts on Ecosystem Services and Livelihoods in Ghana: Case Study of Communities around Sui Forest Reserve. J. Ecosyst. Ecography 2013, 3, 1–8. [Google Scholar] [CrossRef]
  47. Antwi-Agyei, P. Vulnerability and Adaptation of Ghana’s Food Production Systems and Rural Livelihoods to Climate Variability; University of Leeds: Leeds, UK, 2012. [Google Scholar]
  48. UNDP. National Climate Change Adaptation Strategy. Glob. Environ. Chang. 2013, 5, 1–11. [Google Scholar]
  49. Yorke, C.K.A.; Omotosho, J.B. Rainfall variability in Ghana during 1961-2005. J. Ghana Sci. Assoc. 2010, 12, 125–134. [Google Scholar] [CrossRef]
  50. Dixon, R.K.; Perry, J.A.; Vanderklein, E.L. Vulnerability of forest resources to global climate change: Case study of Cameroon and Ghana. Clim. Res. 1996, 6, 127–133. [Google Scholar] [CrossRef] [Green Version]
  51. Tekle, K.; Hedlund, L. Land cover changes between 1958 and 1986 in Kalu District, southern Wello, Ethiopia. Mt. Res. Dev. 2000, 20, 42–51. [Google Scholar] [CrossRef]
  52. Mark, M.; Kudakwashe, M. Rate of land use/land cover changes in Shurugwi District, Zimbabwe: Drivers for Change. J. Sustain. Dev. Afr. 2010, 12, 107–121. [Google Scholar]
  53. Ankomah, F.; Kyereh, B.; Asante, W.; Ansong, M. Patterns of forest cover change and their association with forest management regimes of forest reserves in the high forest zone of Ghana. J. Land Use Sci. 2019, 14, 242–257. [Google Scholar] [CrossRef]
  54. Kuemmerle, T.; Müller, D.; Griffiths, P.; Rusu, M. Land use change in Southern Romania after the collapse of socialism. Reg. Environ. Chang. 2009, 9, 1. [Google Scholar] [CrossRef]
  55. Baccini, A.; Goetz, S.J.; Walker, W.S.; Laporte, N.T.; Sun, M.; Sullamenashe, D.; Hackler, J.L.; Beck, P.S.A.; Dubayah, R.O.; Friedl, M.A.; et al. Estimated carbon dioxide emissions from tropical deforestation improved by carbon-density maps. Nat. Clim. Chang. 2012, 2, 182–185. [Google Scholar] [CrossRef]
  56. Tubiello, F.N.; Salvatore, M.; Ferrara, A.F.; House, J.; Federici, S.; Rossi, S.; Biancalani, R.; Golec, R.D.C.; Jacobs, H.; Flammini, A.; et al. The Contribution of Agriculture, Forestry and other Land Use activities to Global Warming, 1990–2012. Glob. Chang. Biol. 2015, 21, 2655–2660. [Google Scholar] [CrossRef] [PubMed] [Green Version]
  57. Wardell-Johnson, G.W.; Keppel, G.; Sander, J. Climate change impacts on the terrestrial biodiversity and carbon stocks of Oceania. Pac. Conserv. Biol. 2011, 17, 220–240. [Google Scholar] [CrossRef] [Green Version]
  58. Lema, M.A.; Majule, A.E. Impacts of climate change, variability and adaptation strategies on agriculture in semi-arid areas of Tanzania: The case of Manyoni District in Singida Region, Tanzania. Afr. J. Environ. Sci. Technol. 2009, 3, 206–218. [Google Scholar] [CrossRef]
  59. Kleemann, J.; Baysal, G.; Bulley, H.N.; Fürst, C. Assessing driving forces of land use and land cover change by a mixed-method approach in north-eastern Ghana, West Africa. J. Environ. Manag. 2017, 196, 411–442. [Google Scholar] [CrossRef]
  60. Appiah, D.O.; Bugri, J.T.; Forkuor, E.K.; Boateng, P.K. Determinants of Peri-Urbanization and Land Use Change Patterns in Peri-Urban Ghana. J. Sustain. Dev. 2014, 7, 95. [Google Scholar] [CrossRef] [Green Version]
  61. Attua, E.M.; Fisher, J.B. Historical and future land-cover change in a municipality of Ghana. Earth Interact. 2011, 15, 1–26. [Google Scholar] [CrossRef] [Green Version]
  62. Agyarko, T. FAO Forestry Outlook Study for Africa (FOSA) Country Report: Ghana; FAO: Rome, Italy, 2001; pp. 8–42. [Google Scholar]
  63. Asamoah, K.A.; Duah-Gyamfi, A.; Dabo, J. Ecological impacts of uncontrolled chainsaw milling on natural forests. Ghana J. For. 2011, 27, 12–23. [Google Scholar]
  64. Marfo, E. Chainsaw Milling in Ghana: Context, Drivers and Impacts; Tropenbos International: Wageningen, The Netherlands, 2010. [Google Scholar]
  65. Miheretu, B.A.; Yimer, A.A. Land use/land cover changes and their environmental implications in the Gelana sub-watershed of Northern highlands of Ethiopia. Environ. Syst. Res. 2018, 6, 7. [Google Scholar] [CrossRef] [Green Version]
  66. Wang, W.; Zhang, C.; Allen, J.M.; Li, W.; Boyer, M.A.; Segerson, K.; Silander, J.A. Analysis and prediction of land use changes related to invasive species and major driving forces in the state of Connecticut. Land 2016, 5, 25. [Google Scholar] [CrossRef] [Green Version]
  67. Rudel, T.K. The national determinants of deforestation in sub-Saharan Africa. Philos. Trans. R. Soc. B Biol. Sci. 2013, 368, 20120405. [Google Scholar] [CrossRef] [PubMed] [Green Version]
  68. DeFries, R.S.; Rudel, T.; Uriarte, M.; Hansen, M. Deforestation driven by urban population growth and agricultural trade in the twenty-first century. Nat. Geosci. 2010, 3, 178–181. [Google Scholar] [CrossRef]
  69. Amor, D.; Pfaff, A. Early history of the impact of road investments on deforestation in the Mayan forest. In Working Paper, Nicholas School of the Environment and Sanford School of Public Policy; Duke University: Durham, NC, USA, 2008. [Google Scholar]
  70. Amissah, L.; Kyereh, B.; Agyeman, V.K. Wildfire incidence and management in the forest transition zone of Ghana: Farmers’ perspectives. Ghana J. For. 2010, 26, 61–73. [Google Scholar] [CrossRef] [Green Version]
  71. Hassanally, K. Overgrazing in general practice: The new Tragedy of the Commons. Br. J. Gen. Pract. 2015, 65, 81. [Google Scholar] [CrossRef] [Green Version]
  72. Fu, P.; Weng, Q. A time series analysis of urbanization induced land use and land cover change and its impact on land surface temperature with Landsat imagery. Remote Sens. Environ. 2016, 175, 205–214. [Google Scholar] [CrossRef]
  73. Jenerette, G.D.; Potere, D. Global analysis and simulation of land-use change associated with urbanization. Landsc. Ecol. 2010, 25, 657–670. [Google Scholar] [CrossRef]
  74. Bawa, K.S.; Kress, W.J.; Nadkarni, N.M.; Lele, S.R.P.; Janzen, D.H.; Lugo, A.E.; Ashton, P.S.; Lovejoy, T.E. Tropical ecosystems into the 21st century. Science 2004, 306, 227–228. [Google Scholar] [CrossRef] [Green Version]
  75. Brack, D. Forests and Climate in the Fourteenth Session of the United Nations Forum on Forests; United Nations Forum on Forests: New York, NY, USA, 2019. [Google Scholar]
  76. Alkama, R.; Cescatti, A. Biophysical climate impacts of recent changes in global forest cover. Science 2016, 351, 600–604. [Google Scholar] [CrossRef] [PubMed] [Green Version]
  77. Dale, V.H.; Joyce, L.A.; McNulty, S.; Neilson, R.P.; Ayres, M.P.; Flannigan, M.D.; Hanson, P.J.; Irland, L.C.; Lugo, A.E.; Peterson, C.J.; et al. Climate change and forest disturbances: Climate change can affect forests by altering the frequency, intensity, duration, and timing of fire, drought, introduced species, insect and pathogen outbreaks, hurricanes, windstorms, ice storms, or landslides. BioScience 2001, 51, 723–734. [Google Scholar] [CrossRef] [Green Version]
  78. Vitasse, Y.; François, C.; Delpierre, N.; Dufrêne, E.; Kremer, A.; Chuine, I.; Delzon, S. Assessing the effects of climate change on the phenology of European temperate trees. Agric. For. Meteorol. 2011, 151, 969–980. [Google Scholar] [CrossRef]
  79. Hatfield, J.L.; Boote, K.J.; Kimball, B.A.; Ziska, L.H.; Izaurralde, R.C.; Ort, D.; Thomson, A.M.; Wolfe, D. Climate impacts on agriculture: Implications for crop production. Agron. J. 2011, 103, 351–370. [Google Scholar] [CrossRef] [Green Version]
  80. Sambaraju, K.R.; Carroll, A.L.; Zhu, J.; Stahl, K.; Dan Moore, R.; Aukema, B.H. Climate change could alter the distribution of mountain pine beetle outbreaks in western Canada. Ecography 2012, 35, 211–223. [Google Scholar] [CrossRef]
  81. Brouwers, N.; Matusick, G.; Ruthrof, K.; Lyons, T.; Hardy, G. Landscape-scale assessment of tree crown dieback following extreme drought and heat in a Mediterranean eucalypt forest ecosystem. Landsc. Ecol. 2013, 28, 69–80. [Google Scholar] [CrossRef] [Green Version]
  82. Hümann, M.; Schüler, G.; Müller, C.; Schneider, R.; Johst, M.; Caspari, T. Identification of runoff processes–The impact of different forest types and soil properties on runoff formation and floods. J. Hydrol. 2011, 409, 637–649. [Google Scholar] [CrossRef]
Figure 1. Map of Bobiri forest reserve showing the study communities.
Forests 12 00278 g001
Figure 2. Mean annual rainfall pattern in study area, 1960–2016. Source: Data obtained from Council for Scientific and Industrial Research.
Forests 12 00278 g002
Figure 3. Mean annual temperature of study area, 1960–2016. Source: Data obtained from Council for Scientific and Industrial Research.
Forests 12 00278 g003
Figure 4. Landsat image of Bobiri forest reserve in 1986.
Forests 12 00278 g004
Figure 5. Landsat image of Bobiri forest reserve in 2003.
Forests 12 00278 g005
Figure 6. Landsat image of Bobiri forest reserve in 2010.
Forests 12 00278 g006
Figure 7. Landsat image of Bobiri forest reserve in 2014.
Forests 12 00278 g007
Table 1. Community, distance from the forest and number of questionnaires administered.
CommunityDistance from the Forest (km)Main Livelihood ActivitiesDominant Tribal GroupsNumber of Questionnaires Administered
Konfradae0.86Food crop and tree crop farmingAshanti100
Dwabenymma0.90Food crop farmingAshanti100
Krofofrom1.53Food crop farming and poultry/livestock farmingAshanti100
Kubease1.82Food crop and tree crop farmingAshanti, Kwahu and Akwapim100
Total 400
Table 2. Details of Landsat images and the various bands.
Landsat ImageSensorNumber of BandsDate
Landsat 5Thematic Mapper (TM)71986-01-11
Landsat 7Enhance Thematic Mapper Plus (ETM+)92003-02-19
Landsat 7Enhance Thematic Mapper Plus (ETM+)92010-02-06
Landsat 8Operational Land Imager (OLI)112014-12-26
Table 3. Land use and cover classification scheme.
Land useDescription
Closed forestAreas with timber species and broadleaf hardwoods
Open forestAreas with broadleaf hardwoods
Crop landPerennial crops such as oil palm and annuals such as maize
GrasslandAreas with shrubs, grasses and some cases, a few trees
Settlement/bare groundBuilding, cleared areas and rocky surfaces
Table 4. Main livelihood activities of the study communities.
Livelihood ActivityGenderTotal (n = 400)
Males (n = 143)Females (n = 257)
Crop production85 (59.4)113 (44.0)198 (49.5)
Livestock rearing24 (16.8)33 (12.8)57 (14.2)
Non-timber forest products18 (12.6)79 (30.7)97 (24.3)
Charcoal production5 (3.5)25 (9.8)30 (7.5)
Petty trading11 (7.7)7 (2.7)18 (4.5)
Numbers in parentheses are percentages and numbers without parentheses are respondent counts.
Table 5. Perception of respondents on rainfall and temperature changes.
VariablesGenderTotal (n = 400)
Males (n = 143)Females (n = 257)
(a) Rainfall
Changes in onset111 (77.6)179 (69.6)290 (72.5)
No changes in onset32 (22.4)78 (30.4)110 (27.5)
Increasing rainfall44 (30.8)58 (22.6)102 (25.5)
Decreasing rainfall99 (69.2)199 (77.4)298(74.5)
(b) Temperature
Increasing temperature129 (90.2)237 (92.2)366 (91.5)
Decreasing temperature14 (9.8)20 (7.8)34 (8.5)
Numbers in parentheses are percentages and numbers without parentheses are respondent counts.
Table 6. The respondents’ perception of the causes of climate variability.
Perceived Causes of Climate VariabilityGender
Males
(n = 143)
Females
(n = 257)
Total
(n = 400)
Overlogging75 (52.4)182 (70.8)257 (64.3)
Bush fires50 (35.0)42 (16.3)92 (23.0)
Punishment by God5 (3.5)12 (4.7)17 (4.3)
Natural occurrence10 (7.0)14 (5.5)24 (6.0)
Sign of the end of the world3 (2.1)7 (2.7)10 (2.5)
Numbers in parentheses are percentages and numbers without parentheses are respondent counts.
Table 7. Land use and land cover (LULC) change in the Bobiri forest reserve from 1986 to 2014.
LULC Area (ha)
1986–20032003–20102010–2014
Closed forest−6168.06 (−16.6) decrease−5772.42 (−15.6) decrease−1260 (−3.3) decrease
Open forest1343.4 (3.6) increase764 (2.0) increase1.71 (0.02) increase
Grassland4604 (12.4) increase4106.8 (11.1) increase777.4 (2.1) increase
Settlement/ bare ground147.6 (0.4) increase561.9 (1.5) increase381.6 (1.0) increase
Crop land73 (0.2) increase339.6 (0.9) increase105.3 (0.3) increase
Numbers in parentheses are percentages and those not in parentheses are the area (ha) values.
Table 8. Land use and distribution cover of Bobiri forest reserve for 1986, 2003, 2010 and 2014.
Land Use or Land Cover CategoriesYears
1986200320102014
Area (ha)Area (ha)Area (ha)Area (ha)
Closed forest18531.7 (49.9)12363.7 (33.3)6591.2 (17.7)5331.2 (14.4)
Open forest11571.7 (31.2)12915.1 (34.8)13679.1 (36.8)13675 (36.8)
Grassland6331.9 (17.0)10935.9 (29.4)15042.7 (40.5)15820.1 (42.6)
Settlement/bare ground255.8 (0.7)403.4 (1.1)965.3 (2.6)1346.9 (3.6)
Crop land453.8 (1.2)526.8 (1.4)866.6 (2.3)971.7 (2.6)
Total37144.9 (100.0)37144.9 (100.0)37144.9 (100.0)37144.9 (100.0)
Figures in parentheses indicate percentages and figures not in parentheses are area (ha) values.
Table 9. Accuracy assessment of the various land use types in the Bobiri forest reserve, Ghana.
Class NameReference TotalsClassified TotalsNumber CorrectProducers Accuracy (%)Users Accuracy (%)Kappa
Closed forest141514100.093.30.9225
Open forest27302488.980.00.7260
Grassland31302374.276.70.6618
Settlement/bare ground14151285.780.00.7674
Crop land1310861.580.00.7701
Totals9910081
Overall classification accuracy = 82.0%Overall kappa statistics = 0.770
Table 10. Perceived drivers of land cover changes in the Bobiri forest reserve, Ghana.
Perceived Drivers of Land Cover ChangesGender
Males
(n = 143)
Females
(n = 257)
Total
(n = 400)
Logging88 (61.5)105 (40.9)193 (48.3)
Overgrazing5 (3.5)32 (12.5)37 (9.3)
Urbanization2 (1.4)13 (5.1)15 (3.8)
Deforestation15 (10.5)44 (17.1)59 (14.8)
Infrastructural development1 (0.7)6 (2.3)7 (1.8)
Population growth32 (22.4)57 (22.2)89 (22.3)
Numbers in parentheses are percentages and numbers without parentheses are respondent counts.
Publisher’s Note: MDPI stays neutral with regard to jurisdictional claims in published maps and institutional affiliations.

