
Investigation of Feller-Buncher Performance Using Weibull Distribution


Forestry Department, Dereli Vocational School, Giresun University, Giresun 28950, Turkey
Forests 2021, 12(3), 284; https://doi.org/10.3390/f12030284
Submission received: 8 February 2021
/
Revised: 23 February 2021
/
Accepted: 27 February 2021
/
Published: 2 March 2021
(This article belongs to the Section Wood Science and Forest Products)
Abstract
:With the advancement of technology in forestry, the utilization of advanced machines in forest operations has been increasing in the last decades. Due to their high operating costs, it is crucial to select the right machinery, which is mostly done by using productivity analysis. In this study, a productivity estimation model was developed in order to determine the timber volume cut per unit time for a feller-buncher. The Weibull distribution method was used to develop the productivity model. In the study, the model of the theoretical (estimated) volume distributions obtained with the Weibull probability density function was generated. It was found that the c value was 1.96 and the b value was 0.58 (i.e., b is the scale parameter, and c is the shape parameter). The model indicated that the frequency of the volume data had moved away from 0 as the shape parameter of the Weibull distribution increased. Thus, it was revealed that the shape parameter gives preliminary information about the distribution of the volume frequency. The consistency of the measured timber volume with the estimated timber volume strongly indicated that this approach can be effectively used by decision makers as a key tool to predict the productivity of a feller-buncher used in harvesting operations.
1. Introduction
Innovative management strategies will be necessary in managing forest resources, since substantial differences in forest conditions are expected. In the timber extraction stage, mechanized harvesting systems have been widely implemented in many countries with intensive forest activities, largely as an economic response to increased labor costs, rising demands for timber, and changes in timber management [1]. However, obtaining and maintaining highly-mechanized harvesting equipment, such as a feller-buncher, harvester, forwarder, and skidder is a cost-intensive investment. Besides, the productivity of this equipment is expected to vary depending on the presence of significantly contrasting working conditions [2].
In order to plan cost-effective harvesting systems and to make the right equipment selection, the productivity of the highly-mechanized harvesting equipment should be accurately estimated [3]. Productivity analyses on forest harvesting equipment have been conducted in many countries around the world [4,5,6,7,8]. The productivity of forestry machinery is affected by various factors, including stand conditions, stem size (diameter and volume), time and motion, equipment configuration, management objectives, and operator experience. In addition to these factors, site and operation conditions such as species mixture, slope, and prescription affect the productivity of the mechanized equipment [2,9,10,11,12].
In previous studies, the factors that influence the productivity of the harvesting equipment were evaluated using correlation and regression analysis, assuming the sample is distributed normally and variances are equal in different groups [4,5,7,12]. However, for the case where the data are not normally-distributed, the estimation capability of these models may decrease considerably. Non-normal distribution models may be more robust than normal distribution theory in the estimation of machine productivity. There are a number of numerical distributions formulated by statisticians, mathematicians, and engineers to develop mathematical models. Weibull distribution is one of the mostly used distributions due to its versatility and relative simplicity. Besides, Weibull distribution is able to represent all regions of the bathtub curve [13], which makes it more robust than other distributions in reliability and estimation studies.
Though not frequent, there are studies utilizing Weibull distribution for data analysis in the field of forestry. The Weibull distribution method was used to describe the most successful function of diameter distributions considering stand ages, site index, density, and mixture percentage in Scots pine and Oriental beech mixed stands in the Black Sea Region of Turkey [14]. It was reported that the four-parameter Johnson SB function was the most successful function to describe diameter distributions compared to functions including Weibull with two parameters, Weibull with three parameters, Gamma with two parameters, Gamma with three parameters, Beta, Lognormal with two parameters, Lognormal with three parameters, and Normal. Another study aimed to predict the diameter distributions of the forests located in the city of Bursa, in Turkey, by using the three-parameter Weibull function [15]. The results indicated that the Weibull function provided suitable predictions for 305 of a total of 312 sample plots. The Weibull distribution method has been successfully implemented in a number of studies to estimate the performance of the machinery that are used in various sectors, such as road construction, agriculture, and farming equipment [16,17,18]. Although there is a limited number of studies using the Weibull distribution method to model the productivity of forest harvesting equipment [19], the results from the machine-productivity-related studies of various fields revealed that Weibull distribution could be a feasible method to conduct productivity analysis in forest operations.
The technological developments and the increasing demand for wood raw materials has increased the use of mechanization in forestry [7]. However, mechanization may contradict the principles of the sustainable forestry approach if mechanized harvesting systems are inadequately planned and applied in the field [1,12]. Thus, it is important to evaluate the performance of the mechanized equipment, which is usually done through productivity analysis. An accurate prediction of machine productivity can provide decision makers with an opportunity to select the right machines and calibrate the best level of mechanization. Stem size is a significant factor affecting the felling-bunching time of a tree, which then influences the cycle time and the productivity of the feller-buncher [2]. It was also reported by [7] that the productivity of a feller-buncher is lower when cutting small trees, while the rate of productivity increases as tree size increases. This studyaimed to determine the time-tree volume relationship by using the Weibull distribution method. The tree volume data obtained from the feller-buncher activity were used in the analyses. The productivity analysis was performed prior to the estimation of the tree volume data. Thus, the usage and estimation capacity of the Weibull distribution was tested in the study.
2. Materials and Methods
2.1. Study Area and Data Collection
The study area (331 hectares), managed by Çanakkale Forest Enterprise Chief (FEC), is located (40°11′33″ N and 26°34′51″ E) in the west part of Turkey (Figure 1). The altitude range and the average slope were 300–400 m and 15%, respectively. The dominant tree species in the study area is Brutian pine (Pinus brutia).
The data were collected during a clear-cutting operation using a feller-buncher (Westtech Woodcraker C450), a self-propelled machine with a cutting head that is used strictly for cutting, holding, and placing the stems on the ground (Figure 2). The feller-buncher has a cutting diameter of 450 mm, a gripper opening of 1600 mm, and a shear diameter of 800 mm.
In order to evaluate the productivity, the cycle time of the feller-buncher was observed, and the components of the harvesting process were recorded as shown in Table 1. The time spent on each work stage (i.e., moving, felling, and stacking) in a cycle was recorded for each harvested tree. The non-productive time and delays were excluded from the cycle time to estimate productivity based on a productive machine hour.
2.2. Data Analysis
In this study, the capability of the Weibull distribution method in the productivity estimation of a feller-buncher for a given harvesting area was evaluated using volume and total time data. After the verification of the data generated by Weibull distribution, volume and total time estimations were made, and those estimations were compared to the actual data observed in the field studies. The approach proposed here utilizes the natural distribution of the data, making it preferable to classical regressional approaches in simulations of harvesting systems. SPSS 16.0 and the Microsoft Excel program were used in the statistical analyses.
2.2.1. Weibull Distribution Confirmations and the Approach Used in the Study
The Weibull distribution, first introduced by Waloddi Weibull in 1951, is a distribution based on his own name to estimate the life span [20]. Recently, Weibull distribution has been frequently used to express non-normal frequency distributions, e.g., for the estimation of wind energy potential, reliability analysis of construction equipment, and modeling the productivity of forest harvesting machines [17,19,21,22,23]. The probability density function of Weibull distribution is given by Equation (1), where f(x) function is the probability of observing harvesting volume, c is the dimensionless shape parameter, and b is the scale parameter in units of tree volume harvested. The probability (f) and cumulative distribution (F) of the two-parameter Weibull distribution [24], for a set of random variables (x), are:
where x is the random variable, b is the scale parameter, and c is the shape parameter: b, the function of the central tendency of the data, shifts the central tendency of the distribution along the X axis, and c controls the overall shape of the distribution and describes the variation in the data. A smaller c indicates a greater deviation, while a larger c represents a smaller deviation away from the mean [25].
One of the important properties of Weibull distribution in the estimation of harvesting operations is that once estimations are carried out for one level, it is possible to adjust these parameters to different levels, or cumulatively estimate much larger volumes. This approach, used in wind power estimations, for example, assumes that the wind spread is the same at different altitudes. Similarly, it is also possible to estimate harvesting at varying levels once an estimation is made for a known scale. In harvesting studies, it can be assumed that during harvesting, the same conditions apply horizontally, which is mostly true for harvesting a forest area using a clearcutting method. In short, this approach is robust in handling a variety of forest harvesting problems.
2.2.2. Estimation of Weibull Parameters
To use Weibull distributions, shape and scale parameters must first be estimated from the data. There are four frequently used methods to estimate each parameter in Weibull analysis: (1) Graphical method [26], (2) Least squares estimates [27], (3) Maximum likelihood [22], and (4) Moment method [20]. In this study, the graphical method was used as described in [23,26] due to its fast application and practicality.
To estimate the two parameters (b and c) of the Weibull distribution, a graphical approach with least squares regression, as described in Stout et al. [25], was used. This approach is commonly used to estimate Weibull parameters for many different data types (wind speed, annual discharge, wood load, etc.) due to its simplicity and efficiency [21,28,29].
In the graphical approach, a cumulative distribution function is used. After transformation of the volume data to [25],
When ln(x) is plotted against the x axis versus ln{−ln[(1 − F(x)]} as the y axis, a straight line is obtained, where k is the slope of the line, and y-intercept is −kln(b) [30].
After the estimation of both the shape and scale parameters, as described above, the scale parameter was re-estimated using a least squares optimization of the observed and calculated volume data. In this process, the shape parameter, estimated as described above, was kept constant, and scale parameters were changed to obtain the least error.
3. Results and Discussion
The productivity of a clearcutting operation conducted by a feller-buncher in a Brutian pine stand was evaluated using a time study analysis. The descriptive statistics about height, diameter, volume, and total time for each harvested tree are given in Table 2. The median and mean productivity for the harvesting operation were estimated as 48.8 m3/h and 56.3 m3/h, respectively. In a previous study conducted by using a similar feller-buncher, the hourly productivity was reported as 79.73 m3/h in a stand with a relatively larger tree diameter [7].
To estimate the harvesting volume and the total harvesting time, the data collected during the feller-buncher’s operation were analyzed using Weibull distributions. The data obtained from 69 randomly selected felled trees were considered during the analysis, where the total harvesting time was 1624 s. About half of the “total time” (50.73%) was spent on moving, 25.74% on stacking, and 23.53% on the felling stage. In a similar study, it was reported that the moving time of a feller-buncher was the most time-consuming work stage on a moderate slope [31].
Two different approaches can be taken to determine the suitability of the data for the Weibull distribution. The first one is the graphical method, and the second one is the compliance test, which includes the statistical procedure [25]. In this study, the graphical method was applied to determine the suitability of the data. The values of skewness were positive, which indicates that the distribution of the volume parameter across the harvested area was highly right-skewed (SW test = 0.93; p < 0.001) [32]. The data were tested for the suitability of the Weibull distribution, and it was found that the Weibull distribution was appropriate for the estimation procedures (Figure 3).
To graphically show the performance of the Weibull distribution function for estimating the observed volume using the best parameters estimation method, the volume calculated by the Weibull function can be plotted versus the calculated volume via the measured data. If these plotted point pairs follow a roughly linear path in a graph, then the implication is that they are following the Weibull distribution [31]. As can be seen in Figure 3, the plotted point pairs followed a nearly linear path on the chart. Thus, the fit to the Weibull distribution was verified.
The preparation of the data analysis for a specific region is defined as the process of estimating the performance of that region based on the values measured and obtained previously. In this study, statistical analysis was conducted to model the frequency and probability of the results obtained from the feller-buncher cutting time and volume data. The average volume and the potential tree volume to be cut per unit time (m3/s) were analyzed using the Weibull distribution. The Weibull parameters of c and b were calculated by using the functions obtained by the graphical method [24], and the value of c was found to be 1.96, while b was 0.58.The probability density functions based on the tree volume to be cut per unit time and the obtained volume data are drawn in Figure 4. It was found that the productivity model indicated similarities with the model proposed in the previous studies [3]. The change of the density function of the standard two-parameter Weibull distribution for different values of the scale and shape parameters is given in Figure 5.
The Y axis (Frequency Density of X) is expressed as the percentage of distribution represented by the X value, where the frequency of the volume data disappears from 0 as the Weibull distribution’s shape parameter increases. Thus, it turns out that the shape parameter gives preliminary information about the distribution of the volume frequency. Stout et al. [25] used six Victorian rivers to test the fit of the Weibull distribution, showing that the Weibull is a useful and flexible distribution that provides common reporting metrics useful for future studies. In this study, the scale parameter of the distribution reflects the arithmetic mean of the volume, while the shape parameter is closely related to the productivity of the feller-buncher.
4. Conclusions
Although there are various distribution functions that can be used in determining the distribution of machine processing time and harvested volume, the performance of the Weibull distribution method evaluated in this study provided promising results. The outcomes indicated that the volume (frequency) distribution observed in parallel with the findings obtained in this study can be represented by a two-parameter probability density function. The theoretical (estimated) volume distributions obtained by the Weibull probability density function formed the model. This study indicated that it is possible to predict how much timber volume will be cut with a feller-buncher in a specified harvesting unit by using the Weibull distribution. It is possible to adapt the methodology presented in this study to the data sets of different harvesting machines. In a future study, this method can be improved by integrating the environmental constraints (i.e., soil disturbance and stand damage) into the model, which can help the practitioner to plan reduced impact logging systems.
Funding
This research received no external funding.
Institutional Review Board Statement
Not applicable.
Informed Consent Statement
Not applicable.
Data Availability Statement
Not applicable.
Conflicts of Interest
The author declares no conflict of interest.
References
- Akay, A.E.; Sessions, J. Identifying the Factors Influencing the Cost of Mechanized Harvesting Equipment. KSU J. Sci. Eng. 2004, 7, 65–72. [Google Scholar]
- Hiesl, P.; Benjamin, J. Applicability of international harvesting equipment productivity studies in Maine, USA: A literature review. Forests 2013, 4, 898–921. [Google Scholar] [CrossRef] [Green Version]
- Wang, J.; Long, C.; Mcneel, J. Production and cost analysis of a feller-buncher and grapple skidder in central Appalachian hardwood forests. For. Prod. J. 2004, 54, 159–167. [Google Scholar]
- Spinelli, R.; Hartsough, B.R.; Magagnoti, N. Productivity standards for harvesters and processors in Italy. For. Prod. J. 2010, 60, 226–235. [Google Scholar] [CrossRef]
- Hiesl, P. Productivity Standards for Whole-Tree and Cut-To-Length Harvesting Systems in Maine. Master’s Thesis, The University of Main, Orono, ME, USA, 2013; 150p. [Google Scholar]
- Akay, A.E.; Özkan, D.; Bilici, E. Assessing Productivity and Work Safety of a Mechanized Logging Operation. In Proceedings of the International Forestry Symposium (IFS 2016), Kastamonu, Turkey, 7–11 December 2016. [Google Scholar]
- Bilici, E.; Akay, A.E.; Abbas, D. Assessing the effects of Site Factors on the Productivity of a Feller Buncher: A Time and Motion Analysis. J. For. Res. 2019, 30, 1471–1478. [Google Scholar] [CrossRef]
- Visser, R.; Spinelli, R. Determining the shape of the productivity function for mechanized felling and felling-processing. J. For. Res. 2012, 17, 397–402. [Google Scholar] [CrossRef]
- Enez, K.; Aricak, B. Evaluation of technical and working conditions of tree harvesting machine. KSU J. Eng. Sci. 2012, 108–114. [Google Scholar]
- Klepac, J. Performance of a Tracked Feller-Buncher with a Shear Head Operating in Small-Diameter Pine. In Proceedings of the 2013 Council on Forest Engineering Annual Meeting, Missoula, MT, USA, 7–10 July 2013. [Google Scholar]
- Schweier, J.; Spinelli, R.; Magagnotti, N.; Becker, G. Mechanized coppice harvesting with new small scale feller bunchers: Results from harvesting trials with newly manufactured felling heads in Italy. Biomass Bioenergy 2015, 72, 85–94. [Google Scholar] [CrossRef]
- Bilici, E.; Akay, A.E.; Abbas, D. An evaluation of a fully mechanized forest harvesting operation in Bursa, Turkey. In Proceedings of the ISFOR—International Symposium on New Horizons in Forestry, Isparta, Turkey, 18–20 October 2017; pp. 220–224. [Google Scholar]
- Joseph, P.; Hennessey, J.P., Jr. Some aspects of wind power statistics. J. Appl. Meteorol. 1977, 16, 119–128. [Google Scholar]
- Kahriman, A.; Yavuz, H. The Probability Density Functions to Diameter Distributions for Scots Pine Oriental Beech and Mixed Stands. Artvin Çoruh Univ. Fac. For. J. 2011, 12, 109–125. [Google Scholar]
- Bolat, F.; Ercanli, İ. Modeling Diameter Distributions by Using Weibull Function in Forests Located Kestel-Bursa. Kast. Univ. J. For. Fac. 2017, 17, 107–115. [Google Scholar]
- Harish Kumar, N.S.; Choudhary, R.P.; Murthy, C.S.N. Reliability analysis of dumper in lime stone mine based on Weibull distribution. In Proceedings of the 91st the IRES International Conference, Chicago, IL, USA, 3–5 August 2017. [Google Scholar]
- Bala, R.J.; Govinda, R.M.; Murthy, C.S.N. Reliability analysis and failure rate evaluation of load haul dump machines using Weibull distribution analysis. Math. Model. Eng. Probl. 2018, 5, 116–122. [Google Scholar] [CrossRef]
- Napiórkowskia, J.; Gonerab, J. Analysis of failures and reliability model of farm tractors. Agric. Eng. 2020, 24, 89–101. [Google Scholar]
- Hawkins, K.; Hotvedt, J.; Cao, Q.; Jackson, B. Using the Weibull distribution to model harvesting machine productivity. For. Prod. J. 1988, 38, 59–65. [Google Scholar]
- Zeytinoğlu, F.Ç. Comparison of statistical estimation methods for the scale and shape parameters of the Weibull distribution. Istanb. Commer. Univ. J. Soc. Sci. 2009, 8, 73–78. [Google Scholar]
- Carta, J.A.; Ramirez, P.; Velazquez, S. A review of wind speed probability distributions used in wind energy analysis: Case studies in the Canary Islands. Renewable and Sustainable. Energy Rev. 2009, 13, 933–955. [Google Scholar]
- Chellali, F.; Khellaf, A.; Belouchrani, A.; Khanniche, R. A comparison between wind speed distributions derived from the maximum entropy principle and Weibull distribution. Case of study; six regions of Algeria. Renew. Sustain. Energy Rev. 2012, 16, 379–385. [Google Scholar] [CrossRef]
- Wang, J.; Hu, J.; Ma, K. Wind speed probability distribution estimation and wind energy assessment. Renew. Sustain. Energy Rev. 2016, 60, 881–899. [Google Scholar] [CrossRef]
- Weibull, W. A statistical distribution function of wide applicability. J. Appl. Mech. 1951, 18, 293–297. [Google Scholar]
- Stout, J.C.; Rutherfurd, I.; Grove, J.; Webb, J.A.; Kitchingman, A.; Tonkin, Z. Using the Weibull distribution to improve the description of riverine wood loads. Earth Surf. Process. Landf. 2016, 42, 647–656. [Google Scholar] [CrossRef]
- Zhang, T.; Xie, M. Failure data analysis with extended Weibull distribution. Commun. Stat. Simul. Comput. 2007, 36, 579–592. [Google Scholar] [CrossRef]
- Genc, A.; Erisoglu, M.; Pekgor, A.; Oturanc, K.; Hepbasli, A.; Ulgen, K. Estimation of wind power potential using Weibull distribution. Energy Sources 2005, 27, 809–822. [Google Scholar] [CrossRef]
- Dong, Y.; Wang, J.; Jiang, H.; Shi, X. Intelligent optimized wind resource assessment and wind turbines selection in Huitengxile of Inner Mongolia, China. Appl. Energy 2013, 109, 239–253. [Google Scholar] [CrossRef]
- Wu, J.; Wang, J.; Chi, D. Wind energy potential assessment for the site of Inner Mongolia in China. Renew. Sustain. Energy Rev. 2013, 21, 215–228. [Google Scholar] [CrossRef]
- Chang, T.P. Performance comparison of six numerical methods in estimating Weibull parameters for wind energy application. Appl. Energy 2011, 88, 272–282. [Google Scholar] [CrossRef]
- Alam, M.; Acuna, M.; Brown, M. Self-Levelling Feller-Buncher Productivity Based on Lidar-Derived Slope. Croat. J. For. Eng. 2013, 34, 273–281. [Google Scholar]
- Mohammadi, K.; Alavi, O.; Mostafaeipour, A.; Goudarzi, N.; Jalilvand, M. Assessing different parameters estimation methods of Weibull distribution to compute wind power density. Energy Convers. Manag. 2016, 108, 322–335. [Google Scholar] [CrossRef]
Figure 1.
Study area.

Figure 2.
Westtech Woodcraker C450 model feller-buncher with cutting head.
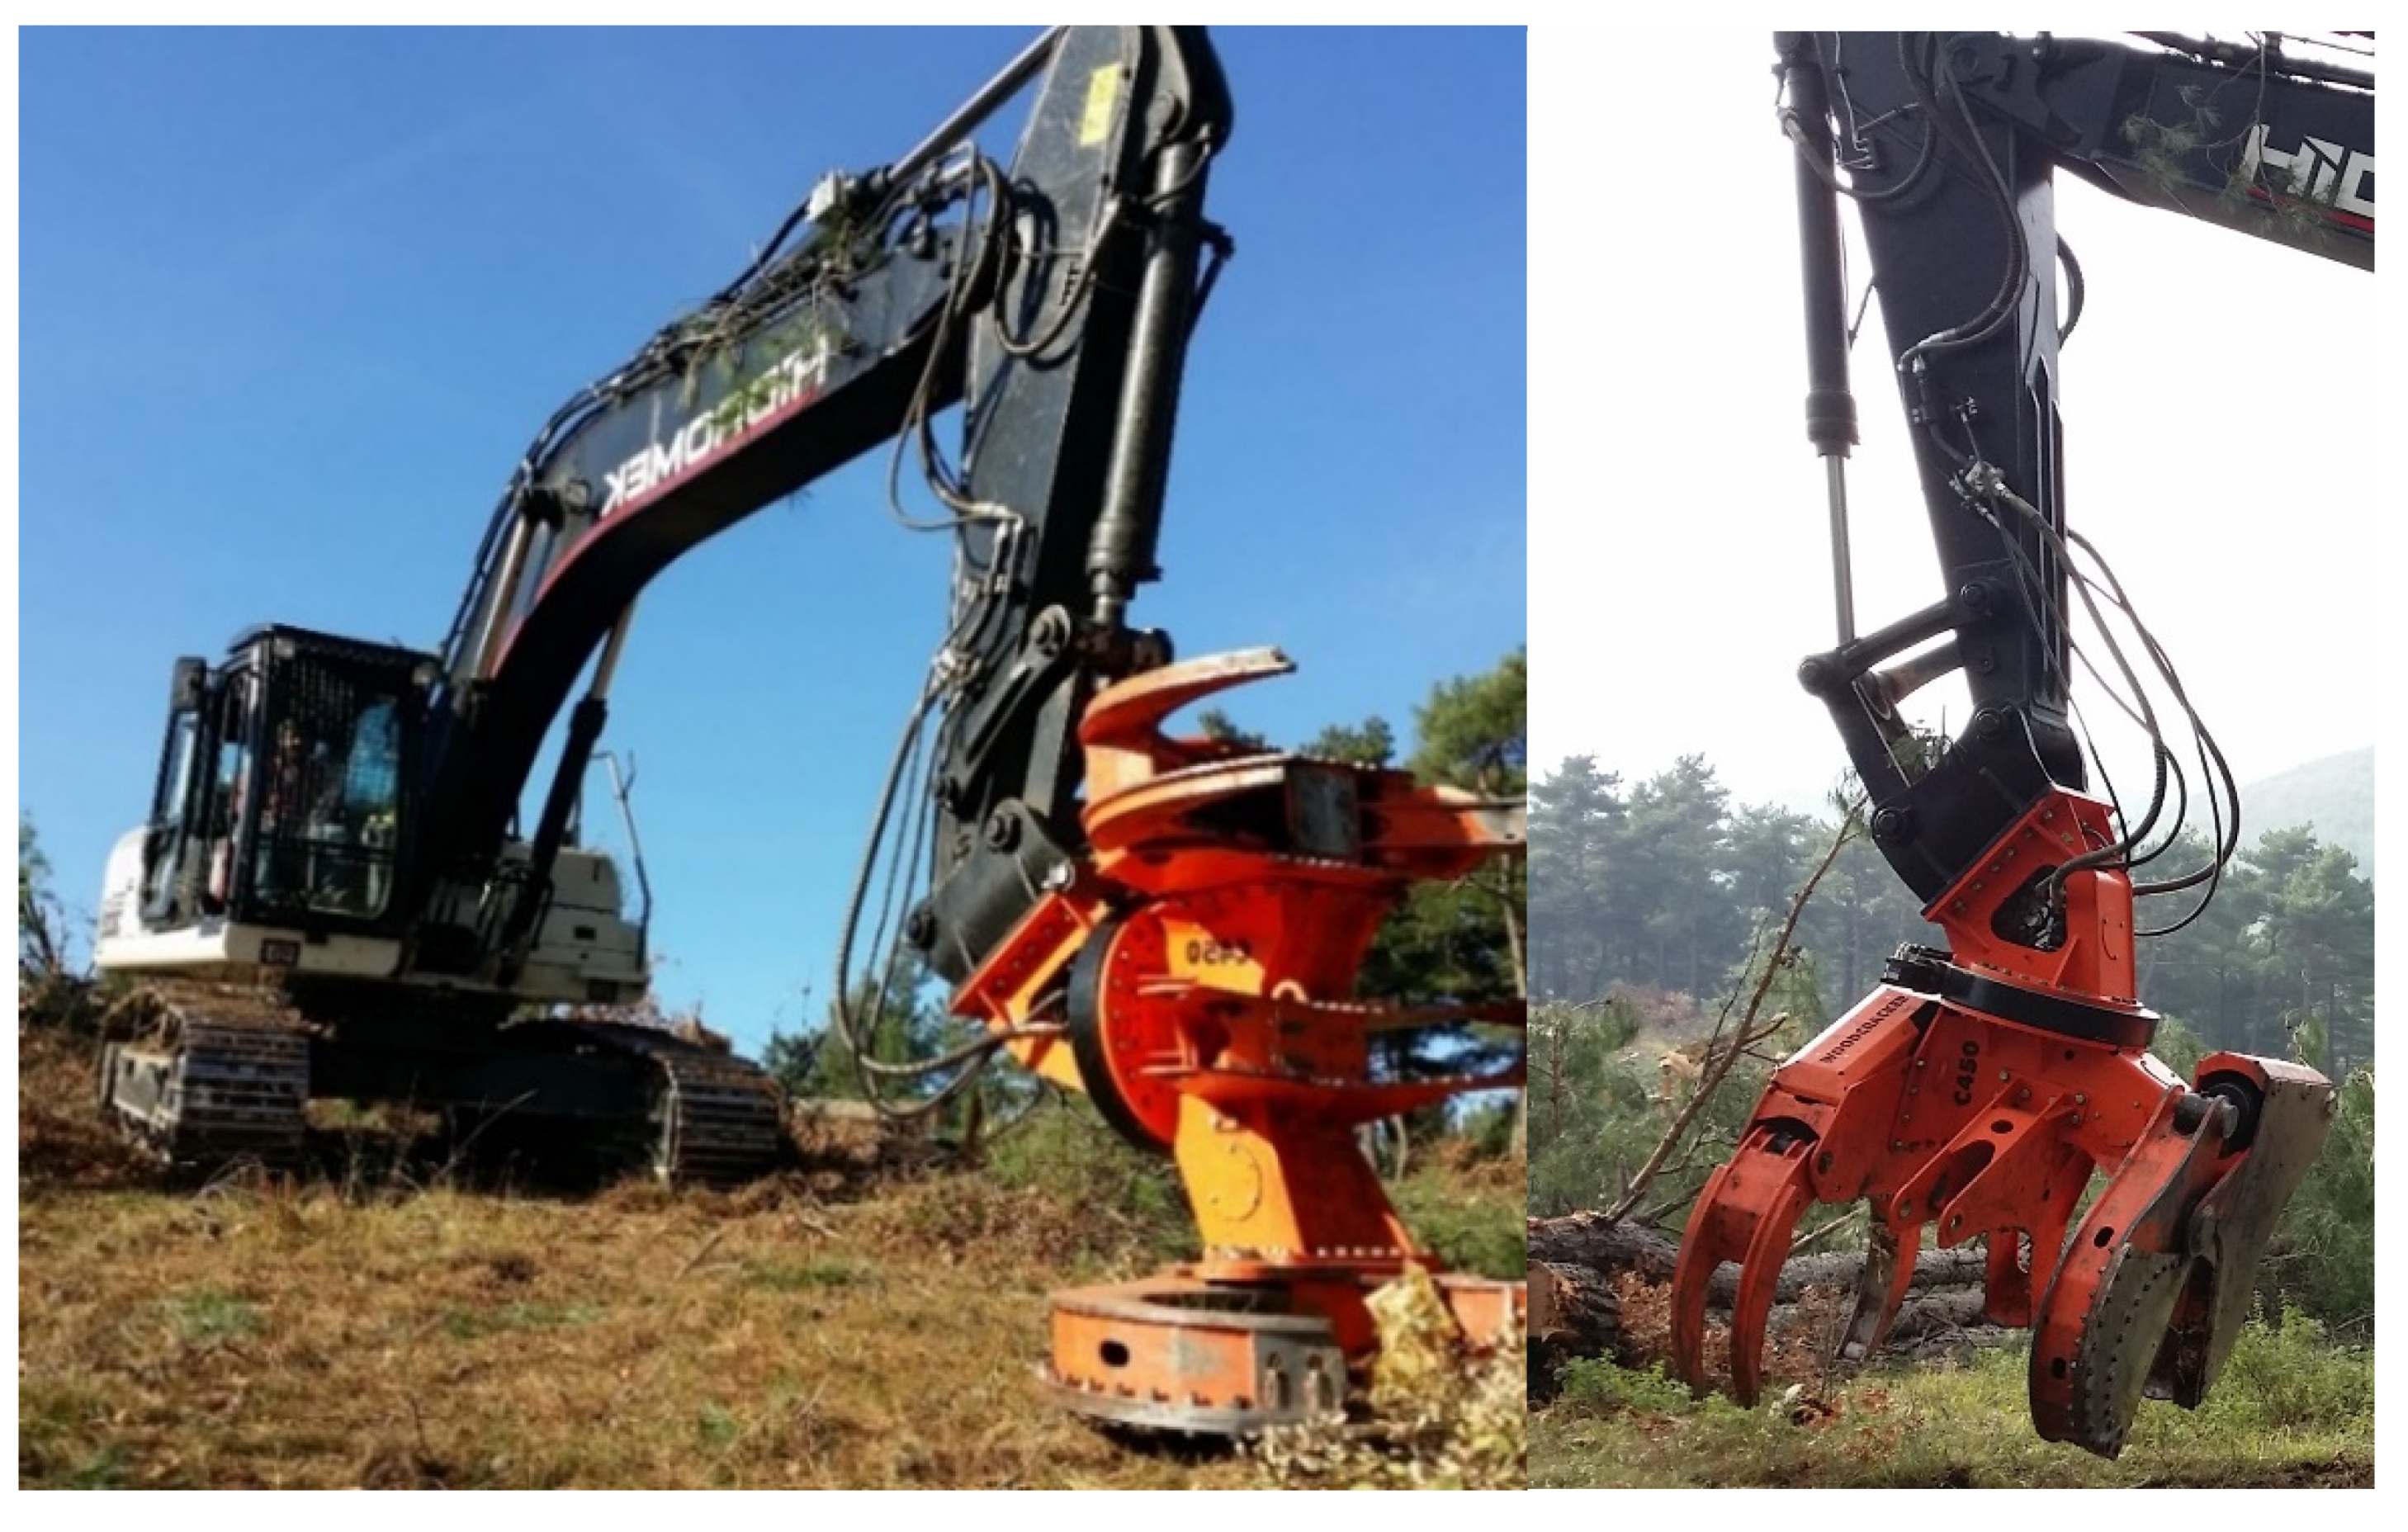
Figure 3.
Observed vs. expected volume data.

Figure 4.
Weibull distribution based on obtained volume data.
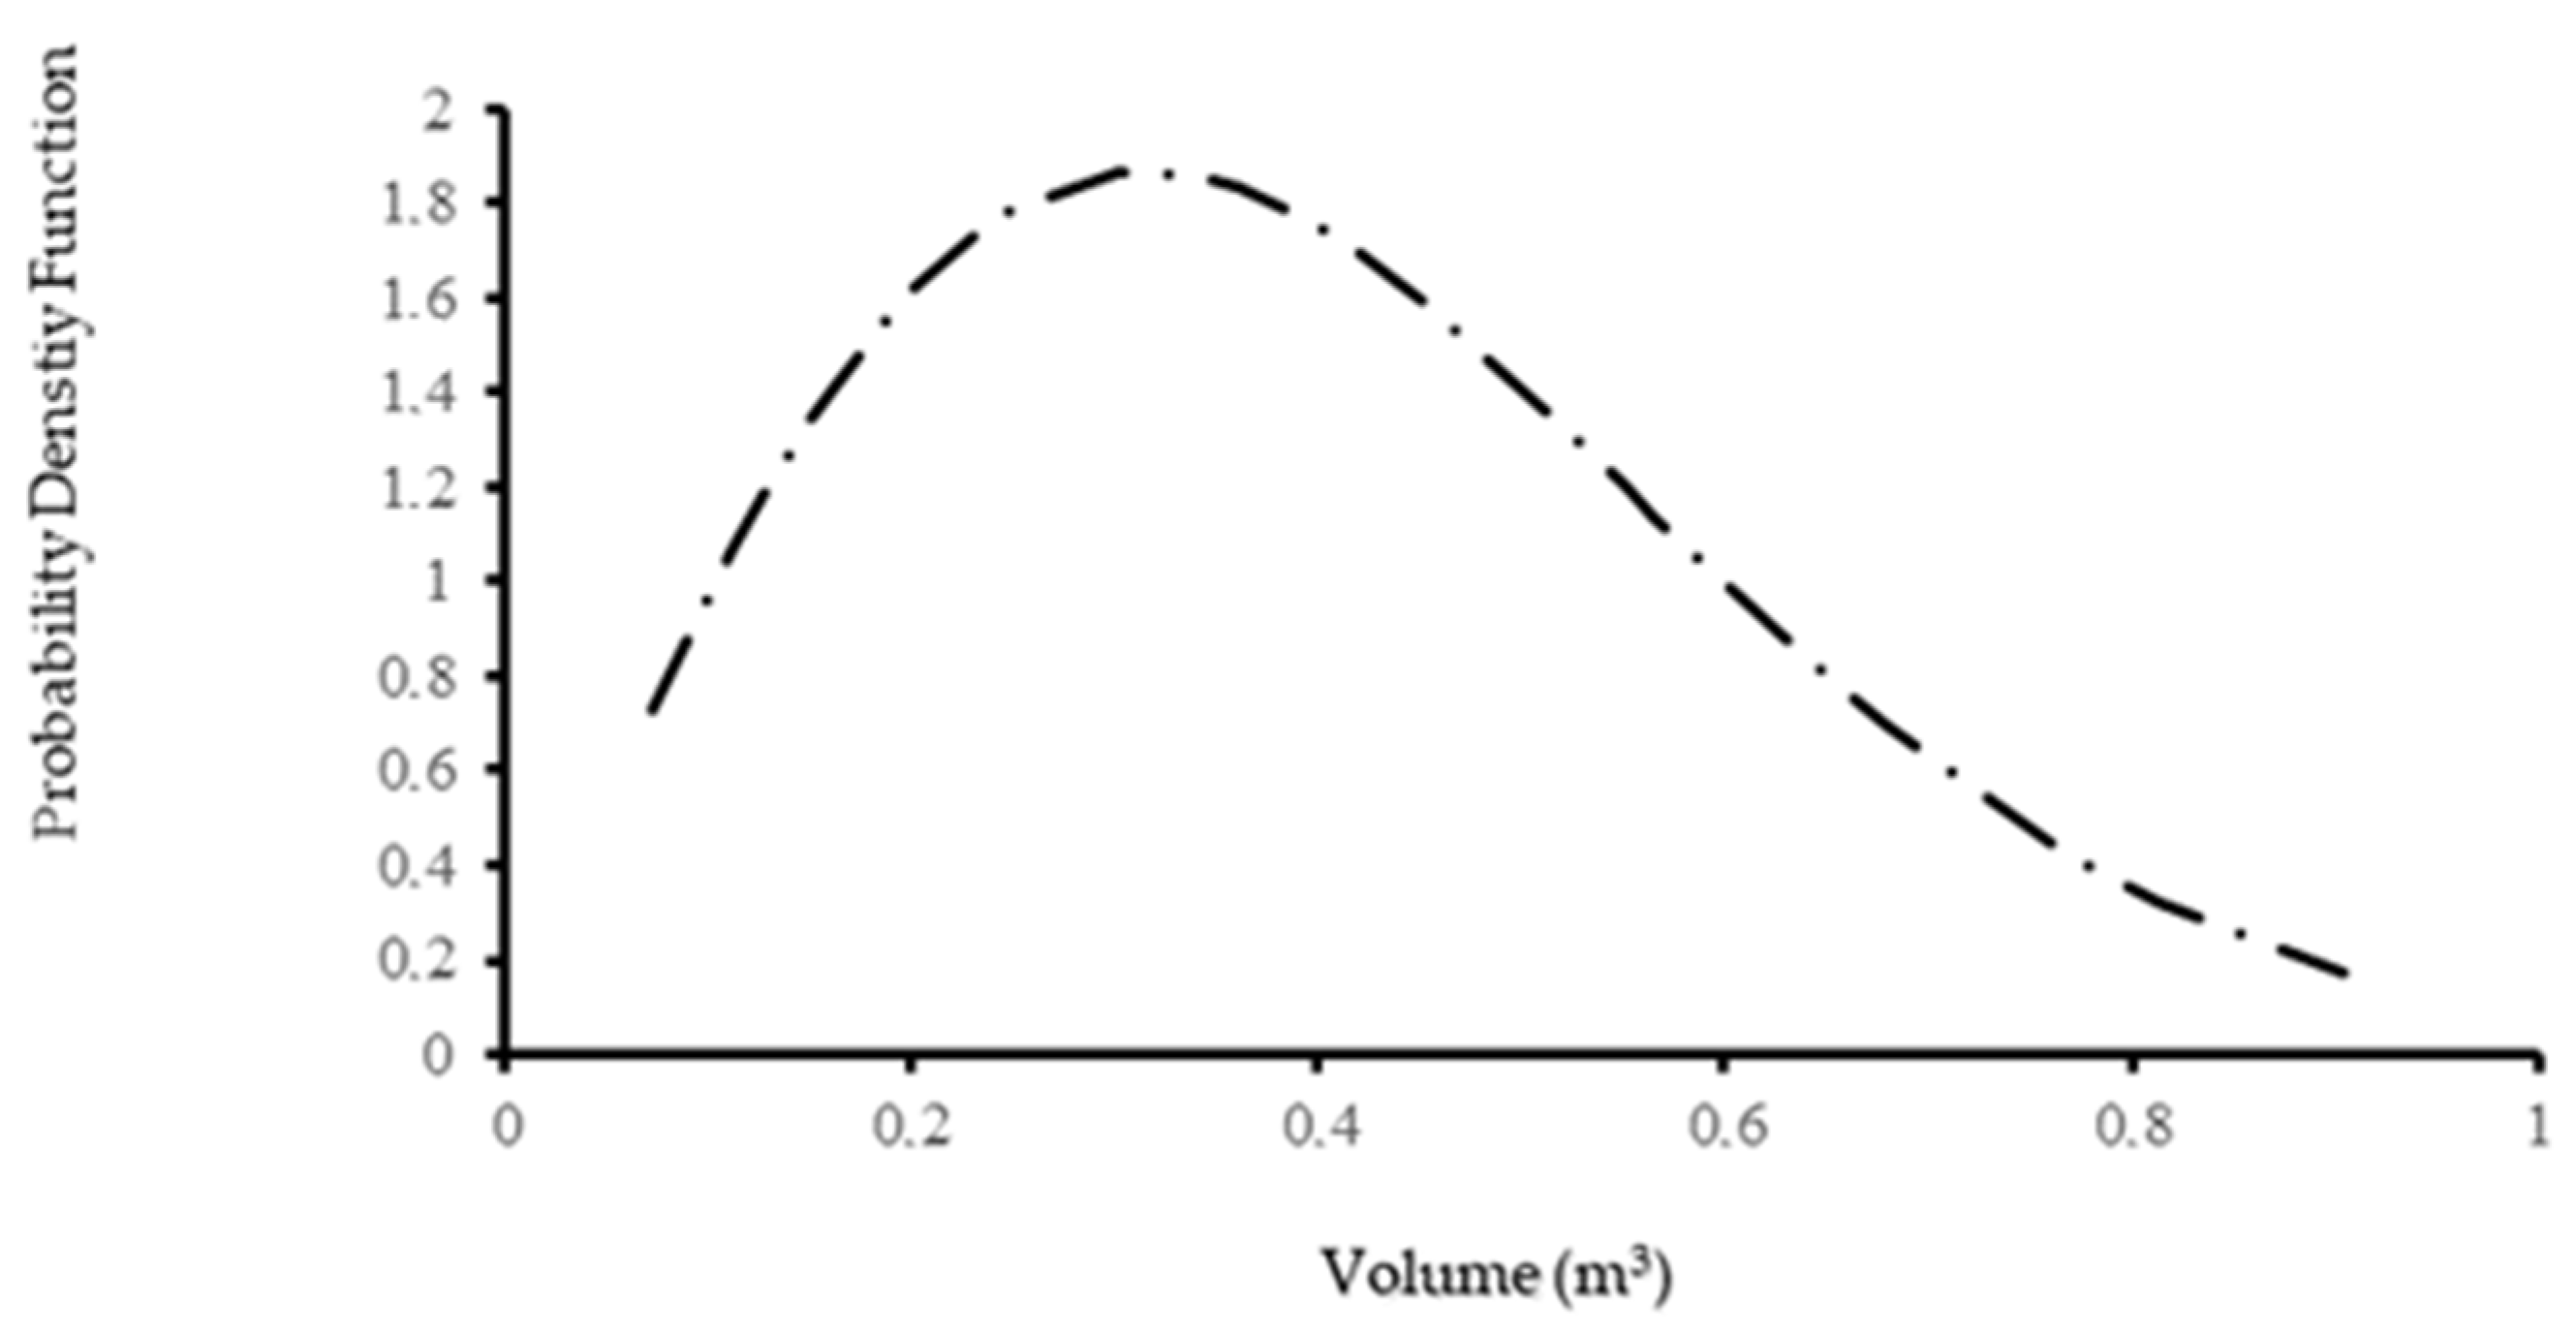
Figure 5.
Illustrating the effect of a changing shape parameter (c) on the overall shape of the distribution.
Figure 5.
Illustrating the effect of a changing shape parameter (c) on the overall shape of the distribution.


Table 1.
Components of the harvesting process using a feller-buncher.
| Components | Description |
|---|---|
| Moving | Vehicle begins to move and chooses the tree |
| Felling | Positioning of the cutting head around the standing tree and felling with the chainsaw starts |
| Stacking | Stacking the logs |
| Other activities | The time spent on other activities (e.g., removing of obstacles, etc.). |
| Delays | Non-productive time including mechanical, operational, and personal delays |
Table 2.
Summary of time variables.
| Min | Max | Std | Median | |
|---|---|---|---|---|
| Length (m) | 10.00 | 20.00 | 2.94 | 15.00 |
| Diameter (cm) | 9.60 | 24.00 | 4.51 | 17.60 |
| Volume (m3) | 0.07 | 0.90 | 0.22 | 0.34 |
| Total time (s) | 12.30 | 39.30 | 6.36 | 23.30 |
Publisher’s Note: MDPI stays neutral with regard to jurisdictional claims in published maps and institutional affiliations. |
© 2021 by the author. Licensee MDPI, Basel, Switzerland. This article is an open access article distributed under the terms and conditions of the Creative Commons Attribution (CC BY) license (http://creativecommons.org/licenses/by/4.0/).
Share and Cite
MDPI and ACS Style
Bilici, E. Investigation of Feller-Buncher Performance Using Weibull Distribution. Forests 2021, 12, 284. https://doi.org/10.3390/f12030284
AMA Style
Bilici E. Investigation of Feller-Buncher Performance Using Weibull Distribution. Forests. 2021; 12(3):284. https://doi.org/10.3390/f12030284
Chicago/Turabian StyleBilici, Ebru. 2021. "Investigation of Feller-Buncher Performance Using Weibull Distribution" Forests 12, no. 3: 284. https://doi.org/10.3390/f12030284
Note that from the first issue of 2016, this journal uses article numbers instead of page numbers. See further details here.